dearshareholders - revlon
TRANSCRIPT

Dear Shareholders:
2000 was a year of transition at Revlon. We made fundamental changes in everyelement of our business with the end consumer in mind. In short, we began buildinga New Revlon.
Revlon’s redirection began with three guiding principals:1. Bring more innovation to everything we do, particularly in delivering exciting
new products to market quickly.2. Build a stronger financial base by focusing on cash flow, operating at
competitive margins and balancing market share and profitability.3. Improve communication with our consumers through better advertising,
packaging and point of sale presentation.
Guided by these principles our new leadership team focused the best people inthe Company on building a turnaround plan from the ground up. We challengedeverything. We determined what made sense and what did not. The result was acomprehensive strategic plan that we are now implementing. The six key initiatives ofthis plan are:
• New Product Launches
Innovation has been re-ignited and we have produced the most robustline-up of new products since ColorStay Lipstick in the mid 1990’s. During2000, we began the development of four major new product platforms. Ourfirst, Revlon Skinlights began shipping in December. Skinlights is an entirelynew category of skin brighteners; and the initial response by our consumersand our trade partners has been very positive. The other three major newlines include: Absolutely Fabulous Lipcream, a new premium line of emollientrich lip color; Almay Kinetin Skincare Advanced Anti-Aging Series featuringKinetin, a plant growth factor found in green leafy plants; and Revlon HighDimension Haircolor, a revolutionary 10-minute home haircolor.
• New Trade Terms in the United States
We redefined our partnership with the retail trade in order to focus onincreased consumption and eliminating inefficiencies in the supply chain.The terms align Revlon and trade partner priorities and create incentivesbeneficial to both of us. We believe that the successful implementation ofthis ‘‘go to market strategy’’ will yield significant cost savings to Revlon andincrease our ability to support new growth initiatives.
• SG&A Expense ReductionsWe reduced the overhead component of Selling, General and Administrativeexpenses by $66 million or 16% during 2000. This reflects significant newefficiencies in priority setting and process simplification throughout Revlon.Fewer people are working extremely hard on the things that will make Revlona healthier company. We intend to continue to reduce SG&A and invest thesavings back into our business.
• Manufacturing Capacity
In November 2000, we announced the planned consolidation of our NorthAmerica cosmetics manufacturing to our Oxford, North Carolina facility andplanned shutdown of facilities in Phoenix, Arizona; Auckland, New Zealand;and Mississuaga, Ontario, Canada. This consolidation will more effectivelyutilize our production capacity and will result in expected annualized savingsof $25 million to $30 million. We continue to explore the most efficient waysto manufacture, utilizing both in-house and outside resources.

• New AdvertisingOur advertising needed new energy and a new way to connect emotionallywith our target consumers. During 2000, we began the process of selectingnew advertising partners and we now have two of the most dynamic andsuccessful agencies working with us: kirshenbaum bond & partners forRevlon and Deutsch Inc. for Almay.
• Aligning Employee and Shareholder InterestsWe have taken a more focused approach to aligning employee and share-holder interests. This requires a better balance between market share, topline growth and profitability. We are implementing programs that will deliverrewards to employees who significantly drive results and enhance share-holder value.
• The Year AheadSuccessful execution of our strategic plan calls for a high degree of focusand alignment behind specific priorities throughout the entire organization. Ibelieve that Revlon is doing just that. Having laid a solid foundation for ourturnaround in 2000, we now must focus our attention on continued execu-tion and implementation of our initiatives.
We expect that 2001 will be an important year as our turnaround continuesto gain traction. Overall, we expect a continuous flow of innovative newproducts, fresh and aggressive advertising and marketing campaigns, con-tinued reductions in SG&A, increased efficiencies in manufacturing, improve-ments in financial results and mutually profitable relationships with our tradepartners. We believe that our performance in 2001 will lead to enhancedshareholder value and will demonstrate the soundness of our turnaroundstrategy and the underlying strengths of Revlon.
We are committed to the continued development of Revlon and look forwardto a strong 2001 and beyond.
Jeffrey M. NugentPRESIDENT AND CHIEF EXECUTIVE OFFICER

SECURITIES AND EXCHANGE COMMISSION
Washington, D.C. 20549
FORM 10-K
FOR ANNUAL AND TRANSITION REPORTS PURSUANT TO SECTIONS 13 OR 15(d) OF THE SECURITIES EXCHANGE ACT OF 1934
(Mark One)
X ANNUAL REPORT PURSUANT TO SECTION 13 OR 15(d) OF THE SECURITIES EXCHANGE ACT OF 1934
For the fiscal year ended December 31, 2000
OR
TRANSITION REPORT PURSUANT TO SECTION 13 OR 15(d) OF THE SECURITIES EXCHANGE
ACT OF 1934
For the transition period from __________________ to __________________
Commission file number 1-11178
REVLON, INC.
(Exact name of registrant as specified in its charter)
DELAWARE 13-3662955
(State or other jurisdiction of incorporation or organization)
(I.R.S. Employer Identification No.)
625 Madison Avenue, New York, New York 10022
(Address of principal executive offices) (Zip Code)
Registrant’s telephone number, including area code: (212) 527-4000
Securities registered pursuant to Section 12(b) or 12(g) of the Act:
Name of each exchange Title of each class on which registered
Class A Common Stock New York Stock Exchange
Indicate by check mark whether the registrant: (1) has filed all reports required to be filed by Section 13 or 15(d) of the Securities Exchange Act of 1934 during the preceding 12 months (or for such shorter period that the registrant was required to file such reports), and (2) has been subject to such filing requirements for the past 90 days. Yes X No Indicate by check mark if disclosure of delinquent filers pursuant to Item 405 of Regulation S-K is not contained herein, and will not be contained, to the best of registrant’s knowledge, in definitive proxy or information statements incorporated by reference in Part III of this Form 10-K or any amendment to this Form 10-K. [X] As of March 8, 2001, 20,115,935 shares of Class A Common Stock and 31,250,000 shares of Class B Common Stock were outstanding. 11,250,000 shares of Class A Common Stock and all of the shares of Class B Common Stock were held by REV Holdings Inc., an indirectly wholly-owned subsidiary of Mafco Holdings Inc. The aggregate market value of the registrant’s Class A Common Stock held by non-affiliates (using the New York Stock Exchange closing price as of March 8, 2001) was approximately $50,092,533.

2
Part I Item 1. Description of Business Background Revlon, Inc. (and together with its subsidiaries, the “Company”) conducts its business exclusively through its direct subsidiary, Revlon Consumer Products Corporation and its subsidiaries (“Products Corporation”). The Company manufactures, markets and sells an extensive array of cosmetics and skin care, fragrances and personal care products. Revlon is one of the world's best known names in cosmetics and is a leading mass market cosmetics brand. The Company believes that its global brand name recognition, product quality and marketing experience have enabled it to create one of the strongest consumer brand franchises in the world, with products sold worldwide. The Company's products are marketed under such well-known brand names as Revlon, ColorStay, Revlon Age Defying, Almay and Ultima in cosmetics; Moon Drops, Eterna 27, Ultima and Jeanne Gatineau in skin care; Charlie and Fire & Ice in fragrances; and Flex, Outrageous, Mitchum, ColorStay, Colorsilk, Jean Naté, Bozzano and Colorama in personal care products. To further strengthen its consumer brand franchises, the Company markets each core brand with a distinct and uniform global image, including packaging and advertising, while retaining the flexibility to tailor products to local and regional preferences. The Company was founded by Charles Revson, who revolutionized the cosmetics industry by introducing nail enamels matched to lipsticks in fashion colors over 65 years ago. Today, the Company has leading market positions in many of its principal product categories in the United States self-select distribution channel. The Company's leading market positions for its Revlon brand products include the number one positions in lip makeup and nail enamel (which the Company has occupied for the past 24 years). The Company also has leading market positions in several product categories in certain markets outside of the United States, including in Australia, Brazil, Canada, Mexico and South Africa. All United States market share and market position data herein for the Company’s brands are based upon retail dollar sales, which are derived from ACNielsen data. ACNielsen measures retail sales volume of products sold in the United States self-select distribution channel. Such data represent ACNielsen’s estimates based upon data gathered by ACNielsen from market samples and are therefore subject to some degree of variance. Recent Developments
During the fourth quarter of 2000, the Company shutdown its manufacturing operations in Mississauga, Canada and began closing its facility in Phoenix, Arizona, which is expected to be substantially completed by June 2001. The Company will shift production from these facilities to its Oxford, North Carolina facility. The Company also announced the shutdown of its facility in New Zealand in the fourth quarter of 2000, and consolidated such operations into the Company’s facility in Australia. The Company estimates that the costs of closing these facilities and relocating manufacturing will result in charges of $55 million to $60 million. These costs principally include compensation and related costs, relocation costs and write-downs of assets. Net cash expenditures (after the proceeds from the sale of assets) are estimated to be $30 million to $35 million. The Company expects that these planned actions, when fully implemented, will result in annual savings of $25 million to $30 million.
In October 2000, the Company announced changes in the way it goes to market with its U.S. retail partners
designed to increase consumption of the Company's products and drive market growth. The new terms of trade became effective January 1, 2001, with a transition during the fourth quarter of 2000. They include increased in-store coverage, incentives for retailers intended to encourage more efficient ordering and shipping and to lower merchandise return rates and rewards for increased consumer sell-through.
In January 2001 (effective December 31, 2000), Products Corporation and its bank lenders entered into an
amendment to the Credit Agreement (as hereinafter defined), to (i) eliminate the interest coverage ratio and leverage ratio covenants for 2001; (ii) add a minimum cumulative EBITDA covenant for each quarter end during the year 2001; (iii) modify the definition of EBITDA beginning with the quarterly period ended December 31, 2000; (iv) limit the amount that Products Corporation may spend for capital expenditures; (v) permit the sale of certain of Products Corporation's non-core assets; (vi) permit Products Corporation to retain 100% of the Net Proceeds (as

3
defined in the Credit Agreement) from such asset sales; (vii) increase the "applicable margin" by 1/2 of 1%; and (viii) require Products Corporation to provide a mortgage on its facility in Oxford, North Carolina as security for its obligations under the Credit Agreement.
Products The Company manufactures and markets a variety of products worldwide. The following table sets forth the Company’s principal brands. BRAND COSMETICS SKIN CARE FRAGRANCES PERSONAL
CARE
PRODUCTS
Revlon Revlon, ColorStay, Revlon Age Defying, Super Lustrous, Revlon MoistureStay, Moon Drops, Line & Shine, New Complexion, Top Speed, Revlon Wet/Dry, EveryLash, Timeliner
Moon Drops, Revlon Results, Eterna 27
Charlie, Charlie Red, Charlie White, Ciara, Fire & Ice
Flex, Outrageous, Aquamarine, Mitchum, Lady Mitchum, Hi & Dri, ColorStay, Colorsilk, Frost & Glow, Jean Naté, Revlon Implements
Almay Almay, Time-Off, Amazing, One Coat, Stay Smooth, Skin Stays Clean, Moisture Balance
Time-Off, Moisture Balance, Moisture Renew, Stay Clean
Almay
Ultima Ultima, Beautiful Nutrient, Wonderwear, The Nakeds, Full Moisture
Glowtion, Vital Radiance, CHR
Significant Regional Brands
Colorama, Juvena, Jeanne Gatineau, Cutex, StreetWear
Jeanne Gatineau
Charlie Gold Bozzano, Colorama, ZP11
Cosmetics and Skin Care. The Company sells a broad range of cosmetics and skin care products designed to fulfill specifically identified consumer needs, principally priced in the upper range of the self-select distribution channel, including lip makeup, nail color and nail care products, eye and face makeup and skin care products such as lotions, cleansers, creams, toners and moisturizers. Many of the Company's products incorporate patented, patent-pending or proprietary technology. The Company markets several different lines of Revlon lip makeup (which includes lipstick, lip gloss and liner). The Company's ColorStay lipcolor, which uses patented transfer-resistant technology that provides long wear, is produced in approximately 50 shades. ColorStay Liquid Lip and ColorStay Lip Shine, a patented lip technology introduced in 1999, is produced in approximately 40 shades and builds on the strengths of the ColorStay foundation by offering long-wearing benefits in a new product form, which enhances comfort and shine. Super Lustrous lipstick is produced in approximately 70 shades. Moon Drops, a moisturizing lipstick, is produced in approximately 50 shades. Line & Shine utilizes an innovative product form, combining lipliner and lip gloss in one package, and is produced in

4
approximately 20 shades. Revlon MoistureStay uses patented technology to moisturize the lips even after the color wears off, and is produced in approximately 40 shades. The Company's nail color and nail care lines include enamels, cuticle preparations and enamel removers. The Company's flagship Revlon nail enamel is produced in approximately 64 shades and uses a patented formula that provides consumers with improved wear, application, shine and gloss in a toluene-free and formaldehyde-free formula. Top Speed nail enamel is produced in approximately 48 shades and contains a patented speed drying polymer formula, which sets in 60 seconds. Revlon has the number one position in nail enamel in the United States self-select distribution channel. The Company also sells Cutex nail polish remover and nail care products in certain countries outside the United States. The Company sells face makeup, including foundation, powder, blush and concealers, under such Revlon brand names as Revlon Age Defying, which is targeted for women in the over 35 age bracket; ColorStay, which uses patented transfer-resistant technology that provides long wear and won’t rub off benefits; and New Complexion, for consumers in the 18 to 34 age bracket. The Company's eye makeup products include mascaras, eyeliners, eye shadows and brow color. ColorStay eyecolor, mascara and brow color, Everylash mascara, Softstroke eyeliners and Revlon Wet/Dry eye shadows are targeted for women in the 18 to 49 age bracket. The Company's Almay brand consists of a complete line of hypo-allergenic, dermatologist-tested, fragrance-free cosmetics and skin care products targeted for consumers who want "a good, healthy for you, hypo-allergenic product." Almay products include lip makeup, nail color, eye and face makeup and skin care products. In 1999, Almay expanded its flagship One Coat franchise to include One Coat Mascara Color & Curl; other One Coat products include One Coat Lipcolor, One Coat Nail Color, One Coat Gel Eye Pencil and One Coat Lip Shine. The Company also introduced Skin Stays Clean liquid and compact foundation makeup with its patented “clean pore complex.” Almay expanded its Stay Smooth franchise beyond its Anti-Chap Lipcolor to Almay Stay Smooth Mascara, a defining mascara with a built in comb. The Almay Amazing Collection features long-wearing mascaras, foundations and lipcolor. The Company's StreetWear brand consists of a quality, value-priced line of nail enamels, mascaras, lip and eye liners, lip glosses and body accessories that are targeted for the young, beauty savvy consumer. The Company's premium-priced cosmetics and skin care products are sold under the Ultima brand name, which is the Company's flagship premium-priced brand sold throughout the world. Ultima's products include lip makeup, eye and face makeup and skin care products including Glowtion, a line of skin brighteners that combines skin care and color; Full Moisture Foundation and lipcolor, Vital Radiance and CHR skin care products; the Beautiful Nutrient collection, a complete line of nourishing makeup that provides advanced nutrient protection against dryness; The Nakeds makeup, a trend-setting line of makeup emphasizing neutral colors; and Wonderwear. The Wonderwear collection includes a long-wearing foundation that uses patented technology, cheek and eyecolor products that use proprietary technology that provides long wear, and Wonderwear lipstick, which uses patented transfer-resistant technology. The Company sells implements, which include nail and eye grooming tools such as clippers, scissors, files, tweezers and eye lash curlers. The Company's implements are sold individually and in sets under the Revlon brand name and are the number one brand in the United States self-select distribution channel. The Company also sells cosmetics in international markets under regional brand names including Colorama and Juvena in Brazil. The Company's skin care products, including moisturizers, are sold under brand names, including Eterna 27, Moon Drops, Revlon Age Defying, Almay Time-Off Revitalizer, Clear Complexion and Ultima Vital Radiance. In addition, the Company sells skin care products in international markets under internationally recognized brand names and under various regional brands, including the Company's premium-priced Jeanne Gatineau.

5
Personal Care Products. The Company sells a broad line of personal care consumer products, which complements its core cosmetics lines and enables the Company to meet the consumer's broader beauty care needs. In the self-select distribution channel, the Company sells haircare, antiperspirant and other personal care products, including the Flex, Outrageous and Aquamarine haircare lines throughout the world and the Colorama, Bozzano, and Juvena brands in Brazil; as well as ColorStay, Colorsilk, Revlon Shadings and Frost & Glow hair coloring lines throughout most of the world; and the Mitchum, Lady Mitchum and Hi & Dri antiperspirant brands throughout the world. The Company also markets hypo-allergenic personal care products, including sunscreens, moisturizers and antiperspirants, under the Almay brand. Fragrances. The Company sells a selection of moderately-priced and premium-priced fragrances, including perfumes, eau de toilettes and colognes. The Company's portfolio includes fragrances such as Charlie, Ciara and line extensions such as Charlie Red and Charlie White. In international markets, the Company distributes certain licensed brands, including Van Gils. Marketing The Company markets extensive consumer product lines at a range of retail prices primarily through the self-select distribution channel and markets select premium lines through demonstrator-assisted channels, principally outside the U.S. Each line is distinctively positioned and is marketed globally with consistently recognizable logos, packaging and advertising. The Company's existing product lines are carefully segmented, and new product lines are developed, to target specific consumer needs as measured by focus groups and other market research techniques.
The Company undertook a comprehensive review of its advertising strategy in late 2000 and early 2001 resulting in its selection of Kirshenbaum Bond & Partners and Deutsch Inc. to serve as its advertising agency for creative work for its Revlon and Almay brands, respectively, worldwide. This is a major shift in the Company's advertising strategy. The Company believes that this shift to leading outside agencies will increase the effectiveness and relevance of its worldwide advertising, as well as result in more efficient media placement. The Company uses print and television advertising and point-of-sale merchandising, including displays and samples. The Company's marketing emphasizes a uniform global image and product for its portfolio of core brands, including Revlon, ColorStay, Revlon Age Defying, Almay, Ultima, Flex, Charlie, and Mitchum. The Company coordinates advertising campaigns with in-store promotional and other marketing activities. The Company develops jointly with retailers carefully tailored advertising, point-of-purchase and other focused marketing programs. The Company uses network and spot television advertising, national cable advertising and print advertising in major general interest, women's fashion and women's service magazines, as well as coupons, magazine inserts and point-of-sale testers. The Company also uses cooperative advertising programs with some retailers, supported by Company-paid or Company-subsidized demonstrators, and coordinated in-store promotions and displays. The Company also has developed unique marketing materials such as the "Revlon Report," a glossy, color pamphlet distributed in magazines and on merchandising units worldwide, which highlights seasonal and other fashion and color trends, describes the Company's products that address those trends and contains coupons, rebate offers and other promotional material to encourage consumers to try the Company's products. Other marketing materials designed to introduce the Company's newest products to consumers and encourage trial and purchase include point-of-sale testers on the Company's display units that provide information about, and permit consumers to test, the Company's products, thereby achieving the benefits of an in-store demonstrator without the corresponding cost, magazine inserts containing samples of the Company's newest products, trial-size products and "shade samplers," which are collections of trial-size products in different shades. Additionally, the Company has its own website, www.revlon.com, which features current product and promotional information and which is updated regularly to stay current with the Company’s new product launches and other advertising and promotional campaigns. New Product Development and Research and Development The Company believes that it is an industry leader in the development of innovative and techno- logically-advanced consumer products. The Company's marketing and research and development groups identify consumer needs and shifts in consumer preferences in order to develop new products, tailor line extensions and promotions and redesign or reformulate existing products to satisfy such needs or preferences. The Company's

6
research and development group comprises departments specialized in the technologies critical to the Company's various product categories, as well as an advanced technology department that promotes inter-departmental, cross-functional research on a wide range of technologies to develop new and innovative products. The Company independently develops substantially all of its new products. The Company also has entered into joint research projects with major universities and commercial laboratories to develop advanced technologies. The Company believes that its Edison, New Jersey facility is one of the most extensive cosmetics research and development facilities in the United States. The scientists at the Edison facility are responsible for all of the Company's new product research worldwide, performing research for new products, ideas, concepts and packaging. The Company also has satellite research facilities in Brazil and France. The research and development group at the Edison facility also performs extensive safety and quality tests on the Company's products, including toxicology, microbiology and package testing. Additionally, quality control testing is performed at each manufacturing facility. As of December 31, 2000, the Company employed approximately 200 people in its research and development activities, including specialists in pharmacology, toxicology, chemistry, microbiology, engineering, biology, dermatology and quality control. In 2000, 1999 and 1998, the Company spent approximately $27.3 million, $32.9 million and $31.9 million, respectively, on research and development activities. Manufacturing and Related Operations and Raw Materials The Company manufactured Revlon brand color cosmetics, personal care products and fragrances and Ultima cosmetics and skin treatment products for sale in the United States, Japan and during 2000 most of the countries in Latin America and Southeast Asia at its Phoenix, Arizona facility and its Canadian facility. As part of its new business strategy which includes the consolidation of manufacturing capacity, the Company has shutdown its Canadian manufacturing facility and is in the process of shutting down the Phoenix facility and consolidating North America cosmetics manufacturing at its Oxford, North Carolina facility. The Company also manufactures Almay brand products for sale throughout the world and personal care products for Revlon and Mitchum at its Oxford, North Carolina facility. Implements for sale throughout the world are manufactured and/or assembled at the Company's Irvington, New Jersey facility. The Phoenix and Oxford facilities have been ISO-9002 certified. ISO-9002 certification is an internationally recognized standard for manufacturing facilities, that signifies that the manufacturing facility has achieved and maintains certain performance and quality commitment standards. The Company manufactures its entire line of consumer products (except implements) for sale in most of Europe at its Maesteg, South Wales facility. During 2000, cosmetics and personal care products also were produced at the Company's facilities in Canada, Venezuela, Mexico, New Zealand, Brazil, Argentina, France and South Africa. The New Zealand facility was shutdown in late 2000, and the Company consolidated such operations into its facility in Australia. The Company’s Maesteg facility has been certified by the British equivalent of ISO-9002. The globalization of the Company's core brands allows the Company to centralize production of some product categories for sale throughout the world within designated facilities and shift production of certain other product categories to more cost-effective manufacturing sites to reduce production costs. Shifts of production may result in the closing of certain of the Company's manufacturing facilities, and the Company continually reviews its needs in this regard. In addition, as part of its efforts to continuously reduce costs, the Company attempts to ensure that a significant portion of its capital expenditures is devoted to improving operating efficiencies. The Company purchases raw materials and components throughout the world. The Company continuously pursues reductions in cost of goods through the global sourcing of raw materials and components from qualified vendors, utilizing its large purchasing capacity to maximize cost savings. The global sourcing of raw materials and components from accredited vendors also ensures the quality of the raw materials and components. The Company believes that alternate sources of raw materials and components exist and does not anticipate any significant shortages of, or difficulty in obtaining, such materials. The Company's improvements in manufacturing, sourcing and related operations have contributed to improved customer service, including an improvement in the percentage of timely order fulfillment from most of the Company's

7
principal manufacturing facilities, and the timeliness and accuracy of new product and promotion deliveries. To promote the Company's understanding of and responsiveness to the needs of its retail customers, the Company has dedicated teams assigned to significant accounts, and has provided retail accounts with a designated customer service representative. As a result of these efforts, accompanied by stronger and more customer-focused management, the Company has developed strong relationships with its retailers. Distribution The Company's products are sold worldwide. The Company's worldwide sales force had approximately 600 people as of December 31, 2000, including dedicated sales forces for cosmetics, skin care and fragrance products in the self-select distribution channel, for the demonstrator-assisted distribution channel and for personal care products distribution. In addition, the Company utilizes sales representatives and independent distributors to serve specialized markets and related distribution channels. United States. Net sales in the United States accounted for approximately 58.8% of the Company's 2000 net sales, a majority of which were made in the self-select distribution channel. The Company also sells a broad range of consumer products to United States Government military exchanges and commissaries. The Company licenses its trademarks to select manufacturers for products that the Company believes have the potential to extend the Company's brand names and image. As of December 31, 2000, 12 licenses were in effect relating to 11 product categories to be marketed in the self-select distribution channel. Pursuant to such licenses, the Company retains strict control over product design and development, product quality, advertising and use of its trademarks. These licensing arrangements offer opportunities for the Company to generate revenues and cash flow through earned royalties.
As part of its new business strategy to increase consumption of the Company's products at retail, the Company is increasing the number of retail merchandisers who stock and maintain the Company's point of sale retail displays to insure high selling SKUs are in stock and to insure the optimal presentation of the Company's product in retail outlets. Additionally, the Company has upgraded the technology available to its sales force to provide real-time information regarding inventory levels and other relevant information.
International. Net sales outside the United States accounted for approximately 41.2% of the Company's 2000 net sales. The ten largest countries in terms of these sales, which include, Brazil, Canada, Australia, the United Kingdom, South Africa, Mexico, France, Argentina, Italy and Venezuela, accounted for approximately 30.1% of the Company's net sales in 2000. The Company distributes its products through drug stores/chemists, hypermarkets/mass volume retailers and variety stores. The Company also distributes outside the United States through department stores and specialty stores such as perfumeries. At December 31, 2000, the Company actively sold its products through wholly-owned subsidiaries established in 20 countries outside of the United States and through a large number of distributors and licensees elsewhere around the world. Customers The Company's principal customers include large mass volume retailers and chain drug stores, including such well known retailers as Wal-Mart, Target, Kmart, Walgreens, Rite Aid, CVS, Eckerds, Albertsons Drugs and Longs in the United States, Boots in the United Kingdom, Carrefour in Western Europe and Wal-Mart internationally. Wal-Mart and its affiliates worldwide accounted for approximately 16.5% of the Company's 2000 consolidated net sales. Although the loss of Wal-Mart as a customer would have an adverse effect on the Company, the Company believes that its relationship with Wal-Mart is satisfactory and the Company has no reason to believe that Wal-Mart will not continue as a customer.

8
Competition The consumer products business is characterized by vigorous competition throughout the world. Brand recognition, together with product quality, performance and price and the extent to which consumers are educated on product benefits, have a marked influence on consumers' choices among competing products and brands. Advertising, promotion, merchandising and packaging, and the timing of new product introductions and line extensions, also have a significant impact on buying decisions, and the structure and quality of the Company’s sales force affect product reception, in-store position, permanent display space and inventory levels in retail outlets. The Company competes in most of its product categories against a number of companies, many of which have substantially greater resources than the Company. In addition to products sold in the self-select and demonstrator-assisted distribution channels, the Company's products also compete with similar products sold door-to-door or through mail order or telemarketing by representatives of direct sales companies. The Company's principal competitors include L'Oréal S.A., The Procter & Gamble Company, Unilever N.V. and The Estée Lauder Companies Inc. Patents, Trademarks and Proprietary Technology The Company's major trademarks are registered in the United States and in well over 100 other countries, and the Company considers trademark protection to be very important to its business. Significant trademarks include Revlon, ColorStay, Revlon Age Defying, StreetWear, Flex, Cutex (outside the U.S.), Mitchum, Eterna 27, Ultima, Almay, Charlie, Jean Naté, Revlon Results, Colorama, Fire & Ice, Moon Drops, Super Lustrous, Wonderwear and Colorsilk. The Company utilizes certain proprietary or patented technologies in the formulation or manufacture of a number of the Company's products, including ColorStay lipcolor and cosmetics, ColorStay hair color, classic Revlon nail enamel, Top Speed nail enamel, Revlon Age Defying foundation and cosmetics, New Complexion makeup, Wonderwear foundation, Wonderwear lipstick, Almay Time-Off skin care and makeup, Almay Amazing cosmetics, Almay One Coat eye makeup and cosmetics, Ultima Vital Radiance skin care products and Outrageous shampoo. The Company also protects certain of its packaging and component concepts through design patents. The Company considers its proprietary technology and patent protection to be important to its business. Government Regulation The Company is subject to regulation by the Federal Trade Commission and the Food and Drug Administration (the "FDA") in the United States, as well as various other federal, state, local and foreign regulatory authorities. The Phoenix, Arizona and Oxford, North Carolina manufacturing facilities are registered with the FDA as drug manufacturing establishments, permitting the manufacture of cosmetics that contain over-the-counter drug ingredients such as sunscreens. Compliance with federal, state, local and foreign laws and regulations pertaining to discharge of materials into the environment, or otherwise relating to the protection of the environment, has not had, and is not anticipated to have, a material effect upon the capital expenditures, earnings or competitive position of the Company. State and local regulations in the United States that are designed to protect consumers or the environment have an increasing influence on the Company’s product claims, contents and packaging. Industry Segments, Foreign and Domestic Operations The Company operates in a single segment. Certain geographic, financial and other information of the Company is set forth in Note 17 of the Notes to Consolidated Financial Statements of the Company.

9
Employees As of December 31, 2000, the Company employed the equivalent of approximately 8,000 full-time persons. As of December 31, 2000, approximately 1,100 of such employees in the United States were covered by collective bargaining agreements, the majority of whom are employed at the Phoenix facility. The Company believes that its employee relations are satisfactory. Although the Company has experienced minor work stoppages of limited duration in the past in the ordinary course of business, such work stoppages have not had a material effect on the Company's results of operations or financial condition. Item 2. Properties The following table sets forth as of December 31, 2000 the Company's major manufacturing, research and warehouse/distribution facilities, all of which are owned except where otherwise noted. Location
Use
Approximate Floor Space Sq. Ft.
Oxford, North Carolina....................... Manufacturing, warehousing, distribution and office 1,012,000
Phoenix, Arizona (a) .......................... Manufacturing, warehousing, distribution and office (partially leased)
706,000
Edison, New Jersey............................. Research and office (leased) 175,000
Irvington, New Jersey......................... Manufacturing, warehousing and office 96,000
São Paulo, Brazil................................ Manufacturing, warehousing, distribution, office and research
435,000
Maesteg, South Wales........................ Manufacturing, distribution and office 316,000
Mississauga, Canada (a) .................... Manufacturing, warehousing, distribution and office 245,000
Caracas, Venezuela............................. Manufacturing, distribution and office 145,000
Kempton Park, South Africa............... Warehousing, distribution and office (leased) 127,000
Canberra, Australia............................. Warehousing, distribution and office 125,000
Isando, South Africa........................... Manufacturing, warehousing, distribution and office 94,000
(a) As of December 31, 2000, the Company was in the process of closing or selling these facilities. In addition to the facilities described above, the Company owns and leases additional facilities in various areas throughout the world, including the lease for the Company's executive offices in New York, New York (346,000 square feet, of which approximately 19,000 square feet were sublet to affiliates of the Company and approximately 162,000 square feet were sublet to unaffiliated third parties as of December 31, 2000). Management considers the Company's facilities to be well-maintained and satisfactory for the Company's operations, and believes that the Company's facilities provide sufficient capacity for its current and expected production requirements. Item 3. Legal Proceedings The Company is involved in various routine legal proceedings incident to the ordinary course of its business. The Company believes that the outcome of all pending legal proceedings in the aggregate is unlikely to have a material adverse effect on the business or consolidated financial condition of the Company.
On April 17, 2000, the plaintiffs in the six purported class actions filed in October and November 1999 by each of Thomas Comport, Boaz Spitz, Felix Ezeir and Amy Hoffman, Ted Parris, Jerry Krim and Dan Gavish individually and allegedly on behalf of others similarly situated to them against Revlon, Inc., certain of its present and former officers and directors and the parent of Revlon, Inc., REV Holdings Inc. (“REV Holdings”), alleging among other things, violations of Rule 10b-5 under the Securities Exchange Act of 1934, filed an Amended

10
Complaint, which consolidated all of the actions and limited the alleged class period to the period from October 29, 1997 through October 1, 1998 (“In Re Revlon, Inc. Securities Litigation”). In June 2000, the Company moved to dismiss the Amended Complaint, which motion was denied in substantial part in March 2001. The Company believes the allegations contained in the Amended Complaint are without merit and intends to vigorously defend against them.
A purported class action lawsuit was filed on September 27, 2000, in the United States District Court for the
Southern District of New York on behalf of Dan Gavish, Tricia Fontan and Walter Fontan individually and allegedly on behalf of all others similarly situated who purchased the securities of Revlon, Inc., and REV Holdings, between October 2, 1998 and September 30, 1999 (the "Purported Class Period"). The complaint alleges that Revlon, Inc. and certain of its present and former officers and directors and REV Holdings violated, among other things, Rule 10b-5 under the Securities Exchange Act of 1934. On October 17, 2000 the court ordered that this lawsuit be consolidated with the pending In Re Revlon, Inc. Securities Litigation. On October 27, 2000 the plaintiff moved for reconsideration of the October 17, 2000 consolidation order. The Company believes the allegations contained in the complaint are without merit and intends to vigorously defend against them.
Item 4. Submission of Matters to a Vote of Security Holders No matter was submitted to a vote of security holders during the fourth quarter of the fiscal year covered by this report.
PART II
Item 5. Market for Registrant’s Common Equity and Related Stockholder Matters MacAndrews & Forbes Holdings Inc. (“MacAndrews Holdings”), which is indirectly wholly owned by Ronald O. Perelman, through REV Holdings, beneficially owns 11,250,000 shares of the Company’s Class A Common Stock (representing approximately 56% of the outstanding shares of the Company’s Class A Common Stock) and all of the outstanding 31,250,000 shares of the Company’s Class B Common Stock, which together represent approximately 83% of the outstanding shares of the Company’s Common Stock and have approximately 97.3% of the combined voting power of the outstanding shares of the Company’s Common Stock. The remaining 8,865,935 shares of the Company’s Class A Common Stock outstanding at March 8, 2001 are owned by the public. As of March 8, 2001, there were 757 holders of record of the Company’s Class A Common Stock. No dividends were declared or paid during 2000 or 1999. The terms of the Credit Agreement, the 8 5/8% Notes (as hereinafter defined), the 8 1/8% Notes (as hereinafter defined) and the 9% Notes (as hereinafter defined) currently restrict the ability of Products Corporation to pay dividends or make distributions to Revlon, Inc. See the Consolidated Financial Statements of the Company and the Notes thereto. The table below shows the Company’s high and low quarterly stock prices for the years ended December 31, 2000 and 1999.
2000 Quarterly Stock Prices (1)1st 2nd 3rd 4th
Quarter Quarter Quarter Quarter
High.......................................................................................................$ 11.00 $ 9.75 $ 8.125 $ 7.375
Low...............................................................................................................................6.8125 6.00 5.875 3.72
1999 Quarterly Stock Prices (1)1st 2nd 3rd 4th
Quarter Quarter Quarter Quarter
High.......................................................................................................$ 22.25 $ 32.00 $ 29.125 $ 12.00
Low...............................................................................................................................13.50 19.125 18.00 7.50
(1) Represents the closing price per share on the New York Stock Exchange (NYSE), the exchange on which shares of the Company’s Class A Common Stock are listed. The Company’s symbol is REV.

11
Item 6. Selected Financial Data The Consolidated Statements of Operations Data for each of the years in the five-year period ended December 31, 2000 and the Balance Sheet Data as of December 31, 2000, 1999, 1998, 1997 and 1996 are derived from the Consolidated Financial Statements of the Company, which have been audited by KPMG LLP, independent certified public accountants. The Selected Consolidated Financial Data should be read in conjunction with the Consolidated Financial Statements of the Company and the Notes to the Consolidated Financial Statements and “Management’s Discussion and Analysis of Financial Condition and Results of Operations.”
2000 (a) 1999 1998 1997 1996
Statements of Operations Data:Net sales.......................................................................................................................................................................................$ 1,491.6 $ 1,861.3 $ 2,252.2 $ 2,238.6 $ 2,092.1
Operating income (loss).........................................................................................................................................................................................15.0 (b) (212.6) (c) 124.6 (d) 214.9 (e) 199.2
(Loss) income from continuing operations.......................................................................................................................................................(130.6) (371.5) (27.3) 57.8 24.4
Basic (loss) income from continuing operations per common share...............................................................................................................$ (2.54) $ (7.25) $ (0.53) $ 1.13 $ 0.49
Diluted (loss) income from continuing operations per common share...............................................................................................................$ (2.54) $ (7.25) $ (0.53) $ 1.13 $ 0.49
Weighted average number of common shares outstanding: (f)
Basic...............................................................................................................................................................................................51.3 51.2 51.2 51.1 49.7
Diluted.............................................................................................................................................................................................51.3 51.2 51.2 51.5 49.8
2000 (a) 1999 1998 1997 1996
Balance Sheet Data:Total assets........................................................................................................................................................................................$ 1,101.5 $ 1,558.3 $ 1,830.0 $ 1,756.0 $ 1,617.3Long-term debt, including current portion.............................................................................................................................................................1,563.1 1,772.1 1,660.0 1,425.2 1,361.0Total stockholders' deficiency.......................................................................................................................................................................(1,106.1) (1,014.9) (648.0) (458.5) (497.1)
December 31,
(in millions)
(in millions, except per share amounts)
Year Ended December 31,
(a) On March 30, 2000 and May 8, 2000, the Company completed the dispositions of its worldwide professional products line and the Plusbelle brand in Argentina, respectively. Accordingly, the selected financial data include the results of operations of the professional products line and the Plusbelle brand through the dates of their respective dispositions.
(b) Includes restructuring costs and other, net, of $54.1 million. See Note 2 to the Consolidated Financial Statements. (c) Includes restructuring costs and other, net, and executive separation costs of $40.2 million and $22.0 million, respectively. See Note 2 to the Consolidated Financial Statements. (d) Includes restructuring costs and other, net, aggregating $35.8 million. See Note 2 to the Consolidated Financial Statements. (e) Includes restructuring costs and other, net, of $3.6 million. (f) Represents the weighted average number of common shares outstanding for the period. See Note 1 to the Consolidated Financial Statements.

12
Item 7. Management’s Discussion and Analysis of Financial Condition and Results of Operations (dollars in millions) Overview The Company operates in a single segment and manufactures, markets and sells an extensive array of cosmetics and skin care, fragrances and personal care products, and, until the disposition of its professional products line on March 30, 2000, had included professional products, which consisted of hair and nail care products principally for use in and resale by professional salons. In addition, the Company has a licensing group. Results of Operations The following table sets forth the Company’s net sales for each of the last three years:
Year Ended December 31,
Net sales: 2000 1999 1998
United States .............................................................................................................................................................$ 877.1 $ 1,046.2 $ 1,343.7
International .........................................................................................................................................................................614.5 815.1 908.5
$ 1,491.6 $ 1,861.3 $ 2,252.2
The following table sets forth certain statements of operations data as a percentage of net sales for each of the last three years:
Year Ended December 31,
2000 1999 1998
Cost of sales......................................................................................................................................................37.1 % 36.9 % 34.0 %Gross profit.......................................................................................................... 62.9 63.1 66.0
Selling, general and administrative
expenses ("SG&A")*...................................................................................................................................................…58.3 72.4 59.0
Operating income (loss) before restructuring costs and other, net .................................................................................................................................................................................4.6 (9.3) 7.0
* 1999 includes $22.0 (1.2% of net sales) for charges related to executive separation costs.
Year ended December 31, 2000 compared with year ended December 31, 1999 Net sales Net sales were $1,491.6 and $1,861.3 for 2000 and 1999, respectively, a decrease of $369.7, or 19.9% on a reported basis (a decrease of 18.6% on a constant U.S. dollar basis). The decline in consolidated net sales for the year 2000 as compared with 1999 is primarily due to the sale of the worldwide professional products line and the Plusbelle brand in Argentina, the effect on sales of the reduction of overall U.S. customer inventories, reduced consumer demand for the Company’s cosmetics, and increased competitive activity in certain markets. Net sales, excluding the worldwide professional products line and the Plusbelle brand in Argentina, were $1,395.3 and $1,470.9 for 2000 and 1999, respectively, a decrease of $75.6, or 5.1% on a reported basis (a decrease of 3.5% on a constant U.S. dollar basis).

13
United States. Net sales in the United States were $877.1 for 2000 compared with $1,046.2 for 1999, a decrease of $169.1, or 16.2%. Net sales, excluding the domestic portion of the worldwide professional products line, were $841.9 for 2000 compared with $889.5 for 1999, a decrease of $47.6, or 5.4%. The decline in sales for 2000 is primarily due to a reduction of overall U.S. customer inventories, which the Company anticipates will continue to affect sales, and reduced consumer demand for the Company’s cosmetics due in part to fewer new product introductions. International. Net sales outside the United States were $614.5 for 2000 compared with $815.1 for 1999, a decrease of $200.6, or 24.6% on a reported basis (a decrease of 21.7% on a constant U.S. dollar basis). The decrease was primarily due to the sale of the worldwide professional products line and the Plusbelle brand in Argentina.
Net sales, excluding the worldwide professional products line outside the United States and the Plusbelle brand in Argentina, were $553.4 for 2000 compared with $581.4 for 1999, a decrease of $28.0, or 4.8%, on a reported basis (a decrease of 0.5% on a constant U.S. dollar basis). The decrease in net sales for 2000 on a constant U.S. dollar basis is primarily due to increased competitive activity in certain markets outside the U.S. The decrease in net sales for 2000 on a reported basis also reflects the unfavorable effect on sales of a stronger U.S. dollar against certain foreign currencies. Sales outside the United States are divided by the Company into three geographic regions. In Europe, which comprises Europe, the Middle East and Africa, net sales decreased by 9.2% on a reported basis to $174.9 for 2000 as compared with 1999 (an increase of 0.1% on a constant U.S. dollar basis). In the Western Hemisphere, which comprises Canada, Mexico, Central America, South America and Puerto Rico, net sales increased by 2.8% on a reported basis to $253.3 for 2000 as compared with 1999 (an increase of 3.1% on a constant U.S. dollar basis). The Company’s operations in Brazil are significant. In Brazil, net sales were $76.0 on a reported basis for 2000 compared with $76.1 for 1999. In the Far East, net sales decreased by 12.0% on a reported basis to $125.2 for 2000 as compared with 1999 (a decrease of 7.3% on a constant U.S. dollar basis). Net sales outside the United States, including the Company’s operations in Brazil, may be adversely affected by weak economic conditions, political and economic uncertainties, adverse currency fluctuations, and competitive activities. Cost of sales
As a percentage of net sales, cost of sales was 37.1% for 2000 compared with 36.9% for 1999. Excluding the worldwide professional products line and the Plusbelle brand in Argentina, cost of sales as a percentage of net sales was 36.8% for 2000 compared with 36.4% for 1999. The increase in cost of sales as a percentage of net sales for 2000 compared with 1999 is due to the mix of new products with higher product packaging and material costs and the effect of fixed costs on lower net sales. SG&A expenses
As a percentage of net sales, SG&A expenses were 58.3% for 2000 compared with 72.4% for 1999.
Excluding the worldwide professional products line and the Plusbelle brand in Argentina, SG&A expenses as a percentage of net sales were 58.5% for 2000 compared with 77.3% for 1999. The decrease in SG&A expenses as a percentage of sales during 2000 primarily reflects reduced brand support and the favorable impact of the Company’s restructuring efforts partially offset by the effect of fixed costs on lower net sales. Restructuring costs and other, net
Since 1998, the Company has been continuously evaluating its organizational structure and has implemented a number of restructuring plans. In the fourth quarter of 1998, the Company executed a plan to realign and reduce personnel, exit excess leased real estate, realign and consolidate regional activities, reconfigure certain manufacturing operations and exit certain product lines (the “1998 Restructuring Plan”). The cost of the 1998 Restructuring Plan resulted in a charge of $44.2 in 1998 and an additional net charge of $20.5 through the nine-month period ended September 30, 1999, principally for employee severance and other personnel benefits and obligations for excess leased real estate primarily in the United States. In 1999, the Company exited a non-core business for which it recorded a charge of

14
$1.6, which was included in restructuring costs and other, net. In 1998, the Company recognized $8.4 of gains on sales of certain non-core assets. In the fourth quarter of 1999, the Company began a new restructuring program principally for additional employee severance and other personnel benefits and to restructure certain operations outside the United States, including certain operations in Japan (the “1999 Restructuring Plan”). The cost of the 1999 Restructuring Plan resulted in a charge of $18.1 in the fourth quarter of 1999. In the first half of 2000, the Company recorded a charge of $14.6 relating to the 1999 Restructuring Plan. During the third quarter of 2000, the Company continued to re-evaluate its organizational structure. As part of this re-evaluation, the Company developed a new restructuring plan designed to improve profitability by reducing personnel and consolidating manufacturing facilities (the “2000 Restructuring Plan”). The 2000 Restructuring Plan focused on the Company’s plans to close its manufacturing operations in Phoenix, Arizona and Mississauga, Canada and to consolidate its production into its plant in Oxford, North Carolina. The 2000 Restructuring Plan also includes the remaining obligation for excess leased real estate in the Company’s headquarters, consolidation costs associated with the Company closing its facility in New Zealand, and the elimination of several domestic and international executive and operational positions, both of which were effected to reduce and streamline corporate overhead costs. In the third and fourth quarters of 2000, the Company recorded charges of $13.7 and $25.8, respectively, related to the 2000 Restructuring Plan, principally for additional employee severance and other personnel benefits and to consolidate worldwide operations. The Company anticipates that it will recognize approximately $35 to $40 of additional costs to implement this plan. The Company anticipates annual savings of approximately $40 to $45 relating to the restructuring charges recorded during 2000 in connection with the 2000 and 1999 Restructuring Plans. Other expenses (income) Interest expense was $144.5 for 2000 compared with $147.9 for 1999. The decrease in interest expense for 2000 as compared with 1999 is primarily due to the repayment of borrowings under the Credit Agreement with the net proceeds from the disposition of the worldwide professional product line and the Plusbelle brand in Argentina, partially offset by higher interest rates under the Credit Agreement. Foreign currency losses (gains), net, were $1.6 for 2000 compared with $(0.5) for 1999. Foreign currency losses, net for 2000, consisted primarily of losses in certain markets in Latin America. Sale of product line and brand On May 8, 2000, Products Corporation completed the disposition of the Plusbelle brand in Argentina. In connection with the disposition, the Company recognized a pre-tax and after-tax loss of $4.8 (See Note 3 to the Consolidated Financial Statements).
On March 30, 2000, Products Corporation completed the disposition of its worldwide professional products line, including professional hair care for use in and resale by professional salons, ethnic hair and personal care products, Natural Honey skin care and certain regional toiletries brands. In connection with the disposition, the Company recognized a pre-tax and after-tax gain of $14.8 (See Note 3 to the Consolidated Financial Statements). Provision for income taxes The provision for income taxes was $8.6 for 2000 compared with $9.1 for 1999. The decrease for 2000 compared with 1999 was primarily attributable to lower taxable income in 2000 in certain markets outside the United States.

15
Year ended December 31, 1999 compared with year ended December 31, 1998 Net sales Net sales were $1,861.3 and $2,252.2 for 1999 and 1998, respectively, a decrease of $390.9, or 17.4% on a reported basis (a decrease of 14.9% on a constant U.S. dollar basis). United States. Net sales in the United States were $1,046.2 for 1999 compared with $1,343.7 for 1998, a decrease of $297.5, or 22.1%. Net sales for 1999 were adversely affected by lower than anticipated share growth, competitive activities and a reduction in the level of Company shipments to certain retailers intended to achieve such retailers’ lower inventory target levels. The reduction of retailers’ target inventory levels will continue and is expected to adversely impact sales in 2000. New products in 1999 included EveryLash mascara, MoistureStay Sheer Lip Color, Revlon Age Defying compact makeup, Wet/Dry Eye Shadow, Almay Stay Smooth lip makeup and mascara, Almay Foundation with Skin Stays Clean attributes, products in the Almay One Coat collection, Mitchum Cool Dry antiperspirant and ColorStay Liquid Lip. International. Net sales outside the United States were $815.1 for 1999 compared with $908.5 for 1998, a decrease of $93.4, or 10.3%, on a reported basis (a decrease of 3.7% on a constant U.S. dollar basis). Net sales for 1999 on a constant U.S. dollar basis were affected by unfavorable economic conditions in certain markets outside the U.S., principally Brazil, which restrained consumer and trade demand, increased competitive activity and lower sales in certain markets, principally the United Kingdom and Canada. The decrease in net sales for 1999 on a reported basis also reflects the unfavorable effect on sales of a stronger U.S. dollar against certain foreign currencies, particularly the Brazilian real. Sales outside the United States are divided into three geographic regions. In Europe, which comprises Europe, the Middle East and Africa, net sales decreased by 9.2% on a reported basis to $369.5 for 1999 as compared with 1998 (a decrease of 4.3% on a constant U.S. dollar basis). In the Western Hemisphere, which comprises Canada, Mexico, Central America, South America and Puerto Rico, net sales decreased by 15.4% on a reported basis to $303.1 for 1999 as compared with 1998 (a decrease of 3.0% on a constant U.S. dollar basis). The Company's operations in Brazil are significant. In Brazil, net sales were $76.1 on a reported basis for 1999 compared with $122.5 for 1998, a decrease of $46.4, or 37.9% (a decrease of 3.1% on a constant U.S. dollar basis). On a reported basis, net sales in Brazil were adversely affected by the stronger U.S. dollar against the Brazilian real, unfavorable economic conditions and increased competitive activities. In the Far East, net sales decreased by 0.7% on a reported basis to $142.5 for 1999 as compared with 1998 (a decrease of 4.0% on a constant U.S. dollar basis). Net sales outside the United States, including, without limitation, in Brazil, may be adversely affected by generally weak economic conditions, political and economic uncertainties, including, without limitation, currency fluctuations and competitive activities in certain markets. Cost of sales As a percentage of net sales, cost of sales was 36.9% for 1999 compared with 34.0% for 1998. The increase in cost of sales as a percentage of net sales for 1999 compared with 1998 is due to changes in product mix, the effect of weaker local currencies on the cost of imported purchases by subsidiaries outside the U.S. and the effect of lower net sales. SG&A expenses As a percentage of net sales, SG&A expenses were 72.4% ($1,347.6) for 1999 compared with 59.0% ($1,328.8) for 1998. The increase in SG&A expenses as a percentage of net sales is due in large measure to the reduced levels of sales coupled with the Company’s decision to maintain throughout the second half of 1999 brand support intended to drive consumer purchasing and facilitate the inventory reduction process by U.S. retailers referred to earlier. In addition, SG&A increased as a result of executive separation costs of $22.0, which were partially offset by savings from the Company’s restructuring plan from 1998.

16
Restructuring costs and other, net In the fourth quarter of 1998, the Company executed the 1998 Restructuring Plan recognizing a charge of $44.2. During 1999, the Company continued to implement the 1998 Restructuring Plan for which it recorded a charge of $20.5 for employee severance and other personnel benefits, costs associated with the exit from leased facilities as well as other costs. Also in 1999, the Company consummated an exit from a non-core business, resulting in an additional charge of $1.6, which is included in restructuring costs and other, net. In 1998, the Company recognized $8.4 of gains on sales of certain non-core assets. During the fourth quarter of 1999, the Company began its 1999 Restructuring Plan resulting in a charge of $18.1 principally for employee severance. Other expenses (income) Interest expense was $147.9 for 1999 compared with $137.9 for 1998. The increase in interest expense for 1999 as compared with 1998 is due to higher average outstanding debt and higher interest rates under the Credit Agreement, partially offset by lower interest rates as a result of the refinancings in 1998. Foreign currency (gains) losses, net, were $(0.5) for 1999 compared with $4.6 in 1998. Foreign currency losses, net for 1998 consisted primarily of losses in several markets in Latin America. Provision for income taxes The provision for income taxes was $9.1 for 1999 compared with $5.0 for 1998. Discontinued operations During 1998, the Company completed the disposition of its approximately 85% ownership interest in The Cosmetic Center, Inc. (“CCI”) and, accordingly, the results of operations of CCI had been reported as discontinued operations along with the loss on disposal of such operations. Financial Condition, Liquidity and Capital Resources Net cash used for operating activities was $85.4, $82.8 and $51.5 for 2000, 1999 and 1998, respectively. The slight increase in net cash used for operating activities for 2000 compared with 1999 resulted primarily from changes in working capital, partially offset by a lower net loss and lower purchases of permanent displays. The increase in net cash used for operating activities for 1999 compared with 1998 was the result of operating losses and increased use of cash for restructuring costs during 1999, partially offset by changes in working capital. Net cash provided by (used for) investing activities was $322.1, $(40.7) and $(91.0) for 2000, 1999 and 1998, respectively. Net cash provided by investing activities for 2000 consisted of proceeds from the sale of the Company’s worldwide professional products line and the Plusbelle brand in Argentina, partially offset by cash used for capital expenditures. Net cash used for investing activities in 1999 related principally to capital expenditures. Net cash used for investing activities for 1998 includes cash paid in connection with acquisitions of businesses and capital expenditures, partially offset by the proceeds from the sale of the wigs and hairpieces portion of the Company's business in the United States and from the sale of certain assets. Net cash used for investing activities for 2000, 1999 and 1998 included capital expenditures of $19.0, $42.3 and $60.8, respectively, and in 1998 $57.6 was used for acquisitions. Investing activities in 1999 included substantial upgrades to the Company’s management information systems. Net cash (used for) provided by financing activities was $(202.3), $118.5 and $159.1 for 2000, 1999 and 1998, respectively. Net cash used for financing activities for 2000 included repayments of borrowings under the Credit Agreement with the net proceeds from the disposition of the worldwide professional products line and the Plusbelle brand in Argentina and the repayment of Products Corporation’s Japanese yen-denominated credit agreement (the “Yen Credit Agreement”) partially offset by cash drawn under the Credit Agreement. Net cash provided by financing

17
activities for 1999 included cash drawn under the Credit Agreement, partially offset by repayments of borrowings under the Credit Agreement, redemption of the Products Corporation’s 9 1/2 Senior Notes due 1999 and repayments under the Yen Credit Agreement. Net cash provided by financing activities for 1998 included proceeds from the issuance of Products Corporation’s 9% Senior Notes due 2006 (the “9% Notes”), Products Corporation’s 8 5/8% Senior Subordinated Notes due 2008 (the “8 5/8% Notes”) and Products Corporation’s 8 1/8% Senior Notes due 2006 (the “8 1/8% Notes”) and cash drawn under the Credit Agreement, partially offset by the payment of fees and expenses related to the issuance of the 9% Notes, the 8 5/8% Notes and the 8 1/8% Notes, the redemption of Products Corporation’s 10 1/2 % Senior Subordinated Notes due 2003 and Products Corporation’s 9 3/8% Senior Notes due 2001, and the repayment of borrowings under the Yen Credit Agreement. During 1998, net cash used by discontinued operations was $17.3. In May 1997, Products Corporation entered into a credit agreement (as subsequently amended, the “Credit Agreement”) with a syndicate of lenders, whose individual members change from time to time. In March 2000 and May 2000, 60% of the Net Proceeds from the disposition of the worldwide professional products line and the Plusbelle brand in Argentina, respectively, was applied to reduce the aggregate commitment under the Credit Agreement. As of December 31, 2000, after giving effect to the foregoing reductions, the Credit Agreement provided up to $518.5 and is comprised of five senior secured facilities: $106.2 in two term loan facilities (the “Term Loan Facilities”), a $300.0 multi-currency facility (the “Multi-Currency Facility”), a $62.3 revolving acquisition facility, which may also be used for general corporate purposes (the “Acquisition Facility”), and a $50.0 special standby letter of credit facility (the “Special LC Facility”). The Company under certain circumstances and with the consent of a majority of the lenders may increase the Acquisition Facility to $262.3. At December 31, 2000, the Company had $106.2 outstanding under the Term Loan Facilities, $221.2 outstanding under the Multi-Currency Facility, $62.3 outstanding under the Acquisition Facility and $22.6 of issued but undrawn letters of credit under the Special LC Facility. The scheduled reductions of the Acquisition Facility are $48.8 during 2001. The balance of the Acquisition Facility, along with the Term Loan Facilities, the Multi-Currency Facility and the Special LC Facility mature in May 2002. In January 2001 (effective December 31, 2000), Products Corporation and its bank lenders entered into an amendment to the Credit Agreement, to (i) eliminate the interest coverage ratio and leverage ratio covenants for 2001; (ii) add a minimum cumulative EBITDA covenant for each quarter end during the year 2001; (iii) modify the definition of EBITDA beginning with the quarterly period ended December 31, 2000; (iv) limit the amount that Products Corporation may spend for capital expenditures; (v) permit the sale of certain of Products Corporation's non-core assets; (vi) permit Products Corporation to retain 100% of the Net Proceeds from such asset sales; (vii) increase the "applicable margin" by 1/2 of 1%; and (viii) require Products Corporation to provide a mortgage on its facility in Oxford, North Carolina as security for its obligations under the Credit Agreement. A subsidiary of Products Corporation was the borrower under the Yen Credit Agreement. In March 2000, the outstanding balance under the Yen Credit Agreement was repaid in full in accordance with its terms. The Company's principal sources of funds are expected to be cash flow generated from operations (before interest), net proceeds from the sale of certain non-core assets and borrowings under the Credit Agreement. The Credit Agreement, Products Corporation’s 8 5/8% Notes, Products Corporation’s 8 1/8% Notes and Products Corporation’s 9% Notes contain certain provisions that by their terms limit Products Corporation’s and/or its subsidiaries' ability to, among other things, incur additional debt. The Company's principal uses of funds are expected to be the payment of operating expenses, working capital, purchases of permanent displays and capital expenditure requirements, expenses in connection with the Company’s 2000 and 1999 Restructuring Plans referred to above and debt service payments. The Company estimates that purchases of permanent displays for 2001 will be $40 to $50 and capital expenditures for 2001 will be $13 to $17. The Company estimates that cash payments related to the restructuring plans referred to in Note 2 to the Consolidated Financial Statements and plans for 2001 and executive separation costs will be $60 to $80 in 2001. Pursuant to a tax sharing agreement, Revlon, Inc. may be required to make tax sharing payments to Mafco Holdings Inc. (“Mafco Holdings”) as if Revlon, Inc. were filing separate income tax returns, except that no payments are required by Revlon, Inc. if and to the extent that Products Corporation is prohibited under the Credit Agreement from making tax sharing payments to Revlon, Inc. The Credit Agreement prohibits Products Corporation from making any tax sharing payments other than in respect of state and local income taxes. Revlon, Inc. currently anticipates that, as a result of net operating tax losses and prohibitions under the Credit

18
Agreement, no cash federal tax payments or cash payments in lieu of federal taxes pursuant to the tax sharing agreement will be required for 2001. Products Corporation enters into forward foreign exchange contracts and option contracts from time to time to hedge certain cash flows denominated in foreign currencies. There were no forward foreign exchange or option contracts outstanding at December 31, 2000. The Company expects that cash flows from operations, net proceeds from the sale of certain non-core assets (or financial support from an affiliate, if such asset sales are not completed on a timely basis) and borrowings under the Credit Agreement will be sufficient to enable the Company to meet its anticipated cash requirements during 2001 on a consolidated basis, including for debt service and expenses in connection with the Company’s restructuring plans. However, there can be no assurance that the combination of cash flow from operations, net proceeds from the sale of certain non-core assets (or from such financial support) and borrowings under the Credit Agreement will be sufficient to meet the Company's cash requirements on a consolidated basis. If the Company is unable to satisfy such cash requirements, the Company could be required to adopt one or more alternatives, such as reducing or delaying purchases of permanent displays, reducing or delaying capital expenditures, delaying or revising restructuring plans, restructuring indebtedness, selling additional assets or operations, or seeking capital contributions or additional loans from affiliates of the Company or issuing additional shares of capital stock of Revlon, Inc. Products Corporation has received a commitment from an affiliate that is prepared to provide, if necessary, additional financial support to Products Corporation of up to $40 on appropriate terms through December 31, 2001. There can be no assurance that any of such actions could be effected, that they would enable the Company to continue to satisfy its capital requirements or that they would be permitted under the terms of the Company's various debt instruments then in effect. Revlon, Inc., as a holding company, will be dependent on the earnings and cash flow of, and dividends and distributions from, Products Corporation to pay its expenses and to pay any cash dividend or distribution on Revlon, Inc.’s Class A Common Stock that may be authorized by the Board of Directors of Revlon, Inc. The terms of the Credit Agreement, the 8 5/8% Notes, the 8 1/8% Notes and the 9% Notes generally restrict Products Corporation from paying dividends or making distributions, except that Products Corporation is permitted to pay dividends and make distributions to Revlon, Inc., among other things, to enable Revlon, Inc. to pay expenses incidental to being a public holding company, including, among other things, professional fees such as legal and accounting, regulatory fees such as Securities and Exchange Commission (the “Commission”) filing fees and other miscellaneous expenses related to being a public holding company and to pay dividends or make distributions in certain circumstances to finance the purchase by Revlon, Inc. of its Class A Common Stock in connection with the delivery of such Class A Common Stock to grantees under the Revlon, Inc. Amended and Restated 1996 Stock Plan, provided that the aggregate amount of such dividends and distributions taken together with any purchases of Revlon, Inc. Class A Common Stock on the open market to satisfy matching obligations under the excess savings plan may not exceed $6.0 per annum. Euro Conversion As part of the European Economic and Monetary Union, a single currency (the “Euro”) will replace the national currencies of the principal European countries (other than the United Kingdom) in which the Company conducts business and manufacturing. The conversion rates between the Euro and the participating nations’ currencies were fixed as of January 1, 1999, with the participating national currencies to be removed from circulation between January 1, 2002 and June 30, 2002 and replaced by Euro notes and coinage. During the transition period from January 1, 1999 through December 31, 2001, public and private entities as well as individuals may pay for goods and services using checks, drafts, or wire transfers denominated either in the Euro or the participating country’s national currency. Under the regulations governing the transition to a single currency, there is a “no compulsion, no prohibition” rule, which states that no one can be prevented from using the Euro after January 1, 2002 and no one is obliged to use the Euro before July 2002. In keeping with this rule, the Company expects to either continue using the national currencies or the Euro for invoicing or payments. Based upon the information currently available, the Company does not expect that the transition to the Euro will have a material adverse effect on the business or consolidated financial condition of the Company.

19
Effect of New Accounting Standards
In June 1998 and June 2000, the FASB issued SFAS No. 133, “Accounting for Derivative Instruments and Hedging Activities” and SFAS No. 138, “Accounting for Certain Derivative Instruments and Certain Hedging Activities.” These statements establish accounting and reporting standards requiring that every derivative instrument be recorded on the balance sheet as either an asset or liability measured at its fair value. SFAS Nos. 133 and 138 also require that changes in the derivative’s fair value be recognized currently in earnings unless specific hedge accounting criteria are met. SFAS Nos. 133 and 138 are effective for fiscal years beginning after June 15, 2000. The adoption of SFAS Nos. 133 and 138 did not have an effect on the Company’s consolidated financial statements.
In May 2000, the FASB Emerging Issues Task Force (the “EITF”) issued new guidelines entitled, “Accounting for Certain Sales Incentives” (the “Guidelines”), which addresses when sales incentives and discounts should be recognized, as well as where the related revenues and expenses should be classified in the financial statements. The Guidelines, as amended in November 2000, are effective for the second quarter ending June 30, 2001, and would be applied retroactively for purposes of comparability. Therefore, beginning April 1, 2001, the Company is required to reclassify certain revenues and expenses related to its promotional programs out of operating expenses and into sales and cost of sales. Such reclassification will not affect the Company’s operating income (loss) or net loss.
In March 2000, the FASB issued SFAS Interpretation No. 44, “Accounting for Certain Transactions Involving Stock Compensation: An Interpretation of APB Opinion No. 25” (the “Interpretation”). The Interpretation provides guidance for issues that have arisen in the application of APB Opinion No. 25, “Accounting for Stock Issued to Employees” (“Opinion No. 25”). The Interpretation, which became effective July 1, 2000, applies prospectively to new awards, exchanges of awards, modifications to outstanding awards and changes in grantee status that occur on or after July 1, 2000, except for the provisions related to repricings and the definition of an employee, which apply to awards issued after December 15, 1998. The implementation of the Interpretation by the Company on July 1, 2000 had no impact on the Company’s consolidated financial statements.
In December 1999, the staff of the United States Securities and Exchange Commission issued Staff Accounting Bulletin No. 101, “Revenue Recognition in Financial Statements,” as amended by SAB 101A and SAB 101B (“SAB 101”). SAB 101 outlines basic criteria that must be met to recognize revenue and provides guidelines for disclosure related to revenue recognition policies. SAB 101 was required to be implemented in the fourth quarter of 2000. The adoption of SAB 101 did not have an effect on the Company’s consolidated financial statements. Forward-Looking Statements This annual report on Form 10-K for the year ended December 31, 2000 as well as other public documents and statements of the Company contains forward-looking statements that involve risks and uncertainties. The Company’s actual results may differ materially from those discussed in such forward-looking statements. Such statements include, without limitation, the Company’s expectations and estimates as to: the introduction of new products; future financial performance; the effect on sales of the reduction of overall U.S. customer inventories including the timing thereof; the effect on sales of political and/or economic conditions and competitive activities; the Company’s estimate of restructuring activities, restructuring costs and benefits; the Company’s plans with respect to and estimate of the timing of the shutdown of its Phoenix manufacturing operation, the charges, the cash cost and the annual savings resulting from plant shutdowns; the Company’s expectation that its new trade terms for its U.S. customers will increase consumption of its products, drive market growth, result in more efficient ordering and shipping and reduce returns; cash flow from operations; purchases of permanent displays, capital expenditures; the availability of raw materials and components; the Company’s qualitative and quantitative estimates as to market risk sensitive instruments; the Company’s expectations about the effects of the transition to the Euro; the Company’s intent to pursue the sale of certain non-core assets; the availability of funds from currently available credit facilities, net proceeds from the sale of certain non-core assets, capital contributions or loans from affiliates and the sale of additional assets or operations or additional shares of Revlon, Inc. Statements that are not historical facts, including statements about the Company’s beliefs and expectations, are forward-looking statements. Forward-looking statements can be identified by, among other things, the use of forward-looking language, such as “believes,” “expects,” “estimates,” “projects,” “forecast,” “may,” “will,” “should,” “seeks,” “plans,” “scheduled to,”

20
“anticipates” or “intends” or the negative of those terms, or other variations of those terms or comparable language, or by discussions of strategy or intentions. Forward-looking statements speak only as of the date they are made, and the Company undertakes no obligation to update them. A number of important factors could cause actual results to differ materially from those contained in any forward-looking statement. In addition to factors that may be described in the Company’s filings with the Commission, including this filing, the following factors, among others, could cause the Company’s actual results to differ materially from those expressed in any forward-looking statements made by the Company: (i) difficulties or delays in developing and introducing new products or failure of customers to accept new product offerings; (ii) changes in consumer preferences, including reduced consumer demand for the Company’s color cosmetics and other current products; (iii) unanticipated costs or difficulties or delays in completing projects associated with the Company’s strategy to improve operating efficiencies; (iv) the inability to secure capital contributions or loans from affiliates or sell additional assets or operations or additional shares of Revlon, Inc.; (v) effects of and changes in political and/or economic conditions, including inflation and monetary conditions, and in trade, monetary, fiscal and tax policies in international markets, including but not limited to Brazil; (vi) actions by competitors, including business combinations, technological breakthroughs, new products offerings and marketing and promotional successes; (vii) combinations among significant customers or the loss, insolvency or failure to pay debts by a significant customer or customers; (viii) lower than expected sales as a result of the reduction of overall U.S. customer inventories; (ix) difficulties, delays or unanticipated costs or less than expected savings and other benefits resulting from the Company’s restructuring activities; (x) difficulties or delays in implementing, higher than expected charges and cash costs or lower than expected savings from the shutdown of manufacturing operations in Phoenix; (xi) difficulties or delays in implementing or achieving the intended results of the new trade terms including increased consumption, market growth and lower returns or unexpected consequences from the implementation of the new trade terms including the possible effect on sales; (xii) interest rate or foreign exchange rate changes affecting the Company and its market sensitive financial instruments; (xiii) difficulties, delays or unanticipated costs associated with the transition to the Euro; (xiv) difficulties or delays in sourcing raw materials or components; and (xv) difficulties or delays in pursuing the sale of one or more non-core assets, the inability to consummate such sales or to secure the expected level of proceeds from such sales. Inflation In general, costs are affected by inflation and the effects of inflation may be experienced by the Company in future periods. Management believes, however, that such effects have not been material to the Company during the past three years in the United States or foreign non-hyperinflationary countries. The Company operates in certain countries around the world, such as Brazil, Venezuela and Mexico that have experienced hyperinflation. The Company's operations in Brazil are accounted for as a non-hyperinflationary economy. Effective January 1997, Mexico was considered a hyperinflationary economy for accounting purposes. Effective January 1, 1999, Mexico was considered a non-hyperinflationary economy. In hyperinflationary foreign countries, the Company attempts to mitigate the effects of inflation by increasing prices in line with inflation, where possible, and efficiently managing its working capital levels. Subsequent Events
On March 29, 2001, a subsidiary of Products Corporation entered into an agreement to sell land located in Minami Aoyama near Tokyo, Japan and related rights for the construction of a building on such land for ¥ 3.3 billion (approximately $28 as of March 29, 2001), after fees and expenses. This was less than the Company expected it would receive and resulted in an additional charge of $3.4 (reported in SG&A to reduce the book value to its estimated net realizable value) in excess of that reported in the Company’s earnings release on February 26, 2001. The agreement is subject to a number of conditions. Subject to satisfaction of such conditions, Products Corporation expects the sale to be consummated during the second quarter of 2001.
On March 16, 2001, Products Corporation entered into an agreement to sell its Phoenix facility for $8.0 and lease it back for a certain period of time. The agreement is subject to a number of conditions, including completion of due diligence. Subject to satisfaction of such conditions, Products Corporation expects the sale to be consummated during the second quarter of 2001. If consummated, proceeds available to the Company from the aforementioned transactions will be used for general corporate purposes, including payments to fund the Company’s restructuring plans.

21
Item 7A. Quantitative and Qualitative Disclosures About Market Risk Interest Rate Sensitivity The Company has exposure to changing interest rates, primarily in the United States. The Company’s policy is to manage interest rate risk through the use of a combination of fixed and floating rate debt. The Company from time to time makes use of derivative financial instruments to adjust its fixed and floating rate ratio. The table below provides information about the Company’s indebtedness that is sensitive to changes in interest rates. The table presents cash flows with respect to principal on indebtedness and related weighted average interest rates by expected maturity dates. Weighted average variable rates are based on implied forward rates in the yield curve at December 31, 2000. The information is presented in U.S. dollar equivalents, which is the Company’s reporting currency. Exchange Rate Sensitivity The Company manufactures and sells its products in a number of countries throughout the world and, as a result, is exposed to movements in foreign currency exchange rates. In addition, a portion of the Company’s borrowings are denominated in foreign currencies, which are also subject to market risk associated with exchange rate movement. The Company from time to time hedges major net foreign currency cash exposures generally through foreign exchange forward and option contracts. The contracts are entered into with major financial institutions to minimize counterparty risk. These contracts generally have a duration of less than twelve months and are primarily against the U.S. dollar. In addition, the Company enters into foreign currency swaps to hedge intercompany financing transactions. The Company does not hold or issue financial instruments for trading purposes.
As referred to above, in March 2000 and May 2000, Products Corporation reduced the aggregate commitment under its Credit Agreement and repaid its Yen Credit Agreement.
Fair Value Dec. 31,
2001 2002 2003 2004 2005 Thereafter Total 2000
Debt (US dollar equivalent in millions)
Short-term variable rate (various currencies)...........................................................................................…$30.7 30.7$ 30.7$ Average interest rate (a) ...........................................................................................…7.4%Long-term fixed rate ($US) ...........................................................................................… 1,149.3$ 1,149.3 755.7 Average interest rate ...........................................................................................… 8.6%Long-term variable rate ($US)...........................................................................................…331.1$ 331.1 331.1 Average interest rate (a)...........................................................................................…8.5%Long-term variable rate (various currencies)...........................................................................................…58.6 58.6 58.6 Average interest rate (a) ...........................................................................................…8.2%Total debt ...........................................................................................… 1,569.7$ 1,176.1$
(a) Weighted average variable rates are based upon implied forward rates from the yield curves at December 31, 2000.
Expected maturity date for year ended December 31,
Item 8. Financial Statements and Supplementary Data Reference is made to the Index on page F-1 of the Consolidated Financial Statements of the Company and the Notes thereto contained herein. Item 9. Changes in and Disagreements with Accountants on Accounting and Financial Disclosure Not applicable.

22
PART III
Item 10. Directors and Executive Officers of the Registrant Information concerning Directors and Executive Officers of the Registrant is contained in Revlon, Inc.’s Proxy Statement for the 2000 Annual Meeting of Stockholders, which will be mailed to stockholders on or before April 30, 2001 and is incorporated herein by reference. Item 11. Executive Compensation Information with respect to Executive Compensation is contained in Revlon, Inc.’s Proxy Statement for the 2000 Annual Meeting of Stockholders, which will be mailed to stockholders on or before April 30, 2001 and is incorporated herein by reference. Item 12. Security Ownership of Certain Beneficial Owners and Management Information with respect to Security Ownership of Certain Beneficial Owners and Management is contained in Revlon, Inc.’s Proxy Statement for the 2000 Annual Meeting of Stockholders, which will be mailed to stockholders on or before April 30, 2001 and is incorporated herein by reference. Item 13. Certain Relationships and Related Transactions Information with respect to Certain Relationships and Related Transactions is contained in Revlon, Inc.’s Proxy Statement for the 2000 Annual Meeting of Stockholders, which will be mailed to stockholders on or before April 30, 2001 and is incorporated herein by reference.

23
PART IV
Item 14. Exhibits, Financial Statement Schedules and Reports on Form 8-K (a) List of documents filed as part of this Report: (1) Consolidated Financial Statements and Independent Auditors’ Report included herein: See Index on page F-1 (2) Financial Statement Schedule: See Index on page F-1 All other schedules are omitted as they are inapplicable or the required information is furnished in the Consolidated Financial Statements of the Company or the Notes thereto. (3) List of Exhibits: Exhibit No. Description
3. Certificate of Incorporation and By-Laws.
3.1 Amended and Restated Certificate of Incorporation of Revlon, Inc. dated March 4, 1996 (incorporated by reference to Exhibit 3.4 to the Quarterly Report on Form 10-Q for the quarterly period ended March 31, 1996 of Revlon, Inc.).
3.2 Amended and Restated By-Laws of Revlon, Inc. dated January 30, 1997 (incorporated by reference to Exhibit 3.2 to the Annual Report on Form 10-K for the year ended December 31, 1996 of Revlon, Inc. (the “Revlon 1996 10-K”)).
4. Instruments defining the right of security holders, including indentures.
4.1 Indenture, dated as of February 1, 1998, between Revlon Escrow and U.S. Bank Trust National Association (formerly known as First Trust National Association), as Trustee, relating to the 8 1/8% Senior Notes due 2006 (the "8 1/8% Senior Notes Indenture") (incorporated by reference to Exhibit 4.1 to the Registration Statement on Form S-1 of Products Corporation filed with the Commission on March 12, 1998, File No. 333-47875 (the "Products Corporation 1998 Form S-1")).
4.2 Indenture, dated as of February 1, 1998, between Revlon Escrow and U.S. Bank Trust National Association (formerly known as First Trust National Association), as Trustee, relating to the 8 5/8% Senior Notes Due 2006 (the "8 5/8% Senior Subordinated Notes Indenture") (incorporated by reference to Exhibit 4.3 to the Products Corporation 1998 Form S-1).
4.3 First Supplemental Indenture, dated April 1, 1998, among Products Corporation, Revlon Escrow, and the Trustee, amending the 8 1/8% Senior Notes Indenture (incorporated by reference to Exhibit 4.2 to the Products Corporation 1998 Form S-1).
4.4 First Supplemental Indenture, dated March 4, 1998, among Products Corporation, Revlon Escrow, and the Trustee, amending the 8 5/8% Senior Subordinated Notes Indenture (incorporated by reference to Exhibit 4.4 to the Products Corporation 1998 Form S-1).
4.5 Indenture, dated as of November 6, 1998, between Products Corporation and U.S. Bank Trust National Association, as Trustee, relating to Products Corporation’s 9% Senior Notes due 2006 (incorporated by reference to Exhibit 4.13 to the Quarterly Report on Form 10-Q for the quarterly period ended September 30, 1998 of Revlon, Inc. (the "Revlon 1998 Third Quarter Form 10-Q")).
4.6. Amended and Restated Credit Agreement, dated as of May 30, 1997, among Products Corporation, The Chase Manhattan Bank, Citibank N.A., Lehman Commercial Paper Inc., Chase Securities Inc. and the lenders party thereto (the “Credit Agreement”) (incorporated by reference to Exhibit 4.23 to Amendment No. 2 to the Registration Statement on Form S-1 of Revlon

24
Exhibit No. Description
Worldwide (Parent) Corporation, filed with the Commission on June 26, 1997, File No. 33-23451).
4.7 First Amendment, dated as of January 29, 1998, to the Credit Agreement (incorporated by reference to Exhibit 4.8 to the Annual Report on Form 10-K for the year ended December 31, 1997 of Revlon, Inc.).
4.8 Second Amendment, dated as of November 6, 1998, to the Credit Agreement (incorporated by reference to Exhibit 4.12 to the Revlon 1998 Third Quarter Form 10-Q).
4.9 Third Amendment, dated as of December 23, 1998, to the Credit Agreement (incorporated by reference to Exhibit 4.12 to Amendment No. 1 to the Products Corporation 1998 Form S-4 filed with the Commission on January 22, 1999, File No. 33-69213).
4.10 Fourth Amendment, dated as of November 10, 1999, to the Credit Agreement (incorporated by reference to Exhibit 4.12 to the Quarterly Report on Form 10-Q for the quarterly period ended September 30, 1999 of Revlon, Inc. (the "Revlon 1999 Third Quarter Form 10-Q")).
4.11 4.12 *4.13 10.
Fifth Amendment, dated as of March 6, 2000, to the Credit Agreement (incorporated by reference to Exhibit 10.20 to the Quarterly Report on Form 10-Q for the quarterly period ended March 31, 2000 of Revlon, Inc. the "Revlon 2000 First Quarter Form 10-Q")).
Sixth Amendment, dated as of September 8, 2000, to the Credit Agreement (incorporated by reference to Exhibit 10.24 to the Quarterly Report on form 10-Q for the quarterly period ended September 30, 2000 (the "Revlon 2000 Third Quarter Form 10-Q")). Seventh Amendment, dated as of January 29, 2001, to the Credit Agreement.
Material Contracts.
10.1 Asset Transfer Agreement, dated as of June 24, 1992, among Holdings, National Health Care Group, Inc., Charles of the Ritz Group Ltd., Products Corporation and Revlon, Inc. (incorporated by reference to Exhibit 10.1 to Amendment No. 1 to the Revlon, Inc. Registration Statement on Form S-1 filed with the Commission on June 29, 1992, File No. 33-47100 (the “Revlon 1992 Amendment No. 1”)).
10.2 Tax Sharing Agreement, dated as of June 24, 1992, among Mafco Holdings, Revlon, Inc., Products Corporation and certain subsidiaries of Products Corporation (the “Tax Sharing Agreement”) (incorporated by reference to Exhibit 10.5 to the Revlon 1992 Amendment No. 1).
10.3 First Amendment, dated as of February 28, 1995, to the Tax Sharing Agreement (incorporated by reference to Exhibit 10.5 to the Annual Report on Form 10-K for the year ended December 31, 1994 of Products Corporation).
10.4 *10.5
Second Amendment, dated as of January 1, 1997, to the Tax Sharing Agreement (incorporated by reference to Exhibit 10.7 to the Revlon 1996 10-K). Third Amendment, dated as of January 1, 2001, to the Tax Sharing Agreement.
10.6 10.7
Employment Agreement dated as of November 2, 1999 between Products Corporation and Jeffrey M. Nugent (incorporated by reference to Exhibit 10.10 to the Annual Report on Form 10-K for the year ended December 31, 1999 of Revlon, Inc. (the "Revlon 1999 Form 10-K")). Employment Agreement amended and restated as of May 9, 2000 between Revlon Consumer Products Corporation and Douglas H. Greeff (incorporated by reference to Exhibit 10.22 to the Quarterly Report on Form 10-Q for the quarterly period ended June 30, 2000 of Revlon, Inc. (the "Revlon 2000 Second Quarter 10-Q")).

25
Exhibit No. Description
10.8 10.9
Revlon Executive Bonus Plan (Amended and Restated as of March 1, 2000) (incorporated by reference to Exhibit 10.23 to the Revlon 2000 Second Quarter 10-Q). Senior Executive Supplemental Long-Term Incentive Program (incorporated by reference to Exhibit 10.21 to the Revlon 2000 First Quarter Form 10-Q).
10.10 Amended and Restated Revlon Pension Equalization Plan, amended and restated as of December 14, 1998 (incorporated by reference to Exhibit 10.15 to the Annual Report on Form 10-K for year ended December 31, 1998 of Revlon, Inc.).
10.11 Executive Supplemental Medical Expense Plan Summary dated July 1991 (incorporated by reference to Exhibit 10.18 to the Registration Statement on Form S-1 of Revlon, Inc. filed with the Commission on May 22, 1992, File No. 33-47100 (the “Revlon 1992 Form S-1”)).
10.12 Description of Post Retirement Life Insurance Program for Key Executives (incorporated by reference to Exhibit 10.19 to the Revlon 1992 Form S-1).
10.13 Benefit Plans Assumption Agreement dated as of July 1, 1992, by and among Holdings, Revlon, Inc. and Products Corporation (incorporated by reference to Exhibit 10.25 to the Annual Report on Form 10-K for the year ended December 31, 1992 of Products Corporation).
10.14 Revlon Amended and Restated Executive Deferred Compensation Plan dated as of August 6, 1999 (incorporated by reference to Exhibit 10.27 to the Revlon 1999 Third Quarter Form 10-Q).
10.15 Revlon Executive Severance Policy effective January 1, 1996 (incorporated by reference to Exhibit 10.23 to the Amendment No. 3 to the Registration Statement on Form S-1 of Revlon, Inc. filed with the Commission on February 5, 1996, File No. 33-9958).
10.16 Revlon, Inc. Second Amended and Restated 1996 Stock Plan (Amended and Restated as of February 12, 1999) (incorporated by reference to Exhibit 4.1 to the Registration Statement on Form S-8 of Revlon, Inc. filed with the Commission on April 14, 1999, File No. 333-76267).
10.17 Purchase Agreement dated as of February 18, 2000 by and among Revlon, Inc., Revlon Consumer Products Corporation, REMEA 2 B.V., Revlon Europe, Middle East and Africa, Ltd., Revlon International Corporation, Europeenne de Produits de Beaute S.A., Deutsche Revlon GmbH & Co. K.G., Revlon Canada, Inc., Revlon de Argentina, S.A.I.C., Revlon South Africa (Proprietary) Limited, Revlon (Suisse) S.A., Revlon Overseas Corporation C.A., CEIL – Comercial, Exportadora, Industrial Ltda., Revlon Manufacturing Ltd., Revlon Belgium N.V., Revlon (Chile) S.A., Revlon (Hong Kong) Limited, Revlon, S.A., Revlon Nederland B.V., Revlon New Zealand Limited, European Beauty Products S.p.A. and Beauty Care Professional Products Luxembourg, S.a.r.l. (incorporated by reference to Exhibit 10.19 to the Revlon 1999 10-K).
21. Subsidiaries.
*21.1 Subsidiaries of the Registrant.
23. Consents of Experts and Counsel.
*23.1 Consent of KPMG LLP.
24. Powers of Attorney.
*24.1 Power of Attorney of Ronald O. Perelman.
*24.2 Power of Attorney of Donald G. Drapkin.
*24.3 Power of Attorney of Meyer Feldberg.
*24.4 Power of Attorney of Howard Gittis.

26
Exhibit No. Description
*24.5 Power of Attorney of Vernon E. Jordan, Jr., Esq.
*24.6 Power of Attorney of Edward J. Landau, Esq.
*24.7 Power of Attorney of Jerry W. Levin.
*24.8 Power of Attorney of Linda Gosden Robinson.
*24.9 Power of Attorney of Terry Semel.
*24.10 Power of Attorney of Martha Stewart.
27. Financial Data Schedule.
____________________ * Filed herewith. (b) Reports on Form 8-K.
Form 8-K filed on January 30, 2001 to report the Seventh Amendment, dated January 29, 2001, to the Credit Agreement, among Products Corporation, The Chase Manhattan Bank, Citibank N.A., Lehman Commercial Paper Inc., Chase Securities Inc. and the lenders party thereto.

F-1
REVLON, INC. AND SUBSIDIARIES INDEX TO CONSOLIDATED FINANCIAL STATEMENTS AND SCHEDULE
Page Independent Auditors’ Report................................................................................................................................... .F-2 Audited Financial Statements: Consolidated Balance Sheets as of December 31, 2000 and 1999..................................................................... .F-3 Consolidated Statements of Operations for each of the years in the three-year period ended December 31, 2000.................................................................................................................. .F-4 Consolidated Statements of Stockholders’ Deficiency and Comprehensive Loss for each of the years in the three-year period ended December 31, 2000........................................................................................... .F-5 Consolidated Statements of Cash Flows for each of the years in the three-year period ended December 31, 2000.................................................................................................................. .F-6 Notes to Consolidated Financial Statements....................................................................................................... .F-7 Financial Statement Schedule: Schedule II--Valuation and Qualifying Accounts ............................................................................................... .F-32

F-2
INDEPENDENT AUDITORS’ REPORT
The Board of Directors and Stockholders Revlon, Inc.: We have audited the accompanying consolidated balance sheets of Revlon, Inc. and its subsidiaries as of December 31, 2000 and 1999, and the related consolidated statements of operations, stockholders’ deficiency and comprehensive loss and cash flows for each of the years in the three-year period ended December 31, 2000. In connection with our audits of the consolidated financial statements we have also audited the financial statement schedule as listed on the index on page F-1. These consolidated financial statements and financial statement schedule are the responsibility of the Company’s management. Our responsibility is to express an opinion on these consolidated financial statements and financial statement schedule based on our audits. We conducted our audits in accordance with auditing standards generally accepted in the United States of America. Those standards require that we plan and perform the audit to obtain reasonable assurance about whether the financial statements are free of material misstatement. An audit includes examining, on a test basis, evidence supporting the amounts and disclosures in the financial statements. An audit also includes assessing the accounting principles used and significant estimates made by management, as well as evaluating the overall financial statement presentation. We believe that our audits provide a reasonable basis for our opinion. In our opinion, the consolidated financial statements referred to above present fairly, in all material respects, the financial position of Revlon, Inc. and its subsidiaries as of December 31, 2000 and 1999 and the results of their operations and their cash flows for each of the years in the three-year period ended December 31, 2000, in conformity with accounting principles generally accepted in the United States of America. Also in our opinion, the related financial statement schedule, when considered in relation to the basic consolidated financial statements taken as a whole, presents fairly, in all material respects, the information set forth therein. KPMG LLP New York, New York March 28, 2001

F-3
REVLON, INC. AND SUBSIDIARIESCONSOLIDATED BALANCE SHEETS
(dollars in millions, except per share data)
December 31, December 31,ASSETS 2000 1999
Current assets:Cash and cash equivalents...................................................................................................................................$ 56.3 $ 25.4Trade receivables, less allowances of $16.1
and $27.2, respectively.................................................................................................................................................................220.3 332.6Inventories................................................................................................................................................................................184.7 278.3Prepaid expenses and other..........................................................................................................................................................66.1 51.3
Total current assets.............................................................................................................................................................................527.4 687.6Property, plant and equipment, net..................................................................................................................221.7 336.4Other assets.........................................................................................................................................................................146.3 177.5Intangible assets, net.......................................................................................................................................................................206.1 356.8
Total assets.......................................................................................................................................................................................$ 1,101.5 $ 1,558.3
LIABILITIES AND STOCKHOLDERS' DEFICIENCY
Current liabilities:Short-term borrowings - third parties............................................................................................................................$ 30.7 $ 37.6Current portion of long-term debt - third parties.........................................................................................................- 10.2Accounts payable..................................................................................................................................................................86.3 139.8Accrued expenses and other.................................................................................................................................................309.9 409.7
Total current liabilities.....................................................................................................................................................426.9 597.3Long-term debt - third parties ......................................................................................................................................1,539.0 1,737.8Long-term debt - affiliates..........................................................................................................................................................24.1 24.1Other long-term liabilities............................................................................................................................................................................217.6 214.0
Stockholders' deficiency:Preferred stock, par value $.01 per share; 20,000,000
shares authorized, 546 shares of Series A Preferred Stock issued and outstanding..........................................................................................................................................................54.6 54.6
Class B Common Stock, par value $.01 per share; 200,000,000shares authorized, 31,250,000 issued and outstanding....................................................................................................................0.3 0.3
Class A Common Stock, par value $.01 per share; 350,000,000shares authorized, 20,115,935 and 19,992,837 issued and outstanding, respectively.............................................................................................................................................................0.2 - - - 0.2
Capital deficiency.....................................................................................................................................................................................(227.3) (228.4) Accumulated deficit since June 24, 1992......................................................................................................................................(904.1) (773.5) Accumulated other comprehensive loss............................................................................................................................................(29.8) (68.1)
Total stockholders' deficiency................................................................................................................................................................(1,106.1) (1,014.9) Total liabilities and stockholders' deficiency......................................................................................................................................$ 1,101.5 $ 1,558.3
See Accompanying Notes to Consolidated Financial Statements.

F-4
2000 1999 1998
Net sales..................................................................................................................................................................................................$ 1,491.6 $ 1,861.3 $ 2,252.2 Cost of sales.........................................................................................................................................................................................................553.0 686.1 765.7
Gross profit....................................................................................................................................................................................................938.6 1,175.2 1,486.5Selling, general and administrative expenses..........................................................................................................................................................................................869.5 1,347.6 1,328.8 Restructuring costs and other, net...............................................................................................................................................................................................54.1 40.2 33.1
Operating income (loss)........................................................................................................................................................................................15.0 (212.6) 124.6
Other expenses (income):Interest expense....................................................................................................................................................................................................144.5 147.9 137.9 Interest income....................................................................................................................................................................................(2.1) (2.8) (5.2) Amortization of debt issuance costs.............................................................................................................................................................................................5.6 4.3 5.1 Foreign currency losses (gains), net...........................................................................................................................................................................1.6 (0.5) 4.6 Gain on sale of product line and brand, net...........................................................................................................................................................................................................(10.8) - - Miscellaneous, net...........................................................................................................................................................................................................(1.8) 0.9 4.5
Other expenses, net.......................................................................................................................................................................................................137.0 149.8 146.9
Loss from continuing operations before income taxes.................................................................................................................................................................(122.0) (362.4) (22.3)
Provision for income taxes..........................................................................................................................................................................................8.6 9.1 5.0
Loss from continuing operations.....................................................................................................................................................................................(130.6) (371.5) (27.3)
Loss from discontinued operations................................................................................................................................................................................................- - (16.5)
Loss from disposal of discontinued operations...............................................................................................................................................................................................- - (47.7)
Extraordinary items - early extinguishments of debt.............................................................................................................................................................................................................- - (51.7)
Net loss..............................................................................................................................................................................................................$ (130.6) $ (371.5) $ (143.2)
Basic and diluted loss per common share:Loss from continuing operations................................................................................................................................................................................................$ (2.54) $ (7.25) $ (0.53) Loss from discontinued operations..............................................................................................................................................................................................- - (1.26) Extraordinary items..........................................................................................................................................................................................................- - (1.01) Net loss per common share.....................................................................................................................................................................................................................$ (2.54) $ (7.25) $ (2.80)
Weighted average number of common shares outstanding:
Basic and diluted................................................................................................................................................................................................51,333,647 51,240,225 51,217,997
See Accompanying Notes to Consolidated Financial Statements.
REVLON, INC. AND SUBSIDIARIESCONSOLIDATED STATEMENTS OF OPERATIONS
(dollars in millions, except per share data)
Year Ended December 31,

F-5
REVLON, INC. AND SUBSIDIARIESCONSOLIDATED STATEMENTS OF STOCKHOLDERS' DEFICIENCY AND COMPREHENSIVE LOSS
(dollars in millions)
AccumulatedOther Total
Preferred Common Capital Accumulated Comprehensive Stockholders'Stock Stock Deficiency Deficit Loss (a) Deficiency
Balance, January 1, 1998............................................................................................................................$ 54.6 $ 0.5 $ (231.1) $ (258.8) $ (23.7) $ (458.5) Issuance of common stock.........................................................................................................................2.6 2.6Comprehensive loss:
Net loss.....................................................................................................................................(143.2) (143.2) Adjustment for minimum
pension liability................................................................................................................................................(28.0) (28.0) Revaluation of marketable securities...................................................................................................................................(3.0) (3.0) Currency translation adjustment.................................................................................................................................................(17.9) (b) (17.9)
Total comprehensive loss...................................................................................................................... (192.1)
Balance, December 31, 1998.......................................................................................................................................................................54.6 0.5 (228.5) (402.0) (72.6) (648.0) Issuance of common stock.........................................................................................................................0.1 0.1Comprehensive loss:
Net loss.....................................................................................................................................(371.5) (371.5) Adjustment for minimum
pension liability................................................................................................................................................27.6 27.6 Revaluation of marketable securities...................................................................................................................................(0.8) (0.8) Currency translation adjustment.................................................................................................................................................(22.3) (22.3)
Total comprehensive loss...................................................................................................................... (367.0)
Balance, December 31, 1999.......................................................................................................................................................................54.6 0.5 (228.4) (773.5) (68.1) (1,014.9) Issuance of common stock.........................................................................................................................1.1 1.1Comprehensive loss:
Net loss.....................................................................................................................................(130.6) (130.6) Adjustment for minimum
pension liability................................................................................................................................................1.3 1.3 Loss on marketable securities................................................................................................................................... 3.8 (c) 3.8 Currency translation adjustment.................................................................................................................................................33.2 (c) 33.2
Total comprehensive loss...................................................................................................................... (92.3)
Balance, December 31, 2000.......................................................................................................................................................................$ 54.6 $ 0.5 $ (227.3) $ (904.1) $ (29.8) $ (1,106.1)
____________________(a) Accumulated other comprehensive loss includes unrealized losses on marketable securities of $3.8 and $3.0 for 1999 and 1998, respectively, cumulative net translation losses of $26.2, $59.4 and $37.1 for 2000, 1999 and 1998, respectively, and adjustments for the minimum pension liability of $3.6, $4.9 and $32.5 for 2000, 1999 and 1998, respectively.(b) Accumulated other comprehensive loss and comprehensive loss each include a reclassification adjustment of $2.2 for realized
gains associated with the sale of certain assets outside the United States.(c) Accumulated other comprehensive loss as of December 31, 2000 and comprehensive loss for the year ended December 31, 2000
each include reclassification adjustments of $48.3 and $3.8 for realized losses on foreign currency adjustments associated with the sale of the Company's worldwide professional products line and for marketable securities, respectively.
See Accompanying Notes to Consolidated Financial Statements.

F-6
CASH FLOWS FROM OPERATING ACTIVITIES: 2000 1999 1998Net loss ......................................................................................................................................................................................$ (130.6) $ (371.5) $ (143.2) Adjustments to reconcile net loss to net cash
(used for) provided by operating activities:Depreciation and amortization.......................................................................................................................................126.9 126.1 111.3 Loss from discontinued operations...........................................................................................- - 64.2 Extraordinary items....................................................................................................................................................- - 51.7 (Gain) loss on sale of certain assets, net............................................................................................................................................(13.2) 1.6 (8.4) Change in assets and liabilities, net of acquisitions and dispositions:
Decrease (increase) in trade receivables............................................................................................................29.0 187.1 (43.0) Decrease (increase) in inventories..............................................................................................................32.7 (22.5) (4.6) Decrease (increase) in prepaid expenses and
other current assets....................................................................................................................................18.8 12.6 (11.4) (Decrease) increase in accounts payable..................................................................................................................................................(21.0) 10.8 (49.2) (Decrease) increase in accrued expenses and other
current liabilities...............................................................................................................................................................................................................(81.0) 20.5 52.5 Purchase of permanent displays..................................................................................................................................................(51.4) (66.5) (76.6) Other, net..................................................................................................................................................4.4 19.0 5.2
Net cash used for operating activities..............................................................................................................................................(85.4) (82.8) (51.5)
CASH FLOWS FROM INVESTING ACTIVITIES:Capital expenditures..............................................................................................................................(19.0) (42.3) (60.8) Acquisition of businesses, net of cash acquired............................................. - - (57.6) Proceeds from the sale of certain assets.................................................................................................................. 344.1 1.6 27.4 Acquisition of technology rights..................................................................................................................(3.0) - - Net cash provided by (used for) investing activities.............................................................................................................................................................................322.1 (40.7) (91.0)
CASH FLOWS FROM FINANCING ACTIVITIES:Net (decrease) increase in short-term borrowings - third parties.................................................................................................................................(2.7) 12.3 (16.3) Proceeds from the issuance of long-term debt - third parties....................................................................................................................339.1 574.5 1,469.1Repayment of long-term debt - third parties.............................................................................................................................................(538.7) (464.9) (1,270.9) Net proceeds from issuance of common stock....................................................................................................................................................................................- 0.1 1.1Proceeds from the issuance of debt - affiliates...............................................................................................................................................- 67.1 105.9Repayment of debt - affiliates....................................................................................................................................- (67.1) (105.9) Payment of debt issuance costs.......................................................................................................................................................................- (3.5) (23.9) Net cash (used for) provided by financing activities.................................................................................................................(202.3) 118.5 159.1Effect of exchange rate changes on cash and cash equivalents........................................................(3.5) (4.3) (2.0) Net cash used by discontinued operations......................................................................................................- - (17.3)
Net increase (decrease) in cash and cash equivalents..................................................................................................................................30.9 (9.3) (2.7) Cash and cash equivalents at beginning of period..........................................................................................................................................25.4 34.7 37.4 Cash and cash equivalents at end of period........................................................................................................................................$ 56.3 $ 25.4 $ 34.7
Supplemental schedule of cash flow information:Cash paid during the period for:
Interest ........................................................................................................................................................$ 141.3 $ 146.1 $ 133.4 Income taxes, net of refunds.............................................................................................................4.7 8.2 10.9
Supplemental schedule of noncash investing activities:In connection with business acquisitions, liabilities
were assumed (including minority interest anddiscontinued operations) as follows:Fair value of assets acquired..............................................................................................................$ - $ - $ 74.5Cash paid..................................................................................................................................................- - (57.6) Liabilities assumed................................................................................................................................................................$ - $ - $ 16.9
Supplemental schedule of noncash financing activities:Issuance of common stock ........................................................................................................................................................$ 1.1 $ - $ -
See Accompanying Notes to Consolidated Financial Statements.
REVLON, INC. AND SUBSIDIARIESCONSOLIDATED STATEMENTS OF CASH FLOWS
(dollars in millions)
Year Ended December 31,

F-7
REVLON, INC. AND SUBSIDIARIES NOTES TO CONSOLIDATED FINANCIAL STATEMENTS
(dollars in millions, except per share data) 1. Significant Accounting Policies Principles of Consolidation and Basis of Presentation: Revlon, Inc. (and together with its subsidiaries, the “Company”) conducts its business exclusively through its direct subsidiary, Revlon Consumer Products Corporation and its subsidiaries (“Products Corporation”). The Company manufactures and sells an extensive array of cosmetics and skin care, fragrances and personal care products. Prior to March 30, 2000, the Company sold professional products for use in and resale by professional salons. (See Note 3). On March 30, 2000, the Company sold its professional products line and on May 8, 2000, sold the Plusbelle brand in Argentina. (See Note 3). The Company’s principal customers include large mass volume retailers and chain drug stores, as well as certain department stores and other specialty stores, such as perfumeries. The Company also sells consumer products to United States military exchanges and commissaries and has a licensing group. Unless the context otherwise requires, all references to the Company mean Revlon, Inc. and its subsidiaries. Revlon, Inc., as a public holding company, has no business operations of its own and its only material asset has been all of the outstanding capital stock of Products Corporation. As such, its net (loss) income has historically consisted predominantly of its equity in the net (loss) income of Products Corporation and in 2000, 1999 and 1998 included approximately $1.7, $1.2 and $1.5, respectively, in expenses incidental to being a public holding company. The Consolidated Financial Statements include the accounts of the Company after elimination of all material intercompany balances and transactions. Further, the Company has made a number of estimates and assumptions relating to the reporting of assets and liabilities, the disclosure of liabilities and the reporting of revenues and expenses to prepare these financial statements in conformity with generally accepted accounting principles. Actual results could differ from those estimates. The Company is an indirect majority owned subsidiary of MacAndrews & Forbes Holdings Inc. (“MacAndrews Holdings”), a corporation wholly owned indirectly through Mafco Holdings Inc. (“Mafco Holdings” and, together with MacAndrews Holdings, “MacAndrews & Forbes”) by Ronald O. Perelman. Certain amounts in the prior year financial statements have been reclassified to conform to the current year’s presentation. Cash and Cash Equivalents: Cash equivalents (primarily investments in time deposits, which have original maturities of three months or less) are carried at cost, which approximates fair value. Approximately $22.2 and $15.3 was restricted and supported short-term borrowings at December 31, 2000 and 1999, respectively. (See Note 8). Inventories: Inventories are stated at the lower of cost or market value. Cost is principally determined by the first-in, first-out method. Property, Plant and Equipment and Other Assets: Property, plant and equipment is recorded at cost and is depreciated on a straight-line basis over the estimated useful lives of such assets as follows: land improvements, 20 to 40 years; buildings and improvements, 5 to 50 years; machinery and equipment, 3 to 17 years; and office furniture and fixtures and capitalized software, 2 to 12 years. Leasehold improvements are amortized over their estimated useful lives or the terms of the leases, whichever is shorter. Repairs and maintenance are charged to operations as incurred, and expenditures for additions and improvements are capitalized. At the beginning of the fourth quarter in 2000, the Company decided to consolidate its manufacturing facility in Phoenix, Arizona into its manufacturing facility in Oxford, North Carolina. The Phoenix manufacturing
F-8
facility is expected to remain operational until June 30, 2001, and certain other operations may remain thereafter under a leaseback agreement. As a result, the Company is depreciating the net book value of the facility in excess of its estimated salvage value, over its remaining nine-month useful life. Included in other assets are permanent displays amounting to approximately $111.6 and $131.2 (net of amortization) as of December 31, 2000 and 1999, respectively, which are amortized over 3 to 5 years. In addition, the Company has included in other assets charges related to the issuance of its debt instruments amounting to approximately $19.0 and $21.0 (net of amortization) as of December 31, 2000 and 1999, respectively, which are amortized over the terms of the related debt instruments. Intangible Assets Related to Businesses Acquired: Intangible assets related to businesses acquired principally represent goodwill, the majority of which is being amortized on a straight-line basis over 40 years. The Company evaluates, when circumstances warrant, the recoverability of its intangible assets on the basis of undiscounted cash flow projections. When impairment is indicated, the Company writes down recorded amounts of goodwill to the estimated amount of undiscounted cash flows. Accumulated amortization aggregated $110.0 and $128.0 at December 31, 2000 and 1999, respectively. Revenue Recognition: The Company recognizes net sales upon shipment of merchandise. Net sales comprise gross revenues less expected returns, trade discounts and customer allowances. The Company records sales returns as a reduction to sales, cost of sales and accounts receivable and an increase to inventory. Cost of sales includes the cost of refurbishment of returned products. Income Taxes: Income taxes are calculated using the liability method in accordance with the provisions of Statement of Financial Accounting Standards (“SFAS”) No. 109, “Accounting for Income Taxes.” Revlon, Inc., for federal income tax purposes, is included in the affiliated group of which Mafco Holdings is the common parent, and Revlon, Inc.’s federal taxable income and loss is included in such group’s consolidated tax return filed by Mafco Holdings. Revlon, Inc. also may be included in certain state and local tax returns of Mafco Holdings or its subsidiaries. For all periods presented, federal, state and local income taxes are provided as if the Company filed its own income tax returns. On June 24, 1992, Holdings (as hereinafter defined), the Company and certain of its subsidiaries and Mafco Holdings entered into a tax sharing agreement, which is described in Notes 11 and 14. Pension and Other Postretirement and Postemployment Benefits: The Company sponsors pension and other retirement plans in various forms covering substantially all employees who meet eligibility requirements. For plans in the United States, the minimum amount required pursuant to the Employee Retirement Income Security Act, as amended, is contributed annually. Various subsidiaries outside the United States have retirement plans under which funds are deposited with trustees or reserves are provided. The Company accounts for benefits such as severance, disability and health insurance provided to former employees prior to their retirement when it is probable that a liability has been incurred and the amount of such liability can be reasonably estimated. Research and Development: Research and development expenditures are expensed as incurred. The amounts charged against earnings in 2000, 1999 and 1998 were $27.3, $32.9 and $31.9, respectively.

F-9
Foreign Currency Translation: Assets and liabilities of foreign operations are generally translated into United States dollars at the rates of exchange in effect at the balance sheet date. Income and expense items are generally translated at the weighted average exchange rates prevailing during each period presented. Gains and losses resulting from foreign currency transactions are included in the results of operations. Gains and losses resulting from translation of financial statements of foreign subsidiaries and branches operating in non-hyperinflationary economies are recorded as a component of accumulated other comprehensive loss until either sale or upon complete or substantially complete liquidation by the Company of its investment in a foreign entity. Foreign subsidiaries and branches operating in hyperinflationary economies translate nonmonetary assets and liabilities at historical rates and include translation adjustments in the results of operations. In 1998, the Company’s operations in Mexico were accounted for as operating in a hyperinflationary economy. Effective January 1, 1999, the Company’s operations in Mexico have been accounted for as operating in a non-hyperinflationary economy. The impact of the change in accounting for Mexico was not material to the Company’s operating results in 1999. Sale of Subsidiary Stock: The Company recognizes gains and losses on sales of subsidiary stock in its Consolidated Statements of Operations. Basic and Diluted (Loss) Income per Common Share and Classes of Stock: The basic (loss) income per common share has been computed based upon the weighted average number of shares of common stock outstanding during each of the periods presented. Diluted (loss) income per common share has been computed based upon the weighted average number of shares of common stock outstanding. The Company’s outstanding stock options represent the only potential dilutive common stock outstanding. The number of shares used in the calculation of basic and diluted loss per common share was the same in each period presented, as it does not include any incremental shares that would have been outstanding assuming the exercise of stock options because the effect of those incremental shares would have been antidilutive. For each period presented, the amount of loss used in the calculation of diluted loss per common share was the same as the amount of loss used in the calculation of basic loss per common share. The Revlon, Inc. Class A Common Stock, par value $.01 per share (the “Class A Common Stock”) and the Revlon, Inc. Class B Common Stock, par value $.01 per share (the “Class B Common Stock”) (collectively with the Class A Common Stock, the “Common Stock”) vote as a single class on all matters, except as otherwise required by law, with each share of Class A Common Stock entitling its holder to one vote and each share of the Class B Common Stock entitling its holder to ten votes. All of the shares of Class B Common Stock are owned by REV Holdings Inc. (“REV Holdings”), an indirect wholly-owned subsidiary of Mafco Holdings. Mafco Holdings beneficially owns shares of Common Stock having approximately 97.3% of the combined voting power of the outstanding shares of Common Stock. The holders of the Company’s two classes of common stock are entitled to share equally in the earnings of the Company from dividends, when and if declared by the Board. Each outstanding share of Class B Common Stock is convertible into one share of Class A Common Stock. The Company designated 1,000 shares of Preferred Stock as the Series A Preferred Stock, of which 546 shares are outstanding and held by REV Holdings. The holder of Series A Preferred Stock is not entitled to receive any dividends. The Series A Preferred Stock is entitled to a liquidation preference of $100,000 per share before any distribution is made to the holders of Common Stock. The holder of the Series A Preferred Stock does not have any voting rights, except as required by law. The Series A Preferred Stock may be redeemed at any time by the Company, at its option, for $100,000 per share. However, the terms of Products Corporation’s various debt agreements currently restrict Revlon, Inc.’s ability to effect such redemption by generally restricting the amount of dividends or distributions Products Corporation can pay to Revlon, Inc.

F-10
Stock-Based Compensation: SFAS No. 123, “Accounting for Stock-Based Compensation,” encourages, but does not require companies to record compensation cost for stock-based employee compensation plans at fair value. The Company has chosen to account for stock-based compensation plans using the intrinsic value method prescribed in Accounting Principles Board (“APB”) Opinion No. 25, “Accounting for Stock Issued to Employees,” and related interpretations including FASB Interpretation No. 44, “Accounting for Certain Transactions Involving Stock Compensation, an Interpretation of APB No. 25” issued in March 2000. Accordingly, compensation cost for stock options issued to employees is measured as the excess, if any, of the quoted market price of the Company’s stock at the date of the grant over the amount an employee must pay to acquire the stock. (See Note 13). Derivative Financial Instruments: Derivative financial instruments, such as forward exchange and option contracts, are utilized from time to time by the Company to reduce interest rate and foreign exchange risks. The Company maintains a control environment, which includes policies and procedures for risk assessment and the approval, reporting and monitoring of derivative financial instrument activities. The Company does not hold or issue derivative financial instruments for trading purposes. The differentials to be received or paid under interest rate contracts designated as hedges are recognized in income over the life of the contracts as adjustments to interest expense. Gains and losses on terminations of interest rate contracts designated as hedges are deferred and amortized into interest expense over the remaining life of the original contracts or until repayment of the hedged indebtedness. Unrealized gains and losses on outstanding contracts designated as hedges are not recognized. To qualify for hedge accounting, a contract must meet defined correlation and effectiveness criteria, be designated as a hedge and result in cash flows and financial statement effects that substantially offset those of the position being hedged. Derivative financial instruments that the Company temporarily continues to hold after the early termination of a hedged position, or that otherwise no longer qualify for hedge accounting, are marked-to-market, with gains and losses recognized in the Company’s Statements of Operations after the termination or disqualification. Gains and losses on contracts designated to hedge identifiable foreign currency commitments are deferred and accounted for as part of the related foreign currency transaction. Transaction gains and losses have not been material.
In June 1998 and June 2000, the FASB issued SFAS No. 133, “Accounting for Derivative Instruments and Hedging Activities” and SFAS No. 138, “Accounting for Certain Derivative Instruments and Certain Hedging Activities (an amendment of FASB Statement No. 133).” These statements establish accounting and reporting standards requiring that every derivative instrument be recorded on the balance sheet as either an asset or liability measured at its fair value. SFAS Nos. 133 and 138 also require that changes in the derivative’s fair value be recognized currently in earnings unless specific hedge accounting criteria are met. SFAS Nos. 133 and 138 are effective for fiscal years beginning after June 15, 2000. The adoption of SFAS Nos. 133 and 138 on January 1, 2001 did not have an effect on the Company’s consolidated financial statements. Advertising and Promotion: Costs associated with advertising and promotion are expensed in the year incurred. Advertising and promotion expenses were $290.9, $411.8 and $422.9 for 2000, 1999 and 1998, respectively. Distribution Costs: Costs, such as freight and handling costs, associated with distribution are expensed within selling, general and administrative expenses when incurred. Distribution costs were $78.3, $102.7 and $112.8 for 2000, 1999 and 1998, respectively.

F-11
2. Restructuring Costs and Other, Net
Since 1998, the Company has been continuously evaluating its organizational structure and has implemented a number of restructuring plans.
In the fourth quarter of 1998, the Company executed a plan to realign and reduce personnel, exit excess leased real estate, realign and consolidate regional activities, reconfigure certain manufacturing operations and exit certain product lines (the “1998 Restructuring Plan”). The cost of the 1998 Restructuring Plan resulted in a charge of $44.2 in 1998 and an additional net charge of $20.5 through the nine-month period ended September 30, 1999, principally for employee severance and other personnel benefits and obligations for excess leased real estate primarily in the United States. In 1999, the Company exited a non-core business for which it recorded a charge of $1.6, which was included in restructuring costs and other, net. In 1998, the Company recognized $8.4 of gains on sales of certain non-core assets. In the fourth quarter of 1999, the Company began a new restructuring program principally for additional employee severance and other personnel benefits and to restructure certain operations outside the United States, including certain operations in Japan (the “1999 Restructuring Plan”). The cost of the 1999 Restructuring Plan resulted in a charge of $18.1 in the fourth quarter of 1999. In the first half of 2000, the Company recorded a charge of $14.6 relating to the 1999 Restructuring Plan.
During the third quarter of 2000, the Company continued to re-evaluate its organizational structure. As part of this re-evaluation, the Company developed a new restructuring plan designed to improve profitability by reducing personnel and consolidating manufacturing facilities (the “2000 Restructuring Plan”). The 2000 Restructuring Plan focused on the Company’s plans to close its manufacturing operations in Phoenix, Arizona and Mississauga, Canada and to consolidate its production into its plant in Oxford, North Carolina. The 2000 Restructuring Plan also includes the remaining obligation for excess leased real estate in the Company’s headquarters, consolidation costs associated with the Company closing its facility in New Zealand, and the elimination of several domestic and international executive and operational positions, both of which were effected to reduce and streamline corporate overhead costs. In the third and fourth quarters of 2000, the Company recorded charges of $13.7 and $25.8, respectively, related to the 2000 Restructuring Plan, principally for additional employee severance and other personnel benefits and to consolidate worldwide operations.
In connection with the 1998 Restructuring Plan, the 1999 Restructuring Plan and the 2000 Restructuring
Plan, 1,213 employees, 403 employees and 1,697 employees, respectively, were included in the Company’s restructuring charges. Of the 1,697 employees for whom severance and other personnel benefits were included in the restructuring charges in 2000, the Company had terminated 380 employees by December 31, 2000. All employees from the 1998 Restructuring Plan and substantially all the employees from the 1999 Restructuring Plan have been terminated as of December 31, 2000.
The cash and noncash elements of the restructuring charges recorded in 2000 approximate $53.2 and $0.9, respectively, and in 1999 approximated $38.8 and $1.4, respectively.

F-12
Details of the charges are as follows:
Balance BalanceBeginning Expense (Utilized) Received End
of Year (Income) Cash Noncash of Year
2000Employee severance and other
personnel benefits..........................................................................................................................$ 24.6 $ 44.6 $ (39.5) $ (1.1) $ 28.6Factory, warehouse, office and
other costs........................................................................................................................................................................9.4 9.5 (6.3) (5.2) 7.4 $ 34.0 $ 54.1 $ (45.8) $ (6.3) $ 36.0
1999Employee severance and other
personnel benefits..........................................................................................................................$ 24.9 $ 35.3 $ (35.6) $ - $ 24.6Factory, warehouse, office and
other costs........................................................................................................................................................................12.1 4.9 (6.2) (1.4) 9.4 $ 37.0 $ 40.2 $ (41.8) $ (1.4) $ 34.0
1998Employee severance and other
personnel benefits......................................................................................................$ 7.8 $ 26.6 $ (9.5) $ - $ 24.9Factory, warehouse, office and
other costs.......................................................................................................................3.2 14.9 (2.4) (3.6) 12.1 Sale of assets............................................................................................................................- (8.4) 8.4 - - Other (expense included in cost of sales)..............................................................................................................................................- 2.7 - (2.7) -
$ 11.0 $ 35.8 $ (3.5) $ (6.3) $ 37.0
As of December 31, 2000 and 1999, the unpaid balance of the restructuring costs are included in accrued expenses and other and other long-term liabilities in the Company’s Consolidated Balance Sheets. 3. Acquisitions of Businesses and Dispositions of Product Line and Brand In 1998, the Company consummated acquisitions for a combined purchase price of $62.6, with resulting goodwill of $63.7. These acquisitions were not significant to the Company’s results of operations. There were no acquisitions made by the Company in 2000 and 1999.
On March 30, 2000, Products Corporation completed the disposition of its worldwide professional products line, including professional hair care for use in and resale by professional salons, ethnic hair and personal care products, Natural Honey skin care and certain regional toiletries brands, for $315 in cash, before adjustments, plus $10 in purchase price payable in the future, contingent upon the purchasers’ achievement of certain rates of return on their investment. The disposition involved the sale of certain of Products Corporation’s subsidiaries throughout the world devoted to the professional products line, as well as assets dedicated exclusively or primarily to the lines being disposed. The worldwide professional products line was purchased by a company formed by CVC Capital Partners, the Colomer family and other investors, led by Carlos Colomer, a former manager of the line that was sold, following arms’-length negotiation of the terms of the purchase agreement therefor, including the determination of the amount of the consideration. In connection with the disposition, the Company recognized a pre-tax and after-tax gain of $14.8. Approximately $150.3 of the Net Proceeds (as defined in the Credit Agreement) were used to reduce the aggregate commitment under the Credit Agreement (as hereinafter defined).

F-13
On May 8, 2000, Products Corporation completed the disposition of the Plusbelle brand in Argentina for $46.2 in cash. Approximately $20.7 of the Net Proceeds were used to reduce the aggregate commitment under the Credit Agreement. In connection with the disposition, the Company recognized a pre-tax and after-tax loss of $4.8. The following represents summary unaudited pro forma information of the Company’s results of operations, which excludes the results of operations of the worldwide professional products line and the Plusbelle brand in Argentina.
2000 1999Net sales.......................................................................................................................................................................................................$ 1,395.3 $ 1,470.9Operating income (loss) .................................................................................................................................................................................................................10.4 (237.9)
Year Ended December 31,
4. Inventories
December 31,2000 1999
Raw materials and supplies................................................................................................................................................ $ 56.2 $ 74.1Work-in-process..................................................................................................................................................................................9.4 19.7Finished goods....................................................................................................................................................................................................119.1 184.5
$ 184.7 $ 278.3
5. Prepaid Expenses and Other December 31,
2000 1999Prepaid expenses......................................................................................................................................................................$ 22.8 $ 36.7Asset held for sale.............................................................................................................................................................................................................29.0 - Other.............................................................................................................................................................................................................14.3 14.6
$ 66.1 $ 51.3
In the fourth quarter of 2000, the Company listed for sale land in Minami Aoyama near Tokyo, Japan and related rights for the construction of a building on such land (the “Aoyama Property”). The Company recorded a charge, included in selling, general and administrative expenses, of approximately $9.4 to reduce the net book value of the asset held for sale to its estimated net realizable value of ¥ 3.3 billion. (See Note 21).
6. Property, Plant and Equipment, Net December 31,
2000 1999Land and improvements..............................................................................................................................................................................................$ 13.5 $ 41.3Buildings and improvements.................................................................................................................................................................................129.3 174.1Machinery and equipment...................................................................................................................................................................179.2 222.9Office furniture and fixtures and capitalized software....................................................................................................................................................................................107.0 112.5Leasehold improvements.................................................................................................................................................................................................22.7 28.1Construction-in-progress..........................................................................................................................................................................................11.2 16.0
462.9 594.9Accumulated depreciation............................................................................................................................................................................................................(241.2) (258.5)
$ 221.7 $ 336.4
Depreciation expense for the years ended December 31, 2000, 1999 and 1998 was $42.4, $45.9 and $40.5, respectively.

F-14
7. Accrued Expenses and Other
December 31,2000 1999
Advertising and promotional costs and accrual for sales returns...............................................................................................................................................................$ 120.9 $ 183.5Compensation and related benefits...................................................................................................................................................................70.5 83.9Interest.......................................................................................................................................................................................39.9 38.1Taxes, other than federal income taxes.......................................................................................................................................................................................5.6 18.8Restructuring costs....................................................................................................................................................................................................32.2 31.4Other...................................................................................................................................................................................................40.8 54.0
$ 309.9 $ 409.7
8. Short-term Borrowings Products Corporation had outstanding short-term bank borrowings (excluding borrowings under the Credit Agreement) aggregating $30.7 and $37.6 at December 31, 2000 and 1999, respectively. Interest rates on amounts borrowed under such short-term lines at December 31, 2000 and 1999 ranged from 5.5% to 10.3% and from 3.1% to 6.8%, respectively, excluding Latin American countries in which the Company had outstanding borrowings of approximately $4.9 and $8.3 at December 31, 2000 and 1999, respectively. Compensating balances at December 31, 2000 and 1999 were approximately $22.2 and $15.3, respectively. Interest rates on compensating balances at December 31, 2000 and 1999 ranged from 1.5% to 6.5% and 1.5% to 4.7%, respectively. 9. Long-term Debt
December 31,2000 1999
Working capital lines (a)............................................................................................................................................................... $ 389.7 $ 588.2Bank mortgage loan agreement due 2000 (b).............................................................................................................................. - 9.9 8 1/8% Senior Notes due 2006 (c).............................................................................................................................................. 249.5 249.49% Senior Notes due 2006 (d).......................................................................................................................................................................... 250.0 250.08 5/8% Senior Subordinated Notes due 2008 (e)................................................................................................................................................ 649.8 649.8Advances from Holdings (f)................................................................................................................................................... 24.1 24.1Notes payable due through 2004 ............................................................................................................................................................ - 0.7
1,563.1 1,772.1Less current portion........................................................................................................................................................................................ - (10.2)
$ 1,563.1 $ 1,761.9
(a) In May 1997, Products Corporation entered into a credit agreement (as subsequently amended, the “Credit Agreement”) with a syndicate of lenders, whose individual members change from time to time. The Credit Agreement provides up to $518.5 at December 31, 2000 and consists of five senior secured facilities: $106.2 in two term loan facilities (the “Term Loan Facilities”), a $300.0 multi-currency facility (the “Multi-Currency Facility”), and a $62.3 revolving acquisition facility, (the “Acquisition Facility”), and a $50.0 special standby letter of credit facility (the “Special LC Facility”) (the “Special LC Facility” and together with the Term Loan Facilities, the Multi-Currency Facility and the Acquisition Facility, the “Credit Facilities”). The Company under certain circumstances and with the consent of a majority of the lenders may increase the Acquisition Facility to $262.3. The Multi-Currency Facility is available (i) to Products Corporation in revolving credit loans denominated in U.S. dollars (the “Revolving Credit Loans”), (ii) to Products Corporation in standby and commercial letters of credit denominated in U.S. dollars (the “Operating Letters of Credit”) and (iii) to Products Corporation and certain of its international subsidiaries designated from time to time in revolving credit loans and bankers’ acceptances denominated in U.S. dollars and other currencies (the “Local Loans”). At December 31, 2000 and 1999, Products Corporation had approximately $106.2 and $198.0, respectively, outstanding under the Term Loan Facilities, $221.2 and $235.2, respectively, outstanding under the Multi-Currency Facility, $62.3 and $155.0, respectively, outstanding under the Acquisition Facility and $22.6 and $29.8, respectively, of issued but undrawn

F-15
letters of credit under the Special LC Facility. The scheduled reductions of the Acquisition Facility are $48.8 during 2001. The balance of the Acquisition Facility, along with the Term Loan Facilities, the Multi-Currency Facility and the Special LC Facility mature in May 2002. The Credit Facilities (other than loans in foreign currencies) bear interest as of December 31, 2000 at a rate equal to, at Products Corporation’s option, either (A) the Alternate Base Rate plus 2.50% (or 3.50% for Local Loans); or (B) the Eurodollar Rate plus 3.50%. Loans in foreign currencies bear interest as of December 31, 2000 at a rate equal to the Eurocurrency Rate or, in the case of Local Loans, the local lender rate, in each case plus 3.50%. Products Corporation pays the lender a commitment fee as of December 31, 2000 of 1/2 of 1% of the unused portion of the Credit Facilities. Under the Multi-Currency Facility, the Company pays the lenders an administrative fee of 1/4% per annum on the aggregate principal amount of specified Local Loans. Products Corporation also paid certain facility and other fees to the lenders and agents upon closing of the Credit Agreement. Prior to its termination date, the commitments under the Credit Facilities will be reduced by: (i) the net proceeds in excess of $10.0 each year received during such year from sales of assets by Holdings (or certain of its subsidiaries), Products Corporation or any of its subsidiaries (and $25.0 in the aggregate during the term with respect to certain specified dispositions), subject to certain limited exceptions, (ii) certain proceeds from the sales of collateral security granted to the lenders, (iii) the net proceeds from the issuance by Products Corporation or any of its subsidiaries of certain additional debt, (iv) 50% of the excess cash flow of Products Corporation and its subsidiaries (unless certain leverage ratios are attained) and (v) certain scheduled reductions in the case of the Term Loan Facilities, which commenced on May 31, 1998, in the aggregate amount of $1.0 annually over the remaining life of the Credit Agreement, and in the case of the Acquisition Facility which commenced on December 31, 1999, in the amount of $25.0 and, as of December 31, 2000, in the amounts of $32.4 during 2000, $48.8 during 2001 and the balance at maturity in May 2002 after giving effect to commitment reductions resulting from the sale of the worldwide professional products line and the Plusbelle brand in Argentina. The Credit Agreement will terminate on May 30, 2002. The weighted average interest rates on the Term Loan Facilities, the Multi-Currency Facility and the Acquisition Facility were 10.2%, 9.7% and 10.3% at December 31, 2000, respectively, 9.9%, 8.1% and 9.8% at December 31, 1999, respectively, and 8.1%, 9.2% and 8.7% at December 31, 1998, respectively. The Credit Facilities, subject to certain exceptions and limitations, are supported by guarantees from Revlon Holdings Inc., the Company’s indirect parent, (“Holdings”) and certain of its subsidiaries, Revlon, Inc., Products Corporation and the domestic subsidiaries of Products Corporation. The obligations of Products Corporation under the Credit Facilities and the obligations under the aforementioned guarantees are secured, subject to certain limitations, by (i) a mortgage on Products Corporation’s Phoenix, Arizona facility and a mortgage on Products Corporation’s facility in Oxford, North Carolina (which has been put in place pursuant to the Seventh Amendment); (ii) the capital stock of Products Corporation and its domestic subsidiaries, 66% of the capital stock of its first tier foreign subsidiaries and the capital stock of certain subsidiaries of Holdings; (iii) domestic intellectual property and certain other domestic intangibles of (A) Products Corporation and its domestic subsidiaries and (B) certain subsidiaries of Holdings; (iv) domestic inventory and accounts receivable of (A) Products Corporation and its domestic subsidiaries and (B) certain subsidiaries of Holdings; and (v) the assets of certain foreign subsidiary borrowers under the Multi-Currency Facility (to support their borrowings only). The Credit Agreement provides that the liens on the stock and personal property referred to above may be shared from time to time with specified types of other obligations incurred or guaranteed by Products Corporation, such as interest rate hedging obligations and working capital lines. The Credit Agreement contains various material restrictive covenants prohibiting Products Corporation from (i) incurring additional indebtedness or guarantees, with certain exceptions, (ii) making dividend, tax sharing and other payments or loans to Revlon, Inc. or other affiliates, with certain exceptions, including among others, permitting Products Corporation to pay dividends and make distributions to Revlon, Inc., among other things, to enable Revlon, Inc. to pay expenses incidental to being a public holding company, including, among other things, professional fees such as legal and accounting, regulatory fees such as Securities and Exchange Commission (“Commission”) filing fees and other miscellaneous expenses related to being a public holding company, and to pay dividends or make distributions in certain circumstances to finance the purchase by Revlon, Inc. of its Class A Common Stock in connection with the delivery of such common stock to grantees under any stock option plan, provided that the aggregate amount of such dividends and distributions taken together with any purchases of Revlon, Inc. common stock on the market to satisfy matching obligations under an excess savings plan may not exceed $6.0 per annum, (iii) creating liens or other encumbrances on their assets or revenues, granting negative pledges or selling or transferring any of their assets except in the ordinary course of business, all subject to certain limited exceptions, (iv) with certain exceptions, engaging in merger or acquisition transactions, (v) prepaying indebtedness, subject to

F-16
certain limited exceptions, (vi) making investments, subject to certain limited exceptions, and as described below and (vii) entering into transactions with affiliates of Products Corporation other than upon terms no less favorable to Products Corporation or its subsidiaries than it would obtain in an arms’-length transaction. In addition to the foregoing, the Credit Agreement contains financial covenants requiring Products Corporation to maintain minimum cumulative EBITDA for each quarter end during 2001, minimum interest coverage in 2002, covenants that limit the leverage ratio of Products Corporation in 2002, and covenants that limit the amount of capital expenditures.
The events of default under the Credit Agreement include a Change of Control (as defined in the Credit Agreement) of Products Corporation and other customary events of default for such types of agreements. On November 10, 1999, the Credit Agreement was amended to (i) eliminate the interest coverage ratio and leverage ratio covenants from the quarter ended September 30, 1999 through the year 2000 and to modify those covenants for the years 2001 and 2002; (ii) add a minimum EBITDA covenant for each quarter end during the year 2000; (iii) limit the amount that Products Corporation may spend for capital expenditures and investments including acquisitions; (iv) permit the sale of Products Corporation's worldwide professional products line and its non-core Latin American brands, Colorama, Juvena, Bozzano and Plusbelle (such sales, the "Asset Sales"); (v) change the reduction of the aggregate commitment that is required upon consummation of any Asset Sale to an amount equal to 60% of the Net Proceeds (as defined in the Credit Agreement) from such Asset Sale as opposed to 100% of such Net Proceeds as provided under the Credit Agreement prior to the amendment; (vi) increase the “applicable margin” by 3/4 of 1%; and (vii) permit the amendment of a yen-denominated credit agreement (the “Yen Credit Agreement”). On March 30, 2000, approximately 60% of the $250.5 in Net Proceeds (as that term is defined in the Credit Agreement) from the sale of its worldwide professional products line was used to permanently reduce the aggregate commitment under the Credit Agreement. On May 8, 2000, approximately 60% of the $34.5 in Net Proceeds from the sale of the Plusbelle brand in Argentina were used to permanently reduce the aggregate commitment under the Credit Agreement.
In January 2001 (effective December 31, 2000), Products Corporation and its bank lenders entered into an amendment to the Credit Agreement, effective December 31, 2000 to (i) eliminate the interest coverage ratio and leverage ratio covenants for 2001; (ii) add a minimum cumulative EBITDA covenant for each quarter end during 2001; (iii) modify the definition of EBITDA beginning with the quarterly period ended December 31, 2000; (iv) limit the amount that Products Corporation may spend for capital expenditures; (v) permit the sale of certain of Products Corporation's non-core assets; (vi) permit Products Corporation to retain 100% of the Net Proceeds (as defined in the Credit Agreement) from such asset sales; (vii) increase the "applicable margin" by 1/2 of 1%; and (viii) require Products Corporation to provide a mortgage on its facility in Oxford, North Carolina as security for its obligations under the Credit Agreement. (b) The Pacific Finance & Development Corp., a wholly-owned subsidiary of Products Corporation, was the borrower under the Yen Credit Agreement. In March 2000, the outstanding balance under the Yen Credit Agreement was repaid in accordance with its terms. (c) The 8 1/8% Notes due 2006 (the “8 1/8% Notes”) are senior unsecured obligations of Products Corporation and rank pari passu in right of payment with all existing and future Senior Debt (as defined in the indenture relating to the 8 1/8% Notes (the “8 1/8% Notes Indenture”)) of Products Corporation, including the 9% Notes and the indebtedness under the Credit Agreement, and are senior to the 8 5/8% Notes and to all future subordinated indebtedness of Products Corporation. The 8 1/8% Notes are effectively subordinated to the outstanding indebtedness and other liabilities of Products Corporation’s subsidiaries. Interest is payable on February 1 and August 1. The 8 1/8% Notes may be redeemed at the option of Products Corporation in whole or from time to time in part at any time on or after February 1, 2002 at the redemption prices set forth in the 8 1/8% Notes Indenture plus accrued and unpaid interest, if any, to the date of redemption. Upon a Change of Control (as defined in the 8 1/8% Notes Indenture), Products Corporation will have the option to redeem the 8 1/8% Notes in whole at a redemption price equal to the principal amount thereof, plus accrued and unpaid interest, if any, thereon to the date of redemption plus the Applicable Premium (as defined in the 8 1/8% Notes Indenture) and, subject to certain conditions, each holder of the 8 1/8% Notes will have the right to
F-17
require Products Corporation to repurchase all or a portion of such holder’s 8 1/8% Notes at a price equal to 101% of the principal amount thereof, plus accrued and unpaid interest, if any, thereon to the date of repurchase. The 8 1/8% Notes Indenture contains covenants that, among other things, limit (i) the issuance of additional debt and redeemable stock by Products Corporation, (ii) the incurrence of liens, (iii) the issuance of debt and preferred stock by Products Corporation’s subsidiaries, (iv) the payment of dividends on capital stock of Products Corporation and its subsidiaries and the redemption of capital stock of Products Corporation and certain subordinated obligations, (v) the sale of assets and subsidiary stock, (vi) transactions with affiliates and (vii) consolidations, mergers and transfers of all or substantially all Products Corporation’s assets. The 8 1/8% Notes Indenture also prohibits certain restrictions on distributions from subsidiaries. All of these limitations and prohibitions, however, are subject to a number of important qualifications. (d) The 9% Senior Notes due 2006 (the “9% Notes”) are senior unsecured obligations of Products Corporation and rank pari passu in right of payment with all existing and future Senior Debt (as defined in the indenture relating to the 9% Notes (the “9% Notes Indenture”)) of Products Corporation, including the 8 1/8% Notes and the indebtedness under the Credit Agreement, and are senior to the 8 5/8% Notes and to all future subordinated indebtedness of Products Corporation. The 9% Notes are effectively subordinated to outstanding indebtedness and other liabilities of Products Corporation’s subsidiaries. Interest is payable on May 1 and November 1. The 9% Notes may be redeemed at the option of Products Corporation in whole or from time to time in part at any time on or after November 1, 2002 at the redemption prices set forth in the 9% Notes Indenture plus accrued and unpaid interest, if any, to the date of redemption. In addition, at any time prior to November 1, 2001, Products Corporation may redeem up to 35% of the aggregate principal amount of the 9% Notes originally issued at a redemption price of 109% of the principal amount thereof, plus accrued and unpaid interest, if any, thereon to the date fixed for redemption, with, and to the extent Products Corporation receives, the net cash proceeds of one or more Public Equity Offerings (as defined in the 9% Notes Indenture), provided that at least $162.5 aggregate principal amount of the 9% Notes remains outstanding immediately after the occurrence of each such redemption. Upon a Change in Control (as defined in the 9% Notes Indenture), Products Corporation will have the option to redeem the 9% Notes in whole at a redemption price equal to the principal amount thereof, plus accrued and unpaid interest, if any, thereon to the date of redemption plus the Applicable Premium (as defined in the 9% Notes Indenture) and, subject to certain conditions, each holder of the 9% Notes will have the right to require Products Corporation to repurchase all or a portion of such holder’s 9% Notes at a price equal to 101% of the principal amount thereof, plus accrued and unpaid interest, if any, thereon to the date of repurchase.
The 9% Notes Indenture contains covenants that, among other things, limit (i) the issuance of additional debt and redeemable stock by Products Corporation, (ii) the incurrence of liens, (iii) the issuance of debt and preferred stock by Products Corporation’s subsidiaries, (iv) the payment of dividends on capital stock of Products Corporation and its subsidiaries and the redemption of capital stock of Products Corporation and certain subordinated obligations, (v) the sale of assets and subsidiary stock, (vi) transactions with affiliates and (vii) consolidations, mergers and transfers of all or substantially all Products Corporation’s assets. The 9% Notes Indenture also prohibits certain restrictions on distributions from subsidiaries. All of these limitations and prohibitions, however, are subject to a number of important qualifications. (e) The 8 5/8% Notes due 2008 (the “8 5/8% Notes”) are general unsecured obligations of Products Corporation and are (i) subordinate in right of payment to all existing and future Senior Debt (as defined in the indenture relating to the 8 5/8% Notes (the “8 5/8% Notes Indenture”)) of Products Corporation, including the 9% Notes, the 8 1/8% Notes and the indebtedness under the Credit Agreement, (ii) pari passu in right of payment with all future senior subordinated debt, if any, of Products Corporation and (iii) senior in right of payment to all future subordinated debt, if any, of Products Corporation. The 8 5/8% Notes are effectively subordinated to the outstanding indebtedness and other liabilities of Products Corporation’s subsidiaries. Interest is payable on February 1 and August 1. The 8 5/8% Notes may be redeemed at the option of Products Corporation in whole or from time to time in part at any time on or after February 1, 2003 at the redemption prices set forth in the 8 5/8% Notes Indenture plus accrued and unpaid interest, if any, to the date of redemption.

F-18
Upon a Change of Control (as defined in the 8 5/8% Notes Indenture), Products Corporation will have the option to redeem the 8 5/8% Notes in whole at a redemption price equal to the principal amount thereof, plus accrued and unpaid interest, if any, thereon to the date of redemption plus the Applicable Premium (as defined in the 8 5/8% Notes Indenture) and, subject to certain conditions, each holder of the 8 5/8% Notes will have the right to require Products Corporation to repurchase all or a portion of such holder’s 8 5/8% Notes at a price equal to 101% of the principal amount thereof, plus accrued and unpaid interest, if any, thereon to the date of repurchase. The 8 5/8% Notes Indenture contains covenants that, among other things, limit (i) the issuance of additional debt and redeemable stock by Products Corporation, (ii) the incurrence of liens, (iii) the issuance of debt and preferred stock by Products Corporation’s subsidiaries, (iv) the payment of dividends on capital stock of Products Corporation and its subsidiaries and the redemption of capital stock of Products Corporation, (v) the sale of assets and subsidiary stock, (vi) transactions with affiliates, (vii) consolidations, mergers and transfers of all or substantially all of Products Corporation’s assets and (viii) the issuance of additional subordinated debt that is senior in right of payment to the 8 5/8% Notes. The 8 5/8% Notes Indenture also prohibits certain restrictions on distributions from subsidiaries. All of these limitations and prohibitions, however, are subject to a number of important qualifications. The 8 1/8% Notes Indenture, the 8 5/8% Notes Indenture and the 9% Notes Indenture contain customary events of default for debt instruments of such type. (f) During 1992, Holdings made an advance of $25.0 to Products Corporation, evidenced by subordinated noninterest-bearing demand notes. The notes were subsequently adjusted by offsets and additional amounts loaned by Holdings to Products Corporation. In 1998, approximately $6.8 due to Products Corporation from Holdings was offset against the notes payable to Holdings. At December 31, 2000, the balance of $24.1 is evidenced by noninterest-bearing promissory notes payable to Holdings that are subordinated to Products Corporation’s obligations under the Credit Agreement. (g) Products Corporation borrows funds from its affiliates from time to time to supplement its working capital borrowings. No such borrowings were outstanding as of December 31, 2000 or 1999. The interest rates for such borrowings are more favorable to Products Corporation than interest rates under the Credit Agreement and, for borrowings occurring prior to the execution of the Credit Agreement, the credit facilities in effect at the time of such borrowing. The amount of interest paid by Products Corporation for such borrowings for 2000, 1999 and 1998 was nil, $0.5 and $0.8, respectively. The aggregate amounts of long-term debt maturities (at December 31, 2000), in the years 2001 through 2005 are nil, $413.8, nil, nil and nil, respectively, and $1,149.3 thereafter. The Company expects that cash flows from operations, net proceeds from the sale of certain non-core assets (or financial support from an affiliate, if such asset sales are not completed on a timely basis) and borrowings under the Credit Agreement will be sufficient to enable the Company to meet its anticipated cash requirements during 2001 on a consolidated basis, including for debt service and expenses in connection with the Company’s restructuring plans. However, there can be no assurance that the combination of cash flow from operations, net proceeds from the sale of certain non-core assets (or from such financial support) and borrowings under the Credit Agreement will be sufficient to meet the Company's cash requirements on a consolidated basis. If the Company is unable to satisfy such cash requirements, the Company could be required to adopt one or more alternatives, such as reducing or delaying purchases of permanent displays, reducing or delaying capital expenditures, delaying or revising restructuring plans, restructuring indebtedness, selling additional assets or operations, or seeking capital contributions or additional loans from affiliates of the Company or issuing additional shares of capital stock of Revlon, Inc. Products Corporation has received a commitment from an affiliate that is prepared to provide, if necessary, additional financial support to Products Corporation of up to $40 on appropriate terms through December 31, 2001.

F-19
10. Financial Instruments The fair value of the Company’s long-term debt is estimated based on the quoted market prices for the same issues or on the current rates offered to the Company for debt of the same remaining maturities. The estimated fair value of long-term debt at December 31, 2000 and 1999 was approximately $393.6 and $444.2 less than the carrying values of $1,563.1 and $1,772.1, respectively. Because considerable judgment is required in interpreting market data to develop estimates of fair value, the estimates are not necessarily indicative of the amounts that could be realized or would be paid in a current market exchange. The effect of using different market assumptions or estimation methodologies may be material to the estimated fair value amounts. Products Corporation also maintains standby and trade letters of credit with certain banks for various corporate purposes under which Products Corporation is obligated, of which approximately $23.1 and $30.5 (including amounts available under credit agreements in effect at that time) were maintained at December 31, 2000 and 1999, respectively. Included in these amounts are $14.2 and $25.7, respectively, in standby letters of credit, which support Products Corporation’s self-insurance programs. The estimated liability under such programs is accrued by Products Corporation. The carrying amounts of cash and cash equivalents, marketable securities, trade receivables, notes receivable, accounts payable and short-term borrowings approximate their fair values. 11. Income Taxes In June 1992, Holdings, Revlon, Inc. and certain of its subsidiaries, and Mafco Holdings entered into a tax sharing agreement (as subsequently amended, the “Tax Sharing Agreement”), pursuant to which Mafco Holdings has agreed to indemnify Revlon, Inc. against federal, state or local income tax liabilities of the consolidated or combined group of which Mafco Holdings (or a subsidiary of Mafco Holdings other than Revlon, Inc. or its subsidiaries) is the common parent for taxable periods beginning on or after January 1, 1992 during which Revlon, Inc. or a subsidiary of Revlon, Inc. is a member of such group. Pursuant to the Tax Sharing Agreement, for all taxable periods beginning on or after January 1, 1992, Revlon, Inc. will pay to Holdings amounts equal to the taxes that Revlon, Inc. would otherwise have to pay if it were to file separate federal, state or local income tax returns (including any amounts determined to be due as a result of a redetermination arising from an audit or otherwise of the consolidated or combined tax liability relating to any such period which is attributable to Revlon, Inc.), except that Revlon, Inc. will not be entitled to carry back any losses to taxable periods ending prior to January 1, 1992. No payments are required by Revlon, Inc. if and to the extent Products Corporation is prohibited under the Credit Agreement from making tax sharing payments to Revlon, Inc. The Credit Agreement prohibits Products Corporation from making such tax sharing payments other than in respect of state and local income taxes. Since the payments to be made under the Tax Sharing Agreement will be determined by the amount of taxes that Revlon, Inc. would otherwise have to pay if it were to file separate federal, state or local income tax returns, the Tax Sharing Agreement will benefit Mafco Holdings to the extent Mafco Holdings can offset the taxable income generated by Revlon, Inc. against losses and tax credits generated by Mafco Holdings and its other subsidiaries. The Tax Sharing Agreement was amended to eliminate a contingent payment to Revlon, Inc. under certain circumstances in return for a $10 note with interest at 12% and interest and principal payable by Mafco Holdings on December 31, 2005. As a result of net operating tax losses and prohibitions under the Credit Agreement there were no federal tax payments or payments in lieu of taxes pursuant to the Tax Sharing Agreement for 2000, 1999 or 1998. The Company has a liability of $0.9 to Holdings in respect of federal taxes for 1997 under the Tax Sharing Agreement. Pursuant to the asset transfer agreement referred to in Note 14, Products Corporation assumed all tax liabilities of Holdings other than (i) certain income tax liabilities arising prior to January 1, 1992 to the extent such liabilities exceeded reserves on Holdings’ books as of January 1, 1992 or were not of the nature reserved for and (ii) other tax liabilities to the extent such liabilities are related to the business and assets retained by Holdings.
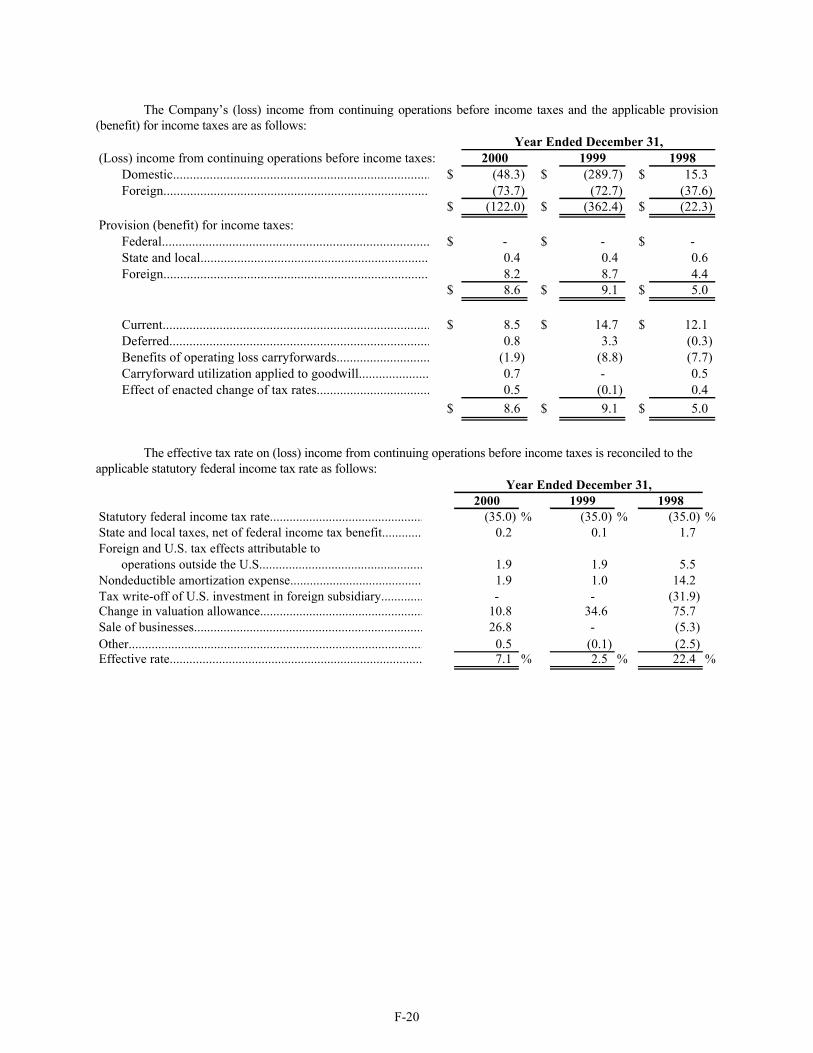
F-20
The Company’s (loss) income from continuing operations before income taxes and the applicable provision (benefit) for income taxes are as follows: Year Ended December 31,(Loss) income from continuing operations before income taxes: 2000 1999 1998
Domestic.....................................................................................................................................................................................................$ (48.3) $ (289.7) $ 15.3Foreign..........................................................................................................................................................................................................(73.7) (72.7) (37.6)
$ (122.0) $ (362.4) $ (22.3)Provision (benefit) for income taxes:
Federal...........................................................................................................................................................................................................$ - $ - $ - State and local...............................................................................................................................................................................................0.4 0.4 0.6Foreign.................................................................................................................................................................................................................8.2 8.7 4.4
$ 8.6 $ 9.1 $ 5.0
Current...................................................................................................................................................................................................$ 8.5 $ 14.7 $ 12.1Deferred..................................................................................................................................................................................................0.8 3.3 (0.3)Benefits of operating loss carryforwards.........................................................................................................................................................(1.9) (8.8) (7.7)Carryforward utilization applied to goodwill..................................................................................................................................................................................................0.7 - 0.5Effect of enacted change of tax rates.....................................................................................................................................................................................0.5 (0.1) 0.4
$ 8.6 $ 9.1 $ 5.0
The effective tax rate on (loss) income from continuing operations before income taxes is reconciled to the applicable statutory federal income tax rate as follows:
Year Ended December 31,2000 1999 1998
Statutory federal income tax rate............................................................................................................................................................(35.0) % (35.0) % (35.0) %State and local taxes, net of federal income tax benefit.............................................................................................................................................................0.2 0.1 1.7Foreign and U.S. tax effects attributable to
operations outside the U.S.....................................................................................................................................................................................................................................1.9 1.9 5.5Nondeductible amortization expense...................................................................................................................................................................1.9 1.0 14.2Tax write-off of U.S. investment in foreign subsidiary...........................................................................................................................................................................................…- - (31.9)Change in valuation allowance..............................................................................................................................................................................................10.8 34.6 75.7Sale of businesses..............................................................................................................................................................................................26.8 - (5.3)Other......................................................................................................................................................................................................................0.5 (0.1) (2.5)Effective rate.........................................................................................................................................................................................................7.1 % 2.5 % 22.4 %

F-21
The tax effects of temporary differences that give rise to significant portions of the deferred tax assets and deferred tax liabilities at December 31, 2000 and 1999 are presented below:
December 31,Deferred tax assets: 2000 1999
Accounts receivable, principally due to doubtful accounts...........................................................................................................................................................................................$ 2.6 $ 5.0Inventories................................................................................................................................10.8 16.8Net operating loss carryforwards - domestic...............................................................................................................................................................................................................225.7 221.9Net operating loss carryforwards - foreign...............................................................................................................................................................................................................119.6 122.2Accruals and related reserves...........................................................................................................................................................................................14.4 16.1Employee benefits..........................................................................................................................................................................................................................41.2 43.0State and local taxes.......................................................................................................................................................................................................................13.1 12.7Self-insurance................................................................................................................................................................................................................1.2 1.8Advertising, sales discounts and returns and coupon redemptions...................... .........................................................................................................................................................................28.3 36.4Other.............................................................................................................................................................................................................29.6 29.3
Total gross deferred tax assets..........................................................................................................................................................................................................486.5 505.2Less valuation allowance........................................................................................................................................................................................................(437.5) (443.8)Net deferred tax assets....................................................................................................................................................................................................49.0 61.4
Deferred tax liabilities:Plant, equipment and other assets..............................................................................................................................................................................................(42.7) (51.8)Other............................................................................................................................................................................................................................(3.0) (4.5)
Total gross deferred tax liabilities......................................................................................................................................................................................(45.7) (56.3)
Net deferred tax asset...............................................................................................................................................................................................$ 3.3 $ 5.1
In assessing the recoverability of its deferred tax assets, management considers whether it is more likely than not that some portion or all of the deferred tax assets will not be realized. The ultimate realization of deferred tax assets is dependent upon the generation of future taxable income during the periods in which those temporary differences become deductible. Management considers the scheduled reversal of deferred tax liabilities, projected future taxable income, and tax planning strategies in making this assessment. Based upon the level of historical taxable income for certain international markets and projections for future taxable income over the periods in which the deferred tax assets are deductible, management believes it is more likely than not that the Company will realize the benefits of certain deductible differences existing at December 31, 2000.
The valuation allowance decreased by $6.3 during 2000 and increased by $60.8 and $102.9 during 1999 and 1998, respectively. During 2000, 1999, and 1998, certain of the Company’s foreign subsidiaries used operating loss carryforwards to credit the current provision for income taxes by $1.9, $8.8, and $2.4, respectively. Certain other foreign operations generated losses during 2000, 1999 and 1998 for which the potential tax benefit was reduced by a valuation allowance. During 1998, the Company used domestic operating loss carryforwards to credit the deferred provision for income taxes by $5.3. At December 31, 2000, the Company had tax loss carryforwards of approximately $999.8 that expire in future years as follows: 2001-$17.8; 2002-$33.9; 2003-$20.7; 2004-$27.4; 2005 and beyond-$749.5; unlimited-$150.5. The Company could receive the benefit of such tax loss carryforwards only to the extent it has taxable income during the carryforward periods in the applicable jurisdictions. In addition, based upon certain factors, including the amount and nature of gains or losses recognized by Mafco Holdings and its other subsidiaries included in the consolidated federal income tax return, the amount of net operating loss carryforwards attributable to Mafco Holdings and such other subsidiaries and the amounts of alternative minimum tax liability of Mafco Holdings and such other subsidiaries, pursuant to the terms of the Tax Sharing Agreement, all or a portion of the domestic operating loss carryforwards may not be available to the Company should the Company cease being a member of the Mafco Holdings consolidated federal income tax return. Appropriate United States and foreign income taxes have been accrued on foreign earnings that have been or are expected to be remitted in the near future. Unremitted earnings of foreign subsidiaries which have been, or are currently intended to be, permanently reinvested in the future growth of the business aggregated approximately $6.3 at December 31, 2000, excluding those amounts which, if remitted in the near future, would not result in significant additional taxes under tax statutes currently in effect.

F-22
12. Postretirement Benefits Pension: A substantial portion of the Company’s employees in the United States are covered by defined benefit pension plans. The Company uses September 30 as its measurement date for plan obligations and assets. Other Postretirement Benefits:
The Company also has sponsored an unfunded retiree benefit plan, which provides death benefits payable to beneficiaries of certain key employees and former employees. Participation in this plan is limited to participants enrolled as of December 31, 1993. The Company also administers a medical insurance plan on behalf of Holdings, the cost of which has been apportioned to Holdings. The Company uses September 30 as its measurement date for plan obligations.
Information regarding the Company’s significant pension and other postretirement plans at the dates
indicated is as follows: Other Postretirement
Pension Plans BenefitsDecember 31,
Change in Benefit Obligation: 2000 1999 2000 1999Benefit obligation - September 30 of prior year....................................................................................................................................................................$ (418.2) $ (438.6) $ (9.2) $ (9.3) Service cost....................................................................................................................................................................................................(12.0) (16.0) - (0.1) Interest cost...............................................................................................................................................................(29.2) (28.7) (0.7) (0.7) Plan amendments........................................................................................................................................................(1.5) - - - Actuarial (loss) gain.................................................................................................................................................9.4 46.8 (0.4) 0.3 Curtailments...........................................................................................................................................................................0.7 - - - Benefits paid....................................................................................................................................................................................................21.2 19.1 0.6 0.6 Foreign exchange.....................................................................................................................................................................................3.5 - - - Plan participant contributions................................................................................................................................................................(0.7) (0.8) - - Settlements................................................................................................................................................................6.2 - - - Benefit obligation - September 30 of current year............................................................................................................................................................(420.6) (418.2) (9.7) (9.2)
Change in Plan Assets:Fair value of plan assets - September 30 of prior year...............................................................................................................................................................323.7 286.0 - - Actual return on plan assets.................................................................................................................................................................39.9 52.1 - - Employer contributions.....................................................................................................................................................................................9.6 4.5 0.6 0.6 Assets sold.....................................................................................................................................................................................(2.8) - - - Plan participant contributions.....................................................................................................................................................................................0.7 0.8 - - Benefits paid.....................................................................................................................................................................(21.2) (19.1) (0.6) (0.6) Settlements................................................................................................................................................................(3.4) - - - Foreign exchange.........................................................................................................................................................................................(3.1) (0.6) - - Fair value of plan assets - September 30 of current year................................................................................................................................343.4 323.7 - -
Funded status of plans..............................................................................................................................................................................................................(77.2) (94.5) (9.7) (9.2) Amounts contributed to plans during fourth quarter.................................................................................................................................................................1.1 1.2 0.1 0.1 Unrecognized net (gain) loss ................................................................................................................................................................(1.6) 19.0 (1.1) (1.6) Unrecognized prior service cost..................................................................................................................................................................5.0 5.5 - - Unrecognized net (asset) obligation.........................................................................................................................................................................................................(0.5) (0.7) - -
Accrued benefit cost.........................................................................................................................................................................................$ (73.2) $ (69.5) $ (10.7) $ (10.7) Amounts recognized in the Consolidated Balance Sheets consist of:
Prepaid expenses................................................................................................................................................................................................................................$ 7.7 $ 6.3 $ - $ - Other long-term liabilities.......................................................................................................................................................................................(85.5) (81.4) (10.7) (10.7) Intangible asset................................................................................................................................................................................................0.5 - - - Accumulated other comprehensive loss........................................................................................................................................................................................3.6 4.9 - - Due from affiliate................................................................................................................................................................................................1.5 1.6 1.4 1.6
$ (72.2) $ (68.6) $ (9.3) $ (9.1)

F-23
The following weighted-average assumptions were used in accounting for the plans:
U.S. Plans International Plans2000 1999 1998 2000 1999 1998
Discount rate.........................................................................................................................................................................................................7.5% 7.5% 6.8% 6.5% 6.5% 6.2%Expected return on plan assets...........................................................................................................................................................................9.5 9.5 9.0 9.0 9.2 9.6 Rate of future compensation increases..........................................................................................................................................................5.3 5.3 5.3 4.5 4.5 4.9
The components of net periodic benefit cost for the plans are as follows:
Pension Plans Other Postretirement Benefits
Year Ended December 31,2000 1999 1998 2000 1999 1998
Service cost....................................................................................................................................................................................................$ 12.0 $ 16.0 $ 12.8 $ - $ 0.1 $ 0.1 Interest cost.................................................................................................................................................................................................................................29.2 28.7 27.0 0.7 0.7 0.7 Expected return on plan assets.........................................................................................................................................................................................................(30.1) (26.6) (27.4) - - - Amortization of prior service cost.................................................................................................................................................................................1.7 1.7 1.8 - - - Amortization of net transition asset...............................................................................................................................................................................(0.2) (0.2) (0.2) - - - Amortization of actuarial loss (gain)................................................................................................................................................................................................1.0 5.0 1.0 (0.1) (0.3) (0.3) Settlement gain....................................................................................................................................................................................................................................(0.1) - - - - - Curtailment (gain) loss..............................................................................................................................................................................................................(0.4) - 0.3 - - -
13.1 24.6 15.3 0.6 0.5 0.5 Portion allocated to Holdings..............................................................................................................................................................................................(0.3) (0.3) (0.3) - 0.1 0.1
$ 12.8 $ 24.3 $ 15.0 $ 0.6 $ 0.6 $ 0.6
Where the accumulated benefit obligation exceeded the related fair value of plan assets, the projected benefit obligation, accumulated benefit obligation, and fair value of plan assets for the Company’s pension plans are as follows:
2000 1999 1998Projected benefit obligation.........................................................................................................................................................................................$ 60.5 $ 61.2 $ 428.2 Accumulated benefit obligation.....................................................................................................................................................................53.9 53.0 370.5 Fair value of plan assets..................................................................................................................................................................................5.0 0.7 276.3
December 31,
13. Stock Compensation Plan Since March 5, 1996, Revlon, Inc. has had a stock-based compensation plan as subsequently amended and restated (the “Plan”), which is described below. Revlon, Inc. applies APB Opinion No. 25 and its related interpretations in accounting for the Plan. Under APB Opinion No. 25, because the exercise price of Revlon, Inc.’s employee stock options equals the market price of the underlying stock on the date of grant, no compensation cost has been recognized. Had compensation cost for the Plan been determined consistent with SFAS No. 123, Revlon, Inc.’s net loss and net loss per diluted share of $130.6 and $2.54, respectively, for 2000, $371.5 and $7.25, respectively, for 1999, and $143.2 and $2.80, respectively, for 1998 would have been changed to the pro forma amounts of $141.6 and $2.76 for 2000, respectively, $397.2 and $7.75 for 1999, respectively, and $166.8 and $3.25, respectively, for 1998. The fair value of each option grant is estimated on the date of the grant using the Black-Scholes option-pricing model assuming no dividend yield, expected volatility of approximately 69% in 2000, 68% in 1999, and 56% in 1998; weighted average risk-free interest rate of 6.53% in 2000, 5.48% in 1999, and 5.37% in 1998; and a seven year expected average life for the Plan’s options issued in 2000, 1999 and 1998. The effects of applying SFAS No. 123 in this pro forma disclosure are not necessarily indicative of future amounts. Under the Plan, awards may be granted to employees and directors of Revlon, Inc. for up to an aggregate of 7.0 million shares of Revlon, Inc. Class A Common Stock. Non-qualified options granted under the Plan have a term

F-24
of 10 years during which the holder can purchase shares of Revlon, Inc. Class A Common Stock at an exercise price, which must be not less than the market price on the date of the grant. Option grants vest over service periods that range from one to five years, except as disclosed below. Options granted in February 1999 with an original four-year vesting term were modified in May 1999 to allow the options to become fully vested on the first anniversary date of the grant. Options granted in May 2000 under the Plan vest 25% on each anniversary of the grant date and will become 100% vested on the fourth anniversary of the grant date; provided that an additional 25% of such options would vest on each subsequent anniversary date of the grant if the Company achieved certain performance objectives relating to the Company’s operating income for the fiscal year preceding such anniversary date, which objectives were not achieved in 2000. During each of 2000, 1999 and 1998, the Company granted to Mr. Perelman, Chairman of the Executive Committee, options to purchase 300,000 shares of Revlon, Inc. Class A Common Stock, which grants will vest in full on the fifth anniversary of the grant dates as to the 2000 and 1998 grants and which vested 100% on the date of grant as to the 1999 grant. At December 31, 2000, 1999 and 1998 there were 3,009,908, 1,850,050 and 403,950 options exercisable under the Plan, respectively. A summary of the status of the Plan as of December 31, 2000, 1999 and 1998 and changes during the years then ended is presented below:
Shares Weighted Average(000) Exercise Price
Outstanding at December 31, 1997..........................................................................................................................................................................................................2,279.4 $29.57
Granted........................................................................ 1,707.8 36.65Exercised..........................................................................................(55.9) 26.83Forfeited..................................................................... (166.8) 32.14Outstanding at December 31, 1998...........................................................................................................................................................................................................3,764.5 32.71
Granted........................................................................ 2,456.7 16.89Exercised..........................................................................................(5.8) 27.94Forfeited..................................................................... (444.2) 27.03Outstanding at December 31, 1999...........................................................................................................................................................................................................5,771.2 26.42
Granted........................................................................ 1,769.1 7.15Exercised..........................................................................................- - Forfeited..................................................................... (936.8) 24.06Outstanding at December 31, 2000...........................................................................................................................................................................................................6,603.5 21.59
The weighted average fair value of options granted during 2000, 1999 and 1998 approximated $4.58, $10.65, and $22.26, respectively.

F-25
The following table summarizes information about the Plan’s options outstanding at December 31, 2000:
Weighted Range Average Weighted Weighted
of Number Years Average Number AverageExercise Prices of Options Remaining Exercise Price of Options Exercise Price$4.00 to $10.44 1,908.0 9.32 7.49$ 1.9 9.02$
15.00 to 24.00 1,865.9 7.06 18.01 1,787.6 18.0924.13 to 33.88 1,383.0 6.67 28.42 772.4 30.0234.00 to 53.56 1,446.6 6.49 38.29 448.0 35.42
4.00 to 53.56 6,603.5 3,009.9
Outstanding Exercisable
14. Related Party Transactions Transfer Agreements In June 1992, Revlon, Inc. and Products Corporation entered into an asset transfer agreement with Holdings and certain of its wholly-owned subsidiaries (the "Asset Transfer Agreement"), and Revlon, Inc. and Products Corporation entered into a real property asset transfer agreement with Holdings (the "Real Property Transfer Agreement" and, together with the Asset Transfer Agreement, the "Transfer Agreements"), and pursuant to such agreements, on June 24, 1992 Holdings transferred assets to Products Corporation and Products Corporation assumed all the liabilities of Holdings, other than certain specifically excluded assets and liabilities (the liabilities excluded are referred to as the "Excluded Liabilities"). Certain consumer products lines sold in demonstrator assisted distribution channels considered not integral to the Company's business and which historically had not been profitable (the "Retained Brands") and certain of the assets and liabilities were retained by Holdings. Holdings agreed to indemnify Revlon, Inc. and Products Corporation against losses arising from the Excluded Liabilities, and Revlon, Inc. and Products Corporation agreed to indemnify Holdings against losses arising from the liabilities assumed by Products Corporation. The amounts reimbursed by Holdings to Products Corporation for the Excluded Liabilities for 2000, 1999 and 1998 were $0.4, $0.5 and $0.6, respectively. Certain assets and liabilities relating to divested businesses were transferred to Products Corporation on the transfer date and any remaining balances as of December 31 of the applicable year have been reflected in the Company’s Consolidated Balance Sheets as of such dates. At December 31, 2000 and 1999, the amounts reflected in the Company’s Consolidated Balance Sheets aggregated a net liability of $23.2 and $23.6, respectively, of which $4.8 and $5.2, respectively, are included in accrued expenses and other and $18.4 is included in other long-term liabilities as of both dates. Reimbursement Agreements Revlon, Inc., Products Corporation and MacAndrews Holdings have entered into reimbursement agreements (the "Reimbursement Agreements") pursuant to which (i) MacAndrews Holdings is obligated to provide (directly or through affiliates) certain professional and administrative services, including employees, to Revlon, Inc. and its subsidiaries, including Products Corporation, and purchase services from third party providers, such as insurance and legal and accounting services, on behalf of Revlon, Inc. and its subsidiaries, including Products Corporation, to the extent requested by Products Corporation, and (ii) Products Corporation is obligated to provide certain professional and administrative services, including employees, to MacAndrews Holdings (and its affiliates) and purchase services from third party providers, such as insurance and legal and accounting services, on behalf of MacAndrews Holdings (and its affiliates) to the extent requested by MacAndrews Holdings, provided that in each case the performance of such services does not cause an unreasonable burden to MacAndrews Holdings or Products Corporation, as the case may be. Products Corporation reimburses MacAndrews Holdings for the allocable costs of the services purchased for or provided to Products Corporation and its subsidiaries and for reasonable out-of-pocket expenses incurred in connection with the

F-26
provision of such services. MacAndrews Holdings (or such affiliates) reimburses Products Corporation for the allocable costs of the services purchased for or provided to MacAndrews Holdings (or such affiliates) and for the reasonable out-of-pocket expenses incurred in connection with the purchase or provision of such services. The net amounts reimbursed by MacAndrews Holdings to Products Corporation for the services provided under the Reimbursement Agreements for 2000, 1999 and 1998, were $0.9, $0.5 and $3.1, respectively. Each of Revlon, Inc. and Products Corporation, on the one hand, and MacAndrews Holdings, on the other, has agreed to indemnify the other party for losses arising out of the provision of services by it under the Reimbursement Agreements other than losses resulting from its willful misconduct or gross negligence. The Reimbursement Agreements may be terminated by either party on 90 days' notice. Products Corporation does not intend to request services under the Reimbursement Agreements unless their costs would be at least as favorable to Products Corporation as could be obtained from unaffiliated third parties. Tax Sharing Agreement Holdings, Revlon, Inc., Products Corporation and certain of its subsidiaries and Mafco Holdings are parties to the Tax Sharing Agreement, which is described in Note 11. Since payments to be made under the Tax Sharing Agreement will be determined by the amount of taxes that Revlon, Inc. would otherwise have to pay if it were to file separate federal, state or local income tax returns, the Tax Sharing Agreement will benefit Mafco Holdings to the extent Mafco Holdings can offset the taxable income generated by Revlon, Inc. against losses and tax credits generated by Mafco Holdings and its other subsidiaries. There were no cash payments in respect of federal taxes made by Revlon, Inc. pursuant to the Tax Sharing Agreement for 2000, 1999 and 1998. Registration Rights Agreement Prior to the consummation of Revlon, Inc.’s initial public equity offering, Revlon, Inc. and Revlon Worldwide Corporation (subsequently merged into REV Holdings), the then direct parent of Revlon, Inc., entered into the Registration Rights Agreement pursuant to which REV Holdings and certain transferees of Revlon, Inc.'s Common Stock held by REV Holdings (the "Holders") have the right to require Revlon, Inc. to register all or part of the Company’s Class A Common Stock owned by such Holders and the Company’s Class A Common Stock issuable upon conversion of the Company’s Class B Common Stock owned by such Holders under the Securities Act of 1933, as amended (the "Securities Act") (a "Demand Registration"); provided that Revlon, Inc. may postpone giving effect to a Demand Registration up to a period of 30 days if Revlon, Inc. believes such registration might have a material adverse effect on any plan or proposal by Revlon, Inc. with respect to any financing, acquisition, recapitalization, reorganization or other material transaction, or if Revlon, Inc. is in possession of material non-public information that, if publicly disclosed, could result in a material disruption of a major corporate development or transaction then pending or in progress or in other material adverse consequences to Revlon, Inc. In addition, the Holders have the right to participate in registrations by Revlon, Inc. of its Class A Common Stock (a "Piggyback Registration"). The Holders will pay all out-of-pocket expenses incurred in connection with any Demand Registration. Revlon, Inc. will pay any expenses incurred in connection with a Piggyback Registration, except for underwriting discounts, commissions and expenses attributable to the shares of the Company’s Class A Common Stock sold by such Holders. Other Pursuant to a lease dated April 2, 1993 (the "Edison Lease"), Holdings leased to Products Corporation the Edison research and development facility for a term of up to 10 years with an annual rent of $1.4 and certain shared operating expenses payable by Products Corporation, which, together with the annual rent, were not to exceed $2.0 per year. In August 1998, Holdings sold the Edison facility to an unrelated third party, which assumed substantially all liability for environmental claims and compliance costs relating to the Edison facility, and in connection with the sale Products Corporation terminated the Edison Lease and entered into a new lease with the new owner. Holdings agreed to indemnify Products Corporation to the extent rent under the new lease exceeds rent that would have been payable under the terminated Edison Lease had it not been terminated. The net amounts reimbursed by Holdings to Products Corporation with respect to the Edison facility for 2000, 1999 and 1998 were $0.2, $0.2 and $0.5, respectively. On February 2, 1998, Revlon Escrow Corp., an affiliate of Products Corporation, issued and sold in a private placement $650.0 aggregate principal amount of 8 5/8% Notes and $250.0 aggregate principal amount of 8 1/8% Notes, with the net proceeds deposited into escrow. The proceeds from the sale of the 8 5/8% and 8 1/8% Notes were used to

F-27
finance the redemption of Products Corporation's $555.0 aggregate principal amount of 10 1/2% Senior Subordinated Notes due 2003 (the “Senior Subordinated Notes”) and $260.0 aggregate principal amount of 9 3/8% Senior Notes due 2001 (the “Senior Notes” and, together with the Senior Subordinated Notes, the “Old Notes”). Products Corporation delivered a redemption notice to the holders of the Senior Subordinated Notes for the redemption of the Senior Subordinated Notes on March 4, 1998, at which time Products Corporation assumed the obligations under the 8 5/8% Notes and the related indenture (the “8 5/8% Notes Assumption”), and to the holders of the Senior Notes for the redemption of the Senior Notes on April 1, 1998, at which time Products Corporation assumed the obligations under the 8 1/8% Notes and the related indenture (the “8 1/8% Notes Assumption” and, together with the 8 5/8% Notes Assumption, the “Assumption”). A nationally recognized investment banking firm rendered its written opinion that the Assumption, upon consummation of the redemptions of the Old Notes, and the subsequent release from escrow to Products Corporation of any remaining net proceeds from the sale of the 8 5/8% Notes are fair from a financial standpoint to Products Corporation under the then existing 9 1/2% Senior Notes due 1999 Indenture. During 2000, Products Corporation leased certain facilities to MacAndrews & Forbes or its affiliates pursuant to occupancy agreements and leases. These included space at Products Corporation's New York headquarters and at Products Corporation's offices in London. The rent paid to Products Corporation for 2000, 1999 and 1998 was $0.9, $1.1 and $2.9, respectively. Products Corporation's Credit Agreement is supported by, among other things, guarantees from Revlon, Inc., Holdings and certain of Holdings’ subsidiaries. The obligations under such guarantees are secured by, among other things, the capital stock of Products Corporation and the capital stock and certain assets of certain subsidiaries of Holdings.
During 1998, the Company made advances of $0.25, $0.3 and $0.4 to Mr. George Fellows, then President and CEO, Ms. Kathleen Dwyer, then Senior Vice President and Mr. Jerry Levin, a director, respectively, which advances were repaid in 1999.
During 2000 and 1999, the Company made advances of $0.1 and $0.4, respectively, to Mr. Jeffrey Nugent, President and CEO, pursuant to his employment agreement for relocation expenses, which advances bear interest at the applicable federal rate. During 2000, the Company made an advance of $0.8 to Mr. Douglas Greeff, Executive Vice President and CFO, pursuant to his employment agreement, which bears interest at the applicable federal rate. During 1998, Products Corporation purchased products from a company that was its affiliate during part of 1998, for which it paid approximately $0.4. During 1997, Products Corporation provided licensing services to a company that was its affiliate during 1997 and part of 1998. In connection with the termination of the licensing arrangement and its agreement to provide consulting services during 1998, Products Corporation received payments of $2.0 in 1998 and an additional $1.0 in 1999.
A company that was an affiliate of the Company during part of 1999, and during 1998 assembled lipstick cases for Products Corporation. Products Corporation paid approximately $0.1 and $1.1, for such services for 1999 and 1998, respectively.
During 2000 and 1999, Products Corporation made payments of $0.1, and $0.1, respectively, to a fitness center, an interest in which is owned by members of Mr. Donald Drapkin's immediate family, for discounted health club dues for an executive health program of Products Corporation. Mr. Drapkin is a director of the Company.
During 2000, Products Corporation made payments of $0.2 to Ms. Ellen Barkin (spouse of Mr. Perelman) under an agreement pursuant to which she provided voiceover services for certain of the Company's advertisements. The law firm of which Mr. Vernon Jordan (a director) became Of Counsel in January 2000 after serving as a Senior Partner for more than 5 years, Akin, Gump, Strauss, Hauer & Feld, LLP, provided legal services to Revlon, Inc.

F-28
and its subsidiaries during 1999. An investment bank, of which Mr. Jordan became a Managing Director in January 2000, Lazard Frères & Co. LLC, provided investment banking services to the Company during 2000. The law firm, of which Mr. Edward Landau (a director) is Of Counsel, Wolf, Block, Schorr and Solis-Cohen LLP, provided legal services to the Company during 2000, but did not provide any such services in 1998 or 1999. 15. Commitments and Contingencies The Company currently leases manufacturing, executive, including research and development, and sales facilities and various types of equipment under operating lease agreements. Rental expense was $33.0, $42.8 and $43.7 for the years ended December 31, 2000, 1999 and 1998, respectively. Minimum rental commitments under all noncancelable leases, including those pertaining to idled facilities, with remaining lease terms in excess of one year from December 31, 2000 aggregated $85.8; such commitments for each of the five years subsequent to December 31, 2000 are $25.2, $23.8, $11.7, $4.3 and $3.0, respectively. Such amounts exclude the minimum rentals to be received by the Company in the future under noncancelable subleases of $17.6. The Company and its subsidiaries are defendants in litigation and proceedings involving various matters. In the opinion of the Company’s management, based upon advice of its counsel handling such litigation and proceedings, adverse outcomes, if any, will not result in a material effect on the Company’s consolidated financial condition or results of operations.
On April 17, 2000, the plaintiffs in the six purported class actions filed in October and November 1999 by each of Thomas Comport, Boaz Spitz, Felix Ezeir and Amy Hoffman, Ted Parris, Jerry Krim and Dan Gavish individually and allegedly on behalf of others similarly situated to them against Revlon, Inc., certain of its present and former officers and directors and REV Holdings alleging among other things, violations of Rule 10b-5 under the Securities Exchange Act of 1934, filed an Amended Complaint, which consolidated all of the actions and limited the alleged class period to the period from October 29, 1997 through October 1, 1998 (“In Re Revlon, Inc. Securities Litigation”). In June 2000, the Company moved to dismiss the Amended Complaint, which motion was denied in substantial part in March 2001. The Company believes the allegations contained in the Amended Complaint are without merit and intends to vigorously defend against them.
A purported class action lawsuit was filed on September 27, 2000, in the United States District Court for the
Southern District of New York on behalf of Dan Gavish, Tricia Fontan and Walter Fontan individually and allegedly on behalf of all others similarly situated who purchased the securities of Revlon, Inc., and REV Holdings, between October 2, 1998 and September 30, 1999 (the "Purported Class Period"). The complaint alleges that Revlon, Inc. and certain of its present and former officers and directors and REV Holdings violated, among other things, Rule 10b-5 under the Securities Exchange Act of 1934. On October 17, 2000 the court ordered that this lawsuit be consolidated with the pending In Re Revlon, Inc. Securities Litigation. On October 27, 2000 the plaintiff moved for reconsideration of the October 17, 2000 consolidation order. The Company believes the allegations contained in the complaint are without merit and intends to vigorously defend against them.

F-29
16. Quarterly Results of Operations (Unaudited) The following is a summary of the unaudited quarterly results of operations:
1st 2nd 3rd 4thQuarter Quarter Quarter Quarter
Net sales...............................................................................................................................................................................................…$ 468.0 $ 350.6 $ 351.9 $ 321.1
Gross profit......................................................................................................................................................................................................................................….299.5 226.3 227.2 185.6
Net loss..................................................................................................................................................................................................................................…(27.9) (a) (24.6) (a) (26.3) (a) (51.8) (a)
Basic loss per common share:
Net loss per common share............................................................................................................... .........................................................................................................$ (0.54) $ (0.48) $ (0.51) $ (1.01)
Diluted loss per common share:
Net loss per common share...........................................................................................................................................................$ (0.54) $ (0.48) $ (0.51) $ (1.01)
1st 2nd 3rd 4thQuarter Quarter Quarter Quarter
Net sales...............................................................................................................................................................................................…$ 441.1 $ 553.4 $ 452.4 $ 414.4
Gross profit......................................................................................................................................................................................................................................….285.4 368.5 282.4 238.9
Net loss..................................................................................................................................................................................................................................…(34.2) (b) (3.9) (b) (164.7) (b) (168.7) (b)
Basic loss per common share:
Net loss per common share...........................................................................................................................................................$ (0.67) $ (0.08) $ (3.21) $ (3.29)
Diluted loss per common share:
Net loss per common share...........................................................................................................................................................$ (0.67) $ (0.08) $ (3.21) $ (3.29)
Year Ended December 31, 1999
Year Ended December 31, 2000
(a) Includes restructuring costs of $9.5, $5.1, $13.7 and $25.8 in the first, second, third and fourth quarters, respectively. (See Note 2). (b) Includes restructuring costs of $8.2, $9.5, $4.4 and $18.1 in the first, second, third and fourth quarters, respectively. (See Note 2). Additionally the fourth quarter includes $22.0 of executive separation costs. 17. Geographic Information The Company manages its business on the basis of one reportable operating segment. See Note 1 for a brief description of the Company’s business. As of December 31, 2000, the Company had operations established in 20 countries outside of the United States and its products are sold throughout the world. The Company is exposed to the risk of changes in social, political and economic conditions inherent in foreign operations and the Company’s results of operations and the value of its foreign assets are affected by fluctuations in foreign currency exchange rates. The Company’s operations in Brazil have accounted for approximately 5.1%, 4.1% and 5.4% of the Company’s net sales for 2000, 1999 and 1998, respectively. Net sales by geographic area are presented by attributing revenues from external customers on the basis of where the products are sold. During 2000, 1999 and 1998, Wal-Mart and its affiliates accounted for approximately 16.5%, 13.1% and 10.1%, respectively, of the Company’s consolidated net sales. Although the loss of Wal-Mart as a customer would have an adverse effect on the Company, the Company believes that its relationship with Wal-Mart is satisfactory and the Company has no reason to believe that Wal-Mart will not continue as a customer.

F-30
Geographic Areas:
Net sales: 2000 1999 1998
United States.......................................................................................................................................................................................................$ 877.1 $ 1,046.2 $ 1,343.7
International................................................................................................................................................................................................................................................614.5 815.1 908.5
$ 1,491.6 $ 1,861.3 $ 2,252.2
Long-lived assets: 2000 1999
United States...............................................................................................................................................................................................................$ 398.8 $ 611.3
International.........................................................................................................................................................................................................................................175.3 259.4
$ 574.1 $ 870.7
Classes of Similar Products:
Net sales: 2000 1999 1998
Cosmetics, skin care and fragrances.......................................................................................................................................................................................................$ 935.3 $ 988.3 $ 1,293.7
Personal care and professional......................................................................................................................................................................................................556.3 873.0 958.5
$ 1,491.6 $ 1,861.3 $ 2,252.2
December 31,
Year Ended December 31,
Year Ended December 31,
18. Effect of New Accounting Standard
In May 2000, the FASB Emerging Issues Task Force (the “EITF”) issued new guidelines entitled, “Accounting for Certain Sales Incentives” (the “Guidelines”), which address when sales incentives and discounts should be recognized, as well as where the related revenues and expenses should be classified in the financial statements. The Guidelines, as amended in November 2000, are effective for the second quarter ending June 30, 2001, and would be applied retroactively for purposes of comparability. Therefore, beginning April 1, 2001, the Company is required to reclassify certain revenues and expenses related to its promotional programs out of operating expenses and into sales and cost of sales. The Company has quantified the reclassification for 2000, 1999 and 1998 as summarized below:
As As As As As AsReported Adjusted Reported Adjusted Reported Adjusted
Net sales.......................................................................................................................................................................................................$ 1,491.6 $ 1,445.1 $ 1,861.3 $ 1,707.1 $ 2,252.2 $ 2,145.7
Cost of sales.................................................................................................................................................................................................................553.0 573.2 686.1 724.6 765.7 800.3
SG&A expenses...........................................................................................................................................................................................869.5 802.8 1,347.6 1,155.0 1,328.8 1,187.6
Operating income (loss).....................................................................................................................................................................................................................15.0 15.0 (212.6) (212.6) 124.6 124.6
December 31, 1999 December 31, 1998December 31, 2000
For the Year Ended
19. Discontinued Operations During 1998, the Company completed the disposition of its approximately 85% equity interest in The Cosmetic Center, Inc. (the “Cosmetic Center”), along with certain amounts due from Cosmetic Center to the Company for working capital and inventory, to a newly formed limited partnership controlled by an unrelated third party. The Company received a minority limited partnership interest in the limited partnership as consideration for the disposition. Based upon the Company’s expectation that it would receive no future cash flows from the limited partnership, as well as other factors, the Company assigned no value to such interest. As a result, the Company recorded a loss on disposal of $47.7 during 1998.

F-31
20. Extraordinary Items The extraordinary loss of $51.7 in 1998 resulted primarily from the write-off of deferred financing costs and payment of call premiums associated with the redemption of Products Corporation’s 9 3/8% Senior Notes due 2001 and Products Corporation’s 10 1/2% Senior Subordinated Notes due 2003. In connection with the redemption, Products Corporation terminated certain interest rate swap agreements in January 1998 and realized a gain of approximately $1.6, which was recognized upon repayment of the hedged indebtedness and is included in the extraordinary item for the early extinguishment of debt. 21. Subsequent Events
On March 29, 2001, a subsidiary of Products Corporation entered into an agreement to sell the Aoyama Property for ¥ 3.3 billion (approximately $28 as of March 29, 2001), after fees and expenses. The agreement is subject to a number of conditions. Subject to satisfaction of such conditions, Products Corporation expects the sale to be consummated during the second quarter of 2001.
On March 16, 2001, Products Corporation entered into an agreement to sell its Phoenix facility for $8.0 and lease it back for a certain period of time. The agreement is subject to a number of conditions, including completion of due diligence. Subject to satisfaction of such conditions, Products Corporation expects the sale to be consummated during the second quarter of 2001. If consummated, proceeds available to the Company from the aforementioned transactions will be used for general corporate purposes, including payments to fund the Company’s restructuring plans.
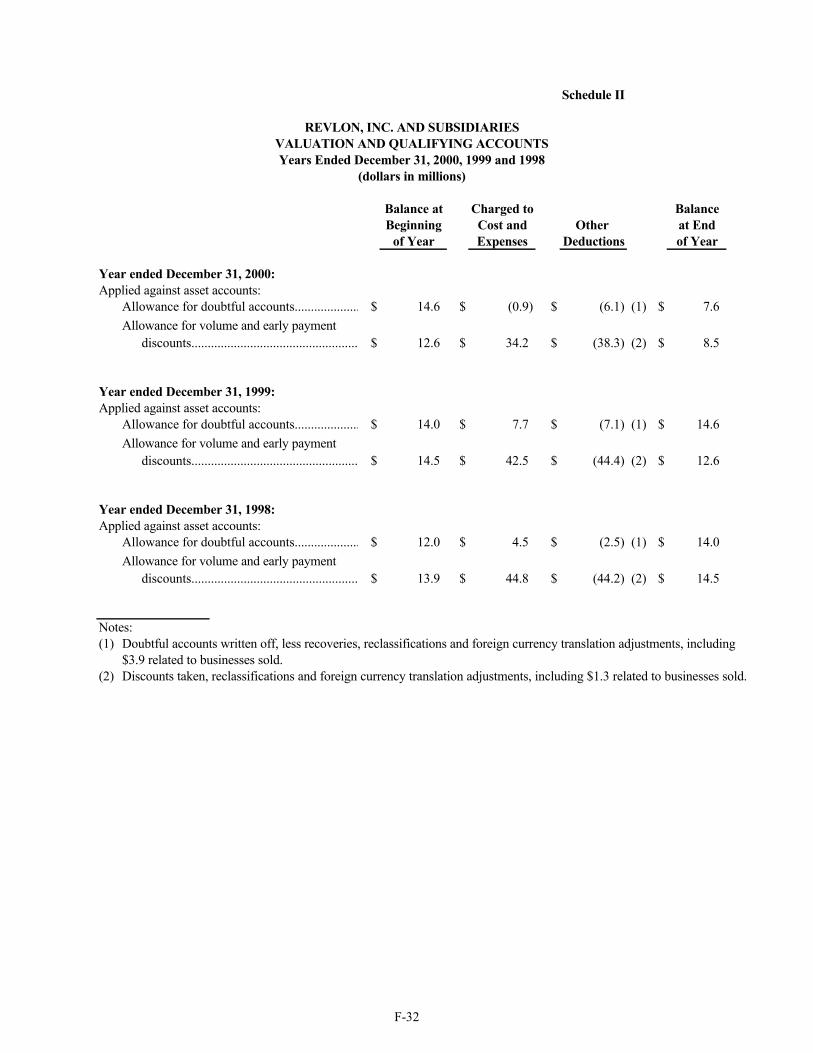
F-32
Schedule II
REVLON, INC. AND SUBSIDIARIESVALUATION AND QUALIFYING ACCOUNTSYears Ended December 31, 2000, 1999 and 1998
(dollars in millions)
Balance at Charged to BalanceBeginning Cost and Other at End
of Year Expenses Deductions of Year
Year ended December 31, 2000:Applied against asset accounts:
Allowance for doubtful accounts.......................................................................................................................................................................................$ 14.6 $ (0.9) $ (6.1) (1) $ 7.6
Allowance for volume and early paymentdiscounts........................................................................................................................................................................................................$ 12.6 $ 34.2 $ (38.3) (2) $ 8.5
Year ended December 31, 1999:Applied against asset accounts:
Allowance for doubtful accounts.........................................................................................................................................................................................................$ 14.0 $ 7.7 $ (7.1) (1) $ 14.6
Allowance for volume and early paymentdiscounts.......................................................................................................................................................................................................................$ 14.5 $ 42.5 $ (44.4) (2) $ 12.6
Year ended December 31, 1998:Applied against asset accounts:
Allowance for doubtful accounts..........................................................................................................................................................................$ 12.0 $ 4.5 $ (2.5) (1) $ 14.0
Allowance for volume and early paymentdiscounts.....................................................................................................................................................................................................................................$ 13.9 $ 44.8 $ (44.2) (2) $ 14.5
Notes:(1) Doubtful accounts written off, less recoveries, reclassifications and foreign currency translation adjustments, including
$3.9 related to businesses sold.(2) Discounts taken, reclassifications and foreign currency translation adjustments, including $1.3 related to businesses sold.

SIGNATURES
Pursuant to the requirements of Section 13 or 15(d) of the Securities Exchange Act of 1934, the Registrant has duly caused this report to be signed on its behalf by the undersigned, thereunto duly authorized.
Revlon, Inc. (Registrant)
By: /s/ Jeffrey M. Nugent ---------------------------------------- Jeffrey M. Nugent President, Chief Executive Officer and Director
By: /s/ Douglas H. Greeff ---------------------------------------- Douglas H. Greeff Executive Vice President and Chief Financial Officer
By: /s/ Laurence Winoker ---------------------------------------- Laurence Winoker Senior Vice President, Corporate Controller and Treasurer
Dated: April 2, 2001 Pursuant to the requirements of the Securities Exchange Act of 1934, this report has been signed by the following persons on behalf of the registrant on April 2, 2001 and in the capacities indicated. Signature Title
* ___________________________________ (Ronald O. Perelman)
Chairman of the Board and Director
* ___________________________________ (Howard Gittis)
Director
/s/ Jeffrey M. Nugent ___________________________________ (Jeffrey M. Nugent)
President, Chief Executive Officer and Director
* ___________________________________ (Donald G. Drapkin)
Director
* ___________________________________ (Meyer Feldberg)
Director
* ___________________________________ (Vernon E. Jordan)
Director
* ___________________________________ (Edward J. Landau)
Director

* ___________________________________ (Jerry W. Levin)
Director
* ___________________________________ (Linda Gosden Robinson)
Director
* ___________________________________ (Terry Semel)
Director
* ___________________________________ (Martha Stewart)
Director
* Robert K. Kretzman, by signing his name hereto, does hereby sign this report on behalf of the directors of the registrant after whose typed names asterisks appear, pursuant to powers of attorney duly executed by such directors and filed with the Securities and Exchange Commission. By: /s/ Robert K. Kretzman Robert K. Kretzman Attorney-in-fact

Board Of DirectorsRonald O. Perelman (1)Chairman of the BoardChairman and Chief Executive Officer ofMacAndrews & Forbes Holdings Inc.
Donald G. Drapkin (2)Vice ChairmanMacAndrews & Forbes Holdings Inc.
Meyer Feldberg (3)Dean, Columbia Business School
Howard Gittis (1,2)Vice ChairmanMacAndrews & Forbes Holdings Inc.
Vernon E. Jordan, Jr.Managing Director of Lazard Freres & Co.,LLC, and Of Counsel, Akin, Gump, Strauss,Hauer & Feld, LLP
Edward J. Landau (2,3)Of Counsel, Wolf, Block, Schorr andSolis-Cohen LLP
Jerry W. LevinChairman and Chief Executive Officer,Sunbeam Corporation
Jeffrey M. Nugent (1)President and Chief Executive Officer
Linda Gosden Robinson (3)Chairman and Chief Executive Officer,Robinson Lerer & Montgomery, LLC
Terry Semel (2)Chairman and Chief Executive Officer,Yahoo! Inc.
Martha StewartChairman and Chief Executive Officer,Martha Stewart Living Omnimedia, Inc.
1. Executive Committee2. Compensation and Stock Plan
Committee3. Audit Committee
OfficersRonald O. PerelmanChairman
Jeffrey M. NugentPresident and Chief Executive Officer
Douglas H. GreeffExecutive Vice President and ChiefFinancial Officer
Stanley B. DessenSenior Vice President and General TaxCounsel
Robert K. KretzmanSenior Vice President, General Counseland Secretary
Laurence WinokerSenior Vice President, CorporateController and Treasurer
Executive ManagementCommitteeJeffrey M. NugentPresident and Chief Executive Officer
Douglas H. GreeffExecutive Vice President and ChiefFinancial Officer
Laurence AronsonPresident, North America Sales
Catherine FisherSenior Vice President,Corporate Communications
Elias HebekaPresident, Worldwide Operationsand Technical Affairs
Graeme HowardManaging Director, Senior Vice PresidentAustralasia/Asia Pacific
Robert K. KretzmanSenior Vice President,General Counsel and Secretary
Giorgio LaurentiPresident, France & Managing Director,Euro Distributors
Kerry McCarterManaging Director, UK, Ireland,Benelux and Scandinavia
Alfred RomanPresident, Latin America
Neil ScancarellaExecutive Vice President,Research and Development
Edward F. SkeffingtonExecutive Vice President,Chief Financial OfficerRevlon Consumer Products USA
Vanessa SolomonExecutive Vice President,Global General Manager,Almay & Portfolio Brands
Herbert VallierSenior Vice President, Human Resources
Cheryl VitaliExecutive Vice President,Global General Manager,Revlon Brand Equity Group
Laurence WinokerSenior Vice President, CorporateController and Treasurer

SHAREHOLDER INFORMATION
REVLON, INC. AND SUBSIDIARIES
Common Stock and Related Stockholder Matters
The Company’s Class A Common Stock, par value $.01 per share, is listed andtraded on the New York Stock Exchange under the symbol ‘‘REV’’. The following tablesets forth the range of high and low closing sales prices as reported by the New YorkStock Exchange for the Company’s Class A Common Stock for each quarter in 1999and 2000.
2000 1999
Quarter High Low High Low
First $ 11 $6.8125 $ 22.25 $ 13.5Second 9.75 6 32 19.125Third 8.125 5.875 29.125 18Fourth 7.375 3.72 12 7.5
As of the close of business on April 12, 2001 there were 766 holders of recordof the Company’s Class A Common Stock. As of the close of business on April 12,2001, the closing sale price as reported by the New York Stock Exchange for theCompany’s Class A Common Stock was $4.34.
The Company has not declared a cash dividend on the Class A Common Stocksubsequent to the Company’s Initial Public Offering and does not anticipate that anydividends will be declared on the Class A Common Stock in the foreseeable future.The declaration and payment of dividends are subject to the discretion of theCompany’s Board of Directors and subject to certain limitations under Delaware law,and are also limited by the terms of the Company’s Credit Agreement and indentures.See ‘‘Management’s Discussion and Analysis of Financial Condition and Results ofOperations’’ and Note 9 of ‘‘Notes to Consolidated Financial Statements’’. The timing,amount and form of dividends, if any, will depend, among other things, on theCompany’s results of operations, financial condition, cash requirements and otherfactors deemed relevant by the Board of Directors of the Company.
Transfer Agent & Registrar Independent AuditorsAmerican Stock Transfer & Trust KPMG LLP59 Maiden Lane New York, New YorkNew York, New York 10007212-936-5100
Notice of AnnualMeetingThe annual meeting ofshareholders will be heldJune 1, 2001 at 10:00 a.m.at the Revlon ResearchCenter, 2121 Route 27,Edison, New Jersey 08818
Corporate AddressRevlon, Inc.625 Madison AvenueNew York, New York 10022212-527-4000
ContactsInvestor Relations212-527-5230
Media212-527-5727
ConsumerInformation Center1-800-4-Revlon
Visit our Web site atwww.revlon.com
The product and brandnames used throughout thisreport are registered orunregistered trademarks ofRevlon Consumer ProductsCorporation.
Printed in the U.S.A.©2001 Revlon, Inc.
This annual report contains forward-looking statements under the caption ‘‘Dear Shareholders’’ which represents Revlon’s expectations andestimates as to future events and financial performance, including the Company’s plans to or expectations with respect to (i) delivering excitingnew products to market quickly; (ii) improving our advertising, packaging, and point of sale presentation; (iii) building a stronger financial base byfocusing on cash flow, operating at competitive margins and investing to balance market share and profitability; (iv) the implementation of our newtrade terms yielding significant cost savings and increasing our ability to support new growth initiatives; (v) that plant consolidation will moreeffectively use our production capacity and our expected annualized savings from plant consolidations; (vi) our expectation that the newcompensation program will deliver results which will contribute to increased shareholder value; (vii) our expectations regarding 2001 including ourexpectations that we will have a continuous flow of new products and advertising and marketing campaigns, continued reductions in SG&A andinvesting savings back into our business, increased efficiencies in manufacturing, improvements in operating income and EBITDA and mutuallyprofitable relationships with our partners; and (viii) our belief that our results in 2001 will lead to enhanced shareholder value and demonstrate thesoundness of our turnaround strategy and the underlying strengths of Revlon. Additionally, statements which use the terms ‘‘believes’’, ‘‘expects’’,‘‘estimates’’, ‘‘forecast’’, ‘‘may’’, ‘‘will’’, ‘‘should’’, ‘‘seeks’’, ‘‘plans’’, ‘‘scheduled to’’, ‘‘anticipates’’, or ‘‘intends’’ or the negative of those terms, orother variations of those terms or comparable language, or the discussion of strategy or intentions are forward-looking. Forward-lookingstatements involve risks and uncertainties and a number of factors could cause actual results to differ materially from those expressed in anyforward-looking statements. Please see ‘‘Management’s Discussion and Analysis of Financial Condition and Results of Operations —Forward-Looking Statements’’ for a full description of these risks, uncertainties and factors. Revlon assumes no responsibility to updateforward-looking information.