dear fellow shareholder -...
TRANSCRIPT


ix Flags is thelargest regionaltheme park
company in the world — anational brand with regionalfocus. Its 20 operating* parkscomprise theme, water andzoological entertainmentdestinations, and contain someof the world’s best thrill rides,ranging from the world’s tallest
and fastest roller coaster to the wooden coaster with the steepest verticaldrop to the ride voted the “Best Steel Coaster” in the world.
While Six Flags remains the industry leader for thrill rides, the Company’sgoal is to balance its offerings, re-positioning itself as the country’s premierregional destination for family-friendly entertainment — from rides to waterattractions, themed areas, parades, concerts and shows, restaurants,games and merchandise outlets. To further advance this goal, theCompany continues to establish relationships with major family-focusedentertainment brands, adding new areas featuring The Wiggles andThomas the Tank Engine & Friends to several of its parks beginning in2007. Six Flags also continues to extend its reach through relationshipswith leading consumer brands,adding Cold Stone Creamery,Nintendo of America and Heinzto its roster of strategicsponsorship and marketingpartners, broadening Six Flags’access to even more consumertouch-points outside of the parkgates and complementingongoing alliances with CocaCola, Papa John’s Pizza andThe Home Depot.
In 2006, Six Flags celebrated its 45th Anniversary.
* Six Flags New Orleans remains closed due to damage suffered during HurricaneKatrina.
S
1
Dear Fellow Shareholder:
Six Flags today is a very different company from what it was at the beginning of 2006.
More importantly, a visit to one of our theme parks is a very different experience.And after a busy transitional year in 2006 — a year in which we invested in our franchise,formed important alliances, began the process of re-sizing the company in order to regainsolid financial footing and created a more family-friendly atmosphere in all our parks — we’vekicked off the 2007 season with a tremendous sense of excitement.
This year will fully reflect the new management team’s influence on all aspects of ourbusiness, from budgeting, planning, marketing and pricing to the oversight of day-to-dayoperations. Since the management transition in the final weeks of 2005 we’ve transformedSix Flags in many ways, and we’ve developed a strategy to leverage the company’stremendous brand and assets.
Before I get into those details, it’s important to note that despite all the changes andchallenges, we maintained top-line financial performance in 2006 while building a platform fordynamic growth. Full-year revenues from continuing operations fell only $11.1 million (1%) to
$945.7 million, despite the continued closure of our New Orleans park,which in 2005 generated $13.1 million in revenue prior to HurricaneKatrina. Excluding the impact of the New Orleans park, 2006 revenuesfrom continuing operations were up $2.0 million over the prior yearrecord revenues.
A Whole New Guest Experience
The heart of our turnaround strategy for Six Flags is to rejuvenate ourbrand by transforming our parks from collections of rides into genuinetheme parks — with diversified entertainment offerings. We’ve put out thewelcome mat for parents (and grandparents) with young children. We’vemade it a company priority to clean up the parks. And by instituting a newGuest Code of Conduct, signing a deal with Nintendo of America aroundthe Wii video game system and expanding our relationship withskateboard legend Tony Hawk to include a new ride, “Tony Hawk’s BigSpin,” Six Flags has also broadened the experience for teenagers. SixFlags will be an entertainment destination for people of all ages.
By welcoming more families to the parks we will increase attendance,access new revenue streams and increase per capita guest spending. In 2006, we witnessedthe power of higher per capita spending to offset declines in attendance. This year, we’relooking forward to a multiplier effect when both factors increase on parallel tracks.
Daily Festivals of Fun for the Kids
A visit to a Six Flags park now means a wide variety of offerings in both hardware andsoftware. “Streetmosphere” will live and breathe as you walk between rides. A parade ofcostumed characters will walk among the crowds every hour of every operating day, and we’llwelcome new additions for 2007 as The Wiggles and Thomas the Tank Engine join our family.
The Wiggles will bring their following to new “Wiggles World” themed areas in New York,Chicago and New England this year, with others slated for launch over the next five years.When The Wiggles tour the United States they’ll make stops at our parks, and at their majorconcerts they’ll distribute Six Flags coupons, promote the parks and conclude the concerts byinviting kids to visit Six Flags. Families will also be able to purchase Wiggles merchandise atour parks at new retail outlets adjacent to the attractions.

2
Our agreement with HIT Entertainment will enable usto launch Thomas the Tank Engine-themed areas forkids this year at Six Flags New England inMassachusetts and Six Flags Discovery Kingdom nearSan Francisco, with other park launches scheduledover the next three years. These “Thomas Towns” willinclude attractions, rides and merchandise featuringThomas the Tank Engine and other friends from theIsland of Sodor. These deals are the first of their kindfor both The Wiggles and Thomas & Friends with aU.S. theme park company.
Our Looney Tunes and Justice League characterscontinue to delight kids of all ages and provide contentfor our advertising, marketable capital and in-parkspending initiatives. The “Brunch With Bugs” programhas been a tremendous success — guests sign up at the gate or in advance on our website, and enjoy ameal with the characters, photos with Bugs Bunny and membership in our Carrothead Club. At manyparks guests can buy a “Flash Pass,” which holds a virtual place in line on popular rides and alerts themelectronically when it’s their turn for priority boarding.
We’ve even begun to create our own original content with Operation SpyGirl, a live action adventureshow created and produced exclusively for Six Flags by Joel Surnow, the creator of the Emmy- andGolden Globe Award-winning dramatic series “24.” This spring, SpyGirl will battle a relentlessly tickingclock and the evil arch-villain Max Condor at Six Flags Great America in Chicago.
Another new initiative came in response to families seeking special treatment — the Six Flags VIPProgram, which debuts this year at all our U.S. parks. The VIP Program includes front-of-the-line accessto rides, all meals and snacks, preferred parking, reserved seating at shows, a private character meet-and-greet and merchandise gift bags. We’ll contact VIPs in advance to help plan a tailored trip, so whenthey arrive at the park they can explore without delay with their very own specially-trained tour guide. At$199 to $249 per person, depending on the park, I believe this initiative will supply the premiumexperience that many of our guests have long desired.
Still a Thrill for Teens
While the parks are about more than just thrill rides, Six Flags has been the industry leader in rollercoasters for years, and we fully intend to enhance that reputation.
In 2007, guests will experience a full season with a number of thrill rides that were available for only aportion of the 2006 season. These include El Toro at Six Flags Great Adventure just outside New York,Catapult at Six Flags New England and Tatsu at Six Flags Magic Mountain in Los Angeles.
Beyond the two “Tony Hawk’s Big Spin” coasters — which mimic the movements of skateboarding — thatare now open at Six Flags Fiesta Texas in San Antonioand Six Flags St. Louis, Tony will bring his Boom BoomHuckJam action sports show, featuring some of thegreatest skateboard, BMX and freestyle motocrossperformers in the world, to five parks this summer.
At six of our parks we’ll offer the Thursday NightConcert Series all summer long live music under thestars by leading acts every week from Memorial Day toLabor Day. Some of our headliners this year are ChrisDaughtry, Cheyenne, Jesse McCartney and Ne-Yo.
Corporate Alliances Aid in Marketing and Improvethe Guest Experience
A year ago, aligning ourselves with major corporatesponsors was a strategic focus — so we created a

3
Corporate Alliance unit to market our brand and forgerelationships that would boost our attendance andimprove operational performance. When the newmanagement team took control, we inherited onemajor alliance, Coca-Cola, and while we’ve built onthat relationship, we’ve since teamed up with otherwell-known consumer brands such as Papa John’sPizza, The Home Depot and Kodak. These alliancesemphasize the fact that by working closely with us,smart marketers can engage a captive audience ofnearly 30 million guests who are increasingly difficultto reach in the fragmented media marketplace.Further, the partnerships allow us to create andaccess tens of thousands of new marketing touch-points for Six Flags, a key element that will help usdeliver on our performance goals and brand strategy:
• We’re opening Cold Stone Creamery locations in eight parks in 2007, featuring the ultimate incustom ice cream creations. The marketing components of this alliance include a free kid’s ticket toanyone who makes a purchase at almost 800 Cold Stone Creamery stores across the U.S., aunique offer designed to entice the whole family to visit; a new “Six Flags Cookie Coaster Crunch”flavor available at Cold Stone Creamery locationsnationwide; and promotions for Six Flags acrossthe country in Cold Stone Creamery stores.
• Heinz will be the Official Ketchup of Six Flagsparks, and over the term of the partnership willfeature peel-away labels on Heinz Ketchup bottleswith special Six Flags promotional offers.
• Papa John’s Pizza is our official pizza, and isproviding us with significant marketing valuethrough in-store promotions, pizza box-topadvertising and coupons.
• Kodak will expand our in-park photographyoptions and run the Six Flags Photo outlets in theparks, snapping pictures of our guests on thrillrides and posing with characters, which will beavailable for purchase in-park and online. Additionally, Kodak retailers will distribute Six Flagscoupons along with developed prints.
• Home Depot stores near our parks will promote us in all their stores within a 150-mile radius of aSix Flags park as well as online, giving us additional touch-points with consumers, and they’ll be ourexclusive supplier of certain construction and repair products.
• Nintendo of America will offer complimentary game-playing at Wii Gaming Stations in select Six Flags-branded theme parks, as well as online promotionsand a sweepstakes to give away a Wii every weekall summer long. The Wii gaming console — themost popular gaming console in America — is theOfficial Gaming Console of Six Flags.
• Our most recent alliance was signed in early2007: We’ll be opening 26 Johnny Rocketsrestaurants in our parks over the next three years,and we’ll collaborate on marketing andpromotional initiatives at more than 200 JohnnyRockets restaurants around the country.
In addition to these major alliances, we established orexpanded relationships with K’NEX, Chase, McDonald’s,

4
Sara Lee and Panda Express, with more to come. Weexpect these alliances and sponsorships to bring in$38 million in revenue for 2007. At the same time, theirproducts and services will help to improve our guestexperience, broaden the Six Flags “footprint” and makeus a more ubiquitous brand.
The other major component of our marketing, ofcourse, is advertising. Last season, early upfront TVand radio advertising for season passes was absentfrom our campaign due to the late managementtransition, and later in the season we reducedadvertising, reallocating the investment to improve ourpark operations. For the 2007 season, we’ll be muchmore aggressive with a much better and variedproduct. As such, we’ll spend $130 million onadvertising this year, as opposed to $105 million last year — and with a much earlier buy for 2007, we’llget more value for the dollar.
We’ve also dramatically revamped our website,SixFlags.com, making it easier to navigate andexpanding online purchasing options, including tickets,season passes, meal vouchers, Flash Passes, BrunchWith Bugs and Six Flags merchandise. I am a greatbeliever in leveraging technology inside the park andout to upgrade the guest experience, drive efficiencies,boost productivity and improve operations. Theseefforts will continue.
Park Sales Will Help Reduce Debt
Earlier this year we announced an agreement to sellseven parks for $312 million, consisting of $275 millionin cash and a $37 million note receivable. The parksin Buffalo, Denver, two in Oklahoma City, Houston,Concord (CA), and Seattle were sold to PARC 7F-
Operations Corporation of Jacksonville, FL, which will continue to operate them as parks.
The sale, combined with the June 2006 sale of the land underthe former Houston AstroWorld theme park for $77 million,provides gross cash proceeds of $352 million for debt reduction.We have every intention of driving free cash flow and continuingto reduce the debt in the coming years.
Importantly, we elected not to sell Six Flags Magic Mountain andHurricane Harbor in Los Angeles. We found that we could obtainsuitable proceeds through the sale of the seven non-core parkswithout having to divest the Los Angeles properties. MagicMountain and Hurricane Harbor will be a major focus of ouradvertising spend this year.
The Faces of Six Flags
Beyond the capital and marketing investments or the improvedbalance of our entertainment offerings, I’m certain that thequality of the Six Flags experience often comes down to howwell the guests are treated by our full-time and seasonalemployees.
Therefore, this season will mark the rollout of universal customerservice training for all employees. We’ve renewed a commitment

to diversity while at the same time being moreselective in our hiring. We’ve raised wages andprovided incentives to retain our best people.I personally visited every one of our parks prior toseason opening, and have met town meeting-style withthousands of our employees — not just senior-levelpark management, but open sessions for all employeesand focus groups with seasonal employees from prioryears. I can tell you that morale is high, but moreimportantly I see a renewed sense of pride around thecompany.
There’s More to Come
The 2007 season will mark the beginning of a new erafor Six Flags. A new culture will deliver a betterproduct, and our marketing efforts to showcase that product will draw millions of people back to sampleour offerings, rebuilding our branded image to be synonymous with an outstanding family entertainmentexperience. This in turn will generate value for our shareholders.
It’s going to be an exciting ride. Come help us raise the Flag.
Sincerely,
Mark ShapiroPresident and Chief Executive Officer
5

BUSINESS
Introduction
We are the largest regional theme park operator in theworld engaged solely in the theme park business. The27 parks we operated in 2006 (excluding our New Orleanspark, which has been closed since Hurricane Katrina in2005, our Sacramento, California water park, which wesold after the 2006 season and our Columbus, Ohio waterpark, which we sold in November 2006) had attendance ofapproximately 28.5 million during the 2006 season. Inaddition, in January 2007, we agreed to sell seven ofour parks (the “Sale Parks”) in a single transaction. See“Recent Developments — Park Sales.” Excluding the SaleParks, the 2006 attendance was approximately24.8 million.
In 1998, we acquired the former Six Flags, which hadoperated regional theme parks under the Six Flags namefor nearly forty years and established a nationally recog-nized brand name. We have worldwide ownership of the“Six Flags” brand name. To capitalize on this name rec-ognition, 19 of our parks (excluding the Sale Parks) arebranded as “Six Flags” parks.
We hold exclusive long-term licenses for theme parkusage throughout the United States (except the Las Vegasmetropolitan area), Canada, Mexico and other countries ofcertain Warner Bros. and DC Comics characters. Thesecharacters include Bugs Bunny, Daffy Duck, Tweety Bird,Yosemite Sam, Batman, Superman and others. In addi-tion, we have certain rights to use the Hanna-Barbera andCartoon Network characters, including Yogi Bear, Scooby-Doo, Flintstones and others. We use these characters tomarket our parks and to provide an enhanced familyentertainment experience. Our licenses include the rightto sell merchandise featuring the characters at the parks,and to use the characters in our advertising, as walk-around characters and in theming for rides, attractionsand retail outlets. We believe using these characters pro-motes increased attendance, supports higher ticketprices, increases lengths-of-stay and enhances in-parkspending.
Our parks are located in geographically diverse marketsacross North America. Our theme parks offer a completefamily-oriented entertainment experience. Our themeparks generally offer a broad selection of state-of-the-artand traditional thrill rides, water attractions, themed areas,concerts and shows, restaurants, game venues and retailoutlets. In the aggregate, during 2006 our theme parks(excluding the Sale Parks, and our Columbus, Ohio andSacramento, California water parks) offered more than900 rides, including over 130 roller coasters, making usthe leading provider of “thrill rides” in the industry.
We believe that our parks benefit from limited directcompetition, since the combination of a limited supply ofreal estate appropriate for theme park development, high
initial capital investment, long development lead-time andzoning restrictions provides each of our parks with a sig-nificant degree of protection from competitive new themepark openings. Based on our knowledge of the develop-ment of other theme parks in the United States, we esti-mate that it would cost over $150 million and would take aminimum of two years to construct a new regional themepark comparable to one of our major Six Flags-brandedtheme parks.
Recent Developments
Park Sales
In January 2007, we agreed to sell to PARC 7F-Operations Corporation the stock of our subsidiaries thatown three of our water parks and four of our theme parksfor an aggregate purchase price of $312 million, consistingof $275 million in cash, subject to adjustment, and a notereceivable for $37 million. Pursuant to the sales agree-ment, we agreed to provide a limited guarantee to a cred-itor of the buyer related to the future results of operations ofthe seven parks of up to $10 million, decreasing by onemillion dollars annually. The Sale Parks are Six FlagsDarien Lake near Buffalo, NY; Waterworld USA in Con-cord, CA; Six Flags Elitch Gardens in Denver, CO; Splash-town in Houston, TX; Frontier City theme park and theWhite Water Bay water park in Oklahoma City, OK; andWild Waves and Enchanted Village near Seattle, WA.
We have recorded a non-cash impairment chargeagainst assets held for sale in connection with this trans-action in our consolidated financial statements for the yearended December 31, 2006 in the amount of $84.5 million.The net proceeds from the sale will be used to repayindebtedness. The sale is subject to satisfaction of cus-tomary closing conditions, including the receipt of requiredthird party consents.
Sacramento and Columbus Properties
During the first quarter of 2006, we exercised our right toterminate the ground lease at our Sacramento, Californiawater park following the 2006 season. In March 2007, wesold substantially all of the assets of the water park forapproximately $950,000. In November 2006, we com-pleted the sale of substantially all of the assets of ourwater park in Columbus, Ohio to our lessor, the ColumbusZoo for $2.0 million. The net proceeds from the sale ofeach of the Sacramento and Columbus assets were, or willbe, used to repay indebtedness.
Six Flags New Orleans
Our New Orleans park sustained extensive damage inHurricane Katrina in late August 2005, has not reopened
6

since that time, and will not reopen for the 2007 season.We have determined that our carrying value of the assetsdestroyed is approximately $32.5 million. This amountdoes not include the property and equipment owned bythe lessor, which is also covered by our insurance policies.The park is covered by up to approximately $180 million inproperty insurance, subject to a deductible in the case ofnamed storms of approximately $5.5 million. The propertyinsurance covers the full replacement value of the assetsdestroyed and includes business interruption coverage.Although the flood insurance provisions of the policiescontain a $27.5 million sublimit, the separate “NamedStorm” provision, which explicitly covers flood damage,is not similarly limited. Based on advice from our insuranceadvisors, we do not believe the flood sublimit to be appli-cable. In December 2006, we commenced a declaratoryaction in Louisiana seeking judicial determination that theflood insurance sublimit is not applicable.
We have filed property insurance claims, including busi-ness interruption, with our insurers. Since, in any event, weexpect to recover therefrom an amount in excess of our netbook value of the impaired assets, we established aninsurance receivable in an amount equal to the carryingvalue of those assets of $32.5 million plus $4.0 million inbusiness interruption coverage to compensate for costsincurred while the park has been closed. As of Decem-ber 31, 2006, we have received payments from our carriersin the amount of $25.0 million bringing the total insurancereceivable balance to $11.5 million at that date. We cannotestimate at this time when, or if, the park will be back inoperation. We are contractually committed to rebuildingthe park, but only to the extent of insurance proceedsreceived, including proceeds covering the damage tothe lessor’s assets. We cannot be certain that our currentestimates of the extent of the damage will be correct.
Management Change
Following a successful consent solicitation by Red ZoneLLC, an entity controlled by Daniel M. Snyder, in Decem-ber 2005, Mr. Snyder became Chairman of our Board ofDirectors and two designees of Red Zone LLC becamedirectors, including Mark Shapiro, who was elected Pres-ident and Chief Executive Officer at that time. In 2006, ourBoard of Directors approved substantial changes to seniormanagement, including several park presidents (formerlyreferred to as general managers) and new managementbegan to effectuate a series of long-term operating initia-tives including (i) expanding the family entertainment offer-ing of the parks by adding additional shows, parades,fireworks and character events utilizing the Warner Bros.and DC Comics licensed property, (ii) enhancing the guestexperience by improving the overall appearance andcleanliness of the parks, (iii) reviewing our asset base todetermine whether any non-core assets, including underu-tilized land, should be sold, (iv) changing advertising agen-cies and redesigning our advertising campaigns and
(v) increasing future sponsorship and promotional reve-nues as well as driving increased value from admissionsand in-park revenues.
These initiatives were not fully implemented for the 2006season and even when fully implemented, there can be noassurance that they will result in increased attendanceand/or revenue. See “Risk Factors — Implementation of anew operational plan — a change in our strategy mayadversely impact our operations” and “— New ExecutiveOfficers/Board of Directors — our new management doesnot have proven success with Six Flags.”
2006 Results and 2007 Plan
Fiscal 2006 was a transition year for us. We believe thatour operating results in 2006 were adversely affected by(i) a 6.5% increase in operating expenses designed toimprove the guest experience and, to a lesser extent,arising out of the management change and (ii) a 13.4%decrease in attendance due in part to delayed advertisingexpenses and difficult weather comparisons. The atten-dance decline was offset in large part by a 14.2% increasein total revenue per capita. See “Management’s Discus-sion and Analysis of Financial Condition and Results ofOperation.”
In 2007, we plan to focus on executing an enhancedmarketing plan, including both increased media andinvestments designed to continue the growth of seasonpasses, group and online sales. In addition, we are con-tinuing the efforts commenced in 2006 to offer a morefamily friendly diversified entertainment product. Forexample, our new entertainment initiatives for 2007include, among others, (i) building Thomas & FriendsTM-themed areas at two parks, (ii) creating “Wiggles Worlds”-themed areas at three parks including rides and attractionsfeaturing the popular children’s entertainers, The Wiggles,(iii) expanding on our existing relationship with Tony Hawkby introducing Tony Hawk-themed family spinning coast-ers at two parks and (iv) introducing new shows at certainof our parks. We will also continue to implement initiativesintended to grow in-park spending aided by the benefit ofhaving a full year with recently introduced brands like PapaJohn’s, the introduction of new brands like Cold StoneCreamery and Sara Lee, targeted price increases andimproved staffing.
Description of Parks
Six Flags America
Six Flags America is a combination theme and waterpark located in Largo, Maryland (approximately 15 mileseast of Washington, D.C. and 30 miles southwest ofBaltimore, Maryland). The park’s primary market includesMaryland, northern Virginia, Washington, D.C. and parts ofPennsylvania and Delaware. This market provides thepark with a permanent resident population of
7

approximately 7.4 million people within 50 miles and12.4 million people within 100 miles. Based on a 2006survey of television households within designated marketareas (“DMAs”) published by A.C. Nielsen MediaResearch, the Washington, D.C. and Baltimore marketsare the number 8 and number 24 DMAs in the UnitedStates, respectively.
Six Flags America is located on a site of 523 acres, with131 acres currently used for park operations.1 Approxi-mately 300 acres of the balance of the site are available forfuture development, as well as the potential to developcomplementary operations. We may also determine todispose of some of the additional acreage not necessaryfor the park’s operations.
Six Flags America’s principal competitors are King’sDominion Park, located in Doswell, Virginia (near Rich-mond); Hershey Park, located in Hershey, Pennsylvania;and Busch Gardens, located in Williamsburg, Virginia.These parks are located approximately 120, 125 and175 miles, respectively, from Six Flags America.
Six Flags Discovery Kingdom
Six Flags Marine World was re-named Six Flags Dis-covery Kingdom in January 2007. It features rides, marinemammals and land animals. Six Flags Discovery Kingdomis located in Vallejo, California, approximately 30 milesfrom San Francisco, 20 miles from Oakland and 60 milesfrom Sacramento. This market provides the park with apermanent resident population of approximately 5.7 millionpeople within 50 miles and approximately 10.7 millionpeople within 100 miles. The San Francisco/Oaklandand Sacramento areas are the number 6 and number19 DMAs in the United States, respectively.
We operate the park in partnership with the City ofVallejo. The city receives a nominal rent from the partner-ship and 20% of the cash flow generated by the combinedoperations of the park after operating expenses and debtservices. We receive, in addition to between $250,000 and$500,000 in management fees depending on certain parkrevenues, 80% of the cash flow generated by the com-bined operations of the park after operating expenses anddebt service. Finally, we have the option to purchase theentire park interests and real estate exercisable throughFebruary 2010.
Six Flags Discovery Kingdom is located on approxi-mately 135 acres and offers various rides and other tra-ditional theme park attractions, as well as presentationstadiums, animal habitats and picnic areas, bordering a55-acre man-made lake. The park provides for the shelterand care for marine mammals, land animals, sharks, birdsand reptiles, tropical and cold water fish and marine
invertebrates, all featured in a variety of exhibits and par-ticipatory attractions.
Six Flags Discovery Kingdom’s principal competitors areAquarium of the Bay at Pier 39 in San Francisco, GreatAmerica in Santa Clara, Gilroy Gardens in Gilroy andOuter Bay at Monterey Bay Aquarium. These attractionsare located approximately 30, 60, 100 and 130 miles fromSix Flags Discovery Kingdom, respectively.
Six Flags Fiesta Texas
Six Flags Fiesta Texas is a combination theme andwater park located on approximately 216 acres inSan Antonio, Texas. The San Antonio, Texas market pro-vides the park with a permanent resident population ofapproximately 2.1 million people within 50 miles andapproximately 3.7 million people within 100 miles. TheSan Antonio market is the number 37 DMA in the UnitedStates.
Six Flags Fiesta Texas’ principal competitor is SeaWorld of Texas, also located in San Antonio. In addition,the park competes to a lesser degree with Schlitterbahn, awater park located in New Braunfels, Texas (approximately33 miles from the park) and Six Flags Over Texas, locatedin Arlington, Texas (approximately 285 miles from thepark).
Six Flags Great Adventure, Six Flags HurricaneHarbor and Six Flags Wild Safari
Six Flags Great Adventure, the separately gated adja-cent Six Flags Hurricane Harbor, and Six Flags Wild Safariare each located in Jackson, New Jersey, approximately70 miles south of New York City and 50 miles east ofPhiladelphia. The New York and Philadelphia marketsprovide the parks with a permanent resident populationof approximately 14.3 million people within 50 miles andapproximately 28.1 million people within 100 miles. TheNew York and Philadelphia markets are the number 1 andnumber 4 DMAs in the United States, respectively.
These parks are located on a site of approximately2,200 acres, of which approximately 635 acres are cur-rently used for park operations. Approximately 700 acresof the balance of the site are available for future develop-ment. The animal park is home to over 1,200 animalsrepresenting more than 55 species, which can be seenover a four and one-half mile drive. Six Flags Great Adven-ture’s principal competitors are Hershey Park, located inHershey, Pennsylvania, approximately 150 miles from thepark and Dorney Park, located in Allentown, Pennsylvania,approximately 75 miles from the park. The water parkcompetes with several other water parks in the market.
8
1 Acreage figures for park operations as used in this section captioned “Description of Parks” include land used forparking, support facilities and other ancillary uses.

Six Flags Great America
Six Flags Great America is a combination theme andwater park, located in Gurnee, Illinois, between Chicago,Illinois and Milwaukee, Wisconsin. The Chicago and Mil-waukee markets provide the park with a permanent res-ident population of approximately 8.8 million people within50 miles and approximately 13.5 million people within100 miles. The Chicago and Milwaukee markets are thenumber 3 and number 33 DMAs in the United States,respectively.
Six Flags Great America is located on a site of approx-imately 304 acres of which approximately 234 acres areused for the park operations and approximately 35 acresare available for future development. A substantial portionof the unused acres is unsuitable for development. SixFlags Great America currently has no direct theme parkcompetitors in the region, but does compete to someextent with Kings Island, located near Cincinnati, Ohio,approximately 350 miles from the park; Cedar Point,located in Sandusky, Ohio, approximately 340 miles fromthe park; and Six Flags St. Louis, our park located outsideSt. Louis, Missouri, approximately 320 miles from the park.The water park competes with numerous water parks inthe Wisconsin Dells area, approximately 170 miles fromthe park.
Six Flags Kentucky Kingdom
Six Flags Kentucky Kingdom is a combination themeand water park, located on approximately 58 acres on andadjacent to the grounds of the Kentucky Fair and Exposi-tion Center in Louisville, Kentucky. Of the 58 acres,approximately 38 acres are leased under ground leaseswith terms (including renewal options) expiring between2021 and 2049, with the balance owned by us. The park’sprimary market includes Louisville and Lexington, Ken-tucky, Evansville and Indianapolis, Indiana and Nashville,Tennessee. This market provides the park with a perma-nent resident population of approximately 1.5 million peo-ple within 50 miles and approximately 4.8 million peoplewithin 100 miles. The Louisville and Lexington markets arethe number 50 and number 63 DMAs in the United States.
Six Flags Kentucky Kingdom’s significant direct com-petitors are Kings Island, located near Cincinnati, Ohio,approximately 130 miles from the park and Holiday Worldlocated in Santa Claus, Indiana, approximately 75 milesfrom the park.
Six Flags Magic Mountain and Six Flags HurricaneHarbor
Six Flags Magic Mountain, and the separately gatedadjacent Six Flags Hurricane Harbor are located in Valen-cia, California, 30 miles north of Los Angeles. The LosAngeles, California market provides the parks with a per-manent resident population of approximately 10.6 million
people within 50 miles and approximately 17.7 millionpeople within 100 miles. The Los Angeles market is thenumber 2 DMA in the United States.
The parks are located on a site of approximately260 acres. Six Flags Magic Mountain’s principal compet-itors include Disneyland and Disney’s California Adven-ture, each in Anaheim, California, located approximately60 miles from the park, Universal Studios Hollywood inUniversal City, California, located approximately 20 milesfrom the park, Knott’s Berry Farm in Buena Park, Califor-nia, located approximately 50 miles from the park, SeaWorld of California in San Diego, California, locatedapproximately 150 miles from the park and Legoland inCarlsbad, California, located approximately 120 miles fromthe park.
Six Flags Hurricane Harbor’s competitors include SoakCity USA Waterpark and Raging Waters, each locatedapproximately 50 miles from the water park.
Six Flags Mexico
In May 1999, we acquired Reino Aventura, the largestpaid admission theme park in Mexico, which wasrebranded as Six Flags Mexico in the 2000 season. Thepark first opened in 1982 and is located on approximately110 acres in Mexico City, which we occupy on a long-termbasis pursuant to a concession agreement with the Fed-eral District of Mexico.
The park’s primary market includes Mexico City, Cuer-navaca, Puebla and Toluca. This market provides the parkwith a permanent resident population of approximately25 million people within 50 miles of the park and approx-imately 35 million people within 100 miles of the park. SixFlags Mexico’s principal competitor is Chapultepec, anamusement park located in Mexico City.
Six Flags New England
Six Flags New England is a combination theme andwater park, located off Interstate 91 near Springfield,Massachusetts, approximately 90 miles west of Boston.The primary market for Six Flags New England includesSpringfield and western Massachusetts, Hartford andwestern Connecticut, as well as portions of eastern Mas-sachusetts (including Boston) and eastern New York. Thismarket provides the park with a permanent resident pop-ulation base of approximately 3.2 million people within50 miles and 15.8 million people within 100 miles. Spring-field, Providence, Hartford/New Haven and Boston are thenumber 108, number 51, number 28 and number 5 DMAsin the United States, respectively. Six Flags New Englandis comprised of approximately 263 acres, with approxi-mately 134 acres currently used for park operations. Asubstantial portion of the excess land is not suitable fordevelopment due to wetlands and other restrictions.
9

Six Flags New England’s significant direct competitor isLake Compounce located in Bristol, Connecticut, approx-imately 50 miles from Six Flags New England. To a lesserextent, Six Flags New England competes with The GreatEscape, our park located in Lake George, New York,approximately 150 miles from Six Flags New England.
Six Flags New Orleans
Six Flags New Orleans, a theme park located in NewOrleans, Louisiana, was extensively damaged by Hurri-cane Katrina and did not open for the 2006 season and willnot open for the 2007 season. The facility is located onapproximately 140 acres. We lease, on a long-term basis,the land on which the park is located together with most ofthe rides and attractions existing at the park. We also owna separate 86 acre parcel. See “Recent Developments —Six Flags New Orleans.”
Six Flags Over Georgia and Six Flags White WaterAtlanta
Six Flags Over Georgia is located on approximately283 acres, 20 miles outside of Atlanta, Georgia. TheAtlanta, Georgia market provides the park with a perma-nent resident population of approximately 5.0 million peo-ple within 50 miles and approximately 8.0 million peoplewithin 100 miles. The Atlanta market is the number 9 DMAin the United States.
In May 1999, the partnership that owns Six Flags OverGeorgia purchased White Water Atlanta, a water park andrelated entertainment park located approximately 20 milesfrom the theme park. Six Flags White Water Atlanta islocated on approximately 69 acres. Approximately12 acres remain undeveloped.
Six Flags Over Georgia’s primary competitors includethe Georgia Aquarium located in Atlanta, Carowinds inCharlotte, North Carolina, located approximately 250 milesfrom the park, Alabama Adventure in Birmingham, Ala-bama, located approximately 160 miles from the park,Dollywood in Pigeon Forge, Tennessee, located approxi-mately 200 miles from the park and Wild Adventures inValdosta, Georgia, located approximately 240 miles fromthe park. Six Flags White Water’s primary competitorsinclude Sun Valley Beach, Atlanta Beach, Lake LanierIslands and Dollywood’s Splash Country in Pigeon Forge,Tennessee. These competitors are located approxi-mately 15, 40 and 45 miles away from the water park,respectively. The Georgia Limited Partnership (as definedbelow) owns the theme park site of approximately283 acres, including approximately 50 acres of usable,undeveloped land, all of which is leased to Six Flags OverGeorgia II, L.P. (the “Georgia Partnership”).
Partnership Structure. The Georgia park is owned(excluding real property) by Six Flags Over Georgia II, L.P.(the “Georgia Partnership”) of which our wholly-owned
subsidiary is the 1% managing general partner. We pur-chased approximately 25% of the limited partnership unitsof the 99% limited partner (the “Georgia Limited Partner-ship”) of the Georgia Partnership in a 1997 tender offer atan aggregate price of $62.7 million. The Georgia partner-ship arrangements expire in 2027. See “Business — Part-nership Park Arrangements” for a more detaileddiscussion of our obligations under these arrangements.
Six Flags Over Texas and Six Flags HurricaneHarbor
Six Flags Over Texas and the separately gated Six FlagsHurricane Harbor are located across Interstate 30 fromeach other in Arlington, Texas, between Dallas andFort Worth, Texas. The Dallas/Fort Worth market providesthe parks with a permanent resident population of approx-imately 5.8 million people within 50 miles and approxi-mately 6.9 million people within 100 miles. The Dallas/Fort Worth market is the number 7 DMA in the UnitedStates.
Six Flags Over Texas’ principal competitors include SeaWorld of Texas and our Six Flags Fiesta Texas park, bothlocated in San Antonio, Texas, approximately 285 milesfrom the park. Six Flags Hurricane Harbor has no directcompetitors in the area other than a municipal water park.The Texas Limited Partner (as defined below) owns a siteof approximately 217 acres of which 187 acres are used forthe theme park. In addition, we own directly approximately47 acres, of which approximately 45 acres are currentlyused for Hurricane Harbor and 2 acres remainundeveloped.
Partnership Structure. Six Flags Over Texas isowned (excluding real property) by Texas Flags, Ltd.(the “Texas Partnership”), a Texas limited partnership ofwhich the 1% managing general partner is our wholly-owned subsidiary. The 99% limited partner (the “TexasLimited Partner”) is unaffiliated with us except that we ownapproximately 38% of the limited partnership units in theTexas Limited Partner. We purchased approximately 33%of the units in a tender offer in 1998 at an aggregate price of$126.2 million. Six Flags Hurricane Harbor is 100% ownedby us and is not included in these partnership arrange-ments. The Texas partnership arrangements expire in2028. See “Business — Partnership Park Arrangements”for a more detailed discussion of our obligations underthese arrangements.
Six Flags St. Louis
Six Flags St. Louis is a combination theme and waterpark located in Eureka, Missouri, about 35 miles west ofSt. Louis, Missouri. The St. Louis market provides the parkwith a permanent resident population of approximately2.7 million people within 50 miles and approximately3.9 million people within 100 miles. The St. Louis marketis the number 21 DMA in the United States.
10

We own a site of approximately 497 acres of whichapproximately 224 acres are used for park operationsand approximately 245 acres are available for future devel-opment. Six Flags St. Louis competes with Kings Island,located near Cincinnati, Ohio, approximately 350 milesfrom the park; Worlds of Fun in Kansas City, Missouri,located approximately 250 miles from the park; CedarPoint, located in Sandusky, Ohio, approximately 515 milesfrom the park; Silver Dollar City, located in Branson, Mis-souri, approximately 250 miles from the park; and SixFlags Great America, our park located near Chicago,Illinois, approximately 320 miles from the park.
La Ronde
La Ronde, a theme park located in the City of Montreal,is located on the 146 acre site of the 1967 Montreal WorldsFair. Montreal has a metropolitan population of approxi-mately 3.7 million and is a major tourist destination. Thismarket provides the park with a permanent resident pop-ulation of approximately 4.3 million people within 50 milesof the park and 5.8 million people within 100 miles. Thepark’s competitors are the Quebec City Water Park, ourpark at Lake George, The Great Escape, and ParamountCanada’s Wonderland, approximately 130, 170 miles and370 miles respectively from La Ronde.
The Great Escape and Six Flags Great EscapeLodge & Indoor Waterpark
The Great Escape, which opened in 1954, is a combi-nation theme and water park located off Interstate 87 in theLake George, New York resort area, 180 miles north ofNew York City and 40 miles north of Albany. The park’sprimary market includes the Lake George tourist popula-tion and the upstate New York and western New Englandresident population. This market provides the park with apermanent resident population of approximately 1.1 millionpeople within 50 miles of the park and 3.2 million peoplewithin 100 miles. According to information released bylocal governmental agencies, more than 7.0 million tour-ists visited Warren County, which includes the LakeGeorge area, in 2005. The Albany market is the number65 DMA in the United States.
In February 2006, the Six Flags Great Escape Lodge &Indoor Waterpark, which is located across from The GreatEscape & Splashwater Kingdom, opened. In addition to a200 suite hotel, the facility features a 38,000-square footindoor water park. The facility is owned by a joint venture inwhich we hold a 41% interest. We also manage the facilityfor a management fee equal to 5% of the hotel’s grossreceipts. We have guaranteed the payment of a $32.1 mil-lion construction loan incurred by the joint venture. See“Management’s Discussion and Analysis of Financial Con-dition and Results of Operation — Liquidity, Capital Com-mitments and Resources — Off-balance sheetarrangements and aggregate contractual obligations.”
The Great Escape is located on a site of approximately345 acres, with approximately 132 acres currently used forpark operations. Approximately 27 undeveloped acres aresuitable for park expansion. The Great Escape’s primarydirect competitor is Six Flags New England, our parklocated near Springfield, Massachusetts, approximately150 miles from The Great Escape. In addition, there is asmaller water park located in Lake George.
The following is a description of the Sale Parks that wehave agreed to sell to PARC 7F-Operations Corporation:
Six Flags Darien Lake
Six Flags Darien Lake, a combination theme and waterpark, is the largest theme park in the State of New York. SixFlags Darien Lake is located off Interstate 90 in DarienCenter, New York, approximately 30, 40 and 120 milesfrom Buffalo, Rochester and Syracuse, New York, respec-tively. The park’s primary market includes upstate NewYork, western and northern Pennsylvania and southernOntario, Canada. This market provides the park with apermanent resident population of approximately 2.1 millionpeople within 50 miles of the park and 3.1 million within100 miles. The Buffalo, Rochester and Syracuse marketsare the number 49, number 79 and number 76 DMAs in theUnited States, respectively.
The Six Flags Darien Lake property consists of approx-imately 978 acres, including 164 acres for the theme park,242 acres of campgrounds and approximately 390 usableexcess acres. Six Flags Darien Lake also has a20,000 seat amphitheater. We have a long-term arrange-ment with an independent concert promoter to lease andoperate the amphitheater.
Adjacent to the Six Flags Darien Lake theme park are a163 room hotel and a camping resort, each owned andoperated by us. The campgrounds include 700 developedcampsites, including 397 recreational vehicles (RV’s)available for daily and weekly rental. The campground isone of the largest in the United States. In 2006, approx-imately 320,000 people used the Six Flags Darien Lakehotel and campgrounds. Substantially all of the hotel andcamping visitors visit the theme park.
Six Flags Darien Lake’s principal competitor is Para-mount Canada’s Wonderland Park located in Toronto,Canada, approximately 125 miles from Six Flags DarienLake. In addition, Six Flags Darien Lake competes to alesser degree with three smaller amusement parks locatedwithin 50 miles of the park. Six Flags Darien Lake issignificantly larger with a more diverse complement ofentertainment than any of these three smaller facilities.
Six Flags Elitch Gardens
Six Flags Elitch Gardens is a combination theme andwater park located on approximately 67 acres in the down-town area of Denver, Colorado, next to the Pepsi Center
11

Arena, and close to Invesco Field at Mile High Stadium andCoors Field. The park’s primary market includes thegreater Denver area, as well as most of central Colorado.This market provides the park with a permanent residentpopulation of approximately 2.9 million people within50 miles of the park and approximately 4.0 million peoplewithin 100 miles. The Denver area is the number 18 DMAin the United States. Six Flags Elitch Gardens has nosignificant direct competitors.
Enchanted Village and Wild Waves
Enchanted Village and Wild Waves is a water and ridespark located near Seattle, Washington. The facility islocated on approximately 66 acres. The Seattle-Tacomamarket provides the park with a permanent resident pop-ulation of approximately 3.6 million people within 50 milesand approximately 4.7 million people within 100 miles. TheSeattle-Tacoma market is the number 13 DMA in theUnited States. The park does not have any significantdirect competitors.
Frontier City
Frontier City is a western theme park located alongInterstate 35 in northeast Oklahoma City, Oklahoma,approximately 100 miles from Tulsa. The park’s marketincludes nearly all of Oklahoma and certain parts of Texasand Kansas, with its primary market in Oklahoma City andTulsa. This market provides the park with a permanentresident population of approximately 1.3 million peoplewithin 50 miles of the park and 2.6 million people within100 miles. The Oklahoma City and Tulsa markets are thenumber 45 and number 61 DMAs in the United States,respectively.
We own a site of approximately 113 acres, with approx-imately 40 acres currently used for park operations. Fron-tier City’s primary competitor is Six Flags Over Texas,located in Arlington, Texas, approximately 225 miles fromFrontier City.
Splashtown
Splashtown is a water park located in Houston, Texas.The Houston, Texas market provides the park with a per-manent resident population of 5.2 million people within50 miles and 6.4 million people within 100 miles. TheHouston market is the number 10 DMA in the UnitedStates. We own approximately 56 acres for Splashtown.The park’s main competitor is a water park located inGalveston, Texas.
Waterworld USA/Concord
Waterworld USA/Concord is located in Concord, Cali-fornia, in the East Bay area of San Francisco. The park’sprimary market includes nearly all of the San FranciscoBay area. This market provides the park with a permanent
resident population of approximately 7.6 million peoplewithin 50 miles of the park and 11.3 million people within100 miles. The San Francisco Bay market is the number 6DMA in the United States. The Concord park is leasedunder a ground lease expiring in 2025, with five five-yearrenewal options. The Concord site includes approximately22 acres. Concord’s only significant direct competitor isRaging Waters located in San Jose, approximately50 miles from the Concord park.
White Water Bay
White Water Bay is a tropical themed water park situatedon approximately 22 acres located along Interstate 40 insouthwest Oklahoma City, Oklahoma. The park’s primarymarket includes the greater Oklahoma City metropolitanarea. Oklahoma City is the number 45 DMA in the UnitedStates. This market provides the park with a permanentresident population of approximately 1.3 million peoplewithin 50 miles of the park and 2.6 million people within100 miles.
Partnership Park Arrangements
In connection with our 1998 acquisition of the former SixFlags, we guaranteed certain obligations relating to SixFlags Over Georgia and Six Flags Over Texas (the “Part-nership Parks”). These obligations continue until 2027, inthe case of the Georgia park, and 2028, in the case of theTexas park. Among such obligations are (i) minimumannual distributions (including rent) of approximately$58.2 million in 2007 (subject to cost of living adjustmentsin subsequent years) to partners in these two PartnershipsParks (of which we will be entitled to receive in 2007approximately $18.8 million based on our present owner-ship of approximately 25% of the Georgia partnership andapproximately 38% of the Texas partnership at Decem-ber 31, 2006), (ii) minimum capital expenditures at eachpark during rolling five-year periods based generally on 6%of park revenues, and (iii) an annual offer to purchase amaximum number of 5% per year (accumulating to theextent not purchased in any given year) of limited partner-ship units at the Specified Prices described below.
After payment of the minimum distribution, we areentitled to a management fee equal to 3% of prior yeargross revenues and, thereafter, any additional cash will bedistributed 95% to us, in the case of the Georgia park, and92.5% to us, in the case of the Texas park.
The purchase price for the annual offer to purchaselimited partnership units in the Georgia and Texas parks isbased on the greater of (i) $250.0 million (in the case ofGeorgia) and $374.8 million (in the case of Texas) (the“Specified Prices”) or (ii) a value derived by multiplying theweighted-average four year EBITDA of the park by 8.0 (inthe case of the Georgia park) and 8.5 (in the case of theTexas park). In 2027 and 2028, we have the option topurchase all remaining units in the Georgia partnership
12

and the Texas partnership, respectively, at a price basedon the Specified Prices set forth above, increased by a costof living adjustment. Since only an immaterial number ofunits have been tendered in the annual offerings to pur-chase since 1998, the maximum number of units that wecould be required to purchase for both parks in 2007 wouldresult in an aggregate payment by us of approximately$276.8 million.
In connection with our acquisition of the former SixFlags, we entered into a Subordinated Indemnity Agree-ment (the “Subordinated Indemnity Agreement”) with cer-tain Six Flags entities, Time Warner Inc. (“Time Warner”)and an affiliate of Time Warner, pursuant to which, amongother things, we transferred to Time Warner (which hasguaranteed all of our obligations under the PartnershipPark arrangements) record title to the corporations whichown the entities that have purchased and will purchaselimited partnership units of the Partnership Parks, and wereceived an assignment from Time Warner of all cash flowreceived on such limited partnership units, and we other-wise control such entities. Pursuant to the SubordinatedIndemnity Agreement, we have deposited into escrow$11.1 million as a source of funds in the event Time WarnerInc. is required to honor its guarantee. In addition, weissued preferred stock of the managing partner of thepartnerships to Time Warner. In the event of a defaultby us of our obligations described in this paragraph, thesearrangements would permit Time Warner to take full con-trol of both the entities that own limited partnership unitsand the managing partner. After all such obligations havebeen satisfied, Time Warner is required to retransfer to usthe entire equity interests of these entities. See “Manage-ment’s Discussion and Analysis of Financial Condition andResults of Operations — Partnership Park Obligations”and Note 12 to Notes to Consolidated FinancialStatements.
Marketing and Promotion
We attract visitors through multi-media marketing andpromotional programs for each of our parks. The nationalprograms are designed to market and enhance the SixFlags brand name. In 2006, we emphasized the 45th anni-versary of Six Flags and in 2007, we plan to focus onexecuting an enhanced marketing plan, including bothincreased media and investments designed to drive sea-son pass, groups and continue the growth of online sales.Regional and local programs are tailored to address thedifferent characteristics of their respective markets and tomaximize the impact of specific park attractions and prod-uct introductions. All marketing and promotional programsare updated or completely changed each year to addressnew developments. Marketing programs are supervisedby our Executive Vice President, Entertainment and Mar-keting, with the assistance of our senior management andadvertising agencies.
We also develop alliance, sponsorship and co-market-ing relationships with well-known national, regional andlocal consumer goods companies and retailers to supple-ment our advertising efforts and to provide attendanceincentives in the form of discounts and/or premiums. Wealso arrange for popular local radio and television pro-grams to be filmed or broadcast live from our parks.
Group sales and pre-sold tickets (excluding seasonpasses) represented approximately 33.4% of aggregateattendance in the 2006 season at our parks. Each park hasa group sales and pre-sold ticket manager and a sales staffdedicated to selling multiple group sales and pre-soldticket programs through a variety of methods, includingdirect mail, telemarketing and personal sales calls.
Season pass sales establish an attendance base inadvance of the season, thus reducing exposure to inclem-ent weather. Additionally, season pass holders often bringpaying guests and generate “word-of-mouth” advertisingfor the parks. During the 2006 season, season pass atten-dance constituted approximately 26.5% of the total atten-dance at our parks.
A significant portion of our attendance has historicallybeen attributable to the sale of discount admission tickets.We offer discounts on season and multi-visit tickets, ticketsfor specific dates and tickets to affiliated groups such asbusinesses, schools and religious, fraternal and similarorganizations.
We also implement promotional programs as a means oftargeting specific market segments and geographic loca-tions not generally reached through group or retail salesefforts. The promotional programs utilize coupons, sweep-stakes, reward incentives and rebates to attract additionalvisitors. These programs are implemented through directmail, telemarketing, direct response media, sponsorshipmarketing and targeted multi-media programs. The spe-cial promotional offers are usually for a limited time andoffer a reduced admission price or provide some additionalincentive to purchase a ticket, such as combination ticketswith a complementary location.
Licenses
We have the exclusive right on a long-term basis totheme park usage of the Warner Bros. and DC Comicsanimated characters throughout the United States (exceptfor the Las Vegas metropolitan area), Canada, Mexico andother countries. In particular, our license agreements enti-tle us to use, subject to customary approval rights ofWarner Bros. and, in limited circumstances, approvalrights of certain third parties, all animated, cartoon andcomic book characters that Warner Bros. and DC Comicshave the right to license, including Batman, Superman,Bugs Bunny, Daffy Duck, Tweety Bird and Yosemite Sam,and include the right to sell merchandise using the char-acters. In addition, the Cartoon Network and Hanna-
13

Barbera characters including Yogi Bear, Scooby-Doo andThe Flintstones are available for our use at certain of ourtheme parks. In addition to basic license fees ($3.5 millionin 2006), we are required to pay a royalty fee on merchan-dise manufactured by or for us and sold that uses thelicensed characters. The royalty fee is generally equal to12% of the final landed cost to Six Flags of the merchan-dise. Warner Bros. has the right to terminate the licenseagreements under certain circumstances, including if anypersons involved in the movie or television industriesobtain control of us or upon a default under the Subordi-nated Indemnity Agreement.
Park Operations
We currently operate in geographically diverse marketsin North America. Each park is managed by a park pres-ident who reports to one of our four regional vice presi-dents. The park president is responsible for all operationsand management of the individual park. Local advertising,ticket sales, community relations and hiring and training ofpersonnel are the responsibility of individual park man-agement in coordination with corporate support teams.
Each park president also directs a full-time, on-sitemanagement team. Each management team includessenior personnel responsible for operations and mainte-nance, in-park food, beverage and merchandising, mar-keting and promotion, human resources and finance.Finance directors at our parks report to the Senior VicePresident, Finance and Chief Accounting Officer, and withtheir support staff provide financial services to theirrespective parks and park management teams. Park man-agement compensation structures are designed to providefinancial incentives for individual park managers to exe-cute our strategy and to maximize revenues and operatingcash flow.
Our parks are generally open daily from Memorial Daythrough Labor Day. In addition, most of our parks are openduring weekends prior to and following their daily seasons,often in conjunction with themed events (such asFrightFest· and Holiday in the Park·). Due to their location,certain parks have longer operating seasons. Typically, theparks charge a basic daily admission price, which allowsunlimited use of all rides and attractions, although in cer-tain cases special rides and attractions require the pay-ment of an additional fee.
See Note 13 to Notes to Consolidated Financial State-ments for information concerning revenues and long-livedassets by domestic and international categories.
Capital Improvements
We regularly make capital investments for new rides andattractions at our parks. We purchase both new and usedrides and attractions. In addition, we rotate rides amongparks to provide fresh attractions. We believe that the
selective introduction of new rides and attractions, includ-ing family entertainment attractions, is an important factorin promoting each of the parks in order to achieve marketpenetration and encourage longer visits, which lead toincreased attendance and in-park spending. For example,our new entertainment initiatives for 2007 include, amongothers, (i) building Thomas & FriendsTM-themed areas attwo parks, (ii) creating “Wiggles Worlds”-themed areas atthree parks including rides and attractions featuring thepopular children’s entertainers, The Wiggles, and(iii) expanding on our existing relationship with Tony Hawkby introducing Tony Hawk-themed family spinning coast-ers at two parks.
In addition, we generally make capital investments in thefood, retail, games and other in-park areas to increaseguest per capita spending. We also make annual enhance-ments in the theming and landscaping of our parks in orderto provide a more complete family oriented entertainmentexperience. In 2007, we are beginning a multi-year initia-tive to improve our information technology infrastructure.Capital expenditures are planned on a seasonal basis withmost expenditures made during the off-season. Expendi-tures for materials and services associated with maintain-ing assets, such as painting and inspecting rides, areexpensed as incurred and therefore are not included incapital expenditures.
Maintenance and Inspection
Our rides are inspected daily by maintenance personnelduring the operating season. These inspections includesafety checks, as well as regular maintenance and aremade through both visual inspection of the ride and testoperation. Our senior management and the individual parkpersonnel evaluate the risk aspects of each park’s oper-ation. Potential risks to employees and staff as well as tothe public are evaluated. Contingency plans for potentialemergency situations have been developed for each facil-ity. During the off-season, maintenance personnel exam-ine the rides and repair, refurbish and rebuild them wherenecessary. This process includes x-raying and magnaflux-ing (a further examination for minute cracks and defects)steel portions of certain rides at high-stress points. Wehave approximately 900 full-time employees who devotesubstantially all of their time to maintaining the parks andtheir rides and attractions.
In addition to our maintenance and inspection proce-dures, third party consultants are retained by us or ourinsurance carriers to perform an annual inspection of eachpark and all attractions and related maintenance proce-dures. The results of these inspections are reported inwritten evaluation and inspection reports, as well as writtensuggestions on various aspects of park operations. Incertain states, state inspectors also conduct annual rideinspections before the beginning of each season. Otherportions of each park are subject to inspections by local fire
14

marshals and health and building department officials.Furthermore, we use Ellis & Associates as water safetyconsultants at our parks in order to train life guards andaudit safety procedures.
Insurance
We maintain insurance of the type and in amounts thatwe believe are commercially reasonable and that areavailable to businesses in our industry. We maintainmulti-layered general liability policies that provide forexcess liability coverage of up to $100.0 million per occur-rence. For incidents arising after November 15, 2003 at ourU.S. parks, our self-insured retention is $2.5 million peroccurrence. For incidents at those parks during the twelvemonths prior to that date, the retention is $2.0 million peroccurrence. For incidents during the twelve months endedNovember 15, 2002, the retention is $1.0 million per occur-rence. Retention levels for our international parks arenominal. Our self-insured retention after November 15,2003 is $0.75 million for workers compensation claims($0.5 million for the two prior years). For most incidentsprior to November 15, 2001, our policies did not provide fora self-insured retention. We also maintain fire andextended coverage, workers’ compensation, businessinterruption, terrorism and other forms of insurance typicalto businesses in this industry. The fire and extended cov-erage policies insure our real and personal properties(other than land) against physical damage resulting froma variety of hazards.
Competition
Our parks compete directly with other theme parks,water and amusement parks and indirectly with all othertypes of recreational facilities and forms of entertainmentwithin their market areas, including movies, sports attrac-tions and vacation travel. Accordingly, our business is andwill continue to be subject to factors affecting the recre-ation and leisure time industries generally, such as generaleconomic conditions and changes in discretionary con-sumer spending habits. See “Risk Factors”. Within eachpark’s regional market area, the principal factors affectingcompetition include location, price, the uniqueness andperceived quality of the rides and attractions in a particularpark, the atmosphere and cleanliness of a park and thequality of its food and entertainment.
Seasonality
Our operations are highly seasonal, with approximately85% of park attendance and revenues occurring in thesecond and third calendar quarters of each year and themost active period falling between Memorial Day andLabor Day.
Environmental and Other Regulation
Our operations are subject to federal, state and localenvironmental laws and regulations including laws andregulations governing water and sewer discharges, airemissions, soil and groundwater contamination, the main-tenance of underground and above-ground storage tanksand the disposal of waste and hazardous materials. Inaddition, our operations are subject to other local, stateand federal governmental regulations including, withoutlimitation, labor, health, safety, zoning and land use andminimum wage regulations applicable to theme park oper-ations, and local and state regulations applicable to res-taurant operations at each park. Finally, certain of ourfacilities are subject to laws and regulations relating tothe care of animals. We believe that we are in substantialcompliance with applicable environmental and other lawsand regulations and, although no assurance can be given,we do not foresee the need for any significant expendituresin this area in the near future.
Portions of the undeveloped areas at certain of our parksare classified as wetlands. Accordingly, we may need toobtain governmental permits and other approvals prior toconducting development activities that affect these areas,and future development may be prohibited in some or all ofthese areas. Additionally, the presence of wetlands inportions of our undeveloped land could adversely affectour ability to dispose of such land and/or the price wereceive in any such disposition.
Employees
At March 1, 2007, we employed approximately 2,500 full-time employees, and we employed approximately33,000 seasonal employees during the 2006 operatingseason. In this regard, we compete with other localemployers for qualified students and other candidateson a season-by-season basis. As part of the seasonalemployment program, we employ a significant number ofteenagers, which subjects us to child labor laws.
Approximately 14.3% of our full-time and approximately8.5% of our seasonal employees are subject to laboragreements with local chapters of national unions. Theselabor agreements expire in December 2007 (Six FlagsOver Georgia), December 2008 (Six Flags Great Adven-ture and Six Flags Magic Mountain), January 2009 (SixFlags Over Texas and Six Flags St. Louis) and Decem-ber 31, 2006 (currently being re-negotiated) and Decem-ber 31, 2007 (La Ronde). Other than a strike at La Rondeinvolving five employees which was settled in January2004, and recognitional picketing at Six Flags NewEngland in February 2005 by 11 employees in anticipationof an election held in 2005 involving up to approximately45 employees, we have not experienced any strikes orwork stoppages by our employees. In that election, theemployees voted not to unionize. We consider ouremployee relations to be good.
15

Available Information
Copies of our annual reports on Form 10-K, quarterlyreports on Form 10-Q, current reports on Form 8-K, andamendments to those reports filed or furnished pursuant toSection 13(a) or 15(d) of the Securities Exchange Act of1934, as amended, are available free of charge throughour website at www.sixflags.com. These reports, and anyamendments to these reports, are made available on ourwebsite as soon as reasonably practicable after we elec-tronically file such reports with, or furnish them to, theSecurities and Exchange Commission. Copies are alsoavailable, without charge, by sending a written request toSix Flags, Inc., 1540 Broadway, New York, NY 10036, Attn:Secretary.
Our website, www.sixflags.com, also includes itemsrelated to corporate governance matters including thecharters of our Audit Committee, Nominating and Corpo-rate Governance Committee and Compensation Commit-tee, our Corporate Governance Principles our Code ofBusiness Conduct and our Code of Ethics for SeniorFinancial Management. Copies of these materials are alsoavailable, without charge, by sending a written request toSix Flags, Inc., 1540 Broadway, New York, NY 10036, Attn:Secretary.
On June 20, 2006, our President and Chief ExecutiveOfficer certified to the New York Stock Exchange that hewas not aware of any violation by us of the New York StockExchange’s corporate governance listing standards. Thecertifications of our Chief Executive Officer and ChiefFinancial Officer required by the Sarbanes-Oxley Act of2002 are filed as Exhibits 31.1, 31.2, 32.1 and 32.2 to thisAnnual Report on Form 10-K.
16
Executive Officers
NameAge as of
March 1, 2007 Position
Mark Shapiro. . . . . . . . . . . . . . . . . . . (37) President, Chief Executive Officer and a director sinceDecember 2005; from September 2002 through October2005, he served as the Executive Vice President,Programming and Production of ESPN, Inc. (‘‘ESPN”); heserved as Senior Vice President and General Manager,Programming at ESPN from July 2001 to September 2002;prior to July 2001, he was Vice President and GeneralManager of ESPN Classic and ESPN Original Entertainment.
Jeffrey R. Speed . . . . . . . . . . . . . . . . (44) Executive Vice President, Chief Financial Officer since April2006; prior to that, he served as Senior Vice President andChief Financial Officer of Euro Disney S.A.S. since 2003;from 1999 to 2003, he served as Vice President CorporateFinance and Assistant Treasurer for The Walt DisneyCompany.
Michael Antinoro . . . . . . . . . . . . . . . . (42) Executive Vice President, Entertainment and Marketing sinceDecember 2005; prior to that, he served as ExecutiveProducer of ESPN Original Entertainment from January 2003to November 2005; prior to that position he served as SeniorCoordinating Producer of ESPN Original Entertainment fromFebruary 2001 to December 2002; prior to that, he wasSenior Vice President of HoopsTV.com.
John E. Bement, Jr. . . . . . . . . . . . . . (54) Senior Vice President, In-Park Services since February 2006;Executive Vice President, Retail from April 1998 throughFebruary 2006; prior to that, he served as General Managerof Six Flags Over Georgia since from January 1993.
Kyle Bradshaw. . . . . . . . . . . . . . . . . . (43) Senior Vice President, Finance and Chief Accounting Officersince September 2006; prior to that, he had served as VicePresident and Chief Accounting Officer of Euro Disney S.A.S.since 2003; prior to that, he served as Vice PresidentCorporate Controllership for The Walt Disney Company since2000.
James M. Coughlin . . . . . . . . . . . . . . (55) General Counsel since May 1998; partner, Baer Marks &Upham LLP, from 1991 to 1998.
Randy Gerstenblatt . . . . . . . . . . . . . . (47) Senior Vice President, Corporate Alliances since January2006, prior to that he served as a Senior Vice President atESPN ABC Sports Customer Marketing and Sales sinceJanuary 2002; prior to that position, he served as a VicePresident of that entity since 1998.
Wendy Goldberg . . . . . . . . . . . . . . . . (43) Senior Vice President, Communications since January 2006;prior to that she served as an independent communicationsconsultant for four years; from 1997 to 2002, she served asVice President for Communications at AOL/Time Warner andAmerica Online, Inc.
Walter S. Hawrylak . . . . . . . . . . . . . . (59) Senior Vice President of Administration since June 2002;Secretary since June 2001; Vice President of Administrationsince June 2000; prior to that he served as our Director ofAdministration since September 1999; served as ExecutiveVice President and Chief Financial Officer of Entercitementfrom May 1997 to September 1999.
Michael Israel . . . . . . . . . . . . . . . . . . (40) Senior Vice President, Information Services since April 2006;prior to that he served as President of A&R ConsultingEnterprises from June 2004 to March 2006; prior to thatposition he served as Chief Operating Officer of AMCComputer Corp from 1997 to 2004. He served in variouscapacities at Word Pro’s Computers and Networks from 1988to 1996.
17

NameAge as of
March 1, 2007 Position
Louis Koskovolis . . . . . . . . . . . . . . . . (43) Executive Vice President, Corporate Alliances since January2006; prior to that he served as Executive Vice President atESPN ABC Sports Customer Marketing and Sales, Inc. fromJanuary 2005 to January 2006; prior to that position, heserved in various capacities at that entity since January 2001.
John Odum . . . . . . . . . . . . . . . . . . . . (49) Senior Vice President, Park Strategy and Management sinceFebruary 2006; Executive Vice President/Central Region fromNovember 2003 to February 2006; Vice President andGeneral Manager of Six Flags Over Georgia from October2000 to November 2003; General Manager of Six FlagsFiesta Texas from September 1998 to October 2000; GeneralManager at Six Flags St. Louis from May 1996 to September1998.
Mark Quenzel . . . . . . . . . . . . . . . . . . (50) Executive Vice President, Park Strategy and Managementsince December 2005; prior to that, he served as Senior VicePresident, Programming and Production at ESPN from 1999to 2005; prior to that he served in various capacities at ESPNsince 1991.
William Prip . . . . . . . . . . . . . . . . . . . . (39) Senior Vice President, Corporate Finance and Treasurersince April 2006; prior to that, he served as Vice Presidentand Treasurer of AT&T Corp. from July 2004 to March 2006;prior to that, he served in various finance positions withinAT&T’s Treasury and Mergers & Acquisitions organizationssince joining AT&T in 1998.
Andrew M. Schleimer . . . . . . . . . . . . (29) Executive Vice President, In-Park Services since January2006; prior to that, he served in various capacities at UBSSecurities LLC from June 2000 through January 2006, mostrecently as a Director in the mergers and acquisitions group.
Angelina M. Vieira . . . . . . . . . . . . . . . (37) Senior Vice President, Entertainment and Marketing sinceFebruary 2006; prior to that she was General Manager(North America) and then President of Bugaboo, a companythat markets Bugaboo Frog baby strollers, since 2004; priorto that time, she served in account service at Wieden andKennedy, an advertising agency for more than ten years.
Each of the above executive officers has been elected toserve in the position indicated until the next annual meet-ing of directors which will follow the annual meeting of ourstockholders to be held in May 2007.
We have entered into employment agreements withMr. Shapiro, each of our Executive Vice Presidents listedabove, Messrs. Bradshaw, Coughlin, Gerstenblatt andOdum.
18

RISK FACTORS
Set forth below are the principal risks that we believe arematerial to our security holders. We operate in a contin-ually changing business environment and, therefore, newrisks emerge from time to time. This section contains someforward-looking statements. For an explanation of thequalifications and limitations on forward-looking state-ments, see “Cautionary Note Regarding Forward-LookingStatements.”
Factors Impacting Attendance — Local conditions,events, natural disasters, disturbances and terror-ist activities — can adversely impact parkattendance.
Lower attendance at our parks may be caused by var-ious local conditions, events, weather or natural disasters.Furthermore, we believe that general economic conditionsmay also adversely impact attendance figures at ourparks, in that a challenging economic environment candisproportionately affect our target audience of low tomiddle income consumers who generally have relativelylimited amounts of discretionary income.
In addition, since some of our parks are near majorurban areas and appeal to teenagers and young adults,there may be disturbances at one or more parks whichnegatively affect our image. This may result in a decreasein attendance at the affected parks. We work with localpolice authorities on security-related precautions to pre-vent these types of occurrences. We can make no assur-ance, however, that these precautions will be able toprevent any disturbances. We believe that our ownershipof many parks in different geographic locations reducesthe effects of these types of occurrences on our consol-idated results.
Our business and financial results were adverselyimpacted by the terrorist activities occurring in the UnitedStates on September 11, 2001. In addition, terrorist alertsand threats of future terrorist activities may continue toadversely affect attendance at our parks. We cannot pre-dict what effect any further terrorist activities that mayoccur in the future may have on our business and resultsof operations.
We have a history of net losses and expect tocontinue to experience net losses. Consequently,we may not have the ability to implement ourstrategy for achieving growth and otherwisefinance future operations.
We have had a history of net losses and expect tocontinue to report net losses for the next several years.Our net losses are principally attributable to insufficientrevenue to cover our relatively high percentage of fixedcosts, the interest costs on our debt and our depreciationexpense. We expect that these expenses will remain
significant. We reported net losses of $105.7 million,$61.7 million, $464.8 million (which included a $287.9 mil-lion loss from discontinued operations), $110.9 million(which included a $2.1 million, loss from discontinuedoperations) and $305.6 million (which included a $97.6 mil-lion, loss from discontinued operations), for the yearsended December 31, 2002, 2003, 2004, 2005 and 2006.Continued losses could reduce our cash available fromoperations to service our indebtedness, as well as limit ourability to implement our operating strategy and otherwisefinance our operations in the future.
Implementation of a New Operational Plan — Achange in our strategy may adversely impact ouroperations.
Our new management team is implementing a newoperational plan. It may take management a significantamount of time to fully implement its new plan. If our newoperational plan is not successful or if we are unable toexecute it, there could be a material adverse effect on ourbusiness, financial condition and results of operations.Additionally, our operating results and financial conditionwere adversely affected in 2006 and may continue to beadversely affected as we incur additional expenses toimplement the plan, even if the plan is ultimately fullyimplemented and is successful.
New Executive Officers/Board of Directors — Ournew management does not have proven successwith Six Flags.
A substantial number of our senior management team,including our Chief Executive Officer, and all but one of ourdirectors have been in place only from and after December2005. They do not have previous experience with us or thetheme park industry, and we cannot assure you that theywill fully integrate themselves into our business or that theywill effectively manage our business affairs. Our failure toassimilate the new members of management or the direc-tors, the failure of the new members of management or thedirectors to perform effectively or the loss of any of the newmembers of management or directors could have a mate-rial adverse effect on our business, financial condition andresults of operations.
Risk of Accidents — There is a risk of accidentsoccurring at our parks or competing parks whichmay reduce attendance and negatively impact ouroperations.
Almost all of our parks feature “thrill rides.” While wecarefully maintain the safety of our rides, there are inherentrisks involved with these attractions. An accident or aninjury (including water-borne illnesses on water rides) atany of our parks or at parks operated by our competitorsmay reduce attendance at our parks, causing a decreasein revenues. For example, on May 2, 2004, a fatality
19

occurred on a roller coaster at Six Flags New England,which we believe contributed to a decline in attendanceand, as a result, adversely impacted performance at thatpark during the 2004 operating season.
We maintain insurance of the type and in amounts thatwe believe are commercially reasonable and that areavailable to businesses in our industry. We maintainmulti-layered general liability policies that provide forexcess liability coverage of up to $100.0 million per occur-rence. For incidents occurring at our domestic parks afterNovember 15, 2003, our self-insured retention is $2.5 mil-lion per occurrence. For incidents at those parks during thetwelve months prior to that date, the retention is $2.0 millionper occurrence. For incidents during the twelve monthsended November 15, 2002, the retention is $1.0 million peroccurrence. For most prior incidents, our policies did notprovide for a self-insured retention. The self-insured reten-tion relating to our international parks is nominal withrespect to all applicable periods. Our current insurancepolicies expire on December 31, 2007. We cannot predictthe level of the premiums that we may be required to payfor subsequent insurance coverage, the level of any self-insurance retention applicable thereto, the level of aggre-gate coverage available or the availability of coverage forspecific risks.
Adverse Weather Conditions — Bad weather canadversely impact attendance at our parks.
Because most of the attractions at our theme parks areoutdoors, attendance at our parks is adversely affected bybad weather and forecasts of bad weather. The effects ofbad weather on attendance can be more pronounced atour water parks. Bad weather and forecasts of bad ormixed weather conditions can reduce the number of peo-ple who come to our parks, which negatively affects ourrevenues. Although we believe that our ownership of manyparks in different geographic locations reduces the effectthat adverse weather can have on our consolidatedresults, we believe that our operating results in certainyears were adversely affected by abnormally hot, coldand/or wet weather in a number of our major U.S. markets.In addition, since a number of our parks are geographicallyconcentrated in the eastern portion of the United States, aweather pattern that effects that area could adverselyaffect a number of our parks. Also, bad weather andforecasts of bad weather on weekend days have greaternegative impact than on weekdays because weekend daysare typically peak days for attendance at our parks.
Seasonality — Our operations are seasonal.
Our operations are seasonal. Approximately 85% of ourannual park attendance and revenue occurs during thesecond and third calendar quarters of each year. As aresult, when conditions or events described in the aboverisk factors occur during the operating season, particularly
during the peak season of July and August, there is only alimited period of time during which the impact of thoseconditions or events can be offset. Accordingly, such con-ditions or events may have a disproportionately adverseeffect on our revenues and cash flow. In addition, most ofour expenses for maintenance and costs of adding newattractions are incurred when the parks are closed in themid to late autumn and winter months. For this reason, asequential quarter to quarter comparison is not a goodindication of our performance or of how we will perform inthe future.
Competition — The theme park industry competeswith numerous entertainment alternatives.
Our parks compete with other theme, water and amuse-ment parks and with other types of recreational facilitiesand forms of entertainment, including movies, sportsattractions and vacation travel. Our business is also sub-ject to factors that affect the recreation and leisure timeindustries generally, such as general economic conditions,including relative fuel prices, and changes in consumerspending habits. The principal competitive factors of a parkinclude location, price, the uniqueness and perceivedquality of the rides and attractions, the atmosphere andcleanliness of the park and the quality of its food andentertainment.
Customer Privacy — If we are unable to protectour customers’ credit card data, we could beexposed to data loss, litigation and liability, andour reputation could be significantly harmed.
In connection with credit card sales, we transmit confi-dential credit card information securely over public net-works and store it in our data warehouse. Third partiesmay have the technology or know-how to breach thesecurity of this customer information, and our securitymeasures may not effectively prohibit others from obtain-ing improper access to this information. If a person is ableto circumvent our security measures, he or she coulddestroy or steal valuable information or disrupt our oper-ations. Any security breach could expose us to risks ofdata loss, litigation and liability and could seriously disruptour operations and any resulting negative publicity couldsignificantly harm our reputation.
Anti-Takeover Provisions — Anti-takeoverprovisions limit the ability of stockholders toeffect a change in control of us.
Certain provisions in our Amended and Restated Cer-tificate of Incorporation and in our debt instruments andthose of our subsidiaries may have the effect of deterringtransactions involving a change in control of us, includingtransactions in which stockholders might receive a pre-mium for their shares.
20

Our Amended and Restated Certificate of Incorporationprovides for the issuance of up to 5,000,000 shares ofpreferred stock with such designations, rights and prefer-ences as may be determined from time to time by ourboard of directors. The authorization of preferred sharesempowers our board of directors, without further stock-holder approval, to issue preferred shares with dividend,liquidation, conversion, voting or other rights which couldadversely affect the voting power or other rights of theholders of our common stock. If issued, the preferred stockcould be used to discourage, delay or prevent a change ofcontrol of us. We have no current plans to issue anypreferred stock.
In addition, we have a rights plan which gives eachholder of our common stock the right to purchase juniorpreferred stock in certain events. The rights plan isdesigned to deter third parties from attempting to takecontrol of us on terms that do not benefit all stockholders orthat our board of directors determines not to be in the bestinterests of stockholders.
We are also subject to the anti-takeover provisions of theDelaware General Corporation Law, which could have theeffect of delaying or preventing a change of control of us.Furthermore, upon a change of control, the holders ofsubstantially all of our outstanding indebtedness are enti-tled at their option to be repaid in cash. These provisionsmay have the effect of delaying or preventing changes incontrol or management of us. All of these factors couldmaterially adversely affect the price of our common stock.
We have the exclusive right to use certain Warner Bros.and DC Comics characters in our theme parks in theUnited States (except in the Las Vegas metropolitan area),Canada, Mexico and other countries. Warner Bros. canterminate these licenses under certain circumstances,including the acquisition of us by persons engaged inthe movie or television industries. This could deter certainparties from seeking to acquire us.
Substantial Leverage — Our high level of indebt-edness and other monetary obligations requirethat a significant part of our cash flow be used topay interest and fund these other obligations.
We have a high level of debt. Our total indebtedness, asof December 31, 2006, was approximately $2,240.9 mil-lion, excluding our Preferred Income Redeemable Shares(“PIERS”). Based on interest rates at December 31, 2006for floating-rate debt, annual cash interest payments for2007 on non-revolving credit debt outstanding at Decem-ber 31, 2006 and anticipated levels of working capitalborrowing for the year will aggregate approximately$200 million. None of our public debt matures prior toFebruary 2010 and none of the facilities under our creditagreement matures before June 30, 2008. In addition, theannual dividend requirements on our outstanding PIERStotal approximately $20.8 million, which we can, at our
option, pay either in cash or shares of our common stock.We are required to redeem all of our outstanding PIERS onAugust 15, 2009 (to the extent not previously convertedinto shares of our common stock) for cash at 100% of theliquidation preference ($287.5 million), plus accrued andunpaid dividends. See “Management’s Discussion andAnalysis of Financial Condition and Results of Opera-tions — Liquidity, Capital Commitments and Resources.”
In January 2007, we agreed to sell the Sale Parks toPARC 7F-Operations Corporation for an aggregate pur-chase price of $312 million, consisting of $275 million incash, subject to adjustment, and a note receivable for$37 million. The sale is subject to satisfaction of customaryclosing conditions, including the receipt of required thirdparty consents. Pursuant to the sales agreement, weagreed to provide a limited guarantee to a creditor ofthe buyer related to the future results of operations ofthe seven parks of up to $10 million, decreasing by onemillion dollars annually. We intend to use all of the netproceeds from the sale to repay indebtedness.
At December 31, 2006, we had approximately $24.3 mil-lion of cash and cash equivalents. As of that date, we had$244.4 million available for borrowings under our creditagreement.
In addition to making interest payments on debt anddividend payments on our PIERS, we must satisfy thefollowing obligations with respect to Six Flags Over Geor-gia and Six Flags Over Texas, which we refer to as thePartnership Parks:
• We must make annual distributions to our partners inthe Partnership Parks, which will amount to approxi-mately $58.2 million in 2007 (of which we will receiveapproximately $18.8 million in 2007 as a result of ourownership interest in the parks) with similar amounts(adjusted for changes in cost of living) payable infuture years.
• We must spend a minimum of approximately 6% ofeach park’s annual revenues over specified periods forcapital expenditures.
• Each year we must offer to purchase a specifiedmaximum number of partnership units from our part-ners in the Partnership Parks, which number accumu-lates to the extent units are not tendered. Since onlyan immaterial number of units have been tendered inthe annual offerings to purchase, the maximum num-ber of units that we could be required to purchase in2007 would result in an aggregate payment by us ofapproximately $276.8 million. The annual incrementalunit purchase obligation (without taking into accountaccumulation from prior years) aggregates approxi-mately $31.1 million for both parks based on currentpurchase prices. As we purchase additional units, weare entitled to a proportionate increase in our share ofthe minimum annual distributions.
21

We expect to use cash flow from the operations at theseparks to satisfy our annual distribution and capital expen-diture obligations with respect to these parks before weuse any of our other funds. The two partnerships gener-ated approximately $15.9 million of aggregate net cashprovided by operating activities after capital expendituresduring 2006 (net of advances from the general partner).The obligations relating to Six Flags Over Georgia con-tinue until 2027 and those relating to Six Flags Over Texascontinue until 2028.
We have guaranteed the payment of a $32.2 millionconstruction term loan incurred by HWP Development LLC(a joint venture in which we own a 41% interest) for thepurpose of financing the construction and development ofa hotel and indoor water park project located adjacent toour Great Escape park near Lake George, New York,which opened in February 2006. As security for the guar-antee, we have provided an $8.0 million letter of credit. AtDecember 31, 2006, approximately $32.2 million was out-standing under the construction term loan. In the event weare required to fund amounts under the guarantee, ourjoint venture partners must reimburse us for their respec-tive pro rata share or have their joint venture ownershipdiluted or forfeited. We also guaranteed a $1.0 millionworking capital revolving facility. Our guarantee will bereleased upon full payment and discharge of the loans,which, in the case of the term loan, matures on Decem-ber 17, 2009.
Although we are contractually committed to makeapproximately CAD$20.0 million of capital and otherexpenditures at La Ronde no later than May 1, 2011,the vast majority of our capital expenditures in 2007 andbeyond will be made on a discretionary basis. We spent$122.6 million on capital expenditures for all of our con-tinuing operations in the 2006 calendar year and we planon spending approximately $100 million on capital expen-ditures in 2007.
Our high level of debt and other obligations could haveimportant negative consequences to us and investors inour securities. These include:
• We may not be able to satisfy all of our obligations,including, but not limited to, our obligations under theinstruments governing our outstanding debt.
• We could have difficulties obtaining necessary financ-ing in the future for working capital, capital expendi-tures, debt service requirements, Partnership Parkobligations, refinancings or other purposes.
• We will have to use a significant part of our cash flow tomake payments on our debt, to pay the dividends onpreferred stock (if we choose to pay them in cash), andto satisfy the other obligations set forth above, whichmay reduce the capital available for operations andexpansion.
• Adverse economic or industry conditions may havemore of a negative impact on us.
We cannot be sure that cash generated from our parkswill be as high as we expect or that our expenses will not behigher than we expect. Because a large portion of ourexpenses are fixed in any given year, our operating cashflow margins are highly dependent on revenues, which arelargely driven by attendance levels and in-park spending.
We expect to refinance all or some of our debt or securenew financing. We cannot be sure that we will be able toobtain the refinancing or new financing on reasonableterms or at all. We have agreed in our credit agreementand the indentures covering our outstanding notes to limitthe amount of additional debt we will incur.
Due to the seasonal nature of our business, we arelargely dependent upon the $300.0 million working capitalrevolving credit facility under our credit agreement to fundoff-season expenses. Our ability to borrow under theworking capital revolving credit facility is dependent uponcompliance with certain conditions, including financialratios and the absence of any material adverse change.Our compliance with the financial covenants at the end ofthe second quarter of 2006 was waived by our lenders andthe financial covenants have been relaxed through 2007.However, if we were to become unable to borrow under theworking capital revolving credit facility, we would likely beunable to pay in full our off-season obligations and may beunable to meet our repurchase obligations (if any) inrespect of repurchases of partnership units in the Partner-ship Parks. The working capital revolving credit facilityexpires in June 2008.
Restrictive Covenants — Our financial and operat-ing activities are limited by restrictions containedin the terms of our financings.
The terms of the instruments governing our indebted-ness impose significant operating and financial restrictionson us. These restrictions may significantly limit or prohibitus from engaging in certain types of transactions, includingthe following:
• incurring additional indebtedness;
• creating liens on our assets;
• paying dividends;
• selling assets;
• engaging in mergers or acquisitions; and
• making investments.
Further, under our credit agreement, our principal directwholly owned subsidiary, Six Flags Operations, and itssubsidiaries are required to comply with specified consol-idated financial ratios and tests, including:
• interest expense;
22

• fixed charges (commencing in January 2008);
• debt service; and
• total debt.
Although we are currently in compliance with all of thesefinancial covenants and restrictions, events beyond ourcontrol, such as weather and economic, financial andindustry conditions, may affect our ability to continue meet-ing these financial tests and ratios. The need to complywith these financial covenants and restrictions could limitour ability to expand our business or prevent us fromborrowing more money when necessary.
If we breach any of the covenants contained in our creditagreement or the indentures governing our senior notes,the principal of and accrued interest on the applicable debtcould become due and payable. In addition, that defaultcould constitute a cross-default under the instrumentsgoverning all of our other indebtedness. If a cross-defaultoccurs, the maturity of almost all of our indebtedness couldbe accelerated and become immediately due and payable.If that happens, we would not be able to satisfy our debtobligations, which would have a substantial materialadverse effect on our ability to continue as a going con-cern. We cannot assure you that we will be able to complywith these restrictions in the future or that our compliancewould not cause us to forego opportunities that mightotherwise be beneficial to us.
Labor Costs — Increased costs of labor, pension,post-retirement and medical and other employeehealth and welfare benefits may reduce ourresults of operations.
Labor is a primary component in the cost of operatingour business. We devote significant resources to recruitingand training our managers and employees. Increasedlabor costs, due to competition, increased minimum wageor employee benefit costs or otherwise, would adverselyimpact our operating expenses. In addition, our successdepends on our ability to attract, motivate and retain qual-ified employees to keep pace with our needs. If we areunable to do so, our results of operations may be adverselyaffected.
With more than 2,500 full-time employees, our results ofoperations are also substantially affected by costs of retire-ment and medical benefits. In recent years, we haveexperienced significant increases in these costs as a resultof macro-economic factors beyond our control, includingincreases in health care costs, declines in investmentreturns on plan assets and changes in discount rates usedto calculate pension and related liabilities. At least some ofthese macro-economic factors may continue to put upwardpressure on the cost of providing pension and medicalbenefits. Although we have actively sought to controlincreases in these costs (including our decision in Febru-ary 2006 to “freeze” our pension plan, effective March 31,
2006), there can be no assurance that we will succeed inlimiting cost increases, and continued upward pressurecould reduce the profitability of our businesses. In addition,our decision to freeze our pension plan could adverselyaffect our relationship with our employees and/or result inincreased attempts by unions to organize our employees.
Holding Company Structure — Access to cashflow of most of our subsidiaries is limited.
We are a holding company whose primary assets con-sist of shares of stock or other equity interests in oursubsidiaries, and we conduct substantially all of our cur-rent operations through our subsidiaries. Almost all of ourincome is derived from our subsidiaries. Accordingly, wewill be dependent on dividends and other distributions fromour subsidiaries to generate the funds necessary to meetour obligations, including the payment of principal andinterest on our indebtedness. We had $24.3 million ofcash and cash equivalents on a consolidated basis atDecember 31, 2006, of which $9.2 million was held atthe holding company level.
Other than our holdings in the Partnership Parks, all ofour current operations are conducted by subsidiaries of SixFlags Operations, our principal direct wholly-owned sub-sidiary. We may, in the future, transfer other assets to SixFlags Operations or other entities owned by us. Our creditagreement limits the ability of Six Flags Operations to paydividends or make other distributions to us. Six FlagsOperations may not make cash distributions to us unlessit is in compliance with the financial and other covenantsset forth in the credit agreement and it is not otherwise indefault thereunder. If it is in compliance, Six Flags Oper-ations is permitted to make dividends to us from cashgenerated by operations of up to $75.0 million (of which$8.9 million has been dividended as of December 31, 2006and $66.1 million remains available) in order to enable usto pay amounts in respect of any refinancing or repaymentof debt under the indentures governing our outstandingnotes. Similarly, if it is in compliance, Six Flags Operationsmay make additional cash distributions to us generallylimited to an amount equal to the sum of:
• cash interest payments on the public notes issued bySix Flags, Inc.;
• payments we are required to make under our agree-ments with our partners in the Partnership Parks; and
• cash dividends on our preferred stock.
Shares Eligible For Future Sale — The price of ourcommon stock may decline due to possible salesof shares
As of March 1, 2007, there were approximately94,684,728 million shares of our common stock outstand-ing, all of which are transferable without restriction orfurther registration under the Securities Act of 1933,
23
except for any shares held by our affiliates. At that date, wealso had outstanding options held by management anddirectors to purchase approximately 5.1 million shares andunder our current option plans we may issue options topurchase an additional 1.0 million shares.
In addition, our outstanding shares of preferred stockare convertible at the option of the holders into 13.8 millionshares of common stock, and our Convertible Notes areconvertible into 47.1 million shares, although we can electto deliver cash to satisfy note conversions. We may alsoissue additional shares of common stock to pay quarterlydividend payments on our outstanding preferred stock.The sale or expectation of sales of a large number ofshares of common stock or securities convertible intocommon stock in the public market might negatively affectthe market price of our common stock.
Ratings of Six Flags — Changes in our credit rat-ings may adversely affect the price of our securi-ties, including our common stock and seniornotes.
Credit rating agencies continually review their ratings forthe companies they follow, including us. During 2006,
Moody’s Investor Service (i) downgraded our corporatefamily rating to “B3” from “B2” and (ii) raised our creditagreement debt rating to “Ba3” from “B1.” Also, Standardand Poor’s Ratings Service placed our (i) corporate creditrating of “B�,” (ii) credit agreement debt rating of “B�” and(iii) senior unsecured debt rating of “CCC,” all onCreditWatch with negative implications. A further negativechange in our ratings or the perception that such a changecould occur may adversely affect the market price of oursecurities, including our common stock and public debt.
ITEM 1B. UNRESOLVED STAFF COMMENTS
We have received no written comments regarding ourperiodic or current reports from the staff of the Securitiesand Exchange Commission that were issued 180 days ormore preceding the end of our 2006 fiscal year and thatremain unresolved.
24
MARKET FOR THE COMPANY’S COMMON EQUITY, RELATED STOCKHOLDERMATTERS AND ISSUER PURCHASES OF EQUITY SECURITIES
Our common stock is listed on the New York Stock Exchange (the “NYSE”) under the symbol “SIX.” The following tableshows, for the periods indicated, the high and low sales prices for per share of common stock as reported by the NYSE.
High LowSales Price
2007
First Quarter (through March 1, 2007) . . . . . . . . . . . . . . . . . . $ 6.59 $5.27
2006
Fourth Quarter . . . . . . . . . . . . . . . . . . . . . . . . . . . . . . . . . . . . $ 6.52 $4.98
Third Quarter . . . . . . . . . . . . . . . . . . . . . . . . . . . . . . . . . . . . . $ 5.94 $4.53
Second Quarter . . . . . . . . . . . . . . . . . . . . . . . . . . . . . . . . . . . $10.38 $5.11
First Quarter . . . . . . . . . . . . . . . . . . . . . . . . . . . . . . . . . . . . . . $11.93 $7.70
2005
Fourth Quarter . . . . . . . . . . . . . . . . . . . . . . . . . . . . . . . . . . . . $ 7.80 $6.70
Third Quarter . . . . . . . . . . . . . . . . . . . . . . . . . . . . . . . . . . . . . $ 7.49 $4.48
Second Quarter . . . . . . . . . . . . . . . . . . . . . . . . . . . . . . . . . . . $ 4.74 $3.72
First Quarter . . . . . . . . . . . . . . . . . . . . . . . . . . . . . . . . . . . . . . $ 5.75 $3.96
As of March 1, 2007, there were 983 holders of record of our common stock, which does not reflect holders whobeneficially own common stock held in nominee or street name. We paid no cash dividends on our common stock duringthe three years ended December 31, 2006. We do not anticipate paying any cash dividends on our common stock duringthe foreseeable future. The indentures relating to our public debt limit the payment of cash dividends to commonstockholders. See Note 6 to Notes to Consolidated Financial Statements.
Securities Authorized for Issuance Under Equity Compensation Plans
Set forth below is information regarding our equity compensation plans at December 31, 2006:
Plan Category
Number of shares ofcommon stock to beissued upon exercise
of outstandingoptions, warrants
and rights
Weighted-average exercise
price ofoutstanding
options, warrantsand rights
Number of shares of common stockremaining available for future
issuance under equitycompensation plans (excluding
securities reflected in column (a))(1)
(a) (b) (c)
Equity compensation plansapproved by securityholders . . . . . . . . . . . . . . . 3,275,000 $9.81 3,130,000
Equity compensation plansnot approved by securityholders . . . . . . . . . . . . . . . — — —
Total . . . . . . . . . . . . . . . . . . 3,275,000 $9.81 3,130,000
See Note 1(o) to Notes to Consolidated Financial Statements.
(1) Plans permit, in addition to grant of stock options and stock appreciation rights, the issuance of shares of commonstock.
In January 2007, we granted options to purchase 1,780,000 shares of our common stock and 300,000 restrictedshares under various option plans to certain of our directors and officers.
25
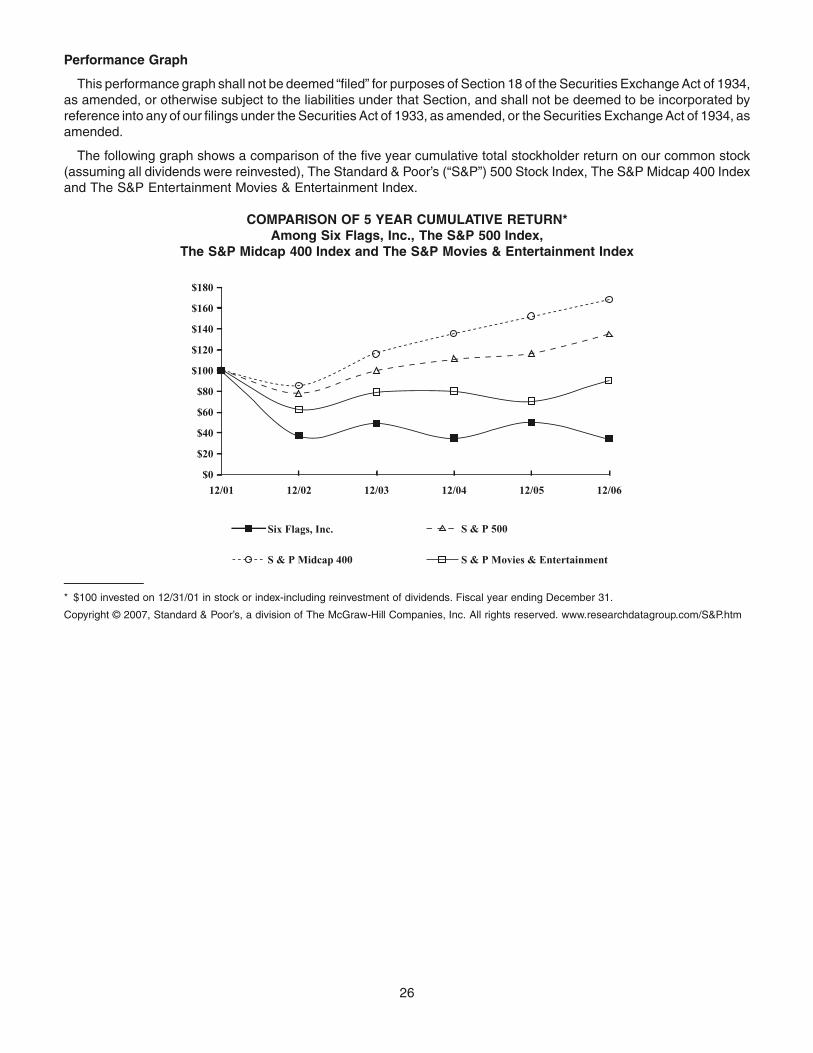
Performance Graph
This performance graph shall not be deemed “filed” for purposes of Section 18 of the Securities Exchange Act of 1934,as amended, or otherwise subject to the liabilities under that Section, and shall not be deemed to be incorporated byreference into any of our filings under the Securities Act of 1933, as amended, or the Securities Exchange Act of 1934, asamended.
The following graph shows a comparison of the five year cumulative total stockholder return on our common stock(assuming all dividends were reinvested), The Standard & Poor’s (“S&P”) 500 Stock Index, The S&P Midcap 400 Indexand The S&P Entertainment Movies & Entertainment Index.
COMPARISON OF 5 YEAR CUMULATIVE RETURN*Among Six Flags, Inc., The S&P 500 Index,
The S&P Midcap 400 Index and The S&P Movies & Entertainment Index
$180
$160
$140
$120
$100
$80
$60
$40
$20
$0
12/01 12/02 12/03 12/04 12/05 12/06
Six Flags, Inc.
S & P Midcap 400 S & P Movies & Entertainment
S & P 500
* $100 invested on 12/31/01 in stock or index-including reinvestment of dividends. Fiscal year ending December 31.
Copyright © 2007, Standard & Poor’s, a division of The McGraw-Hill Companies, Inc. All rights reserved. www.researchdatagroup.com/S&P.htm
26

SELECTED FINANCIAL DATA
The selected financial data below as of and for each of the years in the five-year period ended December 31, 2006 arederived from our audited financial statements. Our audited financial statements for the three-year period endedDecember 31, 2006 are included elsewhere in this report.
Our audited financial statements for the three-year period ended December 31, 2006 included herein and the followingselected historical financial data for the five-year period ended on that date reflect the effects of our reclassification of theresults of twelve parks, including the Sale Parks, as discontinued operations.
We adopted Financial Interpretation Number (“FIN”) 46 in the fourth quarter of 2003. Under FIN 46, the results of SixFlags Over Georgia, Six Flags White Water Atlanta, Six Flags Over Texas and Six Flags Discovery Kingdom (formerlySix Flags Marine World) were consolidated in our financial statements beginning with the year ended December 31,2003. In addition, our selected financial data for the year ended December 31, 2002, has been reclassified to reflect theadoption of FIN 46 in order to enable meaningful year-to-year comparisons. Historical results for the year endedDecember 31, 2002 include the operations of Jazzland (now Six Flags New Orleans) from the date of its acquisition onAugust 23, 2002.
2006 2005 2004 2003 2002Year Ended December 31,
(In thousands, except per share amounts)
Statement of Operations Data:Revenue:
Theme park admissions . . . . . . . . . . . . . . . . . . $ 508,492 $ 519,114 $ 473,379 $ 483,872 $ 488,073Theme park food, merchandise and other . . . . . 437,173 437,643 406,207 399,217 392,922
Total revenue . . . . . . . . . . . . . . . . . . . . . . . . . . . . 945,665 956,757 879,586 883,089 880,995
Operating costs and expenses:Operating expenses . . . . . . . . . . . . . . . . . . . . . 416,332 390,797 363,031 344,181 327,624Selling, general and administrative (including
stock-based compensation of $15,728,$2,794, $643, $101, and $9,256 in 2006,2005, 2004, 2003, and 2002, respectively) . . 239,927 192,838 177,800 178,700 173,170
Costs of products sold . . . . . . . . . . . . . . . . . . . 79,989 83,197 72,817 69,674 70,264Depreciation and amortization . . . . . . . . . . . . . 132,295 127,658 125,374 119,715 112,778Loss on fixed assets . . . . . . . . . . . . . . . . . . . . . 27,057 13,906 11,676 (301) 4,445
Total operating costs and expenses . . . . . . . . . . . 895,600 808,396 750,698 711,969 688,281
Income from operations . . . . . . . . . . . . . . . . . . . . 50,065 148,361 128,888 171,120 192,714
Other expense:Interest expense, net . . . . . . . . . . . . . . . . . . . . (199,991) (183,547) (191,563) (213,565) (228,100)Minority interest in earnings . . . . . . . . . . . . . . . (40,223) (39,794) (37,686) (35,997) (36,760)Equity in Operations of Affiliate . . . . . . . . . . . . . (948) — — — —Early repurchase of debt . . . . . . . . . . . . . . . . . — (19,303) (37,731) (27,592) (29,895)Other expense . . . . . . . . . . . . . . . . . . . . . . . . . (11,560) (10,877) (14,356) (626) (1,241)
Total other income (expense) . . . . . . . . . . . . . . . . (252,722) (253,521) (281,336) (277,780) (295,996)
Loss from continuing operations before incometaxes, discontinued operations, and cumulativeeffect of changes in accounting principles . . . . . (202,657) (105,160) (152,448) (106,660) (103,282)
Income tax (expense) benefit . . . . . . . . . . . . . . . . (4,318) (3,705) (24,442) 34,660 33,494
Loss from continuing operations beforediscontinued operations and cumulative effectof changes in accounting principle . . . . . . . . . . (206,975) (108,865) (176,890) (72,000) (69,788)
Discontinued operations, net of tax benefit of$49,845 in 2004, tax expense of $1,524 in2003, tax expense of $18,069 in 2002 . . . . . . . (97,605) (2,073) (287,919) 10,287 25,144
27

2006 2005 2004 2003 2002Year Ended December 31,
(In thousands, except per share amounts)
Income before cumulative effect of changes inaccounting principle . . . . . . . . . . . . . . . . . . . . . (304,580) (110,938) (464,809) (61,713) (44,644)
Cumulative effect of changes in accountingprinciple . . . . . . . . . . . . . . . . . . . . . . . . . . . . . . (1,038) — — — (61,054)
Net loss . . . . . . . . . . . . . . . . . . . . . . . . . . . . . . . . $(305,618) $(110,938) $(464,809) $ (61,713) $(105,698)
Net loss applicable to common stock . . . . . . . . . . $(327,588) $(132,908) $(486,777) $ (83,683) $(127,668)
Net loss per average common shareoutstanding — basic and diluted:
Loss from continuing operations. . . . . . . . . . . . . . $ (2.43) $ (1.41) $ (2.14) $ (1.01) $ (0.99)Discontinued operations . . . . . . . . . . . . . . . . . . . . (1.04) (0.02) (3.09) 0.11 0.27Cumulative effect of changes in accounting
principle . . . . . . . . . . . . . . . . . . . . . . . . . . . . . . (0.01) — — — (0.66)
Net loss . . . . . . . . . . . . . . . . . . . . . . . . . . . . . . . . $ (3.48) $ (1.43) $ (5.23) $ (0.90) $ (1.38)
Weighted average number of common sharesoutstanding — basic and diluted . . . . . . . . . . . . 94,242 93,110 93,036 92,617 92,511
2006 2005 2004 2003 2002As of December 31,
(In thousands)
Balance Sheet Data:Cash and cash equivalents(1). . . . . . . . . . . . $ 24,295 $ 80,510 $ 67,764 $ 96,879 $ 29,608Total assets . . . . . . . . . . . . . . . . . . . . . . . . . $3,187,616 $3,491,922 $3,641,031 $4,681,574 $4,370,096Total long-term debt (excluding current
maturities)(2) . . . . . . . . . . . . . . . . . . . . . . $2,126,888 $2,128,756 $2,125,121 $2,354,194 $2,305,221Total debt(2) . . . . . . . . . . . . . . . . . . . . . . . . . $2,240,947 $2,242,357 $2,149,515 $2,373,205 $2,339,716Mandatorily redeemable preferred stock
(represented by the PIERS) . . . . . . . . . . . $ 284,497 $ 283,371 $ 282,245 $ 281,119 $ 279,993Stockholders’ equity. . . . . . . . . . . . . . . . . . . $ 376,140 $ 694,208 $ 826,065 $1,362,050 $1,359,692
(1) Excludes restricted cash.
(2) Excludes $123.1 million at December 31, 2004 of indebtedness which had been called for prepayment. Assuming the refinancingof that indebtedness had been completed by such date, total long-term debt and total debt at such date would be $2,138.6 millionand $2,163.0 million, respectively. Also excludes $301.2 million at December 31, 2003 of indebtedness which had been called forprepayment.
28

MANAGEMENT’S DISCUSSION AND ANALYSIS OFFINANCIAL CONDITION AND RESULTS OF OPERATIONS
The following discussion and analysis presents informa-tion that we believe is relevant to an assessment andunderstanding of our consolidated financial position andresults of operations. This information should be read inconjunction with our consolidated financial statements andthe notes thereto included in Item 8. Our consolidatedfinancial statements and this discussion and analysisreflect the effects of our reclassification of the assets,liabilities and results of parks previously divested, includ-ing the Sale Parks and our Sacramento water park, asdiscontinued operations.
In January 2007, we agreed to sell to PARC 7F-Operations Corporation three of our water parks and fourof our theme parks for an aggregate purchase price of$312 million, consisting of $275 million in cash and a notereceivable for $37 million. The Sale Parks are Six FlagsDarien Lake near Buffalo, NY; Waterworld USA in Con-cord, CA; Six Flags Elitch Gardens in Denver, CO; Splash-town in Houston, TX; Frontier City and the White WaterBay water park in Oklahoma City, OK; and Wild Waves andEnchanted Village near Seattle, WA. The purchase pricewill be increased for (i) marketing expenses over $1 millionand capital expenditures over $650,000 spent or madebetween October 1, 2006 and the closing date on behalf ofthe parks being sold; (ii) the consolidated cash of the parksbeing sold as of the closing date of the transaction; and(iii) all prepaid expenses and deposits made on behalf ofthe parks being sold, and will be decreased by (i) therevenues received by the parks being sold from sales orrenewals of season passes, group bookings and promo-tions for the 2007 season; and (ii) cash received by or onbehalf of the parks being sold under sponsorship agree-ments for the 2007 season. Pursuant to the sales agree-ment, we agreed to provide a limited guarantee to acreditor of the buyer related to the future results of oper-ations of the seven parks of up to $10 million, decreasingby one million dollars annually.
We have recorded a non-cash impairment chargeagainst assets held for sale in connection with the saleof the Sale Parks in our consolidated financial statementsfor the year ended December 31, 2006 in the amount of$84.5 million. The net proceeds from the sale will be usedto repay indebtedness. The sale is subject to satisfaction ofcustomary closing conditions, including the receipt ofrequired third party consents.
During the first quarter of 2006, we exercised our right toterminate the ground lease at our Sacramento, Californiawater park following the 2006 season. In March 2007, wesold substantially all of the assets of the water park forapproximately $950,000. In November 2006, we com-pleted the sale of substantially all of the assets of ourwater park in Columbus, Ohio to our lessor, the ColumbusZoo for $2.0 million. The net proceeds from the sale of
each of the Sacramento and Columbus assets were, or willbe, used to repay indebtedness.
Our New Orleans park sustained extensive damage inHurricane Katrina in late August 2005, has not reopenedsince that time, and will not reopen for the 2007 season.We have determined that our carrying value of the assetsdestroyed is approximately $32.5 million. This amountdoes not include the property and equipment owned bythe lessor, which is also covered by our insurance policies.The park is covered by up to approximately $180 million inproperty insurance, subject to a deductible in the case ofnamed storms of approximately $5.5 million. The propertyinsurance covers the full replacement value of the assetsdestroyed and includes business interruption coverage.Although the flood insurance provisions of the policiescontain a $27.5 million sublimit, the separate “NamedStorm” provision, which explicitly covers flood damage,is not similarly limited. Based on advice from our insuranceadvisors, we do not believe the flood sublimit to be appli-cable. In December 2006, we commenced a declaratoryaction in Louisiana seeking judicial determination that theflood insurance sublimit is not applicable.
We have filed property insurance claims, including busi-ness interruption, with our insurers. Since, in any event, weexpect to recover therefrom an amount in excess of our netbook value of the impaired assets, we established aninsurance receivable in an amount equal to the carryingvalue of those assets, of $32.5 million plus $4.0 million inbusiness interruption coverage to compensate for costsincurred while the park has been closed. As of Decem-ber 31, 2006, we have received payments from our carriersin the amount of $25.0 million bringing the total insurancereceivable balance to $11.5 million at that date. We cannotestimate at this time when, or if, the park will be back inoperation. We are contractually committed to rebuildingthe park, but only to the extent of insurance proceedsreceived, including proceeds from the damage to thelessor’s assets. We cannot be certain that our currentestimates of the extent of the damage will be correct.
GENERAL
Our revenue is primarily derived from the sale of ticketsfor entrance to our parks (approximately 53.7% of reve-nues in 2006), the sale of food, merchandise, games andattractions inside our parks as well as sponsorship reve-nue. Per capita total revenue is defined as total revenuedivided by attendance. Per capita total revenue includesadmissions revenue per capita as well as food, merchan-dise and other revenue per capita.
Our principal costs of operations include salaries andwages, employee benefits, advertising, outside services,maintenance, utilities and insurance. A large portion of our
29

expenses is relatively fixed. Costs for full-time employees,maintenance, utilities, advertising and insurance do notvary significantly with attendance. However, we increasedoperating expenses in 2006 in order to provide enhancedguest service, and intend to do so again in 2007.
We believe that our operating results in 2006 wereadversely affected by (i) a 6.5% increase in operating
expenses designed to improve the guest experienceand, to a lesser extent, arising out of the managementchange and (ii) a 13.4% decrease in attendance due in partto delayed advertising expenses and difficult weather com-parisons, especially on weekend days at certain of our SixFlags branded parks. The attendance decline was offset inlarge part by a 14.2% increase in total revenue per capita.
Results of Operations
Summary data for the years ended December 31 were as follows (in thousands, except per capita revenue):
Summary of Operations 2006 2005 2004 2006 v. 2005 2005 v. 2004Percentage Changes
Total revenue . . . . . . . . . . . . . . . . . . . . . . . . . . . $ 945,665 $ 956,757 $ 879,586 (1.2)% 8.8%
Operating expenses . . . . . . . . . . . . . . . . . . . . . . 416,332 390,797 363,031 6.5 7.6Selling, general and administrative . . . . . . . . . . . 239,927 192,838 177,800 24.4 8.5Costs of products sold . . . . . . . . . . . . . . . . . . . . 79,989 83,197 72,817 (3.9) 14.3Depreciation and amortization. . . . . . . . . . . . . . . 132,295 127,658 125,374 3.6 1.8Loss on fixed assets . . . . . . . . . . . . . . . . . . . . . . 27,057 13,906 11,676 94.6 19.1
Income from operations . . . . . . . . . . . . . . . . . . . 50,065 148,361 128,888 (66.3) 15.1Interest expense, net . . . . . . . . . . . . . . . . . . . . . 199,991 183,547 191,563 9.0 (4.2)Minority interest in earnings . . . . . . . . . . . . . . . . 40,223 39,794 37,686 1.1 5.6Equity in operations of partnership . . . . . . . . . . . 948 — — N/A N/AEarly repurchase of debt . . . . . . . . . . . . . . . . . . . — 19,303 37,731 N/A (48.8)Other expense . . . . . . . . . . . . . . . . . . . . . . . . . . 11,560 10,877 14,356 6.3 (24.2)
Loss from continuing operations before incometaxes . . . . . . . . . . . . . . . . . . . . . . . . . . . . . . . . (202,657) (105,160) (152,448) 92.7 (31.0)
Income tax expense . . . . . . . . . . . . . . . . . . . . . . 4,318 3,705 24,442 16.5 (84.8)
Loss from continuing operations . . . . . . . . . . . . . $(206,975) $(108,865) $(176,890) 90.1 (38.5)
Other Data:Attendance . . . . . . . . . . . . . . . . . . . . . . . . . . . . . 24,840 28,688 27,526 (13.4)% 4.2%Per capita revenue . . . . . . . . . . . . . . . . . . . . . . . $ 38.07 $ 33.35 $ 31.95 14.2 4.4
Year ended December 31, 2006 vs. Year endedDecember 31, 2005
Revenue. Revenue in 2006 totaled $945.7 millioncompared to $956.8 million for 2005, representing a1.2% decrease. The decrease in 2006 results primarilyfrom a 13.4% reduction in attendance compared to theprior year. Per capita total revenue (representing totalrevenue divided by total attendance) increased by $4.72(14.2%) in 2006. The attendance decrease was causedlargely by reduced season pass (1.0 million) and groupand promotions (1.7 million) attendance, the closing of SixFlags New Orleans (0.5 million), delayed advertisingexpenses and difficult weather comparisons, especiallyon weekend days at certain of our Six Flags brandedparks. Admissions revenue per capita increased 13.1%in 2006 compared to 2005, and is driven primarily by priceand ticket mix (i.e. season tickets, main gate, group salesand other discounted tickets). Food and beverage,
merchandise and other revenue per capita increased15.4% in 2006 compared to 2005 driven by price, atten-dance mix and additional product and service offerings.
Operating Expenses. Operating expenses for 2006increased $25.5 million (6.5%) compared to expenses for2005. The increase primarily reflects anticipated increasesin salaries and wages and fringe benefit expense($13.3 million), repairs and maintenance ($4.0 million),outside services and contract shows ($2.7 million), utilities($2.2 million) and rent ($1.5 million).
Selling, general and administrative. Selling, gen-eral and administrative expenses in 2006 increased by$47.1 million (24.4%) compared to comparable expensesfor 2005. The increase reflects an increase in stock-basedcompensation expense ($12.9 million) primarily related tothe adoption of SFAS 123(R) as well as increased optionand restricted stock grants, increased media productionand promotional costs ($6.8 million), increased consulting
30

and legal costs ($6.5 million), increased insurance costs($5.6 million) and anticipated increases in salaries, wagesand benefits ($3.8 million) and other costs primarily due toadditional staffing and services.
Costs of products sold. Costs of products sold in2006 decreased $3.2 million (3.9%) compared to costs for2005, reflecting primarily the decrease in attendance in2006 and a reduced valuation allowance for slow movinginventory. As a percentage of theme park food, merchan-dise and other revenue, costs of products sold decreasedto 18.3% in 2006 compared to 19.0% in 2005.
Depreciation and amortization. Depreciation andamortization expense for 2006 increased $4.6 million(3.6%) compared to 2005. The increase was attributableto our on-going capital program.
Loss on fixed assets. Loss on fixed assets increased$13.2 million (94.6%) in 2006 compared to 2005 primarilyrelated to new management’s decision to write off anddispose of certain rides and attractions.
Interest expense, net. Interest expense, netincreased $16.4 million (9.0%) compared to 2005, reflect-ing higher net debt levels and higher interest rates in 2006.
Minority interest in earnings. Minority interest inearnings, which reflects the third party share of the oper-ations of the parks that are not wholly-owned by us, SixFlags Over Georgia (including White Water Atlanta), SixFlags Over Texas and Six Flags Discovery Kingdom,increased by $0.4 million (1.1%) in 2006 compared to2005. The increase reflects the annual increase in thedistributions to limited partners of Six Flags Over Georgiaand Six Flags Over Texas which is partially offset byreduced performance at Six Flags Discovery Kingdomcompared to the prior year. Cash distributions to minorityinterests were $46.5 million in 2006 and $44.4 million in2005.
Other expense. Other expense in 2006 increased$0.7 million (6.3%) to $11.6 million in 2006 primarilyrelated to the reimbursement of certain expenses incurredby Red Zone LLC in connection with its successful consentsolicitation, which reimbursement was approved by ourstockholders. Other expense in 2005 primarily related tothe Company’s proxy costs.
Income tax expense. Income tax expense was$4.3 million for 2006 compared to a $3.7 million expensefor 2005. The tax expense was affected by the valuationallowance applied to our U.S. net deferred tax assetsduring both years. The current period allowance was$459.3 million in 2006 and $367.6 million in 2005. See“Critical Accounting Issues” and Note 1(m) to Notes toConsolidated Financial Statements.
At December 31, 2006, we estimated that we hadapproximately $1,743.3 million of net operating loss(“NOLs”) carryforwards for Federal income tax purposes
and substantial state net operating loss carryforwards. TheNOLs are subject to review and potential disallowance bythe income tax regulators upon audit of our income taxreturns and those of our subsidiaries. During 2004, 2005and 2006, we determined that it was no longer likely that allof the NOLs will be utilized prior to their expiration. SeeNote 8 to Notes to Consolidated Financial Statements.
Year Ended December 31, 2005 vs. Year EndedDecember 31, 2004
Revenue. Revenue in 2005 totaled $956.8 millioncompared to $879.6 million for 2004, representing an8.8% increase. The increase in 2005 resulted from a4.2% increase in attendance and a 4.4% increase in percapita total revenue. The attendance increase was largelythe result of increased season pass (1.3 million). Admis-sions revenue per capita increased 5.2% in 2005, com-pared to the prior year, and was driven primarily by priceand ticket mix (i.e., season tickets, main gate, group salesand other discounted tickets). Food and beverage, mer-chandise and other revenue per capita increased 3.4% in2005 driven by price, and attendance mix.
Operating expenses. Operating expenses for 2005increased $27.8 million (7.6%) compared to expenses for2004. The increase primarily reflects anticipated increasesin salary and wage and fringe benefit expense (approxi-mately $15.3 million) and repair and maintenance expen-ditures (approximately $3.6 million) as well as an increasein utilities expense ($3.0 million).
Selling, general and administrative. Selling, gen-eral and administrative expenses for 2005 increased$15.0 million (8.5%) compared to comparable expensesfor 2004. The increase includes $9.0 million in severanceand other expenses associated with the December 2005management change and a $3.6 million write-off of costsincurred in projects that new management determined notto pursue. Excluding these items, selling, general andadministrative expenses would have increased by $2.4 mil-lion, which primarily relates to increases in salary andwage expense ($5.0 million) and stock-based compensa-tion expense ($2.2 million) partially offset by lower adver-tising expense ($5.2 million).
Costs of products sold. Costs of products sold in2005 increased $10.4 million (14.3%) compared to costsfor 2004, reflecting our increased costs for food, merchan-dise and games inventories, as well as higher freight costs.As a percentage of theme park food, merchandise andother revenue, costs of products sold increased to 19% in2005 compared to 18% in the prior year.
Depreciation and amortization. Depreciation andamortization expense for 2005 increased $2.3 million(1.8%) compared to 2004. The increase compared tothe 2004 level was attributable to our on-going capitalprogram.
31
Loss on fixed assets. Loss on fixed assets in 2005increased $2.2 million (19.1%) compared to costs for2004, primarily representing the removal of certain ridesin connection with our on-going capital program.
Interest expense, net; early repurchase of debt.Interest expense, net decreased $8.0 million (4.2%) com-pared to 2004, reflecting primarily lower debt levels and thebenefit of the lower interest rate convertible notes issued inNovember 2004 which we used the proceeds from torefinance other higher interest rate debt. The expense in2004 for early repurchase of debt reflects the redemptionin January 2004 of our 2007 Senior Notes from the pro-ceeds of our 2014 Notes, the repayment of a portion of ourterm loan, and the repayment of $248.6 million principalamount of debt from a portion of the proceeds of the sale inApril 2004 of our Cleveland, Ohio and European parks andthe repurchase of $147.0 million principal amount of the2009 Notes and 2010 Notes prior to year-end from aportion of the proceeds of our Convertible Note offering.The expense in 2005 for early repurchase of debt reflectsthe redemption in February 2005 of the balance of our2009 Senior Notes from the proceeds of our 2015 Con-vertible Notes. See Note 6 to Notes to Consolidated Finan-cial Statements.
Minority interest in earnings. Minority interest inearnings, which reflects the third party share of the oper-ations of the parks that are not wholly-owned by us, SixFlags Over Georgia (including White Water Atlanta), SixFlags Over Texas and Six Flags Discovery Kingdom,increased by $2.1 million compared to the prior year. Cashdistributions to minority interests were $44.4 million in2005 and $41.6 million in 2004.
Other expense. The decrease in other expense pri-marily reflects the costs incurred in 2005 in connection withthe consent solicitation ($9.4 million) more than offset bythe $15.0 million write-off in 2004 of the book value of ourinvestment in the owner of the Madrid park we managedprior to November 2004, and related intangible assets aswell as other associated costs (see Note 2 to Notes toConsolidated Financial Statements).
Income tax expense. Income tax expense was$3.7 million for 2005 compared to $24.4 million for 2004.Income tax expense in 2004 was adversely affected by thevaluation allowance applied to our U.S. net deferred taxassets during that period and income tax expense attrib-utable to our Canadian and Mexican operations. See“— Critical Accounting Issues” and Note 1(m) to Notesto Consolidated Financial Statements.
Results of Discontinued Operations
The consolidated balance sheets as of December 31, 2006 and December 31, 2005 and the consolidated statementsof operations for all periods presented reflect select assets of the parks being sold as assets held for sale, select liabilitiesas liabilities from discontinued operations and the operating results as results of discontinued operations.
In January 2007, we agreed to sell the Sale Parks to PARC 7F-Operations Corporation. We have recorded a non-cashimpairment charge against assets held for sale in connection with this transaction in our consolidated financialstatements for the year ended December 31, 2006 in the amount of $84.5 million. The net proceeds from the salewill be used to repay indebtedness. The sale is subject to satisfaction of customary closing conditions, including thereceipt of required third party consents.
During the first quarter of 2006, we exercised our right to terminate the ground lease at our Sacramento, Californiawater park following the 2006 season. In March 2007, we sold substantially all of the assets of the water park forapproximately $950,000. In November 2006, we completed the sale of substantially all of the assets of our water park inColumbus, Ohio to our lessor, the Columbus Zoo for $2.0 million. The net proceeds from the sale of each of theSacramento and Columbus assets were, or will be, used to repay indebtedness.
In October 2005, we permanently closed Six Flags AstroWorld in Houston, Texas and on June 1, 2006, sold the104 acre site on which the park was located for an aggregate purchase price of $77 million. The sale was approved by ourlenders under our credit agreement (see Note 6(a) to Notes to Consolidated Financial Statements) and the proceedsfrom the sale were used to repay indebtedness. We relocated select rides, attractions and other equipment from SixFlags AstroWorld to our remaining parks and have sold certain other equipment. The consolidated balance sheets andthe consolidated statements of operations for all periods presented reflect select net assets of Six Flags AstroWorld asassets held for sale and its results as discontinued operations. See Note 2 to Notes to Consolidated FinancialStatements.
On April 8, 2004, we sold substantially all of the assets used in the operation of Six Flags World of Adventure nearCleveland, Ohio (other than the marine and land animals located at that park and certain assets related thereto) for acash purchase price of $144.3 million. In a separate transaction on the same date, we sold all of the stock of Walibi S.A.,our wholly-owned subsidiary that indirectly owned the seven parks we owned in Europe. The purchase price wasapproximately $200.0 million, of which Euro 10.0 million ($12.1 million as of April 8, 2004) was received in the form of anine and one half year note from the buyer and $11.6 million represented the assumption of certain debt by the buyer,
32

with the balance paid in cash. During February 2006, the note was repurchased by the buyer for $12.0 million. Net cashproceeds from these transactions were used to pay down debt and to make investments in our remaining parks. SeeNote 2 to Notes to Consolidated Financial Statements included herein.
Pursuant to Statement of Financial Accounting Standards (“SFAS”) No. 144, “Accounting for the Impairment orDisposal of Long-Lived Assets,” our consolidated financial statements have been reclassified for all relevant periodspresented to reflect the operations, assets and liabilities of the parks sold in 2004 and 2006 as discontinued operationsand for all periods presented to reflect the operations of the Sale Parks as discontinued operations on the December 31,2006 and December 31, 2005 consolidated balance sheets as follows:
December 31,2006
December 31,2005
(In thousands)
Current assets . . . . . . . . . . . . . . . . . . . . . . . . . . . . . . . . . . . . . . . . . . . . . . . . . . . . . . . $ 6,718 $ 7,764Property, plant and equipment, net . . . . . . . . . . . . . . . . . . . . . . . . . . . . . . . . . . . . . . . . 205,836 274,002Intangible assets. . . . . . . . . . . . . . . . . . . . . . . . . . . . . . . . . . . . . . . . . . . . . . . . . . . . . . 67,157 177,687Other assets . . . . . . . . . . . . . . . . . . . . . . . . . . . . . . . . . . . . . . . . . . . . . . . . . . . . . . . . . 1,599 1,678
Total assets held for sale . . . . . . . . . . . . . . . . . . . . . . . . . . . . . . . . . . . . . . . . 281,310 461,131Current liabilities . . . . . . . . . . . . . . . . . . . . . . . . . . . . . . . . . . . . . . . . . . . . . . . . . . . . . . 1,970 2,132Other liabilities . . . . . . . . . . . . . . . . . . . . . . . . . . . . . . . . . . . . . . . . . . . . . . . . . . . . . . . 4,160 —
Total liabilities from discontinued operations . . . . . . . . . . . . . . . . . . . . . . . . . . $ 6,130 $ 2,132
The following are components of the net results of discontinued operations, including the Sale Parks, for the yearsended December 31, 2006, 2005 and 2004.
2006 2005 2004Years Ended December 31,
(In thousands)
Operating revenue . . . . . . . . . . . . . . . . . . . . . . . . . . . . . . . . . . . . . . . . . . . . . $ 122,840 $174,182 $ 161,393
Gain (loss) on sale of discontinued operations . . . . . . . . . . . . . . . . . . . . . . . . $ 968 $ — $(310,281)Income (loss) from discontinued operations before income taxes . . . . . . . . . . 13,809 18,350 (27,483)Impairment on assets held for sale . . . . . . . . . . . . . . . . . . . . . . . . . . . . . . . . . (112,382) (20,423) —Income tax benefit . . . . . . . . . . . . . . . . . . . . . . . . . . . . . . . . . . . . . . . . . . . . . — — 49,845
Net results of discontinued operations . . . . . . . . . . . . . . . . . . . . . . . . . . . . . . $ (97,605) $ (2,073) $(287,919)
Our long-term debt is at the consolidated level and is not reflected at each individual park. Thus, we have not allocateda portion of interest expense to the discontinued operations.
Liquidity, Capital Commitments and Resources
General
Our principal sources of liquidity are cash generatedfrom operations, funds from borrowings and existing cashon hand. Our principal uses of cash include the funding ofworking capital obligations, debt service, investments inparks (including capital projects), preferred stock divi-dends and payments to our partners in the PartnershipParks. We did not pay a dividend on our common stockduring 2006, nor do we expect to pay one in 2007. Webelieve that, based on historical and anticipated operatingresults, cash flows from operations, available cash andavailable amounts under our credit agreement will beadequate to meet our future liquidity needs, includinganticipated requirements for working capital, capitalexpenditures, scheduled debt and preferred stock require-ments and obligations under arrangements relating to the
Partnership Parks, for at least the next twelve months. Ourcurrent and future liquidity is, however, greatly dependentupon our operating results, which are driven largely byoverall economic conditions as well as the price and per-ceived quality of the entertainment experience at ourparks. Our liquidity could also be adversely affected byunfavorable weather, accidents or the occurrence of anevent or condition, including terrorist acts or threats, neg-ative publicity or significant local competitive events, thatsignificantly reduces paid attendance and, therefore, rev-enue at any of our theme parks. See “Risk Factors.” In thatcase, we might be unable to borrow under our creditagreement and/or need to seek additional financing. Inaddition, we expect to refinance all or a significant portionof our existing debt on or prior to maturity and potentiallyseek additional financing. The degree to which we areleveraged could adversely affect our ability to obtain any
33

new financing or to effect any such refinancing. See “Cau-tionary Note Regarding Forward-Looking Statements.”
Our total indebtedness, as of December 31, 2006, wasapproximately $2,240.9 million. Based on interest rates atDecember 31, 2006 for floating-rate debt, annual cashinterest payments for 2007 on non-revolving credit debtoutstanding at December 31, 2006 and anticipated levelsof working capital revolving borrowings for the year willaggregate approximately $200 million. None of our publicdebt matures prior to February 2010 and none of thefacilities under our credit agreement matures beforeJune 30, 2008. In addition, annual dividend paymentson our outstanding preferred stock total approximately$20.8 million, payable at our option in cash or shares ofour common stock. We are required to redeem all of ouroutstanding preferred stock on August 15, 2009 (to theextent not previously converted into shares of our commonstock) for cash at 100% of the liquidation preference($287.5 million), plus accrued and unpaid dividends. Weplan on spending approximately $100 million on capitalexpenditures for the 2007 calendar year. At December 31,2006, we had approximately $24.3 million of cash andcash equivalents and $244.4 million available under ourcredit agreement. While there is no assurance that the saleof the Sale Parks will be completed, we intend to use all ofthe net proceeds from the sale to repay indebtedness.
Due to the seasonal nature of our business, we arelargely dependent upon the $300.0 million working capitalrevolving credit portion of our credit agreement in order tofund off-season expenses. Our ability to borrow under theworking capital revolver is dependent upon compliancewith certain conditions, including financial ratios and theabsence of any material adverse change. Our compliancewith the financial covenants at the end of the secondquarter of 2006 was waived by our lenders and the finan-cial covenants have been relaxed through 2007. However,if we were to become unable to borrow under the workingcapital revolver, we would likely be unable to pay our off-season obligations. The working capital revolver expires inJune 2008. The terms and availability of our credit agree-ment and other indebtedness would not be affected by achange in the ratings issued by rating agencies in respectof our indebtedness except that the interest rate on bor-rowings under our credit agreement will be adjusted in theevent of certain rating changes.
During the year ended December 31, 2006, net cashprovided by operating activities was $9.8 million. Net cashused in investing activities in 2006 was $40.0 million,consisting primarily of capital expenditures ($122.6 million)partially offset by the proceeds from the sale of the104 acre site where Six Flags AstroWorld had beenlocated ($77 million) and insurance recovery proceedsrelated to Six Flags New Orleans. Since our business isboth seasonal and involves significant levels of cash trans-actions, factors impacting our net operating cash flows are
the same as those impacting our cash-based revenuesand expenses discussed above. Net cash used in financ-ing activities in 2006 was $25.9 million, representing pri-marily the payment of preferred stock dividends.
Since our business is both seasonal in nature andinvolves significant levels of cash transactions, our netoperating cash flows are largely driven by attendanceand per capita spending levels because our cash-basedexpenses are relatively fixed and do not vary significantlywith either attendance or levels of per capita spending.These cash-based operating expenses include salariesand wages, employee benefits, advertising, outside ser-vices, repairs and maintenance, utilities and insurance. Asof December 31, 2006, changes for the year in workingcapital, excluding the current portion of long-term debt,impacting operating cash flows had less than a $6.4 millionimpact.
Long-Term Debt and Preferred Stock
Our debt at December 31, 2006 included $1,489.8 mil-lion of fixed-rate senior notes, with staggered maturitiesranging from 2010 to 2015, $638.6 million under the termloan portion of our credit agreement and $112.5 million ofother indebtedness, including $105 million under the work-ing capital facility under our credit agreement and $6.3 mil-lion of indebtedness at Six Flags Over Texas and Six FlagsOver Georgia. Except in certain circumstances, the publicdebt instruments do not require principal payments prior tomaturity. Our credit agreement includes a $655.0 millionterm loan ($638.6 million of which was outstanding atDecember 31, 2006); an $82.5 million multicurrencyrevolving facility (none of which was outstanding atDecember 31, 2006 (excluding letters of credit in theamount of $33.1 million)); and a $300.0 million workingcapital revolver ($105.0 million of which was outstanding atDecember 31, 2006). The working capital revolver termi-nates on June 30, 2008. The multicurrency revolving facil-ity, which permits optional prepayments and reborrowingalso terminates on June 30, 2008. The term loan facilityrequires quarterly repayments of 0.25% of the outstandingamount thereof commencing on September 30, 2004 and24.0% commencing on September 30, 2008. The termloan matures on June 30, 2009. Under the credit agree-ment, the maturity of the term loan will be shortened toDecember 31, 2008 if prior to such date our outstandingpreferred stock is not redeemed or converted into commonstock. All of our outstanding preferred stock ($287.5 millionliquidation preference) must be redeemed on August 15,2009 (to the extent not previously converted into commonstock). See Notes 6 and 9 to our Notes to ConsolidatedFinancial Statements included herein for additional infor-mation regarding our indebtedness and preferred stock.
34

Partnership Park Obligations
As more fully described in “Business — PartnershipPark Arrangements” in connection with our 1998 acquisi-tion of the former Six Flags, we guaranteed certain obli-gations relating to Six Flags Over Georgia and Six FlagsOver Texas. These obligations continue until 2027, in thecase of the Georgia park, and 2028, in the case of theTexas park. Among such obligations are (i) minimumannual distributions (including rent) of approximately$58.2 million in 2007 (subject to cost of living adjustmentsin subsequent years) to partners in these two PartnershipsParks (of which we will be entitled to receive in 2007approximately $18.8 million based on our present owner-ship of approximately 25% of the Georgia partnership unitsand approximately 38% of the Texas partnership units),(ii) minimum capital expenditures at each park duringrolling five-year periods based generally on 6% of parkrevenues, and (iii) an annual offer to purchase a maximumnumber of 5% per year (accumulating to the extent notpurchased in any given year) of limited partnership units atspecified prices.
We intend to incur approximately $6.0 million of capitalexpenditures at these parks for the 2007 season, anamount in excess of the minimum required expenditure.We were not required to purchase any units in the 2005offer to purchase and we purchased approximately0.52 units in the 2006 offer. Since only an immaterialnumber of units have been tendered in the annual offerings
to purchase since 1998, the maximum number of units thatwe could be required to purchase for both parks in 2007would result in an aggregate payment by us of approxi-mately $276.8 million, representing approximately 50.0%of the outstanding units of the Georgia park and 40.9% ofthe outstanding units of the Texas park. The annual unitpurchase obligation (without taking into account accumu-lation from prior years) aggregates approximately$31.1 million for both parks based on current purchaseprices. As we purchase additional units, we are entitled to aproportionate increase in our share of the minimum annualdistributions. Under our agreement with Time Warner Inc.,which has also guaranteed certain obligations relating tothe Partnership Parks, we have deposited into escrow$11.1 million as a source of funds in the event Time WarnerInc. is required to honor its guarantee.
Cash flows from operations at the Partnership Parks willbe used to satisfy the annual distribution and capitalexpenditure requirements, before any funds are requiredfrom us. The two partnerships generated approximately$15.9 million of aggregate net cash provided by operatingactivities after capital expenditures during 2006 (net ofadvances from the general partner). At December 31,2006, we had total loans outstanding of $166.7 millionto the partnerships that own the Partnership Parks, pri-marily to fund the acquisition of Six Flags White WaterAtlanta and to make capital improvements.
Off-Balance Sheet Arrangements and Aggregate Contractual Obligations
In December 2004, we guaranteed the payment of a$32.2 million construction term loan incurred by HWPDevelopment LLC (a joint venture in which we own a41% interest) for the purpose of financing the constructionand development of a hotel and indoor water park projectlocated adjacent to our Great Escape park near LakeGeorge, New York, which opened in February 2006. Wealso guaranteed a $1.0 million working capital revolvingfacility. We have received $0.6 million in management feerevenues from the joint venture and we have advanced thejoint venture approximately $2.2 million at December 31,2006. We acquired our interest in the joint venture througha contribution of land and a restaurant, valued at$5.0 million.
The guarantee of the term loan will be released upon fullpayment and discharge of the loan, which matures onDecember 17, 2009. The ability of the joint venture torepay the loan will be dependent upon the joint venture’sability to generate sufficient cash flow, which cannot beassured. The revolving credit facility terminates in March2007. As security for the guarantee, we have provided an$8.0 million letter of credit. At December 31, 2006, approx-imately $32.2 million was outstanding under the construc-tion term loan. In the event we are required to fundamounts under the guarantee, our joint venture partnersmust reimburse us for their respective pro rata share orhave their joint venture ownership diluted or forfeited. As ofDecember 31, 2006, we were not involved in any other off-balance sheet arrangements.
35

Set forth below is certain information regarding our debt, preferred stock and lease obligations at December 31, 2006,which includes the Sale Parks (in thousands):
Contractual Obligations 2007 2008-2010 2011-20132014 andbeyond Total
Payment Due by Period
Long term debt(1) . . . . . . . . . . . . . . . . . . . . . . . $ 9,059 $ 936,000 $389,005 $ 801,882 $2,135,946PIERS(2) . . . . . . . . . . . . . . . . . . . . . . . . . . . . . . — 287,500 — — 287,500Interest / dividends on long term debt and
PIERS(3) . . . . . . . . . . . . . . . . . . . . . . . . . . . . 214,492 445,150 272,488 33,653 965,783Real estate and operating leases(4) . . . . . . . . . . 12,861 35,618 32,563 212,376 293,418Purchase Obligations(5) . . . . . . . . . . . . . . . . . . . 122,873 10,500 10,500 — 143,873
Total . . . . . . . . . . . . . . . . . . . . . . . . . . $359,285 $1,714,768 $704,556 $1,047,911 $3,826,520
(1) Includes capital lease obligations. Payments are shown at principal amount. Payments shown do not include interest payments orprincipal payments on our working capital revolver. Interest paid on the borrowings under the revolver for 2006 was $12.7 million.
(2) Amount shown excludes annual dividends of approximately $20.8 million, which we are permitted to pay in either cash or commonstock. The amount shown for the 2009 cash redemption obligations assumes no conversion of PIERS prior thereto.
(3) Assumes average outstanding balance for the revolving credit facility of $150 million until its maturity on June 30, 2008 at thecurrent interest rate as of December 31, 2006.
(4) Assumes for lease payments based on a percentage of revenues, future payments at 2006 revenue levels. Also does not giveeffect to cost of living adjustments. Obligations not denominated in U.S. Dollars have been converted based on the exchangerates existing on December 31, 2006.
(5) Represents obligations at December 31, 2006 with respect to insurance, inventory, media and advertising commitments,computer systems and hardware, estimated license fees to Warner Bros. (through 2013), a minimum number of whole pizzasfrom Papa John’s and new rides and attractions. Of the amount shown for 2007, approximately $58.2 million represents capitalitems. The amounts in respect of new rides and attractions were computed at December 31, 2006 and include estimates by us ofcosts needed to complete such improvements that, in certain cases, were not legally committed at that date. Amounts shown donot include obligations to employees that can not be quantified at December 31, 2006 which are discussed below. Amountsshown also do not include purchase obligations existing at the individual park-level for supplies and other miscellaneous itemssince such amount was not readily available. None of the park-level obligations is individually material.
Included under “purchase obligations” above are com-mitments for license fees to Warner Bros. and commit-ments relating to capital expenditures. License fees toWarner Bros. for our domestic parks are payable basedupon the number of domestic parks utilizing the licensedcharacters. The license fee for 2006 was $3.5 million. Inaddition to the licensee fee, we also pay a royalty fee onmerchandise sold using the licensed characters, generallyequal to 12% of the final landed cost of the merchandise.
Other Obligations
During the years ended December 31, 2006, 2005 and2004, we made contributions to our defined benefit pen-sion plan of $6.6 million, $9.4 million and $3.1 million,respectively. Our pension plan was “frozen” effectiveMarch 31, 2006, pursuant to which participants (excludingapproximately 200 union employees) no longer continue toearn future pension benefits. We expect to make contri-butions of approximately $8.9 million in 2007 to our pen-sion plan and $3.2 million in 2007 to our 401(k) plan. Ourestimated expense for employee health insurance for 2007is $13.6 million. See Note 10 to Notes to ConsolidatedFinancial Statements.
Although we are contractually committed to makeapproximately CAD$20.0 million of capital and otherexpenditures at La Ronde no later than May 1, 2011,the vast majority of our capital expenditures in 2007 andbeyond will be made on a discretionary basis. We plan onspending approximately $100 million on capital expendi-tures for all of our operations for the 2007 season.
During the three years ended December 31, 2003,insurance premiums and self-insurance retention levelsincreased substantially. However, as compared to thepolicies expiring in 2004, 2005 and 2006, our currentpolicies, which expire in December 2007, cover substan-tially the same risks (neither property insurance policycovered terrorist activities), do not require higher aggre-gate premiums and do not have substantially larger self-insurance retentions (liability insurance retentions are$2.5 million per occurrence and workers’ compensationretentions are $750,000 per occurrence). We cannot pre-dict the level of the premiums that we may be required topay for subsequent insurance coverage, the level of anyself-insurance retention applicable thereto, the level ofaggregate coverage available or the availability of cover-age for specific risks.
36

We are party to various legal actions arising in thenormal course of business. See Item 3 “Legal Proceed-ings” for information on certain significant litigation.
We may from time to time seek to retire our outstandingdebt through cash purchases and/or exchanges for equitysecurities, in open market purchases, privately negotiatedtransactions or otherwise. Such repurchases orexchanges, if any, will depend on the prevailing marketconditions, our liquidity requirements, contractual restric-tions and other factors. The amounts involved may bematerial.
Critical Accounting Policies
In the ordinary course of business, we make a number ofestimates and assumptions relating to the reporting ofresults of operations and financial condition in the prepa-ration of our consolidated financial statements in confor-mity with generally accepted accounting principles in theUnited States. Results could differ significantly from thoseestimates under different assumptions and conditions. Webelieve that the following discussion addresses our criticalaccounting policies, which are those that are most impor-tant to the portrayal of our consolidated financial conditionand results and require management’s most difficult, sub-jective and complex judgments, often as a result of theneed to make estimates about the effect of matters that areinherently uncertain.
Property and Equipment
Property and equipment is recorded at cost and isdepreciated on a straight-line basis over the estimateduseful lives of those assets. Changes in circumstancessuch as technological advances, changes to our businessmodel or changes in our capital strategy could result in theactual useful lives differing from our estimates. In thosecases in which we determine that the useful life of propertyand equipment should be shortened, we depreciate theremaining net book value in excess of the salvage valueover the revised remaining useful life, thereby increasingdepreciation expense evenly through the remainingexpected life.
Accounting for Income Taxes
As part of the process of preparing our consolidatedfinancial statements, we are required to estimate ourincome taxes in each of the jurisdictions in which weoperate. This process involves us estimating our actualcurrent tax exposure together with assessing temporarydifferences resulting from differing treatment of items,such as depreciation periods for our property and equip-ment and deferred revenue, for tax and financial account-ing purposes. These differences result in deferred tax
assets and liabilities, which are included within our con-solidated balance sheet. We must then assess the likeli-hood that our deferred tax assets (primarily net operatingand capital loss carryforwards) will be recovered fromfuture taxable income. To the extent we believe that recov-ery is not likely, we must establish a valuation allowance.To the extent we establish a valuation allowance orincrease this allowance in a period, we must reflect suchamount as income tax expense in the consolidated state-ments of operations.
Significant management judgment is required in deter-mining our provision or benefit for income taxes, ourdeferred tax assets and liabilities and any valuation allow-ance recorded against our net deferred tax assets. Wehave recorded a current period valuation allowance of$51.8 million for December 31, 2005 and $91.7 millionfor December 31, 2006, due to uncertainties related to ourability to utilize some of our deferred tax assets, primarilyconsisting of certain net operating and capital loss carry-forwards and tax credits, before they expire. The valuationallowance is based on our estimates of taxable income,primarily consisting of the reversal of deferred tax liabilitiesand to some extent tax planning strategies, by jurisdictionin which we operate and the period over which our deferredtax assets will be recoverable. In the event that actualresults differ from these estimates or we adjust theseestimates in future periods, we may need to increase ordecrease our valuation allowance which could materiallyimpact our consolidated financial position and results ofoperations.
Variables that will impact whether our deferred taxassets will be utilized prior to their expiration include,among other things, attendance, per capita spendingand other revenues, capital expenditures, interest rates,operating expenses, sales of assets, and changes in stateor federal tax laws. In determining the valuation allowancewe do not consider, and under generally acceptedaccounting principles cannot consider, the possiblechanges in state or federal tax laws until the laws change.We reduced our level of capital expenditures in 2006 andwe will further reduce our capital expenditures in 2007. Tothe extent we reduce capital expenditures, our futureaccelerated tax deductions for our rides and equipmentwill be reduced, and our interest expense deductionswould decrease as the debt balances are reduced by cashflow that previously would have been utilized for capitalexpenditures. Increases in capital expenditures withoutcorresponding increases in net revenues would reduceshort-term taxable income and increase the likelihood ofadditional valuation allowances being required as net oper-ating loss carryforwards expire prior to their utilization.Conversely, increases in revenues in excess of operatingexpenses would reduce the likelihood of additional valua-tion allowances being required as the short-term taxableincome would increase and we may be able to utilize net
37

operating loss carryforwards prior to their expiration. SeeNote 1(m) to Notes to Consolidated Financial Statements.
Valuation of Long-Lived and Intangible Assets andGoodwill
Long-lived assets were $2,712.1 million including good-will and other intangible assets of $1,050.5 million as ofDecember 31, 2006. Long-lived assets included propertyand equipment and intangible assets.
In 2002, Statement of Financial Accounting Standards(“SFAS”) No. 142, “Goodwill and Other Intangible Assets”became effective and as a result, as of January 1, 2002,we ceased amortizing approximately $1.2 billion of good-will. In lieu of amortization, we were required to perform aninitial impairment review of our goodwill in 2002 and arerequired to perform an annual impairment review thereaf-ter, which we do as of the end of each year and morefrequently upon the occurrence of certain events. TheCompany recognizes one reporting unit for all its parks.For years prior to 2006, we determined the fair value of ourassets by using the discounted cash flow method, that is,we estimated annual cash flows applicable to our opera-tions (after deducting estimated capital expenditures),applied an estimated valuation multiple to a terminal cashflow amount, and discounted the result by an amount equalto our cost of capital. In 2006, we compared the carryingamount of the reporting unit’s equity to both the fair value ofour stockholders’ equity based on the market price of ourstock, as well a multiple of our operating earnings exclud-ing depreciation, amortization and certain non-recurringitems, net of our debt and preferred stock. Based on theforegoing, no impairment was required for 2004, 2005 or2006. If revenues decrease without a correspondingdecrease in operating expenses and capital expenditures,this would increase the likelihood of goodwill impairment. Ifvaluations reflected in the public market or theme parkacquisitions decrease over time, this would also increasethe likelihood of goodwill impairment. If revenues increasefaster than operating expenses and capital expenditures,this would decrease the likelihood of goodwill impairment.Our unamortized goodwill is $1,038.9 million at Decem-ber 31, 2006. See Note 1(i) to Notes to ConsolidatedFinancial Statements.
We review long-lived assets for impairment wheneverevents or changes in circumstances indicate that the car-rying amount of an asset may not be recoverable. Recov-erability of assets to be held and used is measured by acomparison of the carrying amount of an asset or group ofassets to future net cash flows expected to be generatedby the asset or group of assets. If such assets are con-sidered to be impaired, the impairment to be recognized ismeasured by the amount by which the carrying amount ofthe assets exceeds the fair value of the assets. Assets to
be disposed of are reported at the lower of the carryingamount or fair value less costs to sell.
Market Risks and Sensitivity Analyses
Like other companies, we are exposed to market risksrelating to fluctuations in interest rates and currencyexchange rates. The objective of our financial risk man-agement is to minimize the negative impact of interest rateand foreign currency exchange rate fluctuations on ouroperations, cash flows and equity. We do not acquiremarket risk sensitive instruments for trading purposes.
We were party to three interest rate swap agreementsthat for the term of the applicable agreements (with matu-rities ranging from March 2005 to June 2005) effectivelyconverted $600.0 million of our $655.0 million term loaninto a fixed rate obligation ranging from 4.565% to 6.000%(averaging 5.51%). As of December 31, 2006, our currentterm loan borrowings bear interest at 3.250% above theLIBOR rate.
Interest Rate and Debt Sensitivity Analysis
The following analysis presents the sensitivity of themarket value, operations and cash flows of our market-risk financial instruments to hypothetical changes in inter-est rates as if these changes occurred at December 31,2006. The range of changes chosen for this analysisreflect our view of changes which are reasonably possibleover a one-year period. Market values are the presentvalues of projected future cash flows based on the interestrate assumptions. These forward looking disclosures areselective in nature and only address the potential impactsfrom financial instruments. They do not include otherpotential effects which could impact our business as aresult of these changes in interest and exchange rates.
At December 31, 2006, we had total debt of $2,240.9 mil-lion, of which $1,489.8 million represents fixed-rate debtand the balance represented floating-rate debt. Of thefloating-rate debt, none is subject to interest rate swapagreements. For fixed-rate debt, interest rate changesaffect the fair market value but do not impact book value,operations or cash flows. Conversely, for floating-rate debt,interest rate changes generally do not affect the fair marketvalue but do impact future operations and cash flows,assuming other factors remain constant.
Additionally, increases and decreases in interest ratesimpact the fair value of the interest rate swap agreements.A decrease in thirty and ninety-day LIBOR interest ratesincreases the fair value liability of the interest rate swapagreements. However, over the term of the interest rateswap agreements, the economic effect of changes in
38

interest rates is fixed as we will pay a fixed amount and arenot subject to changes in interest rates.
Assuming other variables remain constant (such asforeign exchange rates and debt levels), after giving effectto our interest rate swap agreements and assuming anaverage annual balance on our working capital revolver,the pre-tax operating and cash flow impact resulting from aone percentage point increase in interest rates would beapproximately $8.0 million.
Recently Issued Accounting Pronouncements
In December 2004, the FASB published SFAS 123(R),which requires that the compensation cost relating toshare-based payment transactions be recognized in finan-cial statements. That cost will be measured based on thefair value of the equity or liability instruments issued. Weadopted Statement 123(R) on January 1, 2006 under themodified prospective method of application. State-ment 123(R) covers a wide range of share-based com-pensation arrangements including share options,restricted share plans, performance-based awards, shareappreciation rights, and employee share purchase plans.See Note 1(o) to Notes to Consolidated Financial State-ments for additional information on the impact of adoptingSFAS 123(R).
In June 2006, the FASB issued Interpretation No. 48,“Accounting for Uncertainty in Income Taxes” (“FIN 48”).FIN 48 clarifies the accounting for uncertainty in incometaxes recognized in an enterprise’s financial statements inaccordance with SFAS No. 109, “Accounting for IncomeTaxes.” This interpretation prescribes a recognition thresh-old and measurement attribute for the financial statementrecognition and measurement of a tax position taken orexpected to be taken in a tax return. FIN 48 also providesguidance on derecognition, classification, interest andpenalties, accounting in interim periods, disclosure andtransition. FIN 48 will be effective beginning January 1,2007. The Company does not expect the adoption ofFIN 48 to have a material impact on its financial conditionor results of operations.
In September 2006, the SEC issued Staff AccountingBulletin No. 108 (“SAB 108”), “Considering the Effects ofPrior Year Misstatements in Current Year Financial State-ments.” SAB 108 expresses the SEC Staff’s views regard-ing the process of quantifying financial statementmisstatements. SAB 108 addresses the diversity in prac-tice in quantifying financial statement misstatements andthe potential under current practice for the build up ofimproper amounts on the balance sheet. SAB 108 iseffective for the year ending December 31, 2006. Thecumulative effect of the initial application of SAB 108 mustbe reported in the carrying amounts of assets and liabilitiesas of the beginning of the year, with the offsetting balance
to retained earnings. The Company adopted SAB No. 108and adjusted its opening retained earnings for the yearended December 31, 2006 by approximately $14.5 millionof which approximately $11.6 million reflects a change inits accounting for leases and approximately $2.9 millionreflects a change in its accounting for accrued vacation.Prior to 2006, the Company did not record the effects ofscheduled rent increases on a straight-line rent basis forcertain real estate leases that were established between1997 and 2004 at several of our properties. Prior to 1998,the Company awarded vacation in the current year to all ofits employees. In 1998, the policy was changed to awardvacation one year after the date of hire and therefore avacation accrual should have been established for allemployees hired after 1998. The Company reviewed theannual amount of additional expense incurred in priorperiods for both of these adjustments and consideredthe effects to be immaterial to prior periods. See Note 1(t)to Notes to Consolidated Financial Statements for addi-tional information on the impact of adopting SAB 108.
In September 2006, the FASB issued SFAS No. 158(“SFAS 158”), “Employer’s Accounting for Defined BenefitPension and Other Postretirement Plans — an amend-ment of FASB Statements No. 87, 88, 106 and 132(R).”SFAS 158 requires recognition of the overfunded or under-funded status of defined benefit postretirement plans as anasset or liability in the balance sheet and recognition ofchanges in that funded status in comprehensive income inthe year in which the changes occur. SFAS 158 alsorequires measurement of the funded status of a plan asof the date of the balance sheet. SFAS 158 is effective forrecognition of the funded status of the benefit plans for thefourth quarter of 2006, and will be effective for the mea-surement date provisions for the fourth quarter of 2008.The adoption of SFAS 158 resulted in a $4.0 million reduc-tion to other comprehensive income (loss). See Note 10 toNotes to Consolidated Financial Statements for additionalinformation on the impact of adopting SFAS 158.
In September 2006, the FASB issued Statement ofFinancial Accounting Standards No. 157 (“SFAS 157”),“Fair Value Measurement”. Statement No. 157 provides acommon definition of fair value, establishes a frameworkfor measuring fair value and expands disclosures aboutfair value measurements. However, this Statement doesnot require any new fair value measurements. StatementNo. 157 is effective for fiscal years beginning after Novem-ber 15, 2007. We do not expect the adoption of StatementNo. 157 to have a material impact on the financialstatements.
In February 2007, the FASB issued Statement of Finan-cial Accounting Standards No. 159 (“SFAS 159”), “The FairValue Option for Financial Assets and Financial Liabili-ties — Including an Amendment of FASB StatementNo. 115”. Statement No. 159 permits entities to choose
39

to measure certain financial instruments and other items atfair value. The objective is to improve financial reporting byproviding entities with the opportunity to mitigate volatilityin reported earnings caused by measuring related assetsand liabilities differently without having to apply complexhedge accounting provisions. Unrealized gains and losseson any item for which we elect the fair value measurement
option would be reported in earnings. Statement No. 159 iseffective for fiscal years beginning after November 15,2007, provided we also elect to apply the provisions ofSFAS 157 at the same time. We are currently assessingthe effect, if any, the adoption of SFAS 159 will have on ourfinancial statements and related disclosures.
40

MANAGEMENT’S REPORT ON INTERNAL CONTROLOVER FINANCIAL REPORTING
Our management is responsible for establishing and maintaining adequate internal control over financial reporting, assuch term is defined in Exchange Act Rule 13a-15(f). Under the supervision and with the participation of our man-agement, including our Chief Executive Officer and Chief Financial Officer, we conducted an evaluation of theeffectiveness of our internal control over financial reporting based on the framework in Internal Control — IntegratedFramework issued by the Committee of Sponsoring Organizations of the Treadway Commission. Based on ourevaluation under the framework in Internal Control — Integrated Framework, our management concluded that ourinternal control over financial reporting was effective as of December 31, 2006.
Our management’s assessment of the effectiveness of our internal control over financial reporting as of December 31,2006 has been audited by KPMG LLP, the independent registered public accounting firm that audited our financialstatements included herein, as stated in their report which is included herein.
/s/ Mark Shapiro
Mark ShapiroChief Executive Officerof the Company
/s/ Jeffrey R. Speed
Jeffrey R. SpeedChief Financial Officerof the Company
March 15, 2007
41
REPORT OF INDEPENDENT REGISTERED PUBLIC ACCOUNTING FIRM
The Board of Directors and StockholdersSix Flags, Inc.:
We have audited management’s assessment, included in the accompanying Management’s Report on Internal ControlOver Financial Reporting that Six Flags, Inc. and subsidiaries (the Company) maintained effective internal control overfinancial reporting as of December 31, 2006, based on criteria established in Internal Control — Integrated Frameworkissued by the Committee of Sponsoring Organizations of the Treadway Commission (COSO). The Company’s man-agement is responsible for maintaining effective internal control over financial reporting and for its assessment of theeffectiveness of internal control over financial reporting. Our responsibility is to express an opinion on management’sassessment and an opinion on the effectiveness of the Company’s internal control over financial reporting based on ouraudit.
We conducted our audit in accordance with the standards of the Public Company Accounting Oversight Board (UnitedStates). Those standards require that we plan and perform the audit to obtain reasonable assurance about whethereffective internal control over financial reporting was maintained in all material respects. Our audit included obtaining anunderstanding of internal control over financial reporting, evaluating management’s assessment, testing and evaluatingthe design and operating effectiveness of internal control, and performing such other procedures as we considerednecessary in the circumstances. We believe that our audit provides a reasonable basis for our opinion.
A company’s internal control over financial reporting is a process designed to provide reasonable assurance regardingthe reliability of financial reporting and the preparation of financial statements for external purposes in accordance withgenerally accepted accounting principles. A company’s internal control over financial reporting includes those policiesand procedures that (1) pertain to the maintenance of records that, in reasonable detail, accurately and fairly reflect thetransactions and dispositions of the assets of the company; (2) provide reasonable assurance that transactions arerecorded as necessary to permit preparation of financial statements in accordance with generally accepted accountingprinciples, and that receipts and expenditures of the company are being made only in accordance with authorizations ofmanagement and directors of the company; and (3) provide reasonable assurance regarding prevention or timelydetection of unauthorized acquisition, use, or disposition of the company’s assets that could have a material effect on thefinancial statements.
Because of its inherent limitations, internal control over financial reporting may not prevent or detect misstatements.Also, projections of any evaluation of effectiveness to future periods are subject to the risk that controls may becomeinadequate because of changes in conditions, or that the degree of compliance with the policies or procedures maydeteriorate.
In our opinion, management’s assessment that Six Flags, Inc. and subsidiaries maintained effective internal control overfinancial reporting as of December 31, 2006, is fairly stated, in all material respects, based on criteria established inInternal Control — Integrated Framework issued by the Committee of Sponsoring Organizations of the TreadwayCommission (COSO). Also, in our opinion, Six Flags, Inc. and subsidiaries maintained, in all material respects, effectiveinternal control over financial reporting as of December 31, 2006, based on criteria established in Internal Control —Integrated Framework issued by the Committee of Sponsoring Organizations of the Treadway Commission (COSO).
We also have audited, in accordance with the standards of the Public Company Accounting Oversight Board (UnitedStates), the consolidated balance sheets of Six Flags, Inc. and subsidiaries as of December 31, 2006 and 2005, and therelated consolidated statements of operations, stockholders’ equity and other comprehensive income (loss) and cashflows for each of the years in the three-year period ended December 31, 2006, and our report dated March 15, 2007expressed an unqualified opinion on those consolidated financial statements.
KPMG LLP
Dallas, TexasMarch 15, 2007
42
REPORT OF INDEPENDENT REGISTERED PUBLIC ACCOUNTING FIRM
The Board of Directors and StockholdersSix Flags, Inc.:
We have audited the accompanying consolidated balance sheets of Six Flags, Inc. and subsidiaries (the Company) as ofDecember 31, 2006 and 2005, and the related consolidated statements of operations, stockholders’ equity andcomprehensive income (loss), and cash flows for each of the years in the three-year period ended December 31,2006. These consolidated financial statements are the responsibility of the Company’s management. Our responsibilityis to express an opinion on these consolidated financial statements based on our audits.
We conducted our audits in accordance with the standards of the Public Company Accounting Oversight Board (UnitedStates). Those standards require that we plan and perform the audit to obtain reasonable assurance about whether thefinancial statements are free of material misstatement. An audit includes examining, on a test basis, evidence supportingthe amounts and disclosures in the financial statements. An audit also includes assessing the accounting principles usedand significant estimates made by management, as well as evaluating the overall financial statement presentation. Webelieve that our audits provide a reasonable basis for our opinion.
In our opinion, the consolidated financial statements referred to above present fairly, in all material respects, the financialposition of Six Flags, Inc. and subsidiaries as of December 31, 2006 and 2005, and the results of their operations andtheir cash flows for each of the years in the three-year period ended December 31, 2006, in conformity with U.S. generallyaccepted accounting principles.
As described in Note 1 to the consolidated financial statements, as of January 1, 2006, the Company adopted Statementof Financial Accounting Standards No. 123(R), Share-Based Payment, as of December 31, 2006 the Company adoptedthe balance sheet recognition provisions of Statement of Financial Accounting Standards No. 158, Employers’Accounting for Defined Benefit Pension and Other Postretirement Plans — an amendment of FASB StatementsNo. 87, 88, 106, and 132(R), and Securities and Exchange Commission Staff Accounting Bulletin No. 108, Consideringthe Effects of Prior Year Misstatements when Quantifying Misstatements in the Current Year Financial Statements.
We also have audited, in accordance with the standards of the Public Company Accounting Oversight Board (UnitedStates), the effectiveness of Six Flags, Inc.’s internal control over financial reporting as of December 31, 2006, based oncriteria established in Internal Control — Integrated Framework issued by the Committee of Sponsoring Organizationsof the Treadway Commission (COSO), and our report dated March 15, 2007 expressed an unqualified opinion onmanagement’s assessment of, and the effective operation of, internal control over financial reporting.
KPMG LLP
Dallas, TexasMarch 15, 2007
43

SIX FLAGS, INC.
Consolidated Balance SheetsDecember 31, 2006 and 2005
2006 2005
AssetsCurrent assets:
Cash and cash equivalents . . . . . . . . . . . . . . . . . . . . . . . . . . . . . . . . . . . . . . . . . . . . . . . . . . . . $ 24,295,000 $ 80,510,000Accounts receivable . . . . . . . . . . . . . . . . . . . . . . . . . . . . . . . . . . . . . . . . . . . . . . . . . . . . . . . . . 40,843,000 50,841,000Inventories . . . . . . . . . . . . . . . . . . . . . . . . . . . . . . . . . . . . . . . . . . . . . . . . . . . . . . . . . . . . . . . 23,126,000 24,680,000Prepaid expenses and other current assets . . . . . . . . . . . . . . . . . . . . . . . . . . . . . . . . . . . . . . . . . . 37,893,000 38,199,000Assets held for sale . . . . . . . . . . . . . . . . . . . . . . . . . . . . . . . . . . . . . . . . . . . . . . . . . . . . . . . . . 6,718,000 7,764,000
Total current assets . . . . . . . . . . . . . . . . . . . . . . . . . . . . . . . . . . . . . . . . . . . . . . . . . . . . . 132,875,000 201,994,000Other assets:
Debt issuance costs . . . . . . . . . . . . . . . . . . . . . . . . . . . . . . . . . . . . . . . . . . . . . . . . . . . . . . . . . 37,308,000 43,897,000Restricted-use investment securities . . . . . . . . . . . . . . . . . . . . . . . . . . . . . . . . . . . . . . . . . . . . . . 11,091,000 —Deposits and other assets . . . . . . . . . . . . . . . . . . . . . . . . . . . . . . . . . . . . . . . . . . . . . . . . . . . . . 19,636,000 34,962,000
Total other assets . . . . . . . . . . . . . . . . . . . . . . . . . . . . . . . . . . . . . . . . . . . . . . . . . . . . . . 68,035,000 78,859,000Property and equipment, at cost. . . . . . . . . . . . . . . . . . . . . . . . . . . . . . . . . . . . . . . . . . . . . . . . . . . 2,564,109,000 2,504,277,000
Less accumulated depreciation . . . . . . . . . . . . . . . . . . . . . . . . . . . . . . . . . . . . . . . . . . . . . . . . . . 902,476,000 800,930,000
Total property and equipment . . . . . . . . . . . . . . . . . . . . . . . . . . . . . . . . . . . . . . . . . . . . . . 1,661,633,000 1,703,347,000Assets held for sale . . . . . . . . . . . . . . . . . . . . . . . . . . . . . . . . . . . . . . . . . . . . . . . . . . . . . . . . . . . 274,592,000 453,367,000Intangible assets, net of accumulated amortization . . . . . . . . . . . . . . . . . . . . . . . . . . . . . . . . . . . . . . 1,050,481,000 1,054,355,000
Total assets . . . . . . . . . . . . . . . . . . . . . . . . . . . . . . . . . . . . . . . . . . . . . . . . . . . . . . . . . . $ 3,187,616,000 $ 3,491,922,000
Liabilities and Stockholders’ EquityCurrent liabilities:
Accounts payable . . . . . . . . . . . . . . . . . . . . . . . . . . . . . . . . . . . . . . . . . . . . . . . . . . . . . . . . . . . $ 30,017,000 $ 29,947,000Accrued compensation, payroll taxes and benefits . . . . . . . . . . . . . . . . . . . . . . . . . . . . . . . . . . . . . 17,323,000 16,788,000Accrued insurance reserves . . . . . . . . . . . . . . . . . . . . . . . . . . . . . . . . . . . . . . . . . . . . . . . . . . . . 41,395,000 32,801,000Accrued interest payable . . . . . . . . . . . . . . . . . . . . . . . . . . . . . . . . . . . . . . . . . . . . . . . . . . . . . . 36,677,000 34,022,000Other accrued liabilities . . . . . . . . . . . . . . . . . . . . . . . . . . . . . . . . . . . . . . . . . . . . . . . . . . . . . . . 38,821,000 35,167,000Deferred income. . . . . . . . . . . . . . . . . . . . . . . . . . . . . . . . . . . . . . . . . . . . . . . . . . . . . . . . . . . . 11,159,000 6,915,000Liabilities from discontinued operations. . . . . . . . . . . . . . . . . . . . . . . . . . . . . . . . . . . . . . . . . . . . . 1,970,000 2,132,000Current portion of long-term debt . . . . . . . . . . . . . . . . . . . . . . . . . . . . . . . . . . . . . . . . . . . . . . . . 114,059,000 113,601,000
Total current liabilities . . . . . . . . . . . . . . . . . . . . . . . . . . . . . . . . . . . . . . . . . . . . . . . . . . . . 291,421,000 271,373,000Long-term debt . . . . . . . . . . . . . . . . . . . . . . . . . . . . . . . . . . . . . . . . . . . . . . . . . . . . . . . . . . . . . . 2,126,888,000 2,128,756,000Minority interest. . . . . . . . . . . . . . . . . . . . . . . . . . . . . . . . . . . . . . . . . . . . . . . . . . . . . . . . . . . . . . 49,995,000 56,277,000Liabilities from discontinued operations . . . . . . . . . . . . . . . . . . . . . . . . . . . . . . . . . . . . . . . . . . . . . . 4,160,000 —Other long-term liabilities . . . . . . . . . . . . . . . . . . . . . . . . . . . . . . . . . . . . . . . . . . . . . . . . . . . . . . . 40,731,000 43,592,000Deferred income taxes . . . . . . . . . . . . . . . . . . . . . . . . . . . . . . . . . . . . . . . . . . . . . . . . . . . . . . . . . 13,784,000 14,345,000Mandatorily redeemable preferred stock (redemption value of $287,500,000) . . . . . . . . . . . . . . . . . . . . . 284,497,000 283,371,000Stockholders’ equity:
Preferred stock of $1.00 par value . . . . . . . . . . . . . . . . . . . . . . . . . . . . . . . . . . . . . . . . . . . . . . . . — —Common stock, $.025 par value, 210,000,000 shares authorized and 94,384,728 and 93,201,528 shares
outstanding at December 31, 2006 and 2005, respectively . . . . . . . . . . . . . . . . . . . . . . . . . . . . . . 2,360,000 2,330,000Capital in excess of par value . . . . . . . . . . . . . . . . . . . . . . . . . . . . . . . . . . . . . . . . . . . . . . . . . . . 1,767,825,000 1,750,925,000Accumulated deficit . . . . . . . . . . . . . . . . . . . . . . . . . . . . . . . . . . . . . . . . . . . . . . . . . . . . . . . . . . (1,384,094,000) (1,042,042,000)Accumulated other comprehensive loss . . . . . . . . . . . . . . . . . . . . . . . . . . . . . . . . . . . . . . . . . . . . (9,951,000) (17,005,000)
Total stockholders’ equity . . . . . . . . . . . . . . . . . . . . . . . . . . . . . . . . . . . . . . . . . . . . . . . . . 376,140,000 694,208,000
Total liabilities and stockholders’ equity . . . . . . . . . . . . . . . . . . . . . . . . . . . . . . . . . . . . . . . . $ 3,187,616,000 $ 3,491,922,000
See accompanying notes to consolidated financial statements.
44
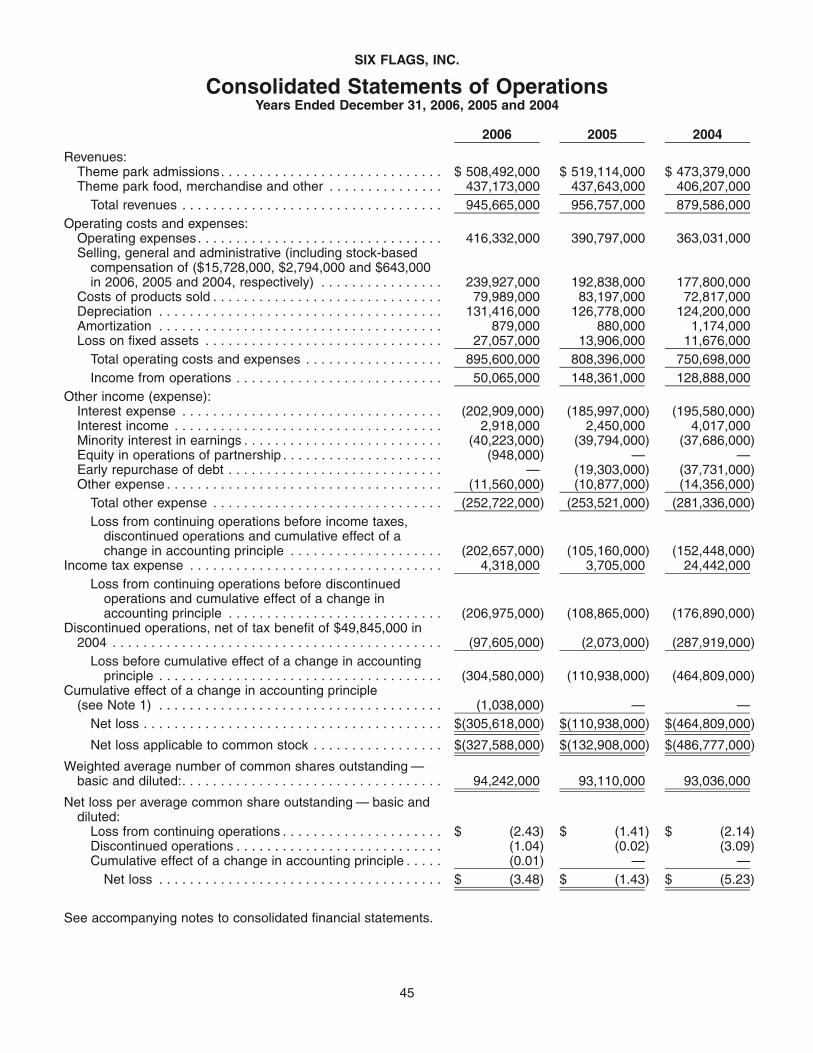
SIX FLAGS, INC.
Consolidated Statements of OperationsYears Ended December 31, 2006, 2005 and 2004
2006 2005 2004
Revenues:Theme park admissions. . . . . . . . . . . . . . . . . . . . . . . . . . . . . $ 508,492,000 $ 519,114,000 $ 473,379,000Theme park food, merchandise and other . . . . . . . . . . . . . . . 437,173,000 437,643,000 406,207,000
Total revenues . . . . . . . . . . . . . . . . . . . . . . . . . . . . . . . . . . 945,665,000 956,757,000 879,586,000Operating costs and expenses:
Operating expenses. . . . . . . . . . . . . . . . . . . . . . . . . . . . . . . . 416,332,000 390,797,000 363,031,000Selling, general and administrative (including stock-based
compensation of ($15,728,000, $2,794,000 and $643,000in 2006, 2005 and 2004, respectively) . . . . . . . . . . . . . . . . 239,927,000 192,838,000 177,800,000
Costs of products sold . . . . . . . . . . . . . . . . . . . . . . . . . . . . . . 79,989,000 83,197,000 72,817,000Depreciation . . . . . . . . . . . . . . . . . . . . . . . . . . . . . . . . . . . . . 131,416,000 126,778,000 124,200,000Amortization . . . . . . . . . . . . . . . . . . . . . . . . . . . . . . . . . . . . . 879,000 880,000 1,174,000Loss on fixed assets . . . . . . . . . . . . . . . . . . . . . . . . . . . . . . . 27,057,000 13,906,000 11,676,000
Total operating costs and expenses . . . . . . . . . . . . . . . . . . 895,600,000 808,396,000 750,698,000Income from operations . . . . . . . . . . . . . . . . . . . . . . . . . . . 50,065,000 148,361,000 128,888,000
Other income (expense):Interest expense . . . . . . . . . . . . . . . . . . . . . . . . . . . . . . . . . . (202,909,000) (185,997,000) (195,580,000)Interest income . . . . . . . . . . . . . . . . . . . . . . . . . . . . . . . . . . . 2,918,000 2,450,000 4,017,000Minority interest in earnings . . . . . . . . . . . . . . . . . . . . . . . . . . (40,223,000) (39,794,000) (37,686,000)Equity in operations of partnership . . . . . . . . . . . . . . . . . . . . . (948,000) — —Early repurchase of debt . . . . . . . . . . . . . . . . . . . . . . . . . . . . — (19,303,000) (37,731,000)Other expense . . . . . . . . . . . . . . . . . . . . . . . . . . . . . . . . . . . . (11,560,000) (10,877,000) (14,356,000)
Total other expense . . . . . . . . . . . . . . . . . . . . . . . . . . . . . . (252,722,000) (253,521,000) (281,336,000)Loss from continuing operations before income taxes,
discontinued operations and cumulative effect of achange in accounting principle . . . . . . . . . . . . . . . . . . . . (202,657,000) (105,160,000) (152,448,000)
Income tax expense . . . . . . . . . . . . . . . . . . . . . . . . . . . . . . . . . 4,318,000 3,705,000 24,442,000Loss from continuing operations before discontinued
operations and cumulative effect of a change inaccounting principle . . . . . . . . . . . . . . . . . . . . . . . . . . . . (206,975,000) (108,865,000) (176,890,000)
Discontinued operations, net of tax benefit of $49,845,000 in2004 . . . . . . . . . . . . . . . . . . . . . . . . . . . . . . . . . . . . . . . . . . . (97,605,000) (2,073,000) (287,919,000)
Loss before cumulative effect of a change in accountingprinciple . . . . . . . . . . . . . . . . . . . . . . . . . . . . . . . . . . . . . (304,580,000) (110,938,000) (464,809,000)
Cumulative effect of a change in accounting principle(see Note 1) . . . . . . . . . . . . . . . . . . . . . . . . . . . . . . . . . . . . . (1,038,000) — —
Net loss . . . . . . . . . . . . . . . . . . . . . . . . . . . . . . . . . . . . . . . $(305,618,000) $(110,938,000) $(464,809,000)
Net loss applicable to common stock . . . . . . . . . . . . . . . . . $(327,588,000) $(132,908,000) $(486,777,000)
Weighted average number of common shares outstanding —basic and diluted:. . . . . . . . . . . . . . . . . . . . . . . . . . . . . . . . . . 94,242,000 93,110,000 93,036,000
Net loss per average common share outstanding — basic anddiluted:
Loss from continuing operations . . . . . . . . . . . . . . . . . . . . . $ (2.43) $ (1.41) $ (2.14)Discontinued operations . . . . . . . . . . . . . . . . . . . . . . . . . . . (1.04) (0.02) (3.09)Cumulative effect of a change in accounting principle . . . . . (0.01) — —
Net loss . . . . . . . . . . . . . . . . . . . . . . . . . . . . . . . . . . . . . $ (3.48) $ (1.43) $ (5.23)
See accompanying notes to consolidated financial statements.
45
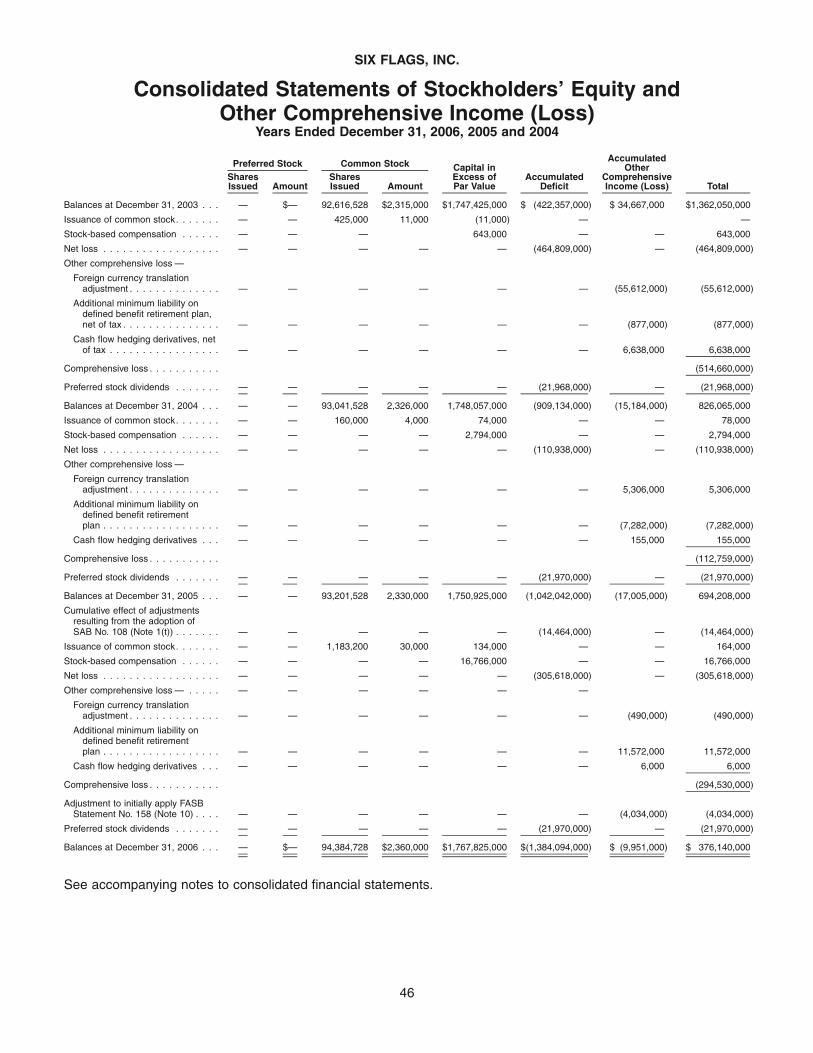
SIX FLAGS, INC.
Consolidated Statements of Stockholders’ Equity andOther Comprehensive Income (Loss)
Years Ended December 31, 2006, 2005 and 2004
SharesIssued Amount
SharesIssued Amount
Capital inExcess ofPar Value
AccumulatedDeficit
AccumulatedOther
ComprehensiveIncome (Loss) Total
Preferred Stock Common Stock
Balances at December 31, 2003 . . . — $— 92,616,528 $2,315,000 $1,747,425,000 $ (422,357,000) $ 34,667,000 $1,362,050,000
Issuance of common stock. . . . . . . — — 425,000 11,000 (11,000) — —
Stock-based compensation . . . . . . — — — 643,000 — — 643,000
Net loss . . . . . . . . . . . . . . . . . . — — — — — (464,809,000) — (464,809,000)
Other comprehensive loss —
Foreign currency translationadjustment . . . . . . . . . . . . . . — — — — — — (55,612,000) (55,612,000)
Additional minimum liability ondefined benefit retirement plan,net of tax . . . . . . . . . . . . . . . — — — — — — (877,000) (877,000)
Cash flow hedging derivatives, netof tax . . . . . . . . . . . . . . . . . — — — — — — 6,638,000 6,638,000
Comprehensive loss . . . . . . . . . . . (514,660,000)
Preferred stock dividends . . . . . . . — — — — — (21,968,000) — (21,968,000)
Balances at December 31, 2004 . . . — — 93,041,528 2,326,000 1,748,057,000 (909,134,000) (15,184,000) 826,065,000
Issuance of common stock. . . . . . . — — 160,000 4,000 74,000 — — 78,000
Stock-based compensation . . . . . . — — — — 2,794,000 — — 2,794,000
Net loss . . . . . . . . . . . . . . . . . . — — — — — (110,938,000) — (110,938,000)
Other comprehensive loss —
Foreign currency translationadjustment . . . . . . . . . . . . . . — — — — — — 5,306,000 5,306,000
Additional minimum liability ondefined benefit retirementplan . . . . . . . . . . . . . . . . . . — — — — — — (7,282,000) (7,282,000)
Cash flow hedging derivatives . . . — — — — — — 155,000 155,000
Comprehensive loss . . . . . . . . . . . (112,759,000)
Preferred stock dividends . . . . . . . — — — — — (21,970,000) — (21,970,000)
Balances at December 31, 2005 . . . — — 93,201,528 2,330,000 1,750,925,000 (1,042,042,000) (17,005,000) 694,208,000
Cumulative effect of adjustmentsresulting from the adoption ofSAB No. 108 (Note 1(t)) . . . . . . . — — — — — (14,464,000) — (14,464,000)
Issuance of common stock. . . . . . . — — 1,183,200 30,000 134,000 — — 164,000
Stock-based compensation . . . . . . — — — — 16,766,000 — — 16,766,000
Net loss . . . . . . . . . . . . . . . . . . — — — — — (305,618,000) — (305,618,000)
Other comprehensive loss — . . . . . — — — — — —
Foreign currency translationadjustment . . . . . . . . . . . . . . — — — — — — (490,000) (490,000)
Additional minimum liability ondefined benefit retirementplan . . . . . . . . . . . . . . . . . . — — — — — — 11,572,000 11,572,000
Cash flow hedging derivatives . . . — — — — — — 6,000 6,000
Comprehensive loss . . . . . . . . . . . (294,530,000)
Adjustment to initially apply FASBStatement No. 158 (Note 10) . . . . — — — — — — (4,034,000) (4,034,000)
Preferred stock dividends . . . . . . . — — — — — (21,970,000) — (21,970,000)
Balances at December 31, 2006 . . . — $— 94,384,728 $2,360,000 $1,767,825,000 $(1,384,094,000) $ (9,951,000) $ 376,140,000
See accompanying notes to consolidated financial statements.
46

SIX FLAGS, INC.
Consolidated Statements of Cash FlowsYears Ended December 31, 2006, 2005 and 2004
2006 2005 2004
Cash flow from operating activities:Net loss. . . . . . . . . . . . . . . . . . . . . . . . . . . . . . . . . . . . . . . . . . . . . . . $(305,618,000) $(110,938,000) $ (464,809,000)
Adjustments to reconcile net loss to net cash provided by operating activities:Depreciation and amortization . . . . . . . . . . . . . . . . . . . . . . . . . . 132,295,000 127,658,000 125,374,000Minority interest in earnings . . . . . . . . . . . . . . . . . . . . . . . . . . . 40,223,000 39,794,000 37,686,000Minority interest distributions . . . . . . . . . . . . . . . . . . . . . . . . . . . (46,505,000) (44,428,000) (41,568,000)Stock-based compensation . . . . . . . . . . . . . . . . . . . . . . . . . . . . 15,728,000 2,794,000 643,000Cumulative effect of a change in accounting principle . . . . . . . . . 1,038,000 — —Interest accretion on notes payable . . . . . . . . . . . . . . . . . . . . . . 237,000 259,000 496,000Early repurchase of debt . . . . . . . . . . . . . . . . . . . . . . . . . . . . . . — 19,303,000 37,731,000Loss on discontinued operations . . . . . . . . . . . . . . . . . . . . . . . . 118,304,000 45,264,000 294,693,000Amortization of debt issuance costs . . . . . . . . . . . . . . . . . . . . . . 9,539,000 8,204,000 8,117,000Other including loss on disposal of assets . . . . . . . . . . . . . . . . . 26,885,000 14,165,000 26,476,000Decrease (increase) in accounts receivable . . . . . . . . . . . . . . . . (11,413,000) 3,920,000 1,335,000(Increase) decrease in inventories, prepaid expenses and other
current assets . . . . . . . . . . . . . . . . . . . . . . . . . . . . . . . . . . . . 1,778,000 (3,276,000) (8,853,000)(Increase) decrease in deposits and other assets . . . . . . . . . . . . 15,326,000 9,811,000 (10,110,000)Increase in accounts payable, deferred income, accrued liabilities
and other long-term liabilities . . . . . . . . . . . . . . . . . . . . . . . . . 9,839,000 12,766,000 17,052,000Increase (decrease) in accrued interest payable . . . . . . . . . . . . . 2,655,000 (3,790,000) (10,034,000)Deferred income tax expense (benefit) . . . . . . . . . . . . . . . . . . . . (507,000) (96,000) 19,238,000
Total adjustments . . . . . . . . . . . . . . . . . . . . . . . . . . . . . . . . . 315,422,000 232,348,000 498,276,000
Net cash provided by operating activities. . . . . . . . . . . . . . . . . 9,804,000 121,410,000 33,467,000Cash flow from investing activities:
Additions to property and equipment . . . . . . . . . . . . . . . . . . . . . . . . (122,586,000) (162,554,000) (96,489,000)Purchase of identifiable intangible assets . . . . . . . . . . . . . . . . . . . . . — — (500,000)Capital expenditures of discontinued operations . . . . . . . . . . . . . . . . (6,870,000) (9,468,000) (12,728,000)Acquisition of theme park assets . . . . . . . . . . . . . . . . . . . . . . . . . . . (417,000) — —Purchase of restricted-use investments. . . . . . . . . . . . . . . . . . . . . . . (11,091,000) — (134,508,000)Maturities of restricted-use investments . . . . . . . . . . . . . . . . . . . . . . — 134,508,000 317,913,000Proceeds from sale of discontinued operations . . . . . . . . . . . . . . . . . 79,000,000 — 314,456,000Property insurance recovery, net . . . . . . . . . . . . . . . . . . . . . . . . . . . 21,446,000 — —Proceeds from sale of assets . . . . . . . . . . . . . . . . . . . . . . . . . . . . . . 502,000 367,000 12,954,000
Net cash provided by (used in) investing activities . . . . . . . . . . (40,016,000) (37,147,000) 401,098,000Cash flow from financing activities:
Repayment of borrowings . . . . . . . . . . . . . . . . . . . . . . . . . . . . . . . . (365,847,000) (617,526,000) (1,146,461,000)Proceeds from borrowings . . . . . . . . . . . . . . . . . . . . . . . . . . . . . . . . 363,583,000 571,525,000 716,500,000Net cash proceeds from issuance of common stock. . . . . . . . . . . . . . 164,000 78,000 —Payment of cash dividends . . . . . . . . . . . . . . . . . . . . . . . . . . . . . . . (20,844,000) (20,844,000) (20,844,000)Payment of debt issuance costs . . . . . . . . . . . . . . . . . . . . . . . . . . . . (2,950,000) (5,540,000) (13,490,000)
Net cash used in financing activities . . . . . . . . . . . . . . . . . . . . (25,894,000) (72,307,000) (464,295,000)Effect of exchange rate changes on cash . . . . . . . . . . . . . . . . . . . . . . . . $ (109,000) $ 790,000 $ 615,000
Increase (decrease) in cash and cash equivalents . . . . . . . . . . . . . . . . . . (56,215,000) 12,746,000 (29,115,000)Cash and cash equivalents at beginning of year . . . . . . . . . . . . . . . . . 80,510,000 67,764,000 96,879,000Cash and cash equivalents at end of year . . . . . . . . . . . . . . . . . . . . . . $ 24,295,000 $ 80,510,000 $ 67,764,000
Supplemental cashflow information:Cash paid for interest . . . . . . . . . . . . . . . . . . . . . . . . . . . . . . . . . . . . . $ 190,477,000 $ 181,339,000 $ 197,091,000
Cash paid for income taxes. . . . . . . . . . . . . . . . . . . . . . . . . . . . . . . . . $ 4,702,000 $ 4,883,000 $ 3,620,000
Supplemental disclosure of noncash investing and financing activities
2006 - Acquired approximately $617,000 of assets through a capital lease.
2005 - None
2004 - None
See accompanying notes to consolidated financial statements.
47
SIX FLAGS, INC.
Notes to Consolidated Financial StatementsYears Ended December 31, 2006, 2005 and 2004
(1) Summary of Significant Accounting Policies
(a) Description of Business
We own and operate regional theme amusement andwater parks. As of December 31, 2003, we owned oroperated 39 parks. In April 2004 we sold, in two separatetransactions, seven parks in Europe, one park in Ohio andwe also wrote-off our investment in the owner of the Madridpark that we managed. As of December 31, 2004, weowned or operated 30 parks, including 28 domestic parks,one park in Mexico and one in Canada. In October 2005,we closed Six Flags AstroWorld in Houston, Texas and in2006 sold the underlying 104 acre site. We transferredcertain property and equipment from the Houston park toother parks prior to completing the sale. At December 31,2005 we owned or operated 29 parks. During 2006, weowned or operated 30 parks, including an indoor waterpark adjacent to The Great Escape, which opened inFebruary 2006. The accompanying consolidated financialstatements as of December 31, 2006 and for the yearsended December 31, 2006, 2005 and 2004 reflect theassets, liabilities and results of the facilities sold and heldfor sale as discontinued operations. See Note 2.
During the first quarter of 2006, we exercised our right toterminate the ground lease at our Sacramento, Californiawater park following the 2006 season. In March 2007, wesold substantially all of the assets of the water park forapproximately $950,000. In November 2006, we com-pleted the sale of substantially all of the assets of ourwater park in Columbus, Ohio to our lessor, the ColumbusZoo for $2.0 million. The net proceeds from the sale ofeach of the Sacramento and Columbus assets were andwill be used to repay indebtedness. The accompanyingconsolidated financial statements as of and for all periodspresented reflect select assets and liabilities of the parksheld for sale as assets held for sale, the liabilities asliabilities from discontinued operations and their resultsas discontinued operations. See Note 2.
In January 2007, we agreed to sell to PARC 7F-Operations Corporation the stock of our subsidiaries thatown three of our water parks and four of our theme parksfor an aggregate purchase price of $312 million, consistingof $275 million in cash, subject to adjustment, a notereceivable for $37 million and a limited guarantee by usof up to $10 million. The Sale Parks are Six Flags DarienLake near Buffalo, NY; Waterworld USA in Concord, CA;Six Flags Elitch Gardens in Denver, CO; Splashtown inHouston, TX; Frontier City and the White Water Bay waterpark in Oklahoma City, OK; and Wild Waves andEnchanted Village near Seattle, WA (the “Sale Parks”).The accompanying consolidated financial statements as
of and for all periods presented reflect select assets andliabilities of the Sale Parks as assets held for sale, theliabilities as liabilities from discontinued operations andtheir results as a discontinued operation. See Note 2.
Six Flags New Orleans sustained very extensive dam-age in Hurricane Katrina in late August 2005 and did notreopen during the 2006 season and will not open duringthe 2007 season. See Note 12.
Unless otherwise indicated, references herein to “we,”“our” or “Six Flags” means Six Flags, Inc. and our subsid-iaries, and “Holdings” refers only to Six Flags, Inc., withoutregard to our subsidiaries.
(b) Basis of Presentation
Our accounting policies reflect industry practices andconform to U.S. generally accepted accounting principles.
The consolidated financial statements include ouraccounts, our majority and wholly owned subsidiaries,and limited partnerships and limited liability companiesin which we beneficially own 100% of the interests.
During the fourth quarter of 2003, we adopted State-ment of Financial Accounting Standards (“SFAS”) Inter-pretation No. 46, “Consolidation of Variable InterestEntities, an Interpretation of Accounting Research Bulle-tin No. 51” which was subsequently reissued in December2003 as Interpretation No. 46 — Revised (FIN 46). Pur-suant to those provisions we consolidate the partnershipsand joint ventures that own Six Flags Over Texas, SixFlags Over Georgia, Six Flags White Water Atlanta andDiscovery Kingdom (formerly Six Flags Marine World) aswe have determined that we have the most significanteconomic interest because we receive a majority of theseentity’s expected losses or expected residual returns andhave the ability to make decisions that significantly affectthe results of the activities of these entities. The equityinterests owned by nonaffiliated parties in these entitiesare reflected in the accompanying consolidated balancesheets as minority interest. The portion of earnings fromthese parks owned by non-affiliated parties in these enti-ties is reflected as minority interest in earnings in theaccompanying consolidated statements of operationsand in the consolidated statements of cash flows.
In November 2004, we sold for nominal considerationour 5% equity investment in Warner Bros. Movie WorldMadrid which had been accounted for using the costmethod of accounting. The loss on the disposition isaccounted for as other income (loss) in the accompanyingstatement of operations for the year ended December 31,2004. See Note 2.
48
Intercompany transactions and balances have beeneliminated in consolidation.
(c) Cash Equivalents
Cash equivalents of $2,188,000 and $36,084,000 atDecember 31, 2006 and 2005, respectively, consist ofshort-term highly liquid investments with a remainingmaturity as of purchase date of three months or less,which are readily convertible into cash. For purposes ofthe consolidated statements of cash flows, we consider allhighly liquid debt instruments with remaining maturities asof their purchase date of three months or less to be cashequivalents.
(d) Inventories
Inventories are stated at the lower of cost (first-in, first-out) or market value and primarily consist of products forresale including merchandise and food and miscellaneoussupplies. Costs of goods sold for the year ended Decem-ber 31, 2005 include $1,987,000 associated with a valu-ation allowance related to slow moving inventory. Thevaluation allowance related to slow moving inventorywas reduced to $57,000 at the end of 2006 primarilyrelated to the sale of most of our slow moving inventoryto a liquidator.
(e) Prepaid Expenses and Other Current Assets
Prepaid expenses and other current assets include$18,763,000 and $16,435,000 of spare parts inventoryfor existing rides and attractions at December 31, 2006and 2005, respectively. These items are expensed as therepair or maintenance of rides and attractions occur.
(f) Advertising Costs
Production costs of commercials and programming arecharged to operations in the year first aired. The costs ofother advertising, promotion, and marketing programs arecharged to operations when incurred with the exception ofdirect-response advertising which is charged to the periodit will benefit. The amounts capitalized at year end areincluded in prepaid expenses.
Advertising and promotions expense was$100,997,000, $94,206,000 and $99,375,000 during theyears ended December 31, 2006, 2005 and 2004,respectively.
(g) Debt Issuance Costs
We capitalize costs related to the issuance of debt. Theamortization of such costs is recognized as interestexpense using the interest method over the term of therespective debt issue.
(h) Property and Equipment
Rides and attractions are depreciated using the straight-line method over 5-25 years. Land improvements aredepreciated using the straight-line method over10-15 years. Buildings and improvements are depreciatedover their estimated useful lives of approximately 30 yearsby use of the straight-line method. Furniture and equip-ment are depreciated using the straight-line method over5-10 years. Maintenance and repairs are charged directlyto expense as incurred, while betterments and renewalsare generally capitalized as property and equipment.When an item is retired or otherwise disposed of, the costand applicable accumulated depreciation are removed andthe resulting gain or loss is recognized.
(i) Intangible Assets
Goodwill and intangible assets with indefinite usefullives are tested for impairment at least annually. To accom-plish this, we identify our reporting units and determine thecarrying value of each reporting unit by assigning theassets and liabilities, including the existing goodwill andintangible assets, to those reporting units. We then deter-mine the fair value of each reporting unit and compare it tothe carrying amount of the reporting unit. For 2004, 2005and 2006, our sole reporting unit was our North Americanparks, as we had sold our European operations. For eachyear, the fair value of the reporting unit exceeded ourcarrying amount. Accordingly, no impairment wasrequired.
If the fair value of the reporting unit were to be less thanthe carrying amount, we would compare the implied fairvalue of the reporting unit goodwill with the carryingamount of the reporting unit goodwill. The implied fairvalue of goodwill is determined by allocating the fair valueof the reporting unit to all of the assets (recognized andunrecognized) and liabilities of the reporting unit in amanner similar to a purchase price allocation. The residualfair value after this allocation is the implied fair value of thereporting unit goodwill. Our unamortized goodwill is$1,038.9 million at December 31, 2006.
49
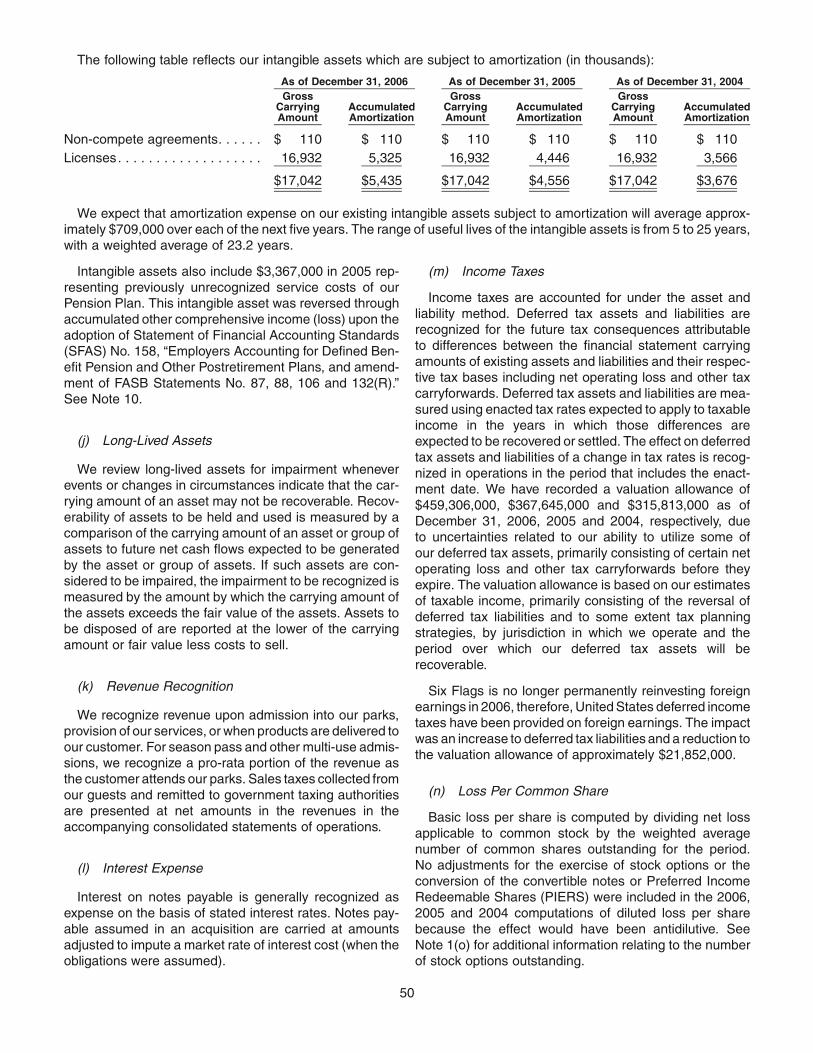
The following table reflects our intangible assets which are subject to amortization (in thousands):
GrossCarryingAmount
AccumulatedAmortization
GrossCarryingAmount
AccumulatedAmortization
GrossCarryingAmount
AccumulatedAmortization
As of December 31, 2006 As of December 31, 2005 As of December 31, 2004
Non-compete agreements. . . . . . $ 110 $ 110 $ 110 $ 110 $ 110 $ 110Licenses. . . . . . . . . . . . . . . . . . . 16,932 5,325 16,932 4,446 16,932 3,566
$17,042 $5,435 $17,042 $4,556 $17,042 $3,676
We expect that amortization expense on our existing intangible assets subject to amortization will average approx-imately $709,000 over each of the next five years. The range of useful lives of the intangible assets is from 5 to 25 years,with a weighted average of 23.2 years.
Intangible assets also include $3,367,000 in 2005 rep-resenting previously unrecognized service costs of ourPension Plan. This intangible asset was reversed throughaccumulated other comprehensive income (loss) upon theadoption of Statement of Financial Accounting Standards(SFAS) No. 158, “Employers Accounting for Defined Ben-efit Pension and Other Postretirement Plans, and amend-ment of FASB Statements No. 87, 88, 106 and 132(R).”See Note 10.
(j) Long-Lived Assets
We review long-lived assets for impairment wheneverevents or changes in circumstances indicate that the car-rying amount of an asset may not be recoverable. Recov-erability of assets to be held and used is measured by acomparison of the carrying amount of an asset or group ofassets to future net cash flows expected to be generatedby the asset or group of assets. If such assets are con-sidered to be impaired, the impairment to be recognized ismeasured by the amount by which the carrying amount ofthe assets exceeds the fair value of the assets. Assets tobe disposed of are reported at the lower of the carryingamount or fair value less costs to sell.
(k) Revenue Recognition
We recognize revenue upon admission into our parks,provision of our services, or when products are delivered toour customer. For season pass and other multi-use admis-sions, we recognize a pro-rata portion of the revenue asthe customer attends our parks. Sales taxes collected fromour guests and remitted to government taxing authoritiesare presented at net amounts in the revenues in theaccompanying consolidated statements of operations.
(l) Interest Expense
Interest on notes payable is generally recognized asexpense on the basis of stated interest rates. Notes pay-able assumed in an acquisition are carried at amountsadjusted to impute a market rate of interest cost (when theobligations were assumed).
(m) Income Taxes
Income taxes are accounted for under the asset andliability method. Deferred tax assets and liabilities arerecognized for the future tax consequences attributableto differences between the financial statement carryingamounts of existing assets and liabilities and their respec-tive tax bases including net operating loss and other taxcarryforwards. Deferred tax assets and liabilities are mea-sured using enacted tax rates expected to apply to taxableincome in the years in which those differences areexpected to be recovered or settled. The effect on deferredtax assets and liabilities of a change in tax rates is recog-nized in operations in the period that includes the enact-ment date. We have recorded a valuation allowance of$459,306,000, $367,645,000 and $315,813,000 as ofDecember 31, 2006, 2005 and 2004, respectively, dueto uncertainties related to our ability to utilize some ofour deferred tax assets, primarily consisting of certain netoperating loss and other tax carryforwards before theyexpire. The valuation allowance is based on our estimatesof taxable income, primarily consisting of the reversal ofdeferred tax liabilities and to some extent tax planningstrategies, by jurisdiction in which we operate and theperiod over which our deferred tax assets will berecoverable.
Six Flags is no longer permanently reinvesting foreignearnings in 2006, therefore, United States deferred incometaxes have been provided on foreign earnings. The impactwas an increase to deferred tax liabilities and a reduction tothe valuation allowance of approximately $21,852,000.
(n) Loss Per Common Share
Basic loss per share is computed by dividing net lossapplicable to common stock by the weighted averagenumber of common shares outstanding for the period.No adjustments for the exercise of stock options or theconversion of the convertible notes or Preferred IncomeRedeemable Shares (PIERS) were included in the 2006,2005 and 2004 computations of diluted loss per sharebecause the effect would have been antidilutive. SeeNote 1(o) for additional information relating to the numberof stock options outstanding.
50

Our PIERS, which are shown as mandatorily redeem-able preferred stock on our consolidated balance sheets,were issued in January 2001 and are convertible into13,789,000 shares of common stock. Our convertiblenotes were issued in November 2004 and are convertibleinto approximately 47,087,000 shares of common stock.
Preferred stock dividends and amortization of relatedissue costs of $21,970,000, $21,970,000 and $21,968,000were included in determining net loss applicable to com-mon stock in 2006, 2005, and 2004, respectively.
(o) Stock Compensation
As described below, we maintain stock-based compen-sation arrangements under which employees and direc-tors are awarded grants of restricted stock and stockoptions. Prior to January 1, 2006, we accounted for theseawards under the recognition and measurement provi-sions of Accounting Principles Board Opinion No. 25,“Accounting for Stock Issued to Employees” (“APB 25”)as permitted under SFAS No. 123, “Accounting for Stock-Based Compensation” (“SFAS 123”). Accordingly, com-pensation expense for stock options was not recognized aslong as the stock options granted had an exercise priceequal to or greater than the market price of our commonstock on the date of grant. Effective January 1, 2006, weadopted the fair value recognition provisions ofSFAS No. 123 (revised 2004), “Share-Based Payment,”(“SFAS 123(R)”) using the modified-prospective transition
method. Under this transition method, compensationexpense recognized beginning January 1, 2006 includescompensation expense for all stock-based paymentarrangements granted prior to, but not yet vested as of,January 1, 2006, based on the grant date fair value andexpense attribution methodology determined in accor-dance with the provisions of SFAS 123, a cumulative effectfor liability based awards granted prior to January 1, 2006,and compensation cost for all stock-based paymentarrangements granted subsequent to December 31,2005, based on the grant date fair value and expenseattribution methodology determined in accordance withthe provisions of SFAS 123(R). Results for periods priorto January 1, 2006 have not been restated. During thethree years ended December 31, 2006, 2005 and 2004,stock-based compensation was $15,728,000, $2,794,000and $643,000, respectively.
As a result of adopting SFAS 123(R), a cumulative effectloss of $1,038,000 was recognized on certain liabilitybased options and our loss from continuing operationsbefore income taxes for the year ended December 31,2006 is $8,579,000 higher than if we had continued toaccount for stock-based payment arrangements underAPB 25. Basic and diluted net loss per share for the yearended December 31, 2006 would have been $3.38 if wehad not adopted SFAS 123(R), compared to reportedbasic and diluted loss per share of $3.48.
No compensation expense has been recognized for the unconditional stock options in the consolidated financialstatements for the years ended December 31, 2005 and 2004. Had we determined compensation expense based on thefair value at the grant date for all our unconditional stock options under SFAS 123 and as provided for underSFAS No. 148, “Accounting for Stock-Based Compensation — Transition and Disclosure, an Amendment of FASBStatement No. 123,” our net loss applicable to common stock would have been adjusted to the pro forma amounts below:
2005 2004
Net loss applicable to common stock:As reported . . . . . . . . . . . . . . . . . . . . . . . . . . . . . . . . . . . . . . $(132,908,000) $(486,777,000)Add: Noncash compensation . . . . . . . . . . . . . . . . . . . . . . . . . 2,794,000 643,000Deduct: Total stock-based employee compensation expense
determined under fair value based method for all awards,net of related tax effects. . . . . . . . . . . . . . . . . . . . . . . . . . . (7,903,000) (2,868,000)
Pro forma . . . . . . . . . . . . . . . . . . . . . . . . . . . . . . . . . . . . . . . $(138,017,000) $(489,002,000)
Net loss per weighted average common share outstanding —basic and diluted:
As reported . . . . . . . . . . . . . . . . . . . . . . . . . . . . . . . . . . . . $ (1.43) $ (5.23)Pro forma. . . . . . . . . . . . . . . . . . . . . . . . . . . . . . . . . . . . . . $ (1.48) $ (5.26)
Certain members of our management and professionalstaff have been issued seven- and ten-year options topurchase common shares under our 2006, 2004, 2001,1998, 1996, 1995 and 1993 Stock Option and IncentivePlans (collectively, the Option Plans). Through Decem-ber 31, 2006, all stock options granted under the Option
Plans have been granted with an exercise price equal tothe underlying stock’s fair value at the date of grant. Exceptfor conditional options issued in 1998, options generallymay be exercised on a cumulative basis with 20% of thetotal exercisable on the date of issuance and with anadditional 20% being available for exercise on each of
51

the succeeding anniversary dates. Any unexercised por-tion of the options will automatically terminate upon theseventh or tenth anniversary of the issuance date or fol-lowing termination of employment with the exception ofgrants that contain provisions which, in the event of achange in control of the Company, may accelerate thevesting of the awards.
In June 2001, our stockholders approved a stock optionplan for non-management directors providing for optionswith respect to an aggregate of 250,000 shares. In June2004, our stockholders approved a stock option plan foremployees and directors providing for options with respectto 1,800,000 shares. In May 2006, our stockholdersapproved a stock option plan for employees and directorsproviding for options with respect to 2,000,000 shares.Through December 31, 2005, we have granted to our non-management directors an aggregate of 1,185,000 optionswith a weighted average exercise price of $9.12 andweighted average remaining life to maturity of 2.22 years.During the first quarter of 2006, four of our former non-management directors exercised 96,000 of their previ-ously granted options and forfeited their remaining304,000 options upon their removal from our board. Addi-tionally, during the first quarter we issued 745,000 sharesto our current non-management directors. Other thanexercise prices, the terms of the directors’ options arecomparable to options issued to management.
At December 31, 2006, there were 3,130,000 additionalshares available for grant under the Option Plans. In June2006, 2,810,000 options that had been issued as liabilitybased options to 16 employees were modified to obtainequity based status. This modification resulted in$4,022,000 of liabilities, related to stock-based compen-sation, to be reclassified to equity. The per share weighted-average fair value of stock options granted during 2006,2005, and 2004, and after consideration of the modifica-tion, was $4.60, $4.99 and $5.03, respectively, on the dateof grant or the modification date.
The estimated fair value of options granted without amarket condition was calculated using the Black-Scholesoption pricing valuation model. This model takes intoaccount several factors and assumptions. The risk-freeinterest rate is based on the yield on U.S. Treasury zero-coupon issues with a remaining term equal to the expectedlife assumption at the time of grant. The expected term(estimated period of time outstanding) is estimated usingthe contractual term of the option and the historical effectsof employees’ expected exercise and post-vesting employ-ment termination behavior. Expected volatility was calcu-lated based on historical volatility for a period equal to thestock option’s expected life, calculated on a daily basis in2006 and monthly basis in 2005. The expected dividendyield is based on expected dividends for the expected termof the stock options.
The estimated fair value of options granted to our Pres-ident and Chief Executive Officer with a market conditionwas calculated using the Monte Carlo option pricing val-uation model. This model takes into account several fac-tors and assumptions. The risk-free interest rate is basedon the yield on U.S. Treasury zero-coupon issues with aremaining term equal to the expected life assumption atthe time of grant. The expected term (estimated period oftime outstanding) is estimated using the contractual termof the option and the historical effects of employees’expected exercise and post-vesting employment termina-tion behavior. Expected volatility was equal to the expectedvolatility utilized in the Black-Scholes option pricing valu-ation model described above. The expected dividend yieldis based on expected dividends for the expected term ofthe stock options. The vesting hurdles were based on themarket prices of our common stock pursuant to the termsof the option grants ($12 and $15) and the exercise mul-tiple utilized was 1.75 which assumes that the optionholder will exercise once the stock price has appreciatedto 1.75 times the grant price.
The weighted-average assumptions used in the option pricing valuation models for options granted in the years ended2006, 2005 and 2004 are as follows:
Employees Directors Employees Directors Employees Directors
2006 2005 2004
Risk-free interest rate . . . . . . . . . . . . . . . . 4.77% 4.55% 4.09% 4.24% 3.28% 3.28%Expected life (in years) . . . . . . . . . . . . . . . 5.33 6.25 5.00 5.00 5.00 5.00Expected volatility . . . . . . . . . . . . . . . . . . . 60% 55% 78% 79% 80% 80%Expected dividend yield . . . . . . . . . . . . . . — — — — — —
52
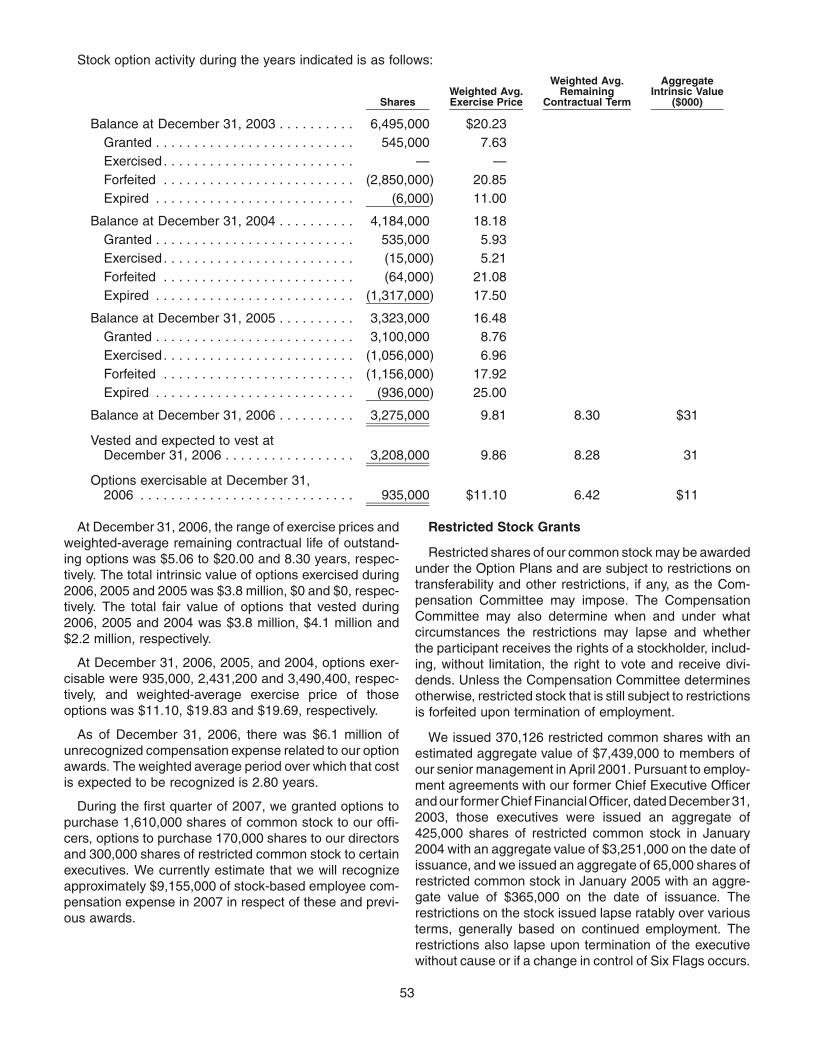
Stock option activity during the years indicated is as follows:
SharesWeighted Avg.Exercise Price
Weighted Avg.Remaining
Contractual Term
AggregateIntrinsic Value
($000)
Balance at December 31, 2003 . . . . . . . . . . 6,495,000 $20.23Granted . . . . . . . . . . . . . . . . . . . . . . . . . . 545,000 7.63Exercised . . . . . . . . . . . . . . . . . . . . . . . . . — —Forfeited . . . . . . . . . . . . . . . . . . . . . . . . . (2,850,000) 20.85Expired . . . . . . . . . . . . . . . . . . . . . . . . . . (6,000) 11.00
Balance at December 31, 2004 . . . . . . . . . . 4,184,000 18.18Granted . . . . . . . . . . . . . . . . . . . . . . . . . . 535,000 5.93Exercised . . . . . . . . . . . . . . . . . . . . . . . . . (15,000) 5.21Forfeited . . . . . . . . . . . . . . . . . . . . . . . . . (64,000) 21.08Expired . . . . . . . . . . . . . . . . . . . . . . . . . . (1,317,000) 17.50
Balance at December 31, 2005 . . . . . . . . . . 3,323,000 16.48Granted . . . . . . . . . . . . . . . . . . . . . . . . . . 3,100,000 8.76Exercised . . . . . . . . . . . . . . . . . . . . . . . . . (1,056,000) 6.96Forfeited . . . . . . . . . . . . . . . . . . . . . . . . . (1,156,000) 17.92Expired . . . . . . . . . . . . . . . . . . . . . . . . . . (936,000) 25.00
Balance at December 31, 2006 . . . . . . . . . . 3,275,000 9.81 8.30 $31
Vested and expected to vest atDecember 31, 2006 . . . . . . . . . . . . . . . . . 3,208,000 9.86 8.28 31
Options exercisable at December 31,2006 . . . . . . . . . . . . . . . . . . . . . . . . . . . . 935,000 $11.10 6.42 $11
At December 31, 2006, the range of exercise prices andweighted-average remaining contractual life of outstand-ing options was $5.06 to $20.00 and 8.30 years, respec-tively. The total intrinsic value of options exercised during2006, 2005 and 2005 was $3.8 million, $0 and $0, respec-tively. The total fair value of options that vested during2006, 2005 and 2004 was $3.8 million, $4.1 million and$2.2 million, respectively.
At December 31, 2006, 2005, and 2004, options exer-cisable were 935,000, 2,431,200 and 3,490,400, respec-tively, and weighted-average exercise price of thoseoptions was $11.10, $19.83 and $19.69, respectively.
As of December 31, 2006, there was $6.1 million ofunrecognized compensation expense related to our optionawards. The weighted average period over which that costis expected to be recognized is 2.80 years.
During the first quarter of 2007, we granted options topurchase 1,610,000 shares of common stock to our offi-cers, options to purchase 170,000 shares to our directorsand 300,000 shares of restricted common stock to certainexecutives. We currently estimate that we will recognizeapproximately $9,155,000 of stock-based employee com-pensation expense in 2007 in respect of these and previ-ous awards.
Restricted Stock Grants
Restricted shares of our common stock may be awardedunder the Option Plans and are subject to restrictions ontransferability and other restrictions, if any, as the Com-pensation Committee may impose. The CompensationCommittee may also determine when and under whatcircumstances the restrictions may lapse and whetherthe participant receives the rights of a stockholder, includ-ing, without limitation, the right to vote and receive divi-dends. Unless the Compensation Committee determinesotherwise, restricted stock that is still subject to restrictionsis forfeited upon termination of employment.
We issued 370,126 restricted common shares with anestimated aggregate value of $7,439,000 to members ofour senior management in April 2001. Pursuant to employ-ment agreements with our former Chief Executive Officerand our former Chief FinancialOfficer, dated December 31,2003, those executives were issued an aggregate of425,000 shares of restricted common stock in January2004 with an aggregate value of $3,251,000 on the date ofissuance, and we issued an aggregate of 65,000 shares ofrestricted common stock in January 2005 with an aggre-gate value of $365,000 on the date of issuance. Therestrictions on the stock issued lapse ratably over variousterms, generally based on continued employment. Therestrictions also lapse upon termination of the executivewithout cause or if a change in control of Six Flags occurs.
53

In December 2005 our former Chief Executive Officerentered into a termination agreement pursuant to which,among other things, he was issued the remaining80,000 shares of restricted common stock provided forin his employment agreement and all restrictions on allrestricted shares issued under the employment agreementlapsed. Compensation expense equal to the aggregatevalue of the issued shares was recognized in 2005 due tothis accelerated vesting.
We issued 820,000 shares of restricted stock during theyear ended December 31, 2006 to certain executives,which vest as follows:, (i) 50,000 vested on March 31,2006 upon the resignation of our former chief financialofficer, (ii) 520,000 shares will vest in three equal annualinstallments, commencing January 2007 and(iii) 250,000 shares will vest in two equal installments inJanuary 2009 and 2010.
A summary of the status of our restricted stock awards as of December 31, 2006 and changes during the twelvemonths then ended is presented below:
SharesWeighted Average
Grant Date Fair Value
Non-vested balance at January 1, 2006 . . . . . . . . . . . . . . . . . . . . . . . . . . 162,500 $7.44Granted . . . . . . . . . . . . . . . . . . . . . . . . . . . . . . . . . . . . . . . . . . . . . . . . . . 820,000 8.54Vested . . . . . . . . . . . . . . . . . . . . . . . . . . . . . . . . . . . . . . . . . . . . . . . . . . . (212,500) 7.80Forfeited . . . . . . . . . . . . . . . . . . . . . . . . . . . . . . . . . . . . . . . . . . . . . . . . . . — —
Non-vested balance at December 31, 2006 . . . . . . . . . . . . . . . . . . . . . . . . 770,000 $8.52
The weighted average grant date fair value per share ofour restricted stock awards granted during the twelvemonths ended December 31, 2006, 2005 and 2004 was$8.54, $6.46 and $7.65, respectively. The total grant datefair value of our restricted stock distributed during theyears ended December 31, 2006, 2005 and 2004 was$7.0 million, $0.9 million and $3.3 million, respectively. Thetotal fair value of restricted stock that vested during theyears ended December 31, 2006, 2005 and 2004 was$1.7 million, $2.7 million and $0.5 million, respectively. Asof December 31, 2006, there was $3.4 million of unrec-ognized compensation costs related to our restricted stockawards. The weighted average period over which that costis expected to be recognized is 2.26 years.
(p) Investment Securities
Restricted-use investment securities at December 31,2006 consist of funds deposited in escrow in a short termmoney market to satisfy the Subordinated IndemnityAgreement we have with Time Warner related to thePartnership Parks as a source of funds in the event TimeWarner, Inc. is required to honor its guarantee to thepartners of these parks.
Interest income is recognized when earned andincreases the escrow funds available in the event TimeWarner is required to honor its guarantee.
(q) Comprehensive Income (Loss)
Comprehensive income (loss) consists of net loss,changes in the foreign currency translation adjustment,changes in the fair value of derivatives that are designatedas hedges and the additional minimum liability on ourdefined benefit plan and is presented in the consolidatedstatements of stockholders’ equity and other
comprehensive income (loss) as accumulated other com-prehensive income (loss).
We formally document all relationships between hedg-ing instruments and hedged items, as well as our risk-management objective and strategy for undertaking var-ious hedge transactions. This process includes linking allderivatives that are designated as cash-flow hedges toforecasted transactions. We also assess, both at thehedge’s inception and on an ongoing basis, whether thederivatives that are used in hedging transactions are highlyeffective in offsetting changes in cash flows of hedgeditems.
Changes in the fair value of a derivative that is effectiveand that is designated and qualifies as a cash-flow hedgeare recorded in other comprehensive income (loss), untiloperations are affected by the variability in cash flows ofthe designated hedged item. Changes in fair value of aderivative that is not designated as a hedge are recorded inoperations on a current basis.
(r) Use of Estimates
The preparation of financial statements in conformitywith U.S. generally accepted accounting principlesrequires management to make estimates and assump-tions that affect the reported amounts of assets and lia-bilities and disclosure of contingent assets and liabilities atthe date of the financial statements and the reportedamounts of revenues and expenses during the reportingperiod. Actual results could differ from those estimates.
(s) Reclassifications
Reclassifications have been made to certain amountsreported in 2004 and 2005 to conform to the 2006presentation.
54

(t) Impact of Recently Issued AccountingPronouncements
In December 2004, the Financial Accounting StandardsBoard published SFAS 123(R), which requires that thecompensation cost relating to share-based payment trans-actions be recognized in financial statements. That costwill be measured based on the fair value of the equity orliability instruments issued. We adopted Statement 123(R)on January 1, 2006 under the modified prospectivemethod of application. Statement 123(R) covers a widerange of share-based compensation arrangements includ-ing share options, restricted share plans, performance-based awards, share appreciation rights, and employeeshare purchase plans. See Note 1(o) for additional infor-mation on the impact of adopting SFAS 123(R).
In June 2006, the FASB issued Interpretation No. 48,“Accounting for Uncertainty in Income Taxes” (“FIN 48”).FIN 48 clarifies the accounting for uncertainty in incometaxes recognized in an enterprise’s financial statements inaccordance with SFAS No. 109, “Accounting for IncomeTaxes.” This interpretation prescribes a recognition thresh-old and measurement attribute for the financial statementrecognition and measurement of a tax position taken orexpected to be taken in a tax return. FIN 48 also providesguidance on derecognition, classification, interest andpenalties, accounting in interim periods, disclosure andtransition. FIN 48 will be effective beginning January 1,2007. The Company does not expect the adoption ofFIN 48 to have a material impact on its financial conditionor results of operations.
In September 2006, the SEC issued Staff AccountingBulletin No. 108 (“SAB 108”), “Considering the Effects ofPrior Year Misstatements in Current Year Financial State-ments.” SAB 108 expresses the SEC Staff’s views regard-ing the process of quantifying financial statementmisstatements. SAB 108 addresses the diversity in prac-tice in quantifying financial statement misstatements andthe potential under current practice for the build up ofimproper amounts on the balance sheet. SAB 108 iseffective for the year ending December 31, 2006. Thecumulative effect of the initial application of SAB 108 mustbe reported in the carrying amounts of assets and liabilitiesas of the beginning of the year, with the offsetting balanceto retained earnings. The Company adopted SAB No. 108and adjusted its opening retained earnings for the yearended December 31, 2006 by approximately $14.5 millionof which approximately $11.6 million reflects a change inits accounting for leases and approximately $2.9 millionreflects a change in its accounting for accrued vacation.Prior to 2006, the Company did not record the effects ofscheduled rent increases on a straight-line rent basis forcertain real estate leases that were established between1997 and 2004 at several of our properties. Prior to 1998,the Company awarded vacation in the current year to all ofits employees. In 1998, the policy was changed to award
vacation one year after the date of hire and therefore avacation accrual should have been established for allemployees hired after 1998. The Company reviewed theannual amount of additional expense incurred in priorperiods for both of these adjustments and consideredthe effects to be immaterial to prior periods.
In September 2006, the FASB issued SFAS No. 158(“SFAS 158”), “Employer’s Accounting for Defined BenefitPension and Other Postretirement Plans — an amend-ment of FASB Statements No. 87, 88, 106 and 132(R).”SFAS 158 requires recognition of the overfunded or under-funded status of defined benefit postretirement plans as anasset or liability in the balance sheet and recognition ofchanges in that funded status in comprehensive income inthe year in which the changes occur. SFAS 158 alsorequires measurement of the funded status of a plan asof the date of the balance sheet. SFAS 158 is effective forrecognition of the funded status of the benefit plans for thefourth quarter of 2006, and will be effective for the mea-surement date provisions for the fourth quarter of 2008.The adoption of SFAS 158 resulted in a $4.0 million reduc-tion to other comprehensive income (loss). See Note 10 foradditional information on the impact of adopting SFAS 158.
In September 2006, the FASB issued Statement ofFinancial Accounting Standards No. 157 (“SFAS 157”),“Fair Value Measurement”. Statement No. 157 provides acommon definition of fair value, establishes a frameworkfor measuring fair value and expands disclosures aboutfair value measurements. However, this Statement doesnot require any new fair value measurements. StatementNo. 157 is effective for fiscal years beginning after Novem-ber 15, 2007. We do not expect the adoption of StatementNo. 157 to have a material impact on the financialstatements.
In February 2007, the FASB issued Statement of Finan-cial Accounting Standards No. 159 (“SFAS 159”), “The FairValue Option for Financial Assets and Financial Liabili-ties — Including an Amendment of FASB StatementNo. 115”. Statement No. 159 permits entities to chooseto measure certain financial instruments and other items atfair value. The objective is to improve financial reporting byproviding entities with the opportunity to mitigate volatilityin reported earnings caused by measuring related assetsand liabilities differently without having to apply complexhedge accounting provisions. Unrealized gains and losseson any item for which we elect the fair value measurementoption would be reported in earnings. Statement No. 159 iseffective for fiscal years beginning after November 15,2007, provided we also elect to apply the provisions ofSFAS 157 at the same time. We are currently assessingthe effect, if any, the adoption of SFAS 159 will have on ourfinancial statements and related disclosures.
55

(2) Disposition of Theme Parks
In January 2007, we agreed to sell the Sale Parks toPARC 7F-Operations Corporation. The consolidated bal-ance sheet as of December 31, 2006 and December 31,2005 and the consolidated statements of operations for allperiods presented reflect select assets of the parks beingsold as assets held for sale, select liabilities as liabilitiesfrom discontinued operations and the operating results asresults of discontinued operations.
We have recorded a non-cash impairment chargeagainst assets held for sale in connection with the SaleParks in our consolidated financial statements for the yearended December 31, 2006 in the amount of $84.5 million.The net proceeds from the sale will be used to repayindebtedness. The sale is subject to satisfaction of cus-tomary closing conditions, including the receipt of requiredthird party consents.
During the first quarter of 2006, we exercised our right toterminate the ground lease at our Sacramento, Californiawater park following the 2006 season. In March 2007, wesold substantially all of the assets of the water park forapproximately $950,000. In November 2006, we com-pleted the sale of substantially all of the assets of ourwater park in Columbus, Ohio to our lessor, the ColumbusZoo for $2.0 million. The net proceeds from the sale ofeach of the Sacramento and Columbus assets were, or willbe, used to repay indebtedness. We have recorded a non-cash impairment loss on these transactions in the amountof $11.5 million.
In October 2005, we permanently closed Six FlagsAstroWorld in Houston, Texas and on June 1, 2006, sold
the 104 acre site on which the park was located for anaggregate purchase price of $77 million. We haverecorded a non-cash impairment charge of $16.4 millionand $20.4 million related to this transaction for the yearended December 31, 2006 and 2005, respectively. Thesale was approved by our lenders under our credit agree-ment (see Note 6(a)) and the proceeds from the sale wereused to repay indebtedness. We relocated select rides,attractions and other equipment from Six Flags AstroWorldto our remaining parks and have sold certain other equip-ment. The consolidated balance sheets and the consoli-dated statements of operations for all relevant periodspresented reflect select assets of Six Flags AstroWorldas assets held for sale and its results as discontinuedoperations.
On April 8, 2004, we sold substantially all of the assetsused in the operation of Six Flags World of Adventure nearCleveland, Ohio (other than the marine and land animalslocated at that park and certain assets related thereto) for acash purchase price of $144.3 million. In a separate trans-action on the same date, we sold all of the stock of WalibiS.A., our wholly-owned subsidiary that indirectly ownedthe seven parks we owned in Europe. The purchase pricewas approximately $200.0 million, of which Euro 10.0 mil-lion ($12.1 million as of April 8, 2004) was received in theform of a nine and one half year note from the buyer and$11.6 million represented the assumption of certain debtby the buyer, with the balance paid in cash. During Feb-ruary 2006, the note was repurchased by the buyer for$12.0 million. Net cash proceeds from these transactionswere used to pay down debt and to make investments inour remaining parks. See Note 6.
Pursuant to Statement of Financial Accounting Standards (“SFAS”) No. 144, “Accounting for the Impairment orDisposal of Long-Lived Assets,” our consolidated financial statements have been reclassified for all relevant periodspresented to reflect the operations, assets and liabilities of the parks sold in 2004 and 2006 as discontinued operationsand for all periods presented to reflect the operations of the Sale Parks as discontinued operations on the December 31,2006 and December 31, 2005 consolidated balance sheets as follows:
December 31,2006
December 31,2005
(In thousands)
Current assets . . . . . . . . . . . . . . . . . . . . . . . . . . . . . . . . . . . . . . . . . . . . . . . . $ 6,718 $ 7,764Property, plant and equipment, net . . . . . . . . . . . . . . . . . . . . . . . . . . . . . . . . . 205,836 274,002Intangible assets . . . . . . . . . . . . . . . . . . . . . . . . . . . . . . . . . . . . . . . . . . . . . . . 67,157 177,687Other assets . . . . . . . . . . . . . . . . . . . . . . . . . . . . . . . . . . . . . . . . . . . . . . . . . . 1,599 1,678
Total assets held for sale . . . . . . . . . . . . . . . . . . . . . . . . . . . . . . . . . . . . . . . . $281,310 $461,131
Current liabilities . . . . . . . . . . . . . . . . . . . . . . . . . . . . . . . . . . . . . . . . . . . . . . . $ 1,970 $ 2,132Other liabilities . . . . . . . . . . . . . . . . . . . . . . . . . . . . . . . . . . . . . . . . . . . . . . . . 4,160 —
Total liabilities from discontinued operations. . . . . . . . . . . . . . . . . . . . . . . . . $ 6,130 $ 2,132
56

The following are components of the net results of discontinued operations, including the Sale Parks, for the yearsended December 31, 2006, 2005 and 2004.
2006 2005 2004Years Ended December 31,
(In thousands)
Operating revenue . . . . . . . . . . . . . . . . . . . . . . . . . . . . . . . $ 122,840 $174,182 $ 161,393
Gain (loss) on sale of discontinued operations . . . . . . . . . . 968 — (310,281)Income (loss) from discontinued operations before income
taxes . . . . . . . . . . . . . . . . . . . . . . . . . . . . . . . . . . . . . . . . 13,809 18,350 (27,483)Impairment on assets held for sale . . . . . . . . . . . . . . . . . . . (112,382) (20,423) —Income tax benefit . . . . . . . . . . . . . . . . . . . . . . . . . . . . . . . — — 49,845
Net results of discontinued operations. . . . . . . . . . . . . . . . . $ (97,605) $ (2,073) $(287,919)
Our long-term debt is at the consolidated level and is notreflected at each individual park. Thus, we have not allo-cated a portion of interest expense to the discontinuedoperations.
During November 2004 we agreed with the owner of thepark we managed in Madrid, Spain to terminate the man-agement agreement and to transfer our 5% investment inthe equity of the park for nominal consideration. By virtue
of the foregoing, we recognized losses of approximately$15,000,000, representing the carrying amount of ourinvestment in the park, certain intangible assets relatedto non-compete agreements and licenses, and othercosts. These losses were recorded in other income(expense) in the accompanying 2004 consolidated state-ment of operations.
(3) Property and Equipment
Property and equipment, at cost, are classified as follows:
2006 2005December 31,
Land . . . . . . . . . . . . . . . . . . . . . . . . . . . . . . . . . . . . . . . . . . . $ 122,959,000 $ 122,957,000Land improvements . . . . . . . . . . . . . . . . . . . . . . . . . . . . . . . . 355,848,000 336,027,000Buildings and improvements . . . . . . . . . . . . . . . . . . . . . . . . . 425,059,000 420,200,000Rides and attractions. . . . . . . . . . . . . . . . . . . . . . . . . . . . . . . 1,376,188,000 1,334,307,000Equipment . . . . . . . . . . . . . . . . . . . . . . . . . . . . . . . . . . . . . . . 284,055,000 290,786,000
Total . . . . . . . . . . . . . . . . . . . . . . . . . . . . . . . . . . . . . . . . . . . 2,564,109,000 2,504,277,000Less accumulated depreciation . . . . . . . . . . . . . . . . . . . . . . . 902,476,000 800,930,000
$1,661,633,000 $1,703,347,000
(4) Minority Interest, Partnership and JointVentures
Minority interest represents the third parties’ share of theassets of the four parks that are less than wholly-owned,Six Flags Over Texas, Six Flags Over Georgia (includingSix Flags White Water Atlanta which is owned by thepartnership that owns Six Flags Over Georgia) and SixFlags Discovery Kingdom (formerly Six Flags MarineWorld). Minority interest in earnings shown is reducedby depreciation and other non-operating expenses of$4,880,000, $4,880,000 and $5,356,000, respectively,for the years ended December 31, 2006, 2005 and 2004.
In April 1997, we became manager of Six Flags Discov-ery Kingdom (formerly Six Flags Marine World), then amarine and exotic wildlife park located in Vallejo, Califor-nia, pursuant to a contract with an agency of the City of
Vallejo under which we are entitled to receive an annualbase management fee of $250,000 and up to $250,000annually in additional management fees based on parkrevenues. In November 1997, we exercised our option tolease approximately 40 acres of land within the site fornominal rent and an initial term of 55 years (plus four ten-year and one four-year renewal options). We have addedtheme park rides and attractions on the leased land, whichis located within the existing park, in order to create onefully-integrated regional theme park at the site. We areentitled to receive, in addition to the management fee, 80%of the cash flow generated by the combined operations atthe park, after combined operating expenses and debtservice on outstanding third party debt obligations relatingto the park. We also have an option through February 2010to purchase the entire site at a purchase price equal to thegreater of the then principal amount of the debt obligations
57

of the seller (expected to aggregate $52,000,000) or thethen fair market value of the seller’s interest in the park(based on a formula relating to the seller’s 20% share ofSix Flags Discovery Kingdom’s cash flow).
We have accounted for our interest in the HWP Devel-opment, LLC joint venture under the equity method andhave included our investment of $1,886,000 and$2,791,000 as of December 31, 2006 and 2005, respec-tively, in deposits and other assets in the accompanyingconsolidated balance sheets.
See Note 12 for a description of the partnership arrange-ments applicable to Six Flags Over Texas and Six FlagsOver Georgia.
(5) Derivative Financial Instruments
In February 2000, we entered into three interest rateswap agreements that effectively converted $600,000,000of the term loan component of the Credit Facility (seeNote 6(a)) into a fixed rate obligation. The terms of theagreements, as subsequently extended, each of whichhad a notional amount of $200,000,000, began in March2000 and expired from March 2005 to June 2005. Our termloan borrowings bear interest based upon LIBOR plus afixed margin. Under our interest rate swap arrangements,our interest rates ranged from 4.565% to 6.00% (with anaverage of 5.51%).
The Partnership Parks were also party to interest rateswap agreements with respect to an aggregate of$3,000,000 of indebtedness at December 31, 2005. Theseinterest rate swap agreements expired in November 2006.
During 2006, 2005 and 2004, there were no gains orlosses reclassified into operations as a result of the
discontinuance of hedge accounting treatment for any ofour derivatives.
By using derivative instruments to hedge exposures tochanges in interest rates, we are exposed to credit risk andmarket risk. Credit risk is the failure of the counterparty toperform under the terms of the derivative contract. Tomitigate this risk, the hedging instruments are placed withcounterparties that we believe are minimal credit risks.
Market risk is the adverse effect on the value of afinancial instrument that results from a change in interestrates, commodity prices, or currency exchange rates. Themarket risk associated with interest rate swap agreementsis managed by establishing and monitoring parametersthat limit the types and degree of market risk that may beundertaken.
We do not hold or issue derivative instruments for trad-ing purposes. Changes in the fair value of derivatives thatare designated as hedges are reported on the consoli-dated balance sheet in “Accumulated other comprehen-sive income (loss)” (AOCL). These amounts arereclassified to interest expense when the forecasted trans-action takes place.
The critical terms, such as the index, settlement dates,and notional amounts, of the derivative instruments weresubstantially the same as the provisions of our hedgedborrowings under the Credit Facility. As a result, no mate-rial ineffectiveness of the cash-flow hedges was recordedin the consolidated statements of operations.
As of December 31, 2006, there are no deferred losseson derivative instruments accumulated in AOCL as allderivatives have expired.
(6) Long-Term Debt
At December 31, 2006 and 2005, long-term debt consists of:2006 2005
Long-term debt:Credit Facility(a) . . . . . . . . . . . . . . . . . . . . . . . . . . . . . . . . . . . . . . . . . $ 743,625,000 $ 745,175,00087⁄8% Senior Notes due 2010(b). . . . . . . . . . . . . . . . . . . . . . . . . . . . . . 300,300,000 300,300,00093⁄4% Senior Notes due 2013(c) . . . . . . . . . . . . . . . . . . . . . . . . . . . . . . 388,000,000 388,000,00095⁄8% Senior Notes due 2014(d). . . . . . . . . . . . . . . . . . . . . . . . . . . . . . 503,650,000 503,650,00041⁄2% Convertible Senior Notes due 2015(e) . . . . . . . . . . . . . . . . . . . . 299,000,000 299,000,000Other . . . . . . . . . . . . . . . . . . . . . . . . . . . . . . . . . . . . . . . . . . . . . . . . . 7,552,000 7,649,000Net discounts . . . . . . . . . . . . . . . . . . . . . . . . . . . . . . . . . . . . . . . . . . . (1,180,000) (1,417,000)
2,240,947,000 2,242,357,000Less current and called portions . . . . . . . . . . . . . . . . . . . . . . . . . . . . . 114,059,000 113,601,000
$2,126,888,000 $2,128,756,000
(a) The Credit Facility includes a $300,000,000 five-yearrevolving credit facility ($105,000,000 and
$100,000,000 of which was outstanding atDecember 31, 2006 and 2005, respectively), an
58
$82,500,000 multicurrency facility (none of which wasoutstanding at December 31, 2006 or 2005 (excludingletters of credit in the amounts of $33,147,000 and$28,194,000 on those dates) and a $655,000,000 six-year term loan ($638,625,000 of which wasoutstanding as of December 31, 2006 and$645,175,000 of which was outstanding as ofDecember 31, 2005). The interest rate onborrowings under the Credit Facility can be fixed forperiods ranging from one to six months. At our optionthe interest rate is based upon specified levels inexcess of the applicable base rate or LIBOR. AtDecember 31, 2006, the weighted average interestrates for borrowings under the term loan and the USrevolver were 8.62% and 8.61%, respectively. AtDecember 31, 2005, the weighted average interestrate for borrowings under the term loan and the USrevolver were 6.67% and 6.62%, respectively. Theworking capital revolver and the multicurrency facilitypermit optional prepayments and reborrowings andterminate on June 30, 2008. The term loan facilityrequires quarterly repayments of 0.25% of theoutstanding amount thereof commencing onSeptember 30, 2004 and 24.0% commencing onSeptember 30, 2008. The term loan matures onJune 30, 2009, provided however, that the maturityof the term loan will be shortened to December 31,2008, if prior to such date, our outstanding preferredstock is not redeemed or converted into commonstock. A commitment fee of 0.50% of the unusedcredit of the facility is due quarterly in arrears. Theprincipal borrower under the facility is Six Flags ThemeParks, Inc., a direct wholly owned subsidiary of SixFlags Operations, Inc., our principal direct subsidiary,and borrowings under the Credit Facility areguaranteed by Holdings, Six Flags Operations andall of Six Flags Operations’ domestic subsidiariesand are secured by substantially all of Six FlagsOperations’ domestic assets and a pledge of SixFlags Operations capital stock.
On January 14, 2004, we completed a $130,000,000increase of the term loan portion of the Credit Facilityand used all of the proceeds of the additional loan toredeem the remaining balance of our 93⁄4% SeniorNotes due 2007 then outstanding. In March 2004,we amended the term loan in order to permit thesales of the discontinued operations. In April 2004,we permanently repaid $75,000,000 of the term loanfrom a portion of the proceeds of the sale of thediscontinued operations and recognized a grossloss of $1,216,000 for the write off of debt issuancecosts.
On April 22, 2005 we amended the Credit Facility topermit our Canadian subsidiary that owns ourMontreal park to incur up to CAD$35.0 million ofsecured debt to finance improvements at that park
and to increase from $25.0 million to $40.0 million theletter of credit capacity under the Credit Facility. Nosuch secured debt has been incurred to date.
On April 21, 2006, we entered into an amendment tothe Credit Facility to (i) reduce by 0.25% the interestrate on the term loan, (ii) to eliminate amortization onthe multicurrency facility and the provision of theworking capital revolver that required the facility tobe repaid in full for 30 consecutive days each year,(iii) permit us to borrow up to an additional$300.0 million in term loans under the Credit Facilityand (iv) permit us to make asset dispositions of up to$300.0 million without seeking lender approval. Theproceeds of any transaction referred to in clauses (iii)and (iv) above may be used to refinance Holdings’public debt, redeem its PIERS, make requiredpayments to our partners at the Partnership Parksand, in the case of asset dispositions, spend up to$100.0 million to acquire, restore or construct assets.
On July 28, 2006, we entered into an amendment tothe Credit Agreement to (i) waive Six FlagsOperations’ compliance with the financial covenantsin the Credit Agreement for the period ending June 30,2006, (ii) relax the covenants relating to leverage,interest coverage and debt service coverage thoughthe end of 2007 and eliminate the covenant relating tofixed charge coverage through 2007, (iii) permit thedisposition of Six Flags Darien Lake, Waterworld(Concord), Six Flags Elitch Gardens, Splashtown,Six Flags Magic Mountain and Hurricane Harbor,Wild Waves and Enchanted Village, Frontier Cityand White Water Bay, provided that we must offer tomake mandatory prepayments to our term loanlenders with the net cash proceeds of suchdispositions and, in certain cases, make optionalprepayments with such proceeds, and (iv) adjust themargin used to calculate the interest rate onborrowings under the Credit Agreement based onour debt rating and leverage ratio.
In addition to the specified financial ratios and testsnoted above, the Credit Facility contains restrictivecovenants that, among other things, limit the abilityof Six Flags Operations and its subsidiaries to disposeof assets; incur additional indebtedness or liens;repurchase stock; make investments; engage inmergers or consolidations; pay dividends (exceptthat (i) dividends of up to $75,000,000 in theaggregate (of which $8,900,000 had beendividended prior to December 31, 2006) may bemade from cash from operations in order to enableus to pay amounts in respect of any refinancing or
59
repayment of Holdings’ senior notes and (ii) subject tocovenant compliance, dividends will be permitted toallow Holdings to meet cash interest obligations withrespect to its Senior Notes, cash dividend paymentson our PIERS and our obligations to the limitedpartners in the Partnership Parks and engage incertain transactions with subsidiaries and affiliates.
(b) On February 11, 2002, Holdings issued $480,000,000principal amount of 87⁄8% Senior Notes due 2010 (the2010 Senior Notes). As of December 31, 2004, we hadrepurchased $179.7 million of the 2010 Senior Notesfrom a portion of the proceeds of the sale of the 2004discontinued operations (see Note 2) and a portion ofthe proceeds of the November 2004 offering of ourConvertible Notes (see Note 6(e)). A gross loss of$4,599,000 due to the repurchase of the 2010 Noteswas recognized in 2004. The 2010 Senior Notes aresenior unsecured obligations of Holdings, are notguaranteed by subsidiaries and rank equal to theother Senior Notes of Holdings. The 2010 SeniorNotes require annual interest payments ofapproximately $26,652,000 (87⁄8% per annum) and,except in the event of a change in control ofHoldings and certain other circumstances, do notrequire any principal payments prior to their maturityin 2010. The 2010 Senior Notes are redeemable, atHolding’s option, in whole or in part, at any time on orafter February 1, 2006, at varying redemption pricesbeginning at 104.438% and reducing annually untilmaturity. The indenture under which the 2010 SeniorNotes were issued contains covenants substantiallysimilar to those relating to the other Senior Notes ofHoldings.
The indenture under which the 2010 Senior Noteswere issued limits our ability to dispose of assets;incur additional indebtedness or liens; paydividends; engage in mergers or consolidations; andengage in certain transactions with affiliates.
(c) On April 16, 2003, Holdings issued $430,000,000principal amount of 93⁄4% Senior Notes due 2013(the 2013 Senior Notes). As of December 31, 2004we had repurchased $42,000,000 principal amount ofthe 2013 Senior Notes. A gross loss of $1,979,000 dueto this repurchase was recognized in 2004. The 2013Senior Notes are senior unsecured obligations ofHoldings, are not guaranteed by subsidiaries andrank equal to the other Holdings Senior Notes. The2013 Senior Notes require annual interest payments ofapproximately $37,830,000 (93⁄4% per annum) and,except in the event of a change in control Holdingsand certain other circumstances, do not require anyprincipal payments prior to their maturity in 2013. The2013 Senior Notes are redeemable, at Holdings’option, in whole or in part, at any time on or afterApril 15, 2008, at varying redemption prices beginning
at 104.875% and reducing annually until maturity. Theindenture under which the 2013 Senior Notes wereissued contains covenants substantially similar tothose relating to the other Holdings Senior Notes. Allof the net proceeds of the 2013 Senior Notes wereused to fund the tender offer and redemption of othersenior notes.
(d) On December 5, 2003, Holdings issued $325,000,000principal amount of the 95⁄8% Senior Notes due 2014(the 2014 Senior Notes). As of December 31, 2004, wehad repurchased $16,350,000 principal amount of the2014 Senior Notes. A gross loss of $837,000 due tothis repurchase was recognized in 2004. In January2005, we issued an additional $195,000,000 of 2014Senior Notes, the proceeds of which were used to fundthe redemption of $181,155,000 principal amount ofother senior notes of Holdings. The 2014 Senior Notesare senior unsecured obligations of Holdings, are notguaranteed by subsidiaries and rank equal to the otherHoldings Senior Notes. The 2014 Senior Notes,including the January additional amount, requireannual interest payments of approximately$48,396,000 (95⁄8% per annum) and, except in theevent of a change in control of Holdings and certainother circumstances, do not require any principalpayments prior to their maturity in 2014. The 2014Senior Notes are redeemable, at Holdings’ option, inwhole or in part, at any time on or after June 1, 2009, atvarying redemption prices beginning at 104.813% andreducing annually until maturity. The indenture underwhich the 2014 Senior Notes were issued containscovenants substantially similar to those relating to theother Holdings Senior Notes. All of the net proceeds ofthe original issuance of 2014 Senior Notes, togetherwith proceeds of term loan borrowings under theCredit Facility, were used to redeem in full othersenior notes of Holdings. A gross loss of$25,178,000 was recognized in 2004 on thisredemption.
(e) On November 19, 2004, Holdings issued$299,000,000 principal amount of Convertible Notes.The Convertible Notes are senior unsecuredobligations of Holdings, are not guaranteed bysubsidiaries and rank equal to the other HoldingsSenior Notes. Except during specified non-convertibility periods, the Convertible Notes areconvertible into our common stock at an initialconversion rate of 157.4803 shares of commonstock for each $1,000 principal amount ofConvertible Notes, subject to adjustment,representing an initial conversion price of $6.35 pershare. Upon conversion of the notes, we have the
60

option to deliver common stock, cash or a combinationof cash and common stock. The Convertible Notesrequire annual interest payments of approximately$13,455,000 (41⁄2% per annum) and, except in theevent of a change in control of Holdings and certainother circumstances, do not require any principalpayments prior to their maturity in 2015. TheConvertible Notes are redeemable, at Holdings’option, in whole or in part, at any time after May 15,2010 at varying redemption prices beginning at102.143% and reducing annually until maturity. Thenet proceeds of the Convertible Notes were used torepurchase a portion of the 2010 Senior Notes (seeNote 6 (b)) and to repurchase and redeem other seniornotes of Holdings. A gross loss of $3,922,000 wasrecognized in 2004 due to the redemption of the seniornotes with a portion of the proceeds from the sale ofthe 2004 discontinued operations (See Note 2). Agross loss of $19,303,000 was recognized due tothe redemption in 2005 of the other senior noteswith a portion of the proceeds from the ConvertibleNotes and the 2014 Senior Notes.
Annual maturities of long-term debt during the five yearssubsequent to December 31, 2006, are as follows (doesnot assume acceleration of maturity of the term loanportion of our credit facility (See Note 6(a)):
2007 . . . . . . . . . . . . . . . . . . . $ 114,059,0002008 . . . . . . . . . . . . . . . . . . . 318,919,0002009 . . . . . . . . . . . . . . . . . . . 315,743,0002010 . . . . . . . . . . . . . . . . . . . 301,338,0002011 . . . . . . . . . . . . . . . . . . . 859,000Thereafter . . . . . . . . . . . . . . . 1,190,029,000
$2,240,947,000
The Credit Facility restricts the ability of Six Flags Oper-ations to distribute assets to Holdings, and the indenturesrelating to Holdings’ Senior Notes restrict the ability ofHoldings to distribute assets to its stockholders. The CreditFacility restricts distributions by Six Flags Operations (i) upto $75,000,000 in the aggregate from cash from operationsand (ii) to amounts required to pay interest on Holdings’Senior Notes, dividends on Holdings’ outstanding pre-ferred stock, required payments under the agreementsrelating to the Partnership Parks and certain tax andshared services arrangements.
(7) Fair Value of Financial Instruments
The following table and accompanying information present the carrying amounts and estimated fair values of ourfinancial instruments at December 31, 2006 and 2005. The fair value of a financial instrument is the amount at which theinstrument could be exchanged in a current transaction between willing parties.
Carrying Amount Fair value Carrying Amount Fair Value2006 2005
Financial assets (liabilities):Restricted-use investment securities . . . . . . $ 11,091,000 $ 11,091,000 $ — $ —Long-term debt (including current portion) . . (2,240,947,000) (2,179,406,000) (2,242,357,000) (2,312,703,000)Interest rate swap agreements (included in
other long-term liabilities) . . . . . . . . . . . . — — (5,000) (5,000)PIERS . . . . . . . . . . . . . . . . . . . . . . . . . . . (284,497,000) (256,450,000) (283,371,000) (265,880,000)
The carrying amounts shown in the table are included in the consolidated balance sheets under the indicated captions.
The following methods and assumptions were used to estimate the fair value of each class of financial instruments:
• The carrying values of cash and cash equivalents, accounts receivable, notes receivable, accounts payable, andaccrued liabilities approximate fair value because of the short maturity of these instruments.
• Restricted-use investment securities: The fair values of debt securities are based on quoted market prices at thereporting date for those or similar investments.
• Long-term debt: The fair value of our long-term debt is estimated by discounting the future cash flows of eachinstrument at rates currently offered to us for similar debt instruments of comparable maturities by our investmentbankers or based upon quoted market prices.
• Derivative financial instruments: The fair value of our derivative financial instruments is determined by thecounterparty financial institution.
• PIERS: The fair value of our mandatorily redeemable preferred stock is based upon quoted market prices.
61

(8) Income Taxes
Income tax expense (benefit) allocated to continuingoperations for 2006, 2005 and 2004 consists of thefollowing:
Current Deferred Total2006:
U.S. federal . . . . . $ — $ — $ —Foreign . . . . . . . . 3,094,000 (507,000) 2,587,000State and local . . 1,731,000 — 1,731,000
$4,825,000 $ (507,000) $ 4,318,000
2005:U.S. federal . . . . . $ — $ — $ —Foreign . . . . . . . . 2,850,000 (76,000) 2,774,000State and local . . 951,000 (20,000) 931,000
$3,801,000 $ (96,000) $ 3,705,000
2004:U.S. federal . . . . . $ — $16,914,000 $16,914,000Foreign . . . . . . . . 3,981,000 984,000 4,965,000State and local . . 1,223,000 1,340,000 2,563,000
$5,204,000 $19,238,000 $24,442,000
Recorded income tax expense (benefit) allocated tocontinuing operations differed from amounts computedby applying the U.S. federal income tax rate of 35% in2006, 2005 and 2004 to loss before income taxes asfollows:
2006 2005 2004Computed
“expected”federal incometax benefit . . . . . $(70,930,000) $(36,806,000) $(53,357,000)
Change invaluationallowance . . . . . 55,245,000 38,570,000 84,986,000
Effect of change inAPB 23 deferredtaxes onunremittedforeignearnings . . . . . . 21,852,000 — —
Effect of state andlocal incometaxes, net offederal taxbenefit . . . . . . . (7,393,000) (4,497,000) (6,082,000)
Nondeductiblecompensation . . 3,515,000 4,201,000 225,000
Effect of foreignincome taxes . . . 1,884,000 2,020,000 (1,633,000)
Other, net . . . . . . . 145,000 217,000 303,000
$ 4,318,000 $ 3,705,000 $ 24,442,000
The change in valuation allowance attributable to con-tinuing operations, discontinued operations and othercomprehensive loss and equity is presented below:
2006 2005 2004Continuing
operations . . . . $55,245,000 $38,570,000 $ 84,986,000Discontinued
operations . . . . 33,019,000 10,495,000 59,932,000Changes in other
comprehensiveloss andequity . . . . . . . 3,397,000 2,767,000 8,466,000
$91,661,000 $51,832,000 $153,384,000
Substantially all of our future taxable temporary differ-ences (deferred tax liabilities) relate to the different finan-cial accounting and tax depreciation methods and periodsfor property and equipment (20 to 25 years for financialreporting purposes and 7 to 12 years for tax reportingpurposes). Our net operating and capital loss carryfor-wards, alternative minimum tax credits, accrued insuranceexpenses, and deferred compensation amounts representfuture income tax benefits (deferred tax assets). The taxeffects of these temporary differences as of December 31,2006, 2005 and 2004 are presented below:
2006 2005 2004Deferred tax
assets beforevaluationallowance. . . $915,637,000 $829,318,000 $781,058,000
Less valuationallowance. . . 459,306,000 367,645,000 315,813,000
Net deferredtax assets . . 456,331,000 461,673,000 465,245,000
Deferred taxliabilities . . . . 470,115,000 476,018,000 479,736,000
Net deferredtax liability . . $ 13,784,000 $ 14,345,000 $ 14,491,000
2006 2005 2004Deferred tax assets:
Federal netoperating losscarryforwards . . $558,315,000 $524,798,000 $498,161,000
State netoperating losscarryforwards . . 195,500,000 182,808,000 164,126,000
Capital losscarryforward . . . 101,541,000 101,541,000 101,541,000
Alternativeminimum taxcredits . . . . . . . 6,591,000 6,591,000 6,591,000
Accrued insuranceand other . . . . . 53,690,000 13,580,000 10,639,000
915,637,000 829,318,000 781,058,000
Deferred taxliabilities:Property and
equipment . . . . $466,071,000 $472,956,000 $476,656,000Intangible assets
and other . . . . . 4,044,000 3,062,000 3,080,000
$470,115,000 $476,018,000 $479,736,000
62

As of December 31, 2006, we have approximately$1,743,272,000 of net operating loss carryforwards avail-able for U.S. federal income tax purposes which expirethrough 2026 and net operating loss carryforwards avail-able for state income tax purposes which aggregate toapproximately $4,152,349,000 and expire through 2026.We have recorded a valuation allowance of $459,306,000,$367,645,000 and $315,813,000 as of December 31,2006, 2005 and 2004, respectively, due to uncertaintiesrelated to our ability to utilize some of our deferred taxassets before they expire. The valuation allowance isbased on our estimates of taxable income, primarily con-sisting of the reversal of deferred tax liabilities and to someextent tax planning strategies, by jurisdiction in which weoperate and the period over which our deferred tax assetswill be recoverable. At December 31, 2006, we hadapproximately $6,591,000 of alternative minimum taxcredits which have no expiration date and approximately$290,000,000 of capital loss carryforwards which expire in2009.
(9) Preferred Stock, Common Stock and OtherStockholders’ Equity
(a) Preferred Stock
We have authorized 5,000,000 shares of preferredstock, $1.00 par value per share. All shares of preferredstock rank senior and prior in right to all of our now orhereafter issued common stock with respect to dividendpayments and distribution of assets upon our liquidation ordissolution.
PIERS
In January 2001, we issued 11,500,000 PIERS, forproceeds of $277,834,000, net of the underwriting dis-count and offering expenses of $9,666,000. Each PIERSrepresents one one-hundredth of a share of our 71⁄4%mandatorily redeemable preferred stock (an aggregateof 115,000 shares of preferred stock). The PIERS accruecumulative dividends (payable, at our option, in cash orshares of common stock) at 71⁄4% per annum (approxi-mately $20,844,000 per annum). Holders can voluntarilyconvert the PIERS into shares of common stock at anytime prior to August 15, 2009.
Prior to August 15, 2009, each of the PIERS is convert-ible at the option of the holder into 1.1990 common shares(equivalent to a conversion price of $20.85 per common
share), subject to adjustment in certain circumstances (theConversion Price). At any time on or after February 15,2004 and at the then applicable conversion rate, we maycause the PIERS, in whole or in part, to be automaticallyconverted if for 20 trading days within any period of 30 con-secutive trading days, including the last day of such period,the closing price of our common stock exceeds 120% ofthe then prevailing Conversion Price. On August 15, 2009,the PIERS are mandatorily redeemable in cash equal to100% of the liquidation preference (initially $25.00 perPIERS), plus any accrued and unpaid dividends.
(b) Share Rights Plan
On December 10, 1997, our board of directors autho-rized a share rights plan. The plan was subsequentlyamended on February 4, 1998, May 18, 2004 andamended and restated as of September 14, 2004. Underthe plan, stockholders have one right for each share ofcommon stock held. The rights become exercisable tenbusiness days after (a) an announcement that a person orgroup of affiliated or associated persons has acquiredbeneficial ownership of 15% or more of our voting sharesoutstanding, or (b) the commencement or announcementof a person’s or group’s intention to commence a tender orexchange offer that could result in a person or groupowning 15% or more of the voting shares outstanding.
Each right entitles our holder (except a holder who is theacquiring person) to purchase 1/1000 of a share of a juniorparticipating series of preferred stock designated to haveeconomic and voting terms similar to those of one share ofcommon stock for $250.00, subject to adjustment. In theevent of certain merger or asset sale transactions withanother party or transactions which would increase theequity ownership of a stockholder who then owned 15% ormore of the voting shares of Six Flags, each right will entitleour holder to purchase securities of the merging or acquir-ing party with a value equal to twice the exercise price ofthe right.
The rights, which have no voting power, expire in 2008.The rights may be redeemed by us for $.01 per right untilthe rights become exercisable.
(c) Charter Amendment
On June 29, 2005, we amended our Certificate of Incor-poration to increase the authorized shares of our CommonStock from 150,000,000 to 210,000,000.
63

(d) Accumulated Other Comprehensive Income (Loss)
The accumulated balances for each classification of comprehensive income (loss) are as follows:
Foreigncurrency
itemsCash flow
Hedges
Additionalminimumliability on
benefit plan
Accumulatedother
comprehensiveincome (loss)
Balance, December 31, 2003. . . . . . . . . . . $ 54,735,000 $(6,799,000) $(13,269,000) $ 34,667,000Net current period change . . . . . . . . . . . . . (55,612,000) (2,942,000) (877,000) (59,431,000)Reclassification adjustments for losses
reclassified into operations . . . . . . . . . . . — 9,580,000 — 9,580,000
Balance at December 31, 2004 . . . . . . . . . (877,000) (161,000) (14,146,000) (15,184,000)Net current period change . . . . . . . . . . . . . 5,306,000 (1,012,000) (7,282,000) (2,988,000)Reclassification adjustments for losses
reclassified into operations . . . . . . . . . . . — 1,167,000 — 1,167,000
Balance at December 31, 2005 . . . . . . . . . 4,429,000 (6,000) (21,428,000) (17,005,000)Net current period change . . . . . . . . . . . . . (490,000) 6,000 11,572,000 11,088,000Adjustment to initially apply FASB Stmt
No. 158 . . . . . . . . . . . . . . . . . . . . . . . . . — — (4,034,000) (4,034,000)
Balance, December 31, 2006. . . . . . . . . . . $ 3,939,000 $ — $(13,890,000) $ (9,951,000)
(10) Pension Benefits
As part of the acquisition of the former Six Flags, weassumed the obligations related to the SFTP DefinedBenefit Plan (the Plan). The Plan covered substantiallyall of SFTP’s employees. During 1999 the Plan wasamended to cover substantially all of our domestic full-time employees. During 2004, the Plan was furtheramended to cover certain seasonal workers, retroactiveto January 1, 2003. The Plan permits normal retirement atage 65, with early retirement at ages 55 through 64 uponattainment of ten years of credited service. The earlyretirement benefit is reduced for benefits commencingbefore age 62. Plan benefits are calculated according toa benefit formula based on age, average compensationover the highest consecutive five-year period during theemployee’s last ten years of employment and years ofservice. Plan assets are invested primarily in commonstock and mutual funds. The Plan does not have significantliabilities other than benefit obligations. Under our fundingpolicy, contributions to the Plan are determined using theprojected unit credit cost method. This funding policymeets the requirements under the Employee RetirementIncome Security Act of 1974.
We “froze” our pension plan effective March 31, 2006,pursuant to which participants will no longer continue toearn future pension benefits. A curtailment loss of$3,125,000 was recorded during the first quarter of 2006.
Benefit Obligations and Plan Assets
Beginning with the Company’s December 31, 2006 con-solidated balance sheet, Statement of Financial Account-ing Standards No. 158, “Employer’s Accounting forDefined Benefit Pension and Other Postretirement
Plans — an amendment of FASB Statements No, 87,88, 106 and 132(R)”, requires the Company to recognizeon its consolidated balance sheet the funded status of itsdefined benefit plan. The funded status is measured as thedifference between the projected benefit obligation and thefair value of plan assets. The following table presents theincremental effect on the Company’s December 31, 2006balance sheet as a result of adopting this recognitionrequirement from Statement No. 158:
BeforeAdjustment
AdoptionAdjustment
AfterAdjustment
Intangibleasset . . . . . . $ 165,000 $ (165,000) $ —
Total assets . . . 3,187,781,000 (165,000) 3,187,616,000Pension liability
included inother long-termliabilities . . . . 22,148,000 3,869,000 26,017,000
Total liabilities . . 2,523,110,000 3,869,000 2,526,979,000Additional
minimumliabilityincluded inaccumulatedothercomprehen-sive loss . . . . (9,856,000) (4,034,000) (13,890,000)
Totalstockholders’equity . . . . . . 380,174,000 (4,034,000) 376,140,000
Total liabilitiesandstockholders’equity . . . . . . $3,187,781,000 $ (165,000) $3,187,616,000
64

Change in benefit obligation
2006 2005Benefit obligation,
January 1 . . . . . . . . . $177,603,000 $151,802,000Service cost . . . . . . . . . 2,290,000 6,104,000Interest cost . . . . . . . . . 8,968,000 9,216,000Actuarial loss (gain) . . . (2,022,000) 13,565,000Benefits paid . . . . . . . . (3,799,000) (3,084,000)Curtailments . . . . . . . . (26,067,000) —
Benefit obligation,December 31 . . . . . . $156,973,000 $177,603,000
The accumulated benefit obligation for the U.S. pensionplans at the end of 2006 and 2005 was $153,105,000 and$153,527,000, respectively.
We use a measurement date of December 31 for ourpension plan.
Weighted average assumptions used to determinebenefit obligations, December 31
2006 2005
Discount rate . . . . . . . . . . . . . . . . . 5.875% 5.750%Rate of compensation increase . . . . 4.000% 4.000%
Change in Plan assets
2006 2005
Fair value of planassets,January 1 . . . . . . $115,727,000 $101,956,000
Actual return onplan assets . . . . . 12,412,000 7,423,000
Employercontribution . . . . . 6,616,000 9,432,000
Benefits paid . . . . . . (3,799,000) (3,084,000)
Fair value of planassets,December 31 . . . . $130,956,000 $115,727,000
Employer contributions and benefits paid in the abovetable include only those amounts contributed directly to, orpaid directly from, plan assets.
The asset allocation for the Six Flags pension plan at theend of 2006 and 2005, and the target allocation for 2007,by asset category, follows. The fair value of plan assets forthese plans is $130,956,000 and $115,727,000 at the end
of 2006 and 2005, respectively. The expected long termrate of return on these plan assets was 8.00% in 2006 and8.50% in 2005.
Asset category
TargetAllocation for
2007 2006 2005
Percentageof PlanAssets
at Year End,
Equity securities . . 60.0% 61.6% 61.3%Fixed Income . . . . 38.5% 37.7% 37.9%Short Term
Investments. . . . 1.5% 0.7% 0.8%Other . . . . . . . . . . 0.0% 0.0% 0.0%
Total . . . . . . . . . . 100.0% 100.0% 100.0%
Description of Investment Strategy
The Committee is responsible for managing the invest-ment of Plan assets and ensuring that the Plan’s invest-ment program is in compliance with all provisions ofERISA, other relevant legislation, related Plan documentsand the Statement of Investment Policy. The Committeehas retained several mutual funds, commingled fundsand/or investment managers to manage Plan assetsand implement the investment process. The investmentmanagers, in implementing their investment processes,have the authority and responsibility to select appropriateinvestments in the asset classes specified by the terms ofthe applicable prospectus or other investment manageragreements with the Plan.
The primary financial objective of the Plan is to secureparticipant retirement benefits. As such, the key objectivein the Plan’s financial management is to promote stabilityand, to the extent appropriate, growth in funded status.Other related and supporting financial objectives are alsoconsidered in conjunction with a comprehensive review ofcurrent and projected Plan financial requirements.
The assets of the fund are invested to achieve thegreatest reward for the Plan consistent with a prudentlevel of risk. The asset return objective is to achieve, asa minimum over time, the passively managed returnearned by market index funds, weighted in the proportionsoutlined by the asset class exposures in the Plan’s long-term target asset allocation.
65
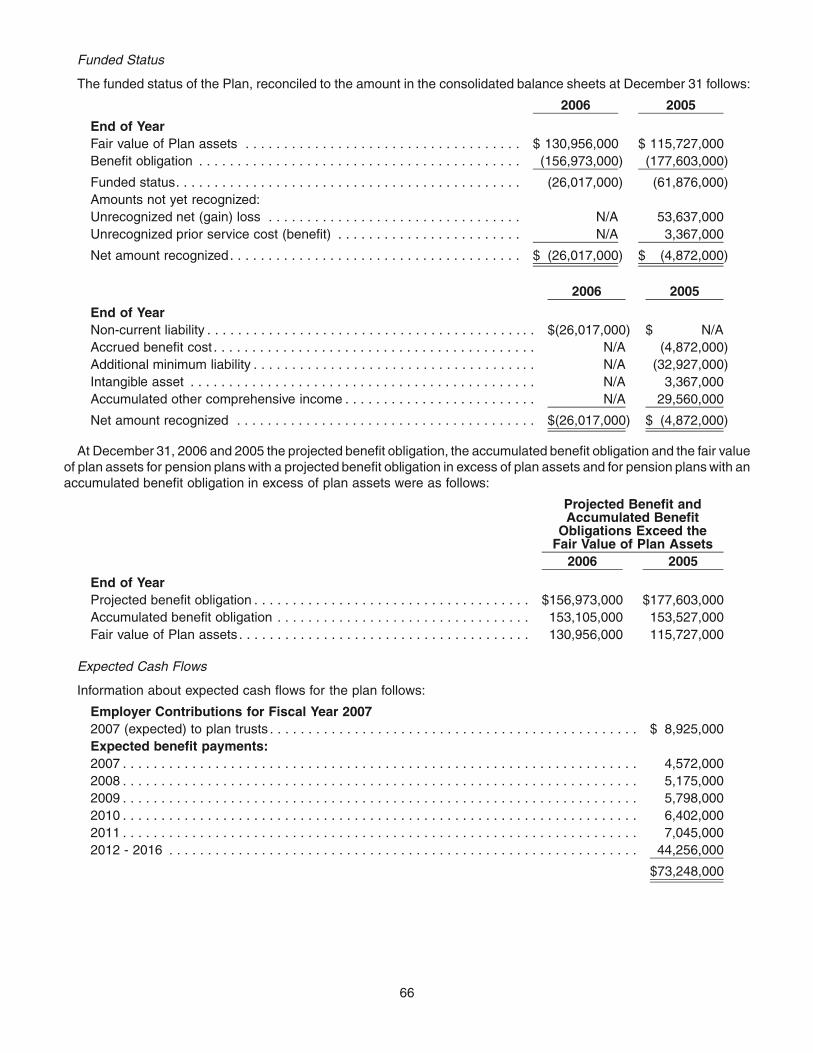
Funded Status
The funded status of the Plan, reconciled to the amount in the consolidated balance sheets at December 31 follows:
2006 2005
End of YearFair value of Plan assets . . . . . . . . . . . . . . . . . . . . . . . . . . . . . . . . . . . . $ 130,956,000 $ 115,727,000Benefit obligation . . . . . . . . . . . . . . . . . . . . . . . . . . . . . . . . . . . . . . . . . . (156,973,000) (177,603,000)
Funded status. . . . . . . . . . . . . . . . . . . . . . . . . . . . . . . . . . . . . . . . . . . . . (26,017,000) (61,876,000)Amounts not yet recognized:Unrecognized net (gain) loss . . . . . . . . . . . . . . . . . . . . . . . . . . . . . . . . . N/A 53,637,000Unrecognized prior service cost (benefit) . . . . . . . . . . . . . . . . . . . . . . . . N/A 3,367,000
Net amount recognized. . . . . . . . . . . . . . . . . . . . . . . . . . . . . . . . . . . . . . $ (26,017,000) $ (4,872,000)
2006 2005
End of YearNon-current liability . . . . . . . . . . . . . . . . . . . . . . . . . . . . . . . . . . . . . . . . . . . $(26,017,000) $ N/AAccrued benefit cost . . . . . . . . . . . . . . . . . . . . . . . . . . . . . . . . . . . . . . . . . . N/A (4,872,000)Additional minimum liability . . . . . . . . . . . . . . . . . . . . . . . . . . . . . . . . . . . . . N/A (32,927,000)Intangible asset . . . . . . . . . . . . . . . . . . . . . . . . . . . . . . . . . . . . . . . . . . . . . N/A 3,367,000Accumulated other comprehensive income . . . . . . . . . . . . . . . . . . . . . . . . . N/A 29,560,000
Net amount recognized . . . . . . . . . . . . . . . . . . . . . . . . . . . . . . . . . . . . . . . $(26,017,000) $ (4,872,000)
At December 31, 2006 and 2005 the projected benefit obligation, the accumulated benefit obligation and the fair valueof plan assets for pension plans with a projected benefit obligation in excess of plan assets and for pension plans with anaccumulated benefit obligation in excess of plan assets were as follows:
2006 2005
Projected Benefit andAccumulated Benefit
Obligations Exceed theFair Value of Plan Assets
End of YearProjected benefit obligation . . . . . . . . . . . . . . . . . . . . . . . . . . . . . . . . . . . . $156,973,000 $177,603,000Accumulated benefit obligation . . . . . . . . . . . . . . . . . . . . . . . . . . . . . . . . . 153,105,000 153,527,000Fair value of Plan assets. . . . . . . . . . . . . . . . . . . . . . . . . . . . . . . . . . . . . . 130,956,000 115,727,000
Expected Cash Flows
Information about expected cash flows for the plan follows:
Employer Contributions for Fiscal Year 20072007 (expected) to plan trusts . . . . . . . . . . . . . . . . . . . . . . . . . . . . . . . . . . . . . . . . . . . . . . . . $ 8,925,000Expected benefit payments:2007 . . . . . . . . . . . . . . . . . . . . . . . . . . . . . . . . . . . . . . . . . . . . . . . . . . . . . . . . . . . . . . . . . . . 4,572,0002008 . . . . . . . . . . . . . . . . . . . . . . . . . . . . . . . . . . . . . . . . . . . . . . . . . . . . . . . . . . . . . . . . . . . 5,175,0002009 . . . . . . . . . . . . . . . . . . . . . . . . . . . . . . . . . . . . . . . . . . . . . . . . . . . . . . . . . . . . . . . . . . . 5,798,0002010 . . . . . . . . . . . . . . . . . . . . . . . . . . . . . . . . . . . . . . . . . . . . . . . . . . . . . . . . . . . . . . . . . . . 6,402,0002011 . . . . . . . . . . . . . . . . . . . . . . . . . . . . . . . . . . . . . . . . . . . . . . . . . . . . . . . . . . . . . . . . . . . 7,045,0002012 - 2016 . . . . . . . . . . . . . . . . . . . . . . . . . . . . . . . . . . . . . . . . . . . . . . . . . . . . . . . . . . . . . 44,256,000
$73,248,000
66

Components of net periodic benefit cost
2006 2005 2004Years ended December 31,
Service cost . . . . . . . . . . . . . . . . . . . . . . . . . . . . . . . . . . . . . . $ 2,290,000 $ 6,105,000 $ 5,381,000Interest cost . . . . . . . . . . . . . . . . . . . . . . . . . . . . . . . . . . . . . . 8,968,000 9,216,000 8,318,000Expected return on plan assets . . . . . . . . . . . . . . . . . . . . . . . (9,397,000) (8,812,000) (8,071,000)Amortization of prior service cost . . . . . . . . . . . . . . . . . . . . . . 77,000 560,000 356,000Amortization of net actuarial loss . . . . . . . . . . . . . . . . . . . . . . 677,000 3,354,000 2,625,000Curtailment loss . . . . . . . . . . . . . . . . . . . . . . . . . . . . . . . . . . . 3,125,000 — —
Net periodic benefit cost. . . . . . . . . . . . . . . . . . . . . . . . . . . . . $ 5,740,000 $10,423,000 $ 8,609,000
Weighted-average assumptions used to determine net costDiscount rate . . . . . . . . . . . . . . . . . . . . . . . . . . . . . . . . . . . . . 5.750% 5.875% 6.125%Rate of compensation increase . . . . . . . . . . . . . . . . . . . . . . . 4.000% 3.750% 3.750%Expected return on plan assets . . . . . . . . . . . . . . . . . . . . . . . 8.000% 8.500% 8.750%
The discount rate assumption was developed based on high-quality corporate bond yields as of the measurementdate. High quality corporate bond yield indices on over 500 Aa graded bonds are considered when selecting the discountrate.
The return on assets assumption was developed based on consideration of historical market returns, current marketconditions, and the Plan’s past experience. Estimates of future market returns by asset category are reflective of actuallong-term historical returns.
Overall, it was projected that the Plan could achieve an 8.00% net return over time based on a consistent application ofthe existing asset allocation strategy and a continuation of the Plan’s policy of monitoring manager performance.
The estimated amounts that will be amortized from accumulated other comprehensive loss into net periodic benefitcost in 2007 are as follows:
Actuarial loss . . . . . . . . . . . . . . . . . . . . . . . . . . . . . . . . . . . . . . . . . . . . . . . . . . . . . . . . . . . . . . . $166,000Prior service cost . . . . . . . . . . . . . . . . . . . . . . . . . . . . . . . . . . . . . . . . . . . . . . . . . . . . . . . . . . . . 32,000
Total . . . . . . . . . . . . . . . . . . . . . . . . . . . . . . . . . . . . . . . . . . . . . . . . . . . . . . . . . . . . . . . . . . . . . $198,000
Additional Information
2006 2005Pension Benefits
Change in minimum liability included in other comprehensive income . . . . . . . $(7,538,000) $7,282,000
At December 31, 2006, the Plan’s projected benefitobligation exceeded the fair value of Plan assets resultingin the Plan being underfunded by $26,017,000 which werecognized as an other long-term liability in the accompa-nying consolidated balance sheet. As of December 31,2006, we have recorded in other comprehensive loss$13,890,000 as an additional minimum liability of the Plan,net of taxes.
At December 31, 2005, the Plan’s accumulated benefitobligation exceeded the fair value of the Plan assetsresulting in the Plan being underfunded by $37,800,000.As such, we recognized the difference between ourrecorded prepaid benefit cost and the underfunded statusof the Plan as a liability of $32,297,000. As of Decem-ber 31, 2005, we have recorded in other comprehensiveloss $29,560,000 as an additional minimum liability of the
Plan. Additionally, we recognized an intangible asset of$3,367,000 which represents the previously unrecognizedprior service cost of the Plan.
(11) 401(k) Plan
We have a qualified, contributory 401(k) plan (the 401(k)Plan). All regular employees are eligible to participate inthe 401(k) Plan if they have completed one full year ofservice and are at least 21 years old. For all of 2004, 2005and through November 30, 2006, we matched 100% of thefirst 2% and 25% of the next 6% of salary contributionsmade by employees. On December 1, 2006, we changedthe employer match to 100% of the first 3% and 50% of thenext 2% of salary contributions made by employees. Theaccounts of all participating employees are fully vestedupon completion of four years of service. We recognized
67
approximately $1,816,000, $2,140,000 and $3,150,000 ofrelated expense in the years ended December 31, 2006,2005 and 2004, respectively.
(12) Commitments and Contingencies
Our New Orleans park sustained extensive damage inHurricane Katrina in late August 2005, has not reopenedsince that time, and will not reopen for the 2007 season.We have determined that our carrying value of the assetsdestroyed is approximately $32.5 million. This amountdoes not include the property and equipment owned bythe lessor, which is also covered by our insurance policies.The park is covered by up to approximately $180 million inproperty insurance, subject to a deductible in the case ofnamed storms of approximately $5.5 million. The propertyinsurance covers the full replacement value of the assetsdestroyed and includes business interruption coverage.Although the flood insurance provisions of the policiescontain a $27.5 million sublimit, the separate “NamedStorm” provision, which explicitly covers flood damage,is not similarly limited. Based on advice from our insuranceadvisors, we do not believe the flood sublimit to be appli-cable. In December 2006, we commenced a declaratoryaction in Louisiana seeking judicial determination that theflood insurance sublimit is not applicable.
We have filed property insurance claims, including busi-ness interruption, with our insurers. Since, in any event, weexpect to recover therefrom an amount in excess of our netbook value of the impaired assets, we established aninsurance receivable in an amount equal to the carryingvalue of those assets, of $32.5 million plus $4.0 million inbusiness interruption coverage to compensate for costsincurred while the park has been closed. As of Decem-ber 31, 2006, we have received payments from our carriersin the amount of $25.0 million bringing the total insurancereceivable balance to $11.5 million at that date. We cannotestimate at this time when, or if, the park will be back inoperation. We are contractually committed to rebuildingthe park, but only to the extent of insurance proceedsreceived, including proceeds covering the damage tothe lessor’s assets. We cannot be certain that our currentestimates of the extent of the damage will be correct.
On April 1, 1998 we acquired all of the capital stock ofSix Flags Entertainment Corporation for $976,000,000,paid in cash. In addition to our obligations under outstand-ing indebtedness and other securities issued or assumedin the Six Flags acquisition, we also guaranteed in con-nection therewith certain contractual obligations relating tothe partnerships that own the Partnership Parks. Specif-ically, we guaranteed the obligations of the general part-ners of those partnerships to (i) make minimum annualdistributions of approximately $58,234,000 (as of 2007 andsubject to annual cost of living adjustments thereafter) tothe limited partners in the Partnership Parks and (ii) makeminimum capital expenditures at each of the Partnership
Parks during rolling five-year periods, based generally on6% of such park’s revenues. Cash flow from operations atthe Partnership Parks is used to satisfy these require-ments first, before any funds are required from us. Wealso guaranteed the obligation of our subsidiaries to pur-chase a maximum number of 5% per year (accumulatingto the extent not purchased in any given year) of the totallimited partnership units outstanding as of the date of theagreements (the Partnership Agreements) that govern thepartnerships (to the extent tendered by the unit holders).The agreed price for these purchases is based on a val-uation for each respective Partnership Park equal to thegreater of (i) a value derived by multiplying such park’sweighted-average four-year EBITDA (as defined in thePartnership Agreements) by a specified multiple (8.0 inthe case of the Georgia park and 8.5 in the case of theTexas park) or (ii) $250,000,000 in the case of the Georgiapark and $374,800,000 in the case of the Texas park. Ourobligations with respect to Six Flags Over Georgia and SixFlags Over Texas will continue until 2027 and 2028,respectively.
As we purchase units relating to either Partnership Park,we are entitled to the minimum distribution and otherdistributions attributable to such units, unless we are thenin default under the applicable agreements with our part-ners at such Partnership Park. On December 31, 2006, weowned approximately 25.3% and 37.7%, respectively, ofthe limited partnership units in the Georgia and Texaspartnerships. The maximum unit purchase obligationsfor 2007 at both parks will aggregate approximately$276,800,000.
We lease under long-term leases the sites of Six FlagsNew Orleans, Six Flags Mexico and La Ronde. We alsolease portions of the site of Six Flags Kentucky Kingdomand a small parcel near Six Flags New England. In certaincases rent is based upon percentage of the revenuesearned by the applicable park. During 2006, 2005, and2004, we recognized approximately $7,131,000,$5,628,000 and $6,157,000, respectively, of rentalexpense under these rent agreements.
Total rental expense from continuing operations, includ-ing office space and park sites, was approximately$13,666,000, $10,833,000 and $11,177,000 for the yearsended December 31, 2006, 2005 and 2004, respectively.
68

Future minimum obligations under noncancellable oper-ating leases, including site leases, at December 31, 2006,are summarized as follows (in thousands):
Year ending December 31,
2007 . . . . . . . . . . . . . . . . . . . . . . . . $ 12,8612008 . . . . . . . . . . . . . . . . . . . . . . . . 12,2902009 . . . . . . . . . . . . . . . . . . . . . . . . 11,8352010 . . . . . . . . . . . . . . . . . . . . . . . . 11,4932011 . . . . . . . . . . . . . . . . . . . . . . . . 10,7642012 . . . . . . . . . . . . . . . . . . . . . . . . 10,8352013 and thereafter. . . . . . . . . . . . . 223,340
Total . . . . . . . . . . . . . . . . . . . . . . . . $293,418
Included in the future minimum obligations under non-cancellable operating leases table above are approxi-mately $61 million of future lease commitments relatedto the Sale Parks that are expected to be sold upon closing.
We are party to a license agreement (the U.S. LicenseAgreement) pursuant to which we have the exclusive righton a long term basis to theme park use in the United Statesand Canada (excluding the Las Vegas, Nevada metropol-itan area) of all animated, cartoon and comic book char-acters that Warner Bros. and DC Comics have the right tolicense for such use. The license fee is subject to periodicscheduled increases and is payable on a per-theme parkbasis. Based on current usage, the annual fee for 2006was approximately $3,500,000.
In November 1999, we entered into license agreements(collectively the International License Agreement) pursu-ant to which we have the exclusive right on a long termbasis to theme parks use in Europe, Central and SouthAmerica of all animated, cartoon and comic book charac-ters that Warner Bros., DC Comics and the Cartoon Net-work have the right to license for such use. Under theInternational License Agreement, the license fee is basedon specified percentages of the gross revenues of theapplicable parks. We have prepaid approximately$3,693,000 of international license fees.
We maintain multi-layered general liability policies thatprovide for excess liability coverage of up to$100,000,000 per occurrence. For incidents arising afterNovember 15, 2003, our self-insured retention is$2,500,000 per occurrence ($2,000,000 per occurrencefor the twelve months ended November 15, 2003 and$1,000,000 per occurrence for the twelve months endedon November 15, 2002) for our domestic parks and anominal amount per occurrence for our international parks.Our self-insured retention after November 15, 2003 is$750,000 for workers compensation claims ($500,000for the period from November 15, 2001 to November 15,2003). For most incidents prior to November 15, 2001, ourpolicies did not provide for a self-insured retention. Basedupon reported claims and an estimate for incurred, but not
reported claims, we accrue a liability for our self-insuredretention contingencies. We also maintain fire andextended coverage, business interruption, terrorism andother forms of insurance typical to businesses in thisindustry. The fire and extended coverage policies insureour real and personal properties (other than land) againstphysical damage resulting from a variety of hazards.
Although we are contractually committed to makeapproximately CAD$20.0 million of capital and otherexpenditures at La Ronde no later than May 1, 2011,the vast majority of our capital expenditures in 2007 andbeyond will be made on a discretionary basis.
We are party to various other legal actions arising in thenormal course of business. Matters that are probable ofunfavorable outcome to us and which can be reasonablyestimated are accrued. Such accruals are based on infor-mation known about the matters, our estimate of the out-comes of such matters and our experience in contesting,litigating and settling similar matters. None of the actionsare believed by management to involve amounts thatwould be material to our consolidated financial position,results of operations, or liquidity after consideration ofrecorded accruals.
On November 7, 2005, certain plaintiffs filed a complainton behalf of a purported class of current and formeremployees against us in the Superior Court of California,Los Angeles County. In the complaint, plaintiffs allege tencauses of action for, among others, unpaid wages andrelated penalties, and violations of California law govern-ing employee meal and rest breaks with respect to SixFlags Magic Mountain, Six Flags Hurricane Harbor LosAngeles, Six Flags Discovery Kingdom (formerly Six FlagsMarine World), Waterworld USA / Concord and Water-world USA / Sacramento. On April 5, 2006, we moved forsummary judgment with respect to some of the plaintiffs’purported claims and to dismiss all claims against thoseparks and individuals who were improperly named in thecomplaint. Since that time, the plaintiffs have amendedtheir complaint to include several additional purportedclass members. Discovery is proceeding with respect toour summary judgment motion and the class certificationissue. Meanwhile, we are investigating the allegations ofunpaid wages at our California parks. Our consolidatedfinancial statements do not include any expenses or lia-bilities related to the above action as a loss has not beendeemed probable or estimable.
On May 30, 2006, a civil action against us was com-menced in the Superior Court for the Judicial District ofNew Britain, Connecticut. The plaintiff seeks damagesagainst us for injuries to his face and head and loss ofhis vision in both eyes as a result of an accident thatoccurred on September 8, 2004 at Six Flags New England.The plaintiff, an employee of an on-site contractor at thetime of the accident, alleges that he was injured whileparticipating in efforts to free a jammed drive train on a
69
rollercoaster at the park. The contractor hired to overseethe drive chain removal has been added as an additionaldefendant in the litigation. Our self-insurance retention onthe action totals $2.5 million.
On February 1, 2007, Images Everywhere, Inc. andJohn Shaw Productions, Inc. filed a case against Six FlagsTheme Parks Inc. and Event Imaging Solutions, Inc. in theSuperior Court of the State of California County of LosAngeles, Central District. The plaintiffs provided photo-graphic services to certain of our parks under licenseagreements and/or under a consulting arrangement. OnOctober 23, 2006, we terminated our business relationshipwith the plaintiffs. As a result of this termination, the plain-tiffs brought suit claiming an unspecified amount in“excess of” $20 million in damages, claiming that theirservices were wrongfully terminated. They assert the fol-lowing causes of action: (i) breach of contract, (ii) breach ofimplied covenant of good faith and fair dealing, (iii) inten-tional interference with contractual relations, (iv) negligentinterference with contractual relations, and (v) breach offiduciary duty and constructive fraud. We have filed ananswer denying the claims and intend to vigorously defendthe action. Our consolidated financial statements do notinclude any expenses or liabilities related to the aboveaction as the probability of the outcome is currently notdeterminable and the loss is not estimable.
We have guaranteed the payment of a $32,200,000construction term loan incurred by HWP DevelopmentLLC (a joint venture in which we own a 41% interest) forthe purpose of financing the construction and developmentof a hotel and indoor water park project located adjacent toour Great Escape park near Lake George, New York,which opened in February 2006. At December 31, 2006,$32,171,000 was outstanding under the loan. Our guar-antee will be released upon full payment and discharge ofthe loan, which matures on December 17, 2009. As secu-rity for the guarantee, we have provided an $8.0 million
letter of credit. At December 31, 2006, approximately$32.2 million was outstanding under the construction termloan. In the event we are required to fund amounts underthe guarantee, our joint venture partners must reimburseus for their respective pro rata share or have their jointventure ownership diluted or forfeited. We also guaranteeda $1.0 million working capital revolving facility. We havereceived $649,000 in management fee revenues from thejoint venture and we have advanced the joint ventureapproximately $2.2 million at December 31, 2006.
The Company has accrued liabilities for tax indemnifica-tion and other pre-sale risks of $14.2 million related to certainparks sold in previous years that could be recognized as arecovery of losses from discontinued operations in the futureif such liabilities are not requested to be paid.
Red Zone LLC requested that we reimburse certain of theexpenses it incurred in connection with its 2005 consentsolicitation. By virtue of the successful consent solicitation,three individuals designated by Red Zone, including DanielM. Snyder, the Chairman of our Board of Directors, and MarkShapiro, our President and Chief Executive Officer, becamedirectors and three previously existing directors wereremoved from the Board of Directors. Our Board of Directorsauthorized us to reimburse Red Zone for the reasonableexpenses incurred in connection with its consent solicitationsubject to approval by our stockholders. Red Zone requestedreimbursement for expenses that include financial advisoryfees, legal fees, travel compensation and signing bonusespaid by Red Zone to Mr. Shapiro and additional individualswho have become our employees and other out of pocketexpenses. The Audit Committee, with the advice of an inde-pendent counsel, determined that the reimbursement ofapproximately $10.4 million of Red Zone’s expenses wouldbe reasonable. Stockholders approved this reimbursementat the 2006 Annual Meeting on May 25, 2006. We recognizedthe reimbursement as other expense in the consolidatedfinancial statements for 2006.
70

(13) Business Segments
We manage our operations on an individual park location basis. Discrete financial information is maintained for eachpark and provided to our corporate management for review and as a basis for decision-making. The primary perfor-mance measures used to allocate resources are park earnings before interest, tax expense, depreciation, andamortization (Park EBITDA) and free cash flow (Park EBITDA less park capital expenditures). All of our parks providesimilar products and services through a similar process to the same class of customer through a consistent method. Wealso believe that the parks share common economic characteristics. As such, we have only one reportable segment —operation of theme parks. The following tables present segment financial information, a reconciliation of the primarysegment performance measure to loss from continuing operations before income taxes. Park level expenses exclude allnon-cash operating expenses, principally depreciation and amortization and all non-operating expenses.
2006 2005 2004
(In thousands)Theme park revenues . . . . . . . . . . . . . . . . . . . . . . . . . . . . . . . . . . . . . . . . . . $ 945,665 $ 956,757 $ 879,586Theme park cash expenses . . . . . . . . . . . . . . . . . . . . . . . . . . . . . . . . . . . . . (653,098) (619,477) (582,693)
Aggregate park EBITDA . . . . . . . . . . . . . . . . . . . . . . . . . . . . . . . . . . . . . . . . 292,567 337,280 296,893Minority interest in earnings — EBITDA . . . . . . . . . . . . . . . . . . . . . . . . . . . . . (45,103) (44,674) (43,042)Equity in operations of affiliates — EBITDA . . . . . . . . . . . . . . . . . . . . . . . . . . 752 — —Corporate expenses . . . . . . . . . . . . . . . . . . . . . . . . . . . . . . . . . . . . . . . . . . . (67,422) (44,561) (30,312)Stock-based compensation . . . . . . . . . . . . . . . . . . . . . . . . . . . . . . . . . . . . . . (15,728) (2,794) (643)Early repurchase of debt . . . . . . . . . . . . . . . . . . . . . . . . . . . . . . . . . . . . . . . . — (19,303) (37,731)Other income (expense) . . . . . . . . . . . . . . . . . . . . . . . . . . . . . . . . . . . . . . . . (11,560) (10,877) (14,356)Loss on disposal of assets . . . . . . . . . . . . . . . . . . . . . . . . . . . . . . . . . . . . . . (27,057) (13,906) (11,676)Equity in operations of affiliates . . . . . . . . . . . . . . . . . . . . . . . . . . . . . . . . . . . (1,700) — —Minority interest in earnings — depreciation and other expense . . . . . . . . . . . 4,880 4,880 5,356Depreciation and amortization . . . . . . . . . . . . . . . . . . . . . . . . . . . . . . . . . . . . (132,295) (127,658) (125,374)Interest expense . . . . . . . . . . . . . . . . . . . . . . . . . . . . . . . . . . . . . . . . . . . . . . (202,909) (185,997) (195,580)Interest income . . . . . . . . . . . . . . . . . . . . . . . . . . . . . . . . . . . . . . . . . . . . . . . 2,918 2,450 4,017
Loss from continuing operations before income taxes . . . . . . . . . . . . . . . . . . $(202,657) $(105,160) $(152,448)
One of our parks is located in Mexico and one is located in Canada. The following information reflects our long-livedassets and revenues by domestic and foreign categories for 2006, 2005 and 2004:
Domestic Foreign Total
(In thousands)2006:
Long-lived assets . . . . . . . . . . . . . . . . . . . . . . . . . . . . . . . . . . . . . . . . . . $2,569,294 $142,820 $2,712,114Revenues . . . . . . . . . . . . . . . . . . . . . . . . . . . . . . . . . . . . . . . . . . . . . . . . 856,958 88,707 945,665
2005:Long-lived assets . . . . . . . . . . . . . . . . . . . . . . . . . . . . . . . . . . . . . . . . . . $2,616,578 $141,124 $2,757,702Revenues . . . . . . . . . . . . . . . . . . . . . . . . . . . . . . . . . . . . . . . . . . . . . . . . 876,330 80,427 956,757
2004:Long-lived assets . . . . . . . . . . . . . . . . . . . . . . . . . . . . . . . . . . . . . . . . . . $2,631,772 $135,486 $2,767,258Revenues . . . . . . . . . . . . . . . . . . . . . . . . . . . . . . . . . . . . . . . . . . . . . . . . 811,508 68,078 879,586
Long-lived assets include property and equipment and intangible assets.
(14) Changes in Management and Strategy
Following a successful consent solicitation by Red ZoneLLC, an entity controlled by Daniel M. Snyder, in Decem-ber 2005, Mr. Snyder became Chairman of our Board ofDirectors and two designees of Red Zone LLC became
directors, including Mark Shapiro, who was elected Pres-ident and Chief Executive Officer at that time. In 2006, ourBoard of Directors approved substantial changes to seniormanagement, including several park presidents (formerly
71

referred to as general managers) and new managementbegan to effectuate a series of long-term operating initia-tives including (i) expanding the family entertainment offer-ing of the parks by adding additional shows, parades,fireworks and character events utilizing the Warner Bros.and DC Comics licensed property, (ii) enhancing the guestexperience by improving the overall appearance andcleanliness of the parks, (iii) reviewing our asset base todetermine whether any non-core assets, including underu-tilized land, should be sold, (iv) changing advertising agen-cies and redesigning our advertising campaigns and(v) increasing future sponsorship and promotional reve-nues as well as driving increased value from admissionsand in-park revenues.
These initiatives were not fully implemented for the 2006season and even when fully implemented, there can be noassurance that they will result in increased attendanceand/or revenue.
The management change resulted in severance andother expenses of approximately $9.0 million in 2005and a $3.6 million write off of costs incurred in projectsthat new management has determined not to pursue. Themanagement change resulted in another $14.6 million in
severance and other expenses in 2006. These expensesare primarily included in selling, general and administrativeexpenses in the accompanying 2006 and 2005 Consoli-dated Statement of Operations.
We entered into an amendment to the employmentagreement of our former Chief Financial Officer, pursuantto which, upon his termination of employment as of April 1,2006, we incurred an additional $4.8 million of severanceexpense and issued to him options to purchase75,000 shares and 25,000 shares of restricted stock.Including that severance expense, we incurred approxi-mately $10.8 million of severance and relocation expensesin 2006.
In the first quarter of 2007, we granted options to pur-chase 1,610,000 shares of common stock to certain exec-utives, options to purchase 170,000 shares of commonstock to directors and a total of 300,000 shares ofrestricted stock to our Chief Executive Officer and ourChief Financial Officer. We currently estimate that thesegrants, coupled with prior grants, will result in stock-basedcompensation expense of approximately $9,155,000 in2007.
(15) Quarterly Financial Information(Unaudited)
Following is a summary of the unaudited interim results of operations for the years ended December 31, 2006 and2005:
FirstQuarter
SecondQuarter
ThirdQuarter
FourthQuarter
FullYear
2006
Total revenue . . . . . . . . . . . . . . . . . . . . . . . . . . . . . . . $ 42,081,000 $325,002,000 $474,239,000 $ 104,343,000 $ 945,665,000
Net income (loss) applicable to common stock . . . . . . . . (246,540,000) (45,079,000) 159,252,000 (195,221,000) (327,588,000)
Net income (loss) per weighted average common shareoutstanding:
Basic . . . . . . . . . . . . . . . . . . . . . . . . . . . . . . . . . . (2.63) (0.48) 1.69 (2.07) (3.48)
Diluted . . . . . . . . . . . . . . . . . . . . . . . . . . . . . . . . . (2.63) (0.48) 1.08 (2.07) (3.48)
FirstQuarter
SecondQuarter
ThirdQuarter
FourthQuarter
FullYear
2005
Total revenue . . . . . . . . . . . . . . . . . . . . . . . . . . . . . . . $ 49,497,000 $331,069,000 $471,666,000 $ 104,525,000 $ 956,757,000
Net income (loss) applicable to common stock . . . . . . . . (184,212,000) 5,609,000 190,195,000 (144,500,000) (132,908,000)
Net income (loss) per weighted average common shareoutstanding:
Basic . . . . . . . . . . . . . . . . . . . . . . . . . . . . . . . . . . (1.98) 0.06 2.04 (1.55) (1.43)
Diluted . . . . . . . . . . . . . . . . . . . . . . . . . . . . . . . . . (1.98) 0.06 1.29 (1.55) (1.43)
We operate a seasonal business. In particular, our theme park operations contribute most of their annual revenueduring the period from Memorial Day to Labor Day each year.
See Note 2 with respect to our loss on sale of discontinued operations during 2006 and 2005, which were primarilyrecognized in the fourth quarters of 2006 and 2005.
72
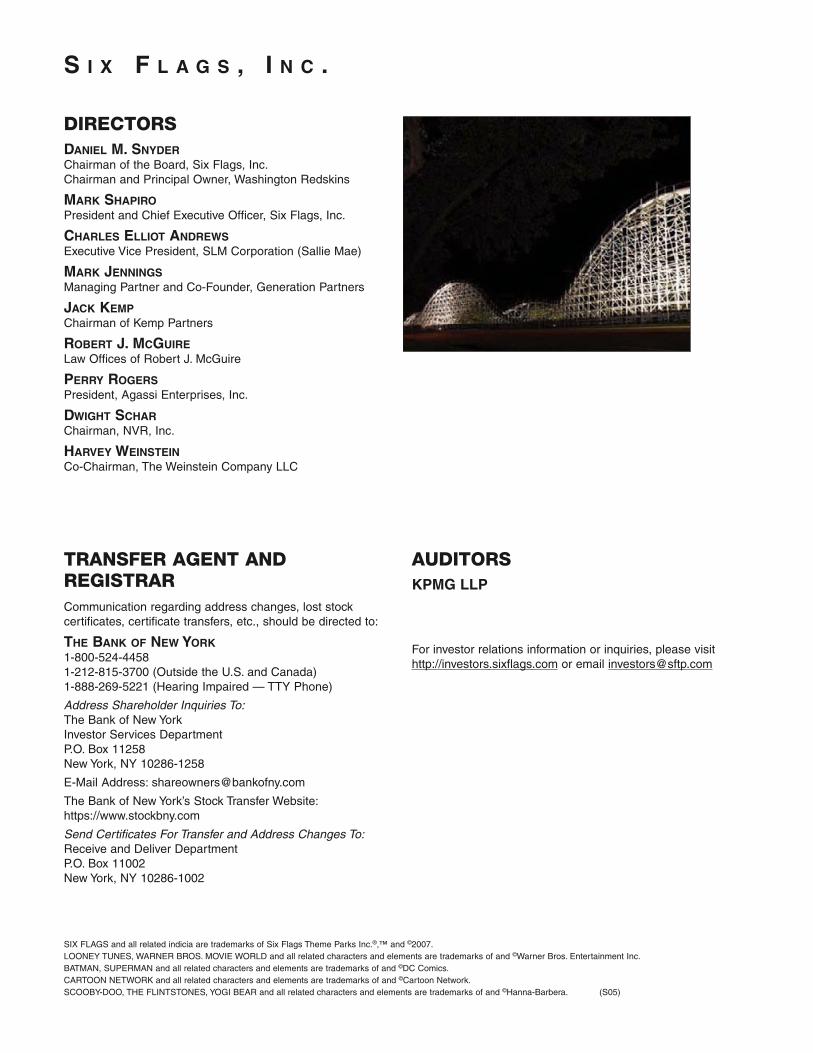
S I X F L A G S , I N C .
DIRECTORSDANIEL M. SNYDERChairman of the Board, Six Flags, Inc.Chairman and Principal Owner, Washington Redskins
MARK SHAPIROPresident and Chief Executive Officer, Six Flags, Inc.
CHARLES ELLIOT ANDREWSExecutive Vice President, SLM Corporation (Sallie Mae)
MARK JENNINGSManaging Partner and Co-Founder, Generation Partners
JACK KEMPChairman of Kemp Partners
ROBERT J. MCGUIRELaw Offices of Robert J. McGuire
PERRY ROGERSPresident, Agassi Enterprises, Inc.
DWIGHT SCHARChairman, NVR, Inc.
HARVEY WEINSTEINCo-Chairman, The Weinstein Company LLC
SIX FLAGS and all related indicia are trademarks of Six Flags Theme Parks Inc.®,™ and ©2007.LOONEY TUNES, WARNER BROS. MOVIE WORLD and all related characters and elements are trademarks of and ©Warner Bros. Entertainment Inc.BATMAN, SUPERMAN and all related characters and elements are trademarks of and ©DC Comics.CARTOON NETWORK and all related characters and elements are trademarks of and ©Cartoon Network.SCOOBY-DOO, THE FLINTSTONES, YOGI BEAR and all related characters and elements are trademarks of and ©Hanna-Barbera. (S05)
TRANSFER AGENT AND REGISTRAR Communication regarding address changes, lost stock certificates, certificate transfers, etc., should be directed to:
THE BANK OF NEW YORK1-800-524-4458 1-212-815-3700 (Outside the U.S. and Canada) 1-888-269-5221 (Hearing Impaired — TTY Phone)
Address Shareholder Inquiries To:The Bank of New York Investor Services Department P.O. Box 11258 New York, NY 10286-1258
E-Mail Address: [email protected]
The Bank of New York’s Stock Transfer Website:https://www.stockbny.com
Send Certificates For Transfer and Address Changes To:Receive and Deliver Department P.O. Box 11002 New York, NY 10286-1002
AUDITORS KPMG LLP
For investor relations information or inquiries, please visithttp://investors.sixflags.com or email [email protected]
1540 BROADWAY, 15TH FLNEW YORK, NY 10036
•924 AVENUE J EAST
GRAND PRAIRIE, TX 75050
1540 BROADWAY, 15TH FLNEW YORK, NY 10036
•924 AVENUE J EAST
GRAND PRAIRIE, TX 75050
SIX FLAGS and all related indicia are trademarks of Six Flags Theme Parks Inc. ®, TM and © 2007. © 2007 Gullane (Thomas) Limited. Thomas the Tank Engine & Friends and Thomas & Friends are trademarks of Gullane (Thomas) Limited.© 2007 The Wiggles Pty Ltd.© 2007 Six Flags Theme Parks Inc. and Asylum Entertainment, LLC. LOONEY TUNES and all related characters and elements are trademarks of and © Warner Bros. Entertainment Inc.JUSTICE LEAGUE and all related characters and elements are trademarks of and © DC Comics. (s07)