de rigo s.p.a.directors’ report on the 2018 separate and consolidated financial statements - draft...
TRANSCRIPT

Directors’ Report on the 2018 separate and consolidated financial statements - draft page 1
Belluno Companies Registration Office No. 00240790253
Economic and Administrative Register No.: 52081
DE RIGO S.p.A.
Registered office in Villanova Industrial Zone, 12- 32013 Longarone (BL) Share capital Euro 10,968,535.24 fully paid-in
Directors’ Report on the 2018 separate and consolidated financial
statements In implementation of Legislative Decree No. 32, Article 1, point c) of February 2, 2007, the company utilises
the option to present in a single document the consolidated Directors’ Report and the separate Directors’ Report, with a greater focus in the consolidated financial statements, where appropriate, upon matters of
significance for the companies included in the consolidation. Therefore, the present consolidated Directors’ Report also contains the disclosure required by Article 2428
of the Civil Code, with reference to the separate financial statements of De Rigo S.p.A..
Corporate Boards The Board of Directors of the parent company comprises 7 members:
Ennio De Rigo Piter Chairman
Emiliana De Meio Vice Chairman Massimo De Rigo Piter Executive Vice Chairman
Maurizio Dessolis Executive Vice Chairman Michele Aracri Executive Director
Roberto De Rigo Director
The Board of Directors will remain in office until the approval of the 2020 Annual Accounts.
According to the motions of May 18, 2015, the Chairman assumes the broadest powers of ordinary and
extraordinary administration, while the three Vice Chairmen, Emiliana De Meio, Massimo De Rigo Piter and
Maurizio Dessolis and the Executive Director Michele Aracri have powers limited to ordinary administration.
The Board of Statutory Auditors is comprised of 5 members:
Mario Bampo Chairman Gianfilippo Cattelan Statutory Auditor
Mario Sommavilla Statutory Auditor
Federica Monti Alternate Auditor Stefano Lodolo Alternate Auditor
The Board of Statutory Auditors will remain in office until the approval of the 2018 Annual Accounts.

Directors’ Report on the 2018 separate and consolidated financial statements - draft page 2
Group operating structure
Shareholders At December 31, 2018, the shareholder structure of De Rigo S.p.A. comprised:
De Rigo Holding S.r.l. 96.889%
Ennio De Rigo Piter 1.899% Roberto De Rigo 0.474%
Giorgio De Rigo Piter 0.474%
Others 0.263%
At December 31, 2018, De Rigo S.p.A. securities comprised only ordinary shares not listed on an official
market.
At the reporting date, De Rigo S.p.A. does not hold treasury shares. The subsidiaries do not directly or indirectly hold shares of the parent company.
De Rigo S.p.A
(Industrial and property holding company with brand management)
Production and Wholesale Division
(Wholesale business)
Retail Sales Division
(Retail business)

Directors’ Report on the 2018 separate and consolidated financial statements - draft page 3
Operating conditions and developments
Dear Shareholders,
the ongoing extraordinary challenges which the Group faces every year make for a complex and difficult to predict marketplace.
The Wholesale division was fully engaged in 2018 in the international launch of the recent Group portfolio entries, including those of the acquired Rem Optical Inc in the United States. In addition, competition on
some of our major markets was exacerbated by significant currency fluctuations.
In the Retail division, the General Optica chain continued to grow thanks to sustained local economic
growth.
2018 was not particularly favourable for the Turkish chain De Rigo Opmar. Although sales rose, margins contracted due to the continued weakening of the local currency.
Group overview
Group consolidated income statement
As reported below in the reclassified Income Statement, consolidated revenues were substantially in line
with 2017 (-0.4%) at Euro 428.8 million (Euro 430.4 million in 2017). At like-for-like exchange rates, Group
revenues were up 2.6%.
Wholesale division revenues decreased 1.4% to Euro 251.3 million, from Euro 254.9 million in 2017. At like-for-like exchange rates, an increase of 1.4% was reported.
Retail division revenues grew 1.5% to Euro 192.3 million, from Euro 189.5 million in 2017, thanks to sales
growth delivered by General Optica and the Turkish retail chain, despite the significant weakening of the
Turkish Lira.
EBITDA, calculated as the operating profit before amortisation and depreciation, increased 14.7% to Euro 23.4 million, from Euro 20.4 million in 2017, with a 5.5% revenue margin. The improvement largely follows
the better performances in the Group’s various areas over the last two years, partly impacted by the
weakening of currencies in some key Group areas.
EBIT before the pension fund deficit accrual rose 86.1% to Euro 6.3 million, from Euro 3.4 million in 2017, and reported a 1.5% revenue margin (0.8% in 2017).
EBIT after the pension fund deficit accrual improved, although impacted by higher English pension fund costs, improving from a loss of Euro 6.4 million in 2017 to a loss of Euro 5.5 million in 2018, with a negative
revenue margin of 1.3%, compared to -1.5% in the previous year.
Net extraordinary and financial charges of Euro 3.6 million were reported, compared to income of Euro 0.3 million in 2017, principally due to the lower revaluation of the Boots Opticians investment.
The net result was a loss of Euro 13.4 million, compared to a loss of Euro 10.2 million in 2017.
At December 31, 2018, the De Rigo Group reported a net cash position of Euro 35.8 million, compared to Euro 32.2 million at December 31, 2017.
Directors’ Report on the 2018 separate and consolidated financial statements - draft page 4
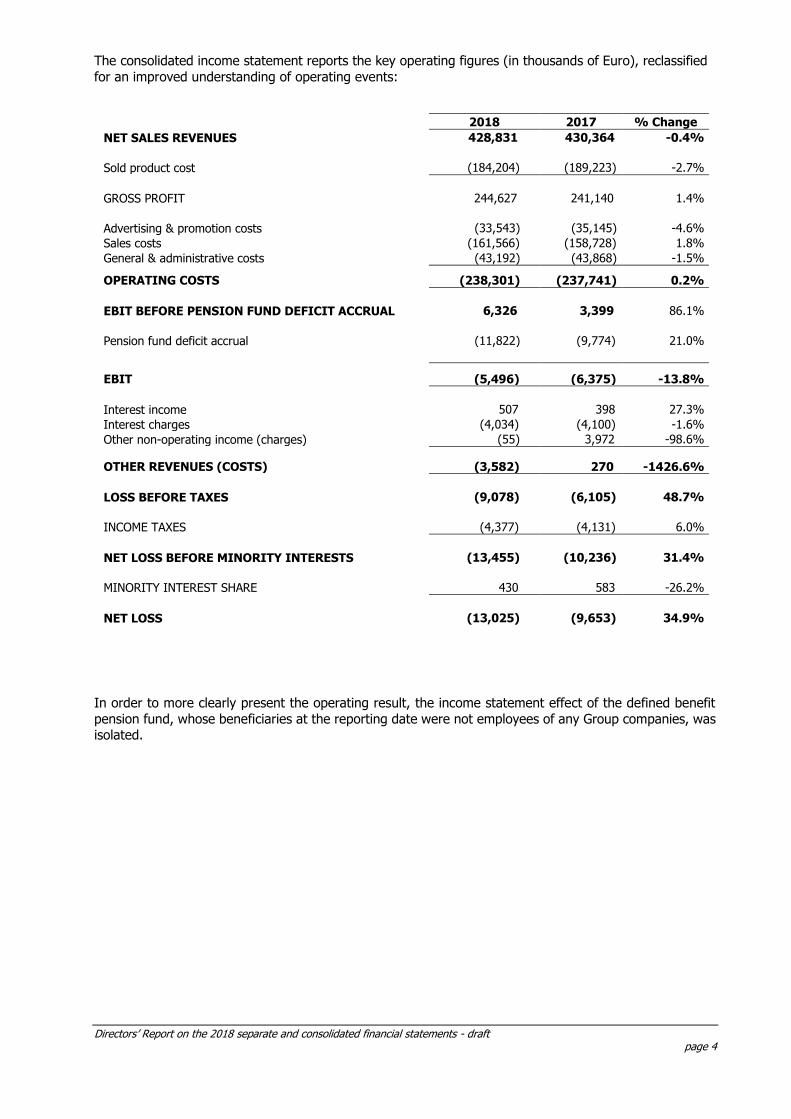
The consolidated income statement reports the key operating figures (in thousands of Euro), reclassified
for an improved understanding of operating events:
2018 2017 % Change
NET SALES REVENUES 428,831 430,364 -0.4%
Sold product cost (184,204) (189,223) -2.7%
GROSS PROFIT 244,627 241,140 1.4%
Advertising & promotion costs (33,543) (35,145) -4.6%
Sales costs (161,566) (158,728) 1.8%
General & administrative costs (43,192) (43,868) -1.5%
OPERATING COSTS (238,301) (237,741) 0.2%
EBIT BEFORE PENSION FUND DEFICIT ACCRUAL 6,326 3,399 86.1%
Pension fund deficit accrual (11,822) (9,774) 21.0%
EBIT (5,496) (6,375) -13.8%
Interest income 507 398 27.3%
Interest charges (4,034) (4,100) -1.6%
Other non-operating income (charges) (55) 3,972 -98.6%
OTHER REVENUES (COSTS) (3,582) 270 -1426.6%
LOSS BEFORE TAXES (9,078) (6,105) 48.7%
INCOME TAXES (4,377) (4,131) 6.0%
NET LOSS BEFORE MINORITY INTERESTS (13,455) (10,236) 31.4%
MINORITY INTEREST SHARE 430 583 -26.2%
NET LOSS (13,025) (9,653) 34.9%
In order to more clearly present the operating result, the income statement effect of the defined benefit
pension fund, whose beneficiaries at the reporting date were not employees of any Group companies, was isolated.

Directors’ Report on the 2018 separate and consolidated financial statements - draft page 5
Group consolidated revenues by region Consolidated revenues by region are broken down as follows:
Sales by region 2018 2017 Change Change %
Europe (excluding Italy)
312.2
309.0
3.2 1.0%
The Americas
53.0
55.0
(2.0) -3.6%
Rest of the world
55.0
58.2
(3.2) -5.5%
Total
420.2
422.2
(1.9) -0.4%
Other revenues
8.5
8.2
0.3 3.6%
Consolidated revenues
428.7
430.4
(1.4) -0.4%
• European sales totalled Euro 312.2 million (+1.0%), principally due to increased Retail and Wholesale division sales on the Spanish and Portuguese market and in France, while partially offset
by the drop in Turkish and Greek sales;
• revenues in the Americas at current exchange rates decrease 3.6% to Euro 53.0 million (Euro 55.0 million in 2017), mainly due to the weakening of the US Dollar against the Euro;
• Rest of the World sales contracted 5.5% to Euro 55.0 million, principally due to the drop in sales
in Korea and at the Hong Kong branch;
• consolidated revenues were impacted by the weakening of the currencies on the Group’s main
markets. Consolidated revenues at like-for-like exchange rates would have risen approx. Euro 11 million on 2017.
Consolidated Group revenues by business division
The following table outlines the financial highlights of the two divisions in 2018 and 2017 in millions of Euro:
PRODUCTION AND SERVICE REVENUES
EBITDA EBIT BEFORE PENSION FUND ACCRUAL
Group Divisions
2018 2017 Change % 2018 2017 Change % 2018 2017 Change %
Production and wholesale
251.3 254.9 -1.4% 9.9 5.5 80.0% 3.0 -1.2 -350.0%
Retail 192.3 189.5 1.5% 14.2 15.0 -5.3% 9.0 9.7 -7.21%
Inter-company eliminations
-14.8 -14.0 5.7% -0.7 -0.1 800.0% -5.6 -5.0 12.0%
Total 428.8 430.4 -0.4% 23.4 20.4 14.7% 6.4 3.5 82.9%
Production and wholesale
Wholesale division revenues decreased 1.4% to Euro 251.3 million, compared to Euro 254.9 million in 2017. This contraction relates to significant currency fluctuations in 2018 on many markets, including Brazil,
Turkey and the Americas. At like-for-like exchange rates, an improvement of 1.4% over 2017 would have been reported, mainly due to the improvement at De Rigo Vision S.p.A., at the French branch and at the
Chinese branch, partially offset by Asian market weakness.

Directors’ Report on the 2018 separate and consolidated financial statements - draft page 6
Retail sales
The Group Retail network at December 31, 2018 comprised the following sales points:
Directly owned stores Stores under franchise Total
2018 2017
Change 2018 2017
Change 2018 2017
Change
General Optica 217 212 5 74 69 5 291 281 10
Opmar Optik 69 74 -5 0 0 0 69 74 -5
Boots Opticians* 447 452 -5 168 177 -9 615 629 -14
Total 733 738 -5 242 246 -4 975 984 -9
The network of Group stores comprises: General Optica, the leading chain of opticians on the Spanish market; Mais Optica, one of the main chains in Portugal; the Opmar Optik chain, the second largest retailer
in Turkey; Boots Optical Investment Holdings Limited, the second largest chain of opticians on the British
market, of which the De Rigo Group holds 42% (consolidated indirectly at Equity).
Retail sales, concerning General Optica, Mais Optica and Opmar Optik alone, totalled Euro 189.9 million, increasing 1.8% over Euro 186.5 million in 2017 and despite the significant weakening of the Turkish
currency in 2018. At like-for-like exchange rates, Retail division revenues would have risen approx. Euro 8 million (+4.4% on 2017).
The re-start of sales point launches and the more focused commercial policy of the Spanish and Portuguese chain supported consolidated growth.
Opmar Optik sales saw the return of strong growth in 2018. However, both the difficulties on the unstable domestic market - and particularly the further weakening of the currency - heavily impacted the negative
operating result.
Consolidated costs
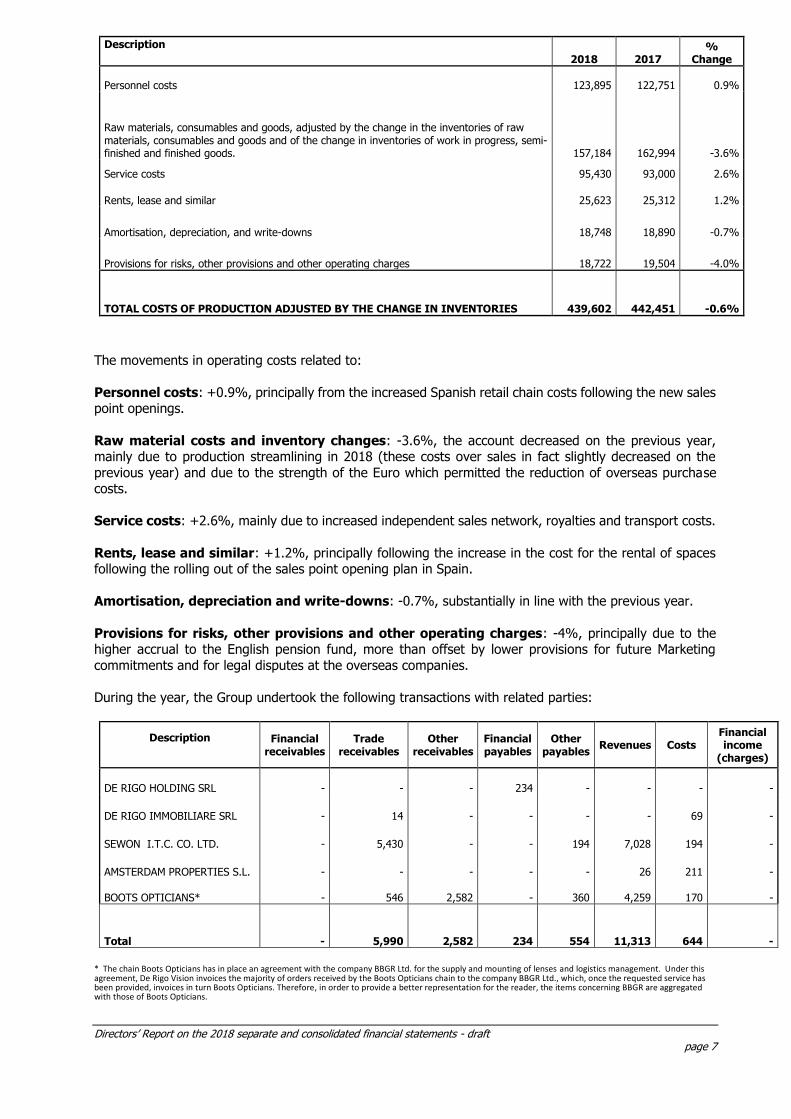
The principal operating costs reported the following movements (in thousands of Euro as per the financial
statements):
Directors’ Report on the 2018 separate and consolidated financial statements - draft page 7
Description
2018 2017 %
Change
Personnel costs 123,895 122,751 0.9%
Raw materials, consumables and goods, adjusted by the change in the inventories of raw materials, consumables and goods and of the change in inventories of work in progress, semi-finished and finished goods. 157,184 162,994 -3.6%
Service costs 95,430 93,000 2.6%
Rents, lease and similar 25,623 25,312 1.2%
Amortisation, depreciation, and write-downs 18,748 18,890 -0.7%
Provisions for risks, other provisions and other operating charges 18,722 19,504 -4.0%
TOTAL COSTS OF PRODUCTION ADJUSTED BY THE CHANGE IN INVENTORIES 439,602 442,451 -0.6%
The movements in operating costs related to:
Personnel costs: +0.9%, principally from the increased Spanish retail chain costs following the new sales point openings.
Raw material costs and inventory changes: -3.6%, the account decreased on the previous year, mainly due to production streamlining in 2018 (these costs over sales in fact slightly decreased on the
previous year) and due to the strength of the Euro which permitted the reduction of overseas purchase costs.
Service costs: +2.6%, mainly due to increased independent sales network, royalties and transport costs.
Rents, lease and similar: +1.2%, principally following the increase in the cost for the rental of spaces following the rolling out of the sales point opening plan in Spain.
Amortisation, depreciation and write-downs: -0.7%, substantially in line with the previous year.
Provisions for risks, other provisions and other operating charges: -4%, principally due to the higher accrual to the English pension fund, more than offset by lower provisions for future Marketing
commitments and for legal disputes at the overseas companies.
During the year, the Group undertook the following transactions with related parties:
Description Financial receivables
Trade receivables
Other receivables
Financial payables
Other payables
Revenues Costs Financial income
(charges)
DE RIGO HOLDING SRL -
- -
234 - - - -
DE RIGO IMMOBILIARE SRL -
14 - - - -
69 -
SEWON I.T.C. CO. LTD. -
5,430 - - 194 7,028
194 -
AMSTERDAM PROPERTIES S.L. -
- - - - 26
211 -
BOOTS OPTICIANS* -
546 2,582 - 360 4,259
170 -
Total -
5,990 2,582
234 554 11,313 644 -
* The chain Boots Opticians has in place an agreement with the company BBGR Ltd. for the supply and mounting of lenses and logistics management. Under this agreement, De Rigo Vision invoices the majority of orders received by the Boots Opticians chain to the company BBGR Ltd., which, once the requested service has been provided, invoices in turn Boots Opticians. Therefore, in order to provide a better representation for the reader, the items concerning BBGR are aggregated with those of Boots Opticians.

Directors’ Report on the 2018 separate and consolidated financial statements - draft page 8
Payables to De Rigo Holding S.r.l. are of a financial nature and as a result of the loan granted by the parent
company. Receivables and payables with other associates concern trade receivables.
The Group is involved in tax disputes in a number of countries. The most significant is in Italy, where the
Tax Agency-Veneto Regional Section, following the execution of audits, issued separate tax assessments
for income taxes and penalties relating to financial years 2008, 2009, 2010, 2011, 2012 and 2013 for a
total of approx. Euro 7.1 million and mainly regarding transfer pricing (the calculation of inter-company
transaction prices). The company, considering itself to have acted correctly and in full compliance with
applicable regulations, presented an appeal against all of the tax assessments to the competent Tax
Commission and also forwarded to the Agency international reports - Department of Finance and the
Ministry for Economy and Finance - respectively for each of the EU countries involved in which the Group
operates through a branch and for the 2008-2011 and 2012-2014 tax periods, subject to audit, separate
applications for the initiation of a mutual agreement procedure as per Article 6 of Convention 90/436/EC
against double taxation (“MAP”). In the first quarter of 2019, the Preliminary agreements and international
disputes office of the Tax Agency communicated to the company that for the years 2008-2011 agreements
had been reached with the competent French tax authorities for the complete cancellation of the disputes
regarding the years 2008 and 2009 and a more than significant reduction agreed in the assessment for the
years 2010 and 2011 concerning the transactions with its French branch.
The company, in furtherance to its defence strategy regarding transfer pricing, also presented in the years
2017 and 2018 at the competent tax authorities’ separate applications for a Preliminary Agreement
Procedure (“PAP”) on a bilateral basis, preliminarily for two of its European subsidiaries, although with the
intention already to extend it further in 2019.
Therefore, the company, also on the basis of the outcome of the recent preliminary agreement concluded
with the French authorities, considering its ability to defend its operations and having recharged to the
income statement the payments made equal to a third of each challenge received for the initial three years
declared (2008-2009-2010), considers the risks provision accrued at December 31, 2018 as appropriate to
cover any liabilities which may arise with regards to the tax disputes.
The Group is also involved in a dispute with a minority shareholder, with judgment awaited at an overseas
arbitration court. The Group considers the probability of incurring extraordinary costs following the issue
of the arbitrators judgment as low. A financial statement provision against this dispute is therefore not considered necessary.
Non-recurring and financial management and consolidated investments
Extraordinary and financial management reported Group net charges of Euro 3.6 million, compared to
income of Euro 0.3 million in the previous year.
This deterioration in the result mainly relates to the lower contribution of Euro 5.8 million concerning the
revaluation of the investment in Boots Optical Investment Holding, to Euro 4 million of losses on investments in subsidiaries and associates, partially offset by increased net exchange gains of Euro 3.1
million and higher gains on fixed asset disposals for Euro 2.2 million.
The Group net financial position, in thousands of Euro, at year-end was as follows:

Directors’ Report on the 2018 separate and consolidated financial statements - draft page 9
2018 2017 Change
Bank deposits 43,526 68,856 (25,330)
Cash in hand and similar 4,045 1,136 2,909
Cash and cash equivalents 47,571 69,992 (22,421)
Bonds and convertible bonds (within one year) - - -
Shareholder loans (within one year) (234)
(233) (1)
Bank payables (within one year) (10,769) (16,112) 5,343
Payables to other lenders (within one year) 488
(36) 524
Advances on foreign payments - - -
Short-term portion of loans - - -
Short-term financial payables (10,515) (16,381) 5,866
-
Short-term net financial position 37,056 53,611 (16,555)
Bonds and convertible bonds (beyond one year) - - -
Shareholder loans (beyond one year) - - -
Bank payables (beyond one year) - (19,684) 19,684
Other lenders (beyond one year) (1,227) (1,697) 470
Advances on foreign payments - - -
Long-term portion of loans - - -
Financial receivables - - -
Net financial position - Medium/long-term (1,227) (21,381) 20,154
Net financial position 35,829 32,230 3,599
At the end of 2018, the Group reported a net cash position of Euro 35.8 million, compared to Euro 32.2
million in the previous year. Operating activities generated cash flows of Euro 39.9 million, compared to
Euro 36.7 million in the previous year, while working capital management generated resources of Euro 3.8 million, against the release of Euro 8.8 million in the previous year. The Group invested Euro 18.1 million,
up on Euro 12.9 million in the previous year, particularly for new sales points in Spain and Group IT systems, in addition to the refurbishment of Group facility production plant. In the same period, the Group made
fixed asset disposals of Euro 3.5 million.
The balance sheet reclassified to net capital employed is reported below, in thousands of Euro:

Directors’ Report on the 2018 separate and consolidated financial statements - draft page 10
2018 2017 Change
Trade receivables
77,136
77,031
105
Other receivables
45,144
48,834
(3,690)
Inventories
95,342
87,849
7,493
Current non-financial payables
(106,611)
(95,674)
(10,937)
A) Working capital 111,011
118,040
(7,029)
Net tangible and intangible assets
86,019
96,509
(10,490)
Financial fixed assets
151
97
54
Investments
49,986
49,684
302
Non-current provisions and non-financial payables
(52,314)
(48,762)
(3,552)
B) Net fixed capital
83,842
97,528
(13,687)
A+B= Net capital employed 194,853
215,568
(20,715)
C) Net financial debt
(35,829)
(32,230)
(3,599)
Opening shareholders' equity
242,298
256,193
(13,895)
Treasury shares -
-
-
Minority interest capital and reserves
1,408
1,258
150
Net loss for the year
(13,025)
(9,653)
(3,372)
D) Closing shareholders’ equity 230,681
247,798
(17,117)
C+D = Total financial debt (cash) and shareholders’ equity 194,852
215,568
(20,715)
Trade receivables were in line with the previous year, while inventories rose on 2017, mainly due to the advancing of the procurement cycle to the third quarter of the year.
The key earnings indicators are reported below (in millions of Euro):
Debt coverage index
The Group has a positive net financial position.
Return on sales (ROS):
2018 2017
EBIT -5.5 -6.4
Revenues 428.8 430.4
ROS % -1.3% -1.5%
Return on investment (ROI):
2018 2017
EBIT -5.5 -6.4
Net capital employed 197.0 215.5
ROI % -2.8% -3.0%

Directors’ Report on the 2018 separate and consolidated financial statements - draft page 11
Return on equity (ROE):
2018 2017
Net result -9.6 -9.6
Net equity 231.8 246.5
ROE % -4.2% -3.9%
Consolidated tax charge
The Group reported an effective average tax rate of 48.2%, compared to 75% in the previous year. The
high effective tax charge is due to the reduction of the Group’s assessable income base following the increased proportion of tax losses incurred in a number of countries, against which the relative deferred
tax assets had not been prudently recognised, and the increased assessable base in countries with higher tax rates than Italy. For further information, reference should be made to the notes to the financial
statements.
Social, political and trade union developments
The Group continued in 2018 to restructure a number of Group companies and particularly at managerial
level. These actions did not result in difficulties within the organisation.
Personnel The average Group workforce at December 31, 2018 and 2017, broken down by category and in FTE, is reported below:
2018 2017 Changes
Executives 48 48 -
White-collar 2,369 2,266 103
Blue-collar 695 682 13
Others 139 131 8
Total employees 3,251 3,127 124
Other information
In accordance with Article 2428, paragraph 2, we report the following:
Research and development
The Group has always invested in aligning its production processes with the most advanced technological standards. The limited amount of technological developments on the market in recent times have restricted
the need for significant industrial investment.
IT investments are increasingly important for our Group. The replacement of IT systems was extended
also to other Group companies, which currently largely operate through a centralised SAP system. The activities to improve the level of computerisation of the sales networks in the countries in which the Group
operates directly continued also in 2018.
The intensive production research and development activities did not result in the capitalisation of costs,
as mainly concerning individual product models, for which their utility is limited to the period of production
of the model and is generally concentrated in a period of less than one year, or for the completion of plant
and machinery for which these operations are outsourced and included in the acquisition cost of the asset.
Directors’ Report on the 2018 separate and consolidated financial statements - draft page 12
Disclosure as per Article 2428, paragraph 2, point 6-bis of the Civil Code
Pursuant to Article 2428, paragraph 2, point 6-bis of the Italian Civil Code, information relating to the use of financial instruments is detailed below as such information is relevant for a valuation of the company’s
equity and financial position. Company management seek to hedge risks through the use of various types of existing beneficial financial
instruments, to ensure that currency, interest rate and price risk are knowledgeably managed. Where risks may be covered through insurance, the Group undertakes the necessary policies. With regards to currency
risks, the company usually hedges its currency surplus/deficit so as to minimise the economic effect.
In particular:
Credit Risk The credit risk deriving from normal Group operations with commercial counterparties is managed and
controlled within the procedures for the allocation and monitoring of client credit standings. Credit management activities are coordinated through reporting and periodic meetings concerning all Group
companies. The amount and measurement criteria for the Doubtful debt provision at the reporting date are outlined in
the Explanatory Notes. At the reporting date, any significant concentrations of credit risk have been monitored, with appropriate
write-down provisions established where necessary.
Liquidity and cash flow risk The majority of Group receivables are short-term. For some receivables for which late payment was considered as a potential insolvency indicator, the Group has already provisioned for the relative risk. The
Group does not have significant exposures which may compromise its liquidation capacity.
The following is also noted:
• debt instruments or other lines of credit to service liquidity requirements are in place;
• the Group holds financial assets for which a liquid market does not exist, but from which financial cash flows are expected (capital or interest) which will be available to satisfy liquidity needs;
• other sources of financing exist;
• there is no significant concentration of liquidity risk, either from financial assets or from financing
sources.
Market risk A sensitivity indication at the reporting date is provided below, highlighting the effects of possible changes
on the income statement in relation to the significant risk variables for each of the following components:
• interest rate risk: the Group is exposed to interest rate risk from financial payables to credit institutions. As this debt is indexed to the Euribor rate, any change results in a positive or negative
impact on the income statement. Management consider that the exposure to this risk is marginal in comparison to the amount of business generated.
• currency risk: the Group undertakes commercial transactions (purchase and sale of goods) in
currencies other than the Euro (principally the US Dollar, GB Sterling, Brazilian Real, Turkish Lira, Chinese Renminbi and Japanese Yen). The currency hedging policy therefore seeks to minimise
the differences generated between the budget exchange rate and that relating to commercial transactions for the purchase or sale of goods and services in foreign currencies (receipts or
payments). The derivative instruments utilised by the company to hedge currency risk principally
concern options and forward contracts.
• price risks: very few raw materials utilised by the company have historically reported significant
price changes. These changes do not have significant impacts on the income statement.

Directors’ Report on the 2018 separate and consolidated financial statements - draft page 13
The environment
The Group has always operated in compliance with environmental regulations, putting in place all actions
necessary to align production standards with those required by the applicable regulations.

Directors’ Report on the 2018 separate and consolidated financial statements - draft page 14
Parent company De Rigo S.p.A. overview
Parent Company Income Statement
Parent company sales of Euro 7 million were substantially in line with the previous year, as was the EBIT
at Euro 5.0 million.
The net result was break-even, compared to a profit of Euro 0.8 million in 2017.
The income statement reports the key operating figures of the parent company De Rigo S.p.A. (in
thousands of Euro), reclassified for an improved understanding of operating events:
2018 2017 % Change
NET SALES REVENUES 7,072 7,037 0.5%
Sold product cost - 287 - 287 0.1%
GROSS PROFIT 6,785 6,750 0.5%
Advertising & promotion costs - 241 - 51 372.5%
Sales costs - 13 - 13 0.0%
General & administrative costs - 1,504 - 1,367 10.0%
OPERATING COSTS - 1,758 - 1,431 22.8%
EBIT 5,027 5,319 -5.5%
Interest income 55 48 14.9%
Interest charges - - 0.0%
Other non-operating income (charges) - 4,092 - 2,853 43.4%
OTHER REVENUES (COSTS) - 4,037 - 2,805 43.9%
PROFIT BEFORE TAXES 990 2,514 -60.6%
INCOME TAXES - 964 - 1,677 -42.5%
NET PROFIT 26 837 -96.9%
Costs of the Parent Company The principal operating costs reported the following movements (in thousands of Euro as per the financial
statements):

Directors’ Report on the 2018 separate and consolidated financial statements - draft page 15
Description 2018 2017 %
Change
Personnel costs
0
0 0.00%
Raw materials, consumables and goods, adjusted by the change in the inventories of raw materials, consumables and goods and of the change in inventories of work in progress, semi-finished and finished goods.
2
6 -66.7%
Service costs 1,424 1,109 28.4%
Rents, lease and similar - - 0.0%
Amortisation, depreciation, and write-downs
525
632 -16.9%
Provisions for risks, other provisions and other operating charges
122
119 2.2%
TOTAL COSTS OF PRODUCTION ADJUSTED BY THE CHANGE IN INVENTORIES 2,073 1,866 11.1%
Service costs increased on the previous year by 28.4%, mainly due to increased costs to defend and support
the brands. The other accounts were in line with the previous year.
During the year, the company undertook the following transactions with related parties:
Description Financial receivables
Trade receivables
Other receivables
Financial liabilities
Other payables
Revenues Costs
DE RIGO VISION S.p.A.
49,853
521
-
(479)
(277)
3,253
(277)
GENERAL OPTICA INTERNACIONAL S.A.
7
24
Total 49,853 528 -
(479)
(277)
3,277
(277)

Directors’ Report on the 2018 separate and consolidated financial statements - draft page 16
Financial management and investments of the parent company De Rigo S.p.A
Net financial charges of Euro 55 thousand increased on the previous year.
The extraordinary components in 2018 include the accrual made for the restoration of the share capital of the Turkish subsidiary De Rigo Ve Sesa Group Gozluk, for an amount of Euro 5.7 million (Euro 3.0 million
in 2017), partially offset by extraordinary income regarding prior year income taxes of Euro 1.6 million.
At December 31, 2018, De Rigo S.p.A. reported a net cash position of Euro 49.6 million, increasing on Euro
41.5 million at December 31, 2017.
2018 2017 Change
Bank deposits 70 258 (188)
Cash in hand and similar 0 0 (0)
Treasury shares - - -
Cash and cash equivalents 70 258 (188)
Bonds and convertible bonds (within one year) - - -
Shareholder loans (within one year) - - -
Bank payables (within one year) - - -
Payables to subsidiaries (within 12 months)
(277) (2,093) 1,816
Advances on foreign payments - - -
Short-term portion of loans - - -
Loans to subsidiaries 49,842 43,366 6,476
Short-term financial receivables (payables) 49,565 41,273 8,292
Short-term net financial position 49,635 41,531 8,104
Bonds and convertible bonds (beyond one year) - - -
Shareholder loans (beyond one year) - - -
Bank payables (beyond one year) - - -
Other lenders (beyond one year) - - -
Advances on foreign payments - - -
Long-term portion of loans - - -
Financial receivables - - -
Net financial position - Medium/long-term - - -
Net financial position 49,635 41,531 8,104
The balance sheet reclassified to net capital employed is reported below, in thousands of Euro:

Directors’ Report on the 2018 separate and consolidated financial statements - draft page 17
2018 2017 Change
Trade receivables 1,835 1,648 187
Other receivables 1,897 1,665 232
Inventories - - -
Current non-financial payables (1,259) (747) (512)
A) Working capital 2,473 2,566 (93)
Net tangible and intangible assets 4,378 4,777 (399)
Financial assets 0 (0) 0
Equity investments 206,618 206,618 -
Non-current provisions and non-financial payables (16,695) (10,940) (5,755)
B) Net fixed capital 194,301 200,455 (6,154)
A+B= Net capital employed 196,774 203,021 (6,247)
C) Net financial debt (49,635) (43,362) (6,273)
Opening shareholders' equity 246,383 245,546 837
Treasury shares - - -
Minority interest capital and reserves - - -
Net Profit 26 837 (811)
D) Closing shareholders’ equity 246,409 246,383 26
C+D = Total financial debt (cash) and shareholders’ equity 196,774 203,021 (6,247)
For further information, reference should be made to the Explanatory Notes.
The key earnings indicators are reported below (in millions of Euro):
Debt coverage index The company has a positive net financial position.
Return on sales (ROS)
2018 2017
EBIT 5.0 5.3
Revenues 7.1 7.0
ROS % 71.4% 75.7%
Return on investment (ROI)
2018 2017
EBIT 5.0 5.3
Net capital employed 196.8 203.0
ROI % 2.5% 2.6%
Return on equity (ROE):
2018 2017
Net result 0.0 0.8
Net equity 246.4 246.4
ROE % 0.0% 0.3%

Directors’ Report on the 2018 separate and consolidated financial statements - draft page 18
Parent Company tax charge
The company reported an effective average tax rate of 97.4%, compared to 66.7% in the previous year, principally related to the fact that the pre-tax result for the year was significantly impacted by non-
deductible tax charges.
Human resources
The company did not have any employees in the years 2018 and 2017.
Processing of personal data The company, supported by outside consultants, substantially completed the project for alignment with the
new European General Data Protection Regulation (“GDPR” – Regulation 2016/679), entering into force
from May 26, 2018.
Further information
No atypical or unusual transactions were undertaken with related parties. With regards to any investments held by directors, statutory auditors or general managers, reference should
be made to the Explanatory Notes.
The information provided sets out a true, balanced and exhaustive analysis of the company’s position, performance and operating results, overall and among the various sectors in which it operates, also through
subsidiaries.
Proposal for the approval of the financial statements and the allocation of the net profit
It is proposed that the Shareholders’ Meeting allocates the net profit of the parent company De Rigo S.p.A. of Euro 26 thousand to the extraordinary reserve for an amount of Euro 23 thousand and to the unrealised
exchange gains reserve for the remaining Euro 3 thousand.
The Chairman of the Board of Directors
Ennio De Rigo Piter
The undersigned ENNIO DE RIGO PITER, Chairman of the Board of Directors of the company De Rigo S.p.A.,
declares that the present electronic document conforms to that transcribed and signed in the company’s accounting
records.