de bruijn graph assembly slides by michael c. schatz (with exceptions where noted)
TRANSCRIPT

De Bruijn graph assembly
slides by Michael C. Schatz(with exceptions where noted)

Shredded Book Reconstruction
• Dickens accidentally shreds the first printing of A Tale of Two Cities– Text printed on 5 long spools
• How can he reconstruct the text?– 5 copies x 138, 656 words / 5 words per fragment = 138k
fragments– The short fragments from every copy are mixed together– Some fragments are identical
It was the best of of times, it was thetimes, it was the worst age of wisdom, it was the age of foolishness, …
It was the best worst of times, it wasof times, it was the the age of wisdom, it was the age of foolishness,
It was the the worst of times, it best of times, it was was the age of wisdom, it was the age of foolishness, …
It was was the worst of times,the best of times, it it was the age of wisdom, it was the age of foolishness, …
It it was the worst ofwas the best of times, times, it was the age of wisdom, it was the age of foolishness, …
It was the best of times, it was the worst of times, it was the age of wisdom, it was the age of foolishness, …
It was the best of times, it was the worst of times, it was the age of wisdom, it was the age of foolishness, …
It was the best of times, it was the worst of times, it was the age of wisdom, it was the age of foolishness, …
It was the best of times, it was the worst of times, it was the age of wisdom, it was the age of foolishness, …
It was the best of times, it was the worst of times, it was the age of wisdom, it was the age of foolishness, …
It was the best of of times, it was thetimes, it was the worst age of wisdom, it was the age of foolishness, …
It was the best worst of times, it wasof times, it was the the age of wisdom, it was the age of foolishness,
It was the the worst of times, it best of times, it was was the age of wisdom, it was the age of foolishness, …
It was was the worst of times,the best of times, it it was the age of wisdom, it was the age of foolishness, …
It it was the worst ofwas the best of times, times, it was the age of wisdom, it was the age of foolishness, …

Greedy Reconstruction
It was the best of
of times, it was the
best of times, it was
times, it was the worst
was the best of times,
the best of times, it
of times, it was the
times, it was the age
It was the best of
of times, it was the
best of times, it was
times, it was the worst
was the best of times,
the best of times, it
it was the worst of
was the worst of times,
worst of times, it was
of times, it was the
times, it was the age
it was the age of
was the age of wisdom,
the age of wisdom, it
age of wisdom, it was
of wisdom, it was the
wisdom, it was the age
it was the age of
was the age of foolishness,
the worst of times, it
The repeated sequence make the correct reconstruction ambiguous• It was the best of times, it was the
[worst/age]
Model sequence reconstruction as a graph problem.
de Bruijn Graph Construction
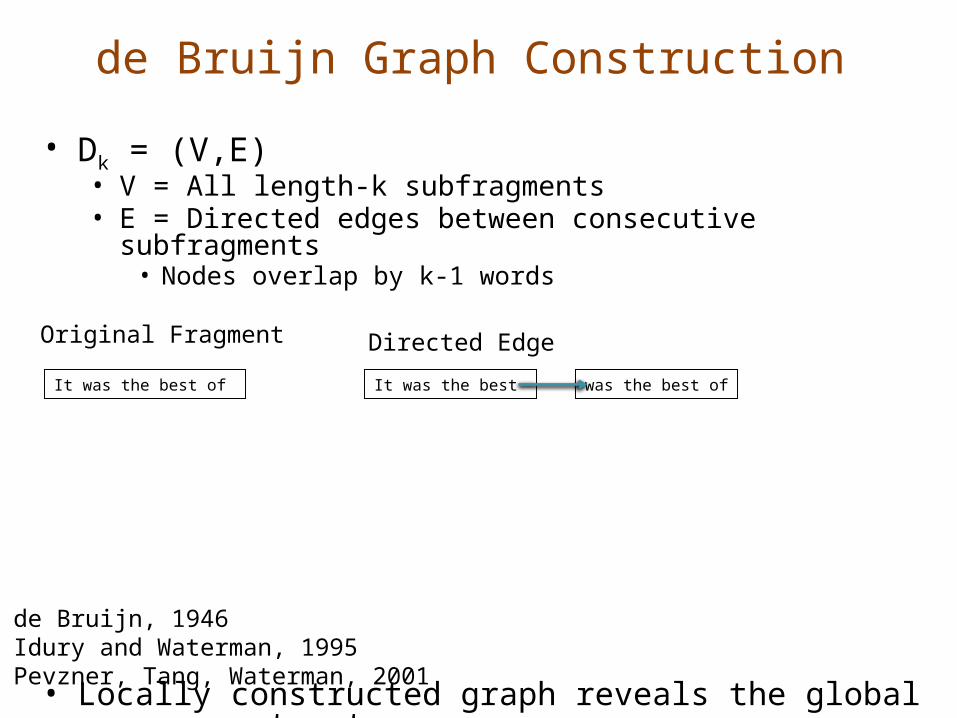
• Dk = (V,E)• V = All length-k subfragments • E = Directed edges between consecutive subfragments
• Nodes overlap by k-1 words
• Locally constructed graph reveals the global sequence structure• Overlaps between sequences implicitly computed
It was the best was the best ofIt was the best of
Original Fragment Directed Edge
de Bruijn, 1946Idury and Waterman, 1995Pevzner, Tang, Waterman, 2001
No need to compute overlaps!
• Can this really work?• How do we choose a value for k?
– Needs to be big enough to be unique– But repeats make it impossible to use
such a large k, because entire reads are not unique
– So pick k to be “big enough”

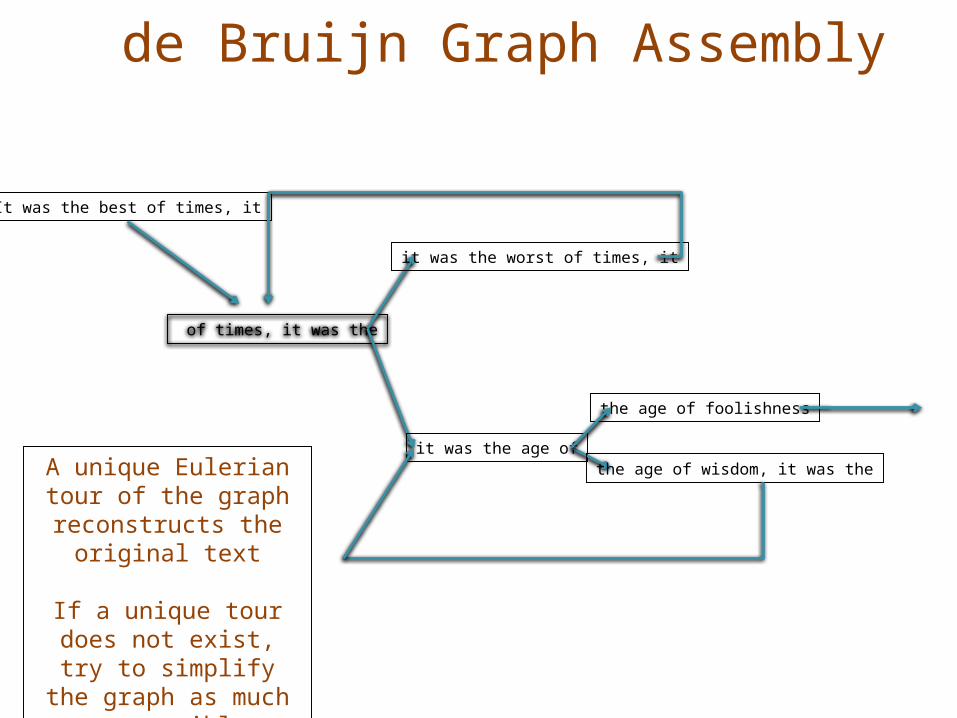
de Bruijn Graph Assembly
the age of foolishness
It was the best
best of times, it
was the best of
the best of times,
of times, it was
times, it was the
it was the worst
was the worst of
worst of times, it
the worst of times,
it was the age
was the age ofthe age of wisdom,
age of wisdom, it
of wisdom, it was
wisdom, it was the
A unique Eulerian tour of the graph reconstructs the
original text
If a unique tour does not exist, try to
simplify the graph as much as possible
de Bruijn Graph Assembly
the age of foolishness
It was the best of times, it
of times, it was the
it was the worst of times, it
it was the age ofthe age of wisdom, it was theA unique Eulerian
tour of the graph reconstructs the
original text
If a unique tour does not exist, try to
simplify the graph as much as possible

Origin of the Euler tour idea: Sequencing by hybridization
J Biomol Struct Dyn. 1989 Aug;7(1):63-73.1-Tuple DNA sequencing: computer analysis.
Pevzner PA.
Laboratory of Mathematical Methods Institute of Genetics of Microorganisms, Moscow, USSR.Abstract
A new method of DNA reading was proposed at the end of 1988 by Lysov et al. According to the authors' claims it has certain advantages as compared to the Maxam-Gilbert and Sanger methods, which are revealed by automation and rapidity of DNA sequencing. Nevertheless its employment is hampered by a number of biological and mathematical problems. The present study proposes an algorithm that allows to overcome the computational difficulties occurring in the course of the method during reconstruction of the DNA sequence by its l-tuple composition. It is shown also that the biochemical problems connected with the loss of information about the l-tuple DNA composition during hybridization are not crucial and can be overcome by finding the maximal flow of minimal cost in the special graph.

Strategy: find all k-mers, build graph
• Every k-mer becomes a node• Two nodes are linked with an edge if they
share a k-1 mer
GACTGGGACTCC
GACTGG ACTGGG
GGACTC GGGACT
TGGGACCTGGGA
GACTCC

Graph size (de Bruijn graph)• One node per k-mer• Overall size limited by genome size G• But if k is small, then
– graph size should limited by 4k
• Question: is this really true?– what about sequencing errors?

Generally an exponential number of compatible sequences– Value computed by application of the BEST theorem
(Hutchinson, 1975)
L = n x n matrix with ru-auu along the diagonal and -auv in entry uv
ru = d+(u)+1 if u=t, or d+(u) otherwise
auv = multiplicity of edge from u to v
Counting Eulerian Tours
ARBRCRDor
ARCRBRD
A R D
B
C
Assembly Complexity of Prokaryotic Genomes using Short Reads.Kingsford C, Schatz MC, Pop M (2010) BMC Bioinformatics.
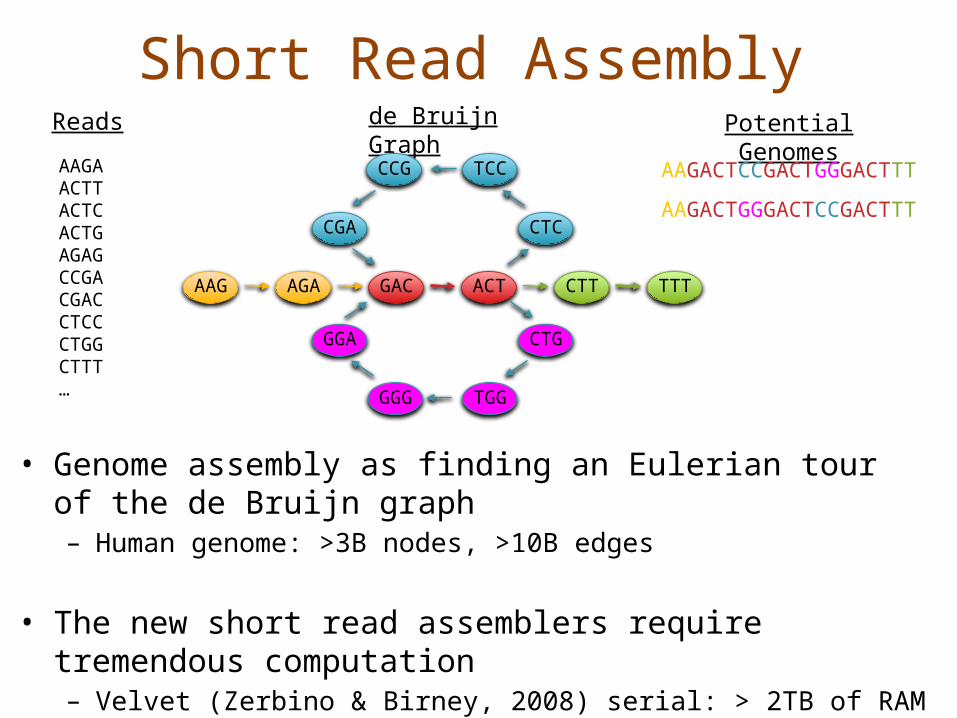
Short Read Assembly
AAGAACTTACTCACTGAGAGCCGACGACCTCCCTGGCTTT…
de Bruijn Graph
Potential Genomes
AAGACTCCGACTGGGACTTT
• Genome assembly as finding an Eulerian tour of the de Bruijn graph– Human genome: >3B nodes, >10B edges
• The new short read assemblers require tremendous computation– Velvet (Zerbino & Birney, 2008) serial: > 2TB of RAM– ABySS (Simpson et al., 2009) MPI: 168 cores x ~96 hours– SOAPdenovo (Li et al., 2010) pthreads: 40 cores x 40 hours,
>140 GB RAM
CTCCGA
GGA CTG
TCCCCG
GGG TGG
AAG AGA GAC ACT CTT TTT
Reads
AAGACTGGGACTCCGACTTT
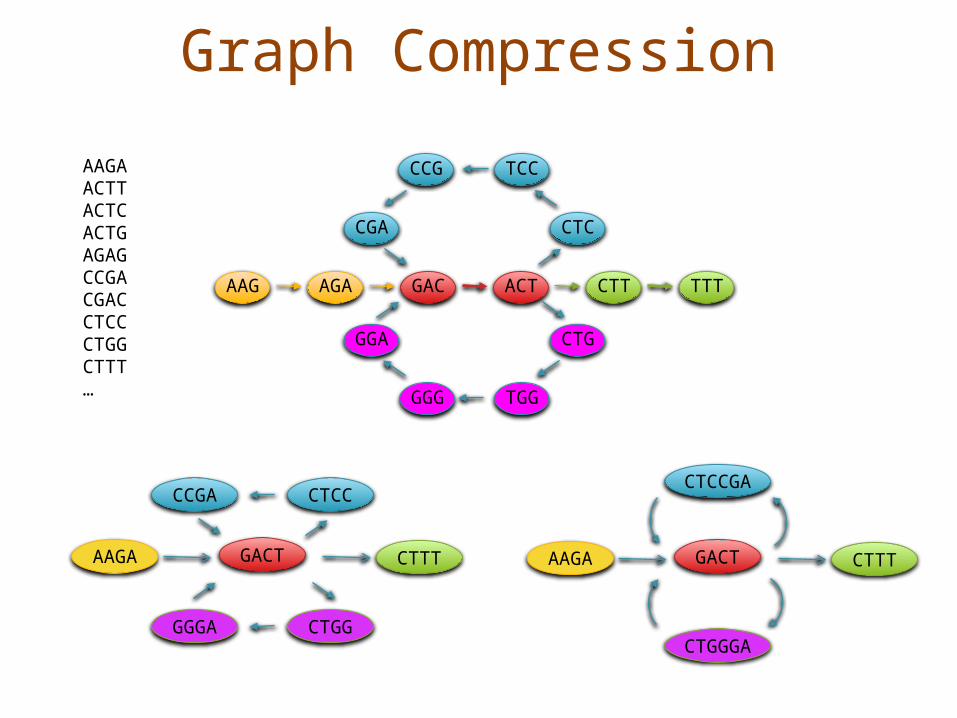
Graph Compression
AAGAACTTACTCACTGAGAGCCGACGACCTCCCTGGCTTT…
CTCCGA
GGA CTG
TCCCCG
GGG TGG
AAG AGA GAC ACT CTT TTT
AAGA GACT CTTT
CTCCGA
CTGGGA
AAGA GACT CTTT
CCGA
GGGA
CTCC
CTGG

Schematic representation of our implementation of the de Bruijn graph.
Zerbino D R , Birney E. Velvet: Algorithms for de novo short read assembly using de Bruijn graphs. Genome Res. 2008;18:821-829
©2008 by Cold Spring Harbor Laboratory Press
Schematic representation of our implementation of the de Bruijn graph. Each node, represented by a single rectangle, represents a series of overlapping k-mers (in this case, k = 5), listed directly above or below. (Red) The last nucleotide of each k-mer. The sequence of those final nucleotides, copied in large letters in the rectangle, is the sequence of the node. The twin node, directly attached to the node, either below or above, represents the reverse series of reverse complement k-mers. Arcs are represented as arrows between nodes. The last k-mer of an arc’s origin overlaps with the first of its destination. Each arc has a symmetric arc. Note that the two nodes on the left could be merged into one without loss of information, because they form a chain.

Bidirectional de Bruijn Graph
• Designate a representative mer for each mer/rc(mer) pair– Use the lexigraphically
smaller mer
• Bidirected edges record if connection is between forward or reverse mer
• In practice, keep separate adjacency lists for the forward and reverse mers
AAGCTTAGGCCT
ACTAGT
AAGG [CCTT]: AAG+ -> AGG+
ACTT [AAGA]: ACT+ -> AAG- GCTT [AAGC]: AGC- -> AAG-
AAG+ -> AGC+
AGCGCT
(Medvedev et al, 2007)

Graph Compression• After construction, many edges are
unambiguous– Merge together compressible nodes– Graph physically distributed over hundreds of computers
(in Contrail)

Node Types
(Chaisson, 2009)
Isolated nodes (10%)
Tips (46%)
Bubbles/Non-branch (9%)
Dead Ends (.2%)
Half Branch (25%)
Full Branch (10%)

Error Correction– Errors at end of read
• Trim off ‘dead-end’ tips
– Errors in middle of read• Pop Bubbles
– Chimeric Edges• Clip short, low coverage
nodes
B*A C
B
B’
A C
BA
D
BA
B
B’
A
C
BA
DC
x

Example of Tour Bus error correction in Velvet.
Zerbino D R , Birney E Genome Res. 2008;18:821-829
Example of Tour Bus error correction. (A) Original graph. (B) The search starts from A and spreads toward the right. The progression of the top path (through B′ and C′) is stopped because D was previously visited. The nucleotide sequences corresponding to the alternate paths B′C′ and BC are extracted from the graph, aligned, and compared. (C) The two paths are judged similar, so the longer one, B′C′, is merged into the shorter one, BC. The merging is directed by the alignment of the consensus sequences, indicated in red lines in B. Note that node X, which was connected to node B′, is now connected to node B. The search progresses, and the bottom path (through C′ and D′) arrives second in E. Once again, the corresponding paths, C′D′ and CD are compared. (D) CD and C′D′ are judged similar enough. The longer path is merged into the shorter one.

Simulations of Tour Bus in Velvet using 35 bp reads
Zerbino D R , Birney E Genome Res. 2008;18:821-829
Blue curve: after tip clippingRed curve: after bubble smoothing
Errors at 1%, SNPs at 1/500

The Breadcrumb algorithm in Velvet
Zerbino D R , Birney E Genome Res. 2008;18:821-829©2008 by Cold Spring Harbor Laboratory Press
Breadcrumb algorithm. Two long contigs produced after error correction, A and B, are joined by several paired reads (red and blue arcs). The path between the two can be broken up because of a repeat internal to the connecting sequence, because of an overlap with a distinct part of the genome, or because of some unresolved errors. The small square nodes represent either nodes of the path between A and B, or other nodes of the graph connected to the former. Finding the exact path in the graph from A to B is not straightforward because of all the alternate paths that need to be explored. However, if we mark all the nodes that are paired up to either A or B (with a blue circle), we can define a subgraph much simpler to explore. Ideally, only a linear path connects both nodes.

Repeat Analysis in Contrail• X-cut
– Annotate edges with spanning reads
– Separate fully spanned nodes• (Pevzner et al., 2001)
• Scaffolding– If mate pairs are available
search for a path consistent with mate distance
– Use message passing to iteratively collect linked and neighboring nodes
C
BA
R
D C
BA R
DR
C
A DR
B
A C DR B R R
Parallel Frontier Search
Contrail
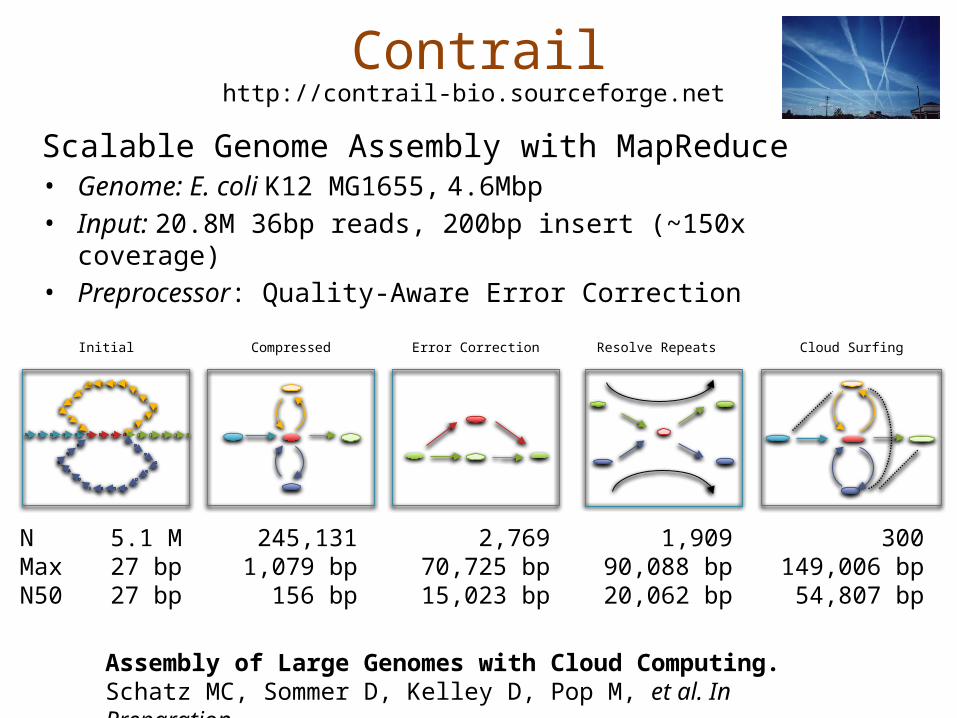
Scalable Genome Assembly with MapReduce• Genome: E. coli K12 MG1655, 4.6Mbp• Input: 20.8M 36bp reads, 200bp insert (~150x
coverage)• Preprocessor: Quality-Aware Error Correction
http://contrail-bio.sourceforge.net
Assembly of Large Genomes with Cloud Computing.Schatz MC, Sommer D, Kelley D, Pop M, et al. In Preparation.
Cloud SurfingError CorrectionCompressedInitial
NMaxN50
5.1 M27 bp27 bp
245,1311,079 bp
156 bp
2,76970,725 bp15,023 bp
1,90990,088 bp20,062 bp
300149,006 bp
54,807 bp
Resolve Repeats

Contrail
De Novo Assembly of the Human Genome• Genome: African male NA18507 (SRA000271, Bentley
et al., 2008)• Input: 3.5B 36bp reads, 210bp insert (~40x coverage)
Chimeric EdgesCompressedInitial
NMaxN50
>7 B27 bp27 bp
>1 B303 bp
< 100 bp
5.0 M14,007 bp
650 bp
4.2 M20,594 bp
923 bpIn progress
Pop Bubbles
B
B’
A
Clip Tips
B
B’
A C
BA
DC
x
Assembly of Large Genomes with Cloud Computing.Schatz MC, Sommer D, Kelley D, Pop M, et al. In Preparation.
http://contrail-bio.sourceforge.net

Fast Path CompressionChallenges– Nodes stored on different
computers– Nodes can only access direct
neighborsRandomized List Ranking– Randomly assign H / T to
each compressible node– Compress H T links
Performance– Compress all chains in log(S) rounds
(<20)– If <1024 nodes to compress (from
any number of chains), assign them all to the same reducer (save 10 rounds)
Randomized Speed-ups in Parallel Computation.Vishkin U. (1984) ACM Symposium on Theory of Computation. 230-239.
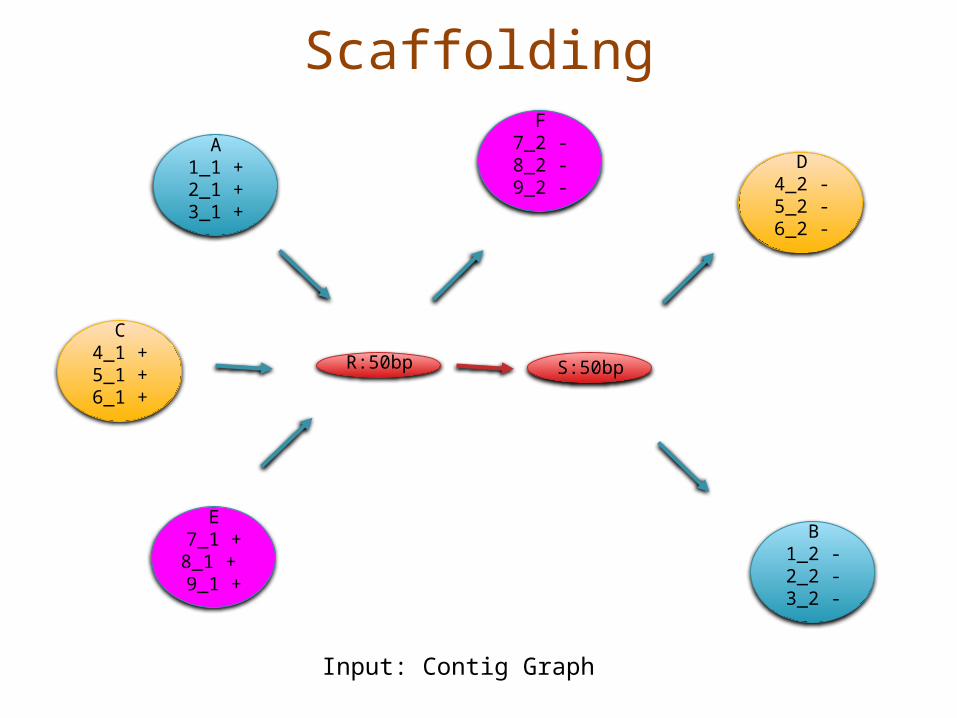
Scaffolding
B1_2 -2_2 -3_2 -
A1_1 +2_1 +3_1 +
E7_1 +8_1 + 9_1 +
F7_2 -8_2 -9_2 -
C4_1 +5_1 +6_1 +
R:50bp S:50bp
D4_2 -5_2 -6_2 -
Input: Contig Graph

Scaffolding
B1_2 -2_2 -3_2 -
A1_1 +2_1 +3_1 +
E7_1 +8_1 +9_1 +
F7_2 -8_2 -9_2 -
C4_1 +5_1 +6_1 +
R: 50bp S:50bp
D4_2 -5_2 -6_2 -
Step 1: Find Contig Edges
1+/-:100bp
2+/-:100bp
3+/-:100bp
4+/-:100bp
5+/-:100bp
6+/-:100bp
7+/-:50bp
8+/-:50bp
9+/-:50bp

Scaffolding
B1_2 -2_2 -3_2 -
A1_1 +2_1 +3_1 +
E7_1 +8_1 +9_1 +
F7_2 -8_2 -9_2 -
C4_1 +5_1 +6_1 +
R: 50bp S:50bp
D4_2 -5_2 -6_2 -
Step 2: Bundle Edges
+/-3x100bp
+/-3x100bp
+/-3x50bp

Scaffolding
B1_2 -2_2 -3_2 -
A1_1 +2_1 +3_1 +
E7_1 +8_1 +9_1 +
F7_2 -8_2 -9_2 -
C4_1 +5_1 +6_1 +
R: 50bp S:50bp
D4_2 -5_2 -6_2 -
Step 3: Frontier Search 0
+/-3x100bp
+/-3x100bp
+/-3x50bp
A0
E0
C0

Scaffolding
B1_2 -2_2 -3_2 -
A1_1 +2_1 +3_1 +
E7_1 +8_1 +9_1 +
F7_2 -8_2 -9_2 -
C4_1 +5_1 +6_1 +
R: 50bp S:50bp
D4_2 -5_2 -6_2 -
Step 3: Frontier Search 1
+/-3x100bp
+/-3x100bp
+/-3x50bp
A0
E0
C0

Scaffolding
B1_2 -2_2 -3_2 -
A1_1 +2_1 +3_1 +
E7_1 +8_1 +9_1 +
F7_2 -8_2 -9_2 -
C4_1 +5_1 +6_1 +
R: 50bp S:50bp
D4_2 -5_2 -6_2 -
Step 3: Frontier Search 2
+/-3x100bp
+/-3x100bp
+/-3x50bp
AR50
ER50
CR50
AR50
ER50
CR50

Scaffolding
B1_2 -2_2 -3_2 -
A1_1 +2_1 +3_1 +
E7_1 +8_1 +9_1 +
F7_2 -8_2 -9_2 -
C4_1 +5_1 +6_1 +
R: 50bp S:50bp
D4_2 -5_2 -6_2 -
Step 3: Frontier Search 3
+/-3x100bp
+/-3x100bp
+/-3x50bp
ERF
50ARS100
CRS100
ARS100
CRS100

Scaffolding
B1_2 -2_2 -3_2 -
A1_1 +2_1 +3_1 +
E7_1 +8_1 +9_1 +
F7_2 -8_2 -9_2 -
C4_1 +5_1 +6_1 +
R: 50bp S:50bp
D4_2 -5_2 -6_2 -
Step 3: Frontier Search 4
+/-3x100bp
+/-3x100bp
+/-3x50bp
ERF
50 CRSB100
ARSB100

Scaffolding
B1_2 -2_2 -3_2 -
A1_1 +2_1 +3_1 +
E7_1 +8_1 +9_1 +
F7_2 -8_2 -9_2 -
C4_1 +5_1 +6_1 +
R: 50bp S:50bp
D4_2 -5_2 -6_2 -
Step 4: Mark Path
+/-3x100bp
+/-3x100bp
+/-3x50bp
ERF
50 CRSB100
ARSB100

Scaffolding
B1_2 -2_2 -3_2 -
A1_1 +2_1 +3_1 +
E7_1 +8_1 +9_1 +
F7_2 -8_2 -9_2 -
C4_1 +5_1 +6_1 +
R: 50bpS:50bp
D4_2 -5_2 -6_2 -
Step 5: Split Repeats
+/-3x100bp
+/-3x100bp
+/-3x50bp
ERF
50 CRSB100
ARSB100
R: 50bp
R: 50bpS:50bp
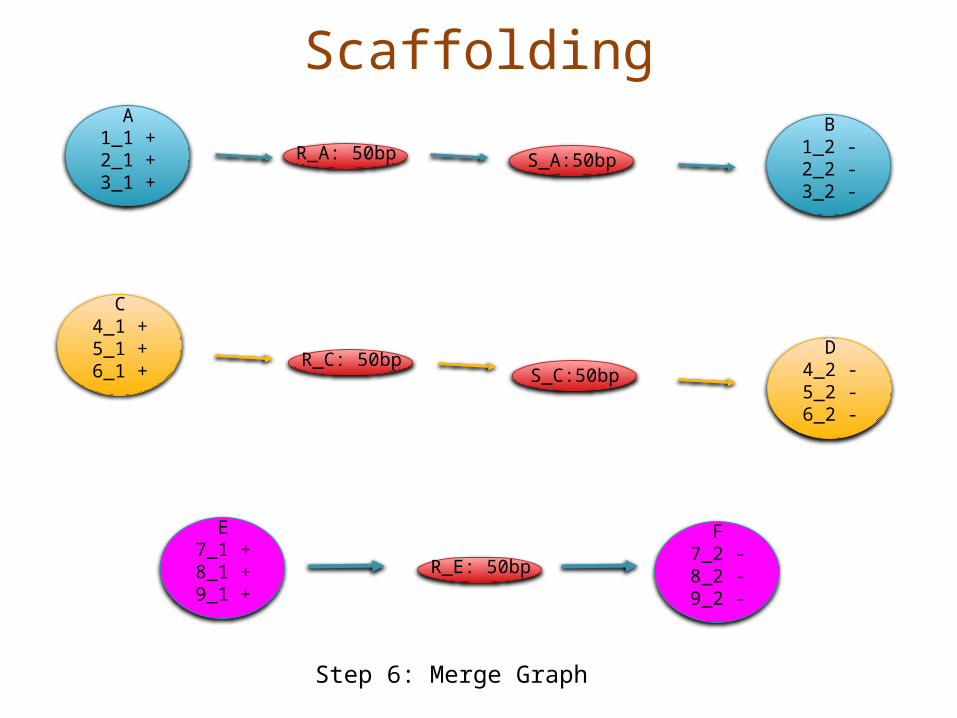
ScaffoldingB
1_2 -2_2 -3_2 -
A1_1 +2_1 +3_1 +
E7_1 +8_1 +9_1 +
F7_2 -8_2 -9_2 -
C4_1 +5_1 +6_1 +
R_C: 50bp
S_A:50bp
D4_2 -5_2 -6_2 -
Step 6: Merge Graph
S_C:50bp
R_A: 50bp
R_E: 50bp

Genome CoverageIdealized assembly• Uniform probability of a
read starting at a given position– p = G/N
• Poisson distribution in coverage along genome– Contigs end when there
is no overlapping read
• Contig length is a function of coverage and read length– Short reads require much
higher coverage
Assembly of Large Genomes using Second Generation SequencingSchatz MC, Delcher AL, Salzberg SL (2010) Genome Research 20, 1165-73.

Effect of coverage on contig length with experimental Streptococcus data for Velvet
Zerbino D R , Birney E Genome Res. 2008;18:821-829
©2008 by Cold Spring Harbor Laboratory Press
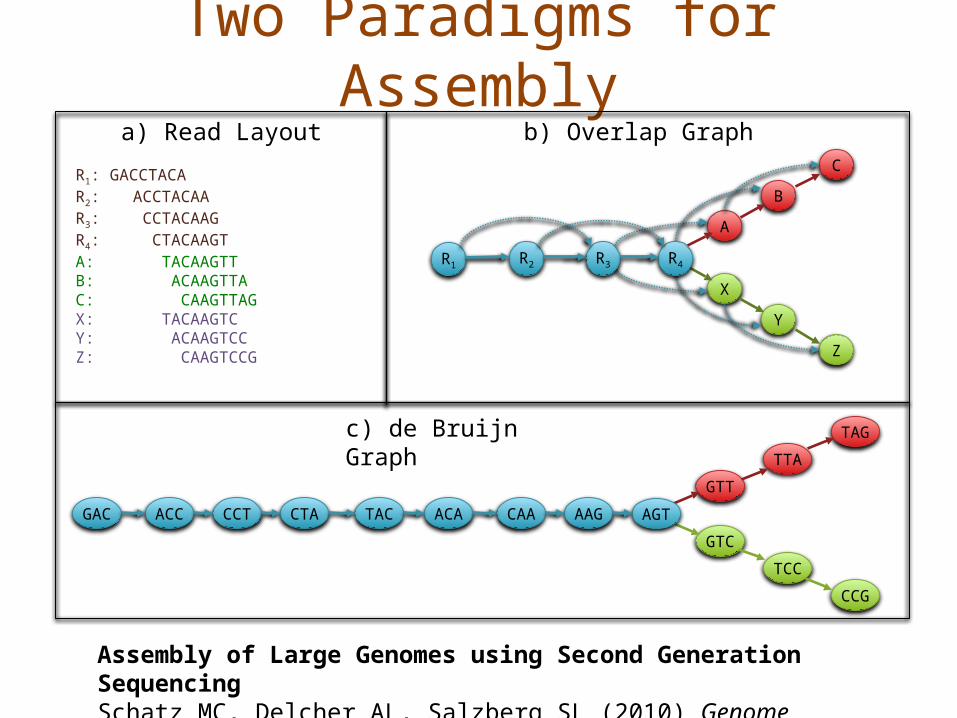
Two Paradigms for Assembly
R1: GACCTACAR2: ACCTACAAR3: CCTACAAGR4: CTACAAGTA: TACAAGTTB: ACAAGTTAC: CAAGTTAGX: TACAAGTCY: ACAAGTCCZ: CAAGTCCG
a) Read Layout
c) de Bruijn Graph
b) Overlap Graph
GTT
GTC
TTA
TCC
TAG
CCG
AGTAAGCAAACATACCTACCTACCGAC
A
B
X
Y
C
Z
R2 R3 R4R1
Assembly of Large Genomes using Second Generation SequencingSchatz MC, Delcher AL, Salzberg SL (2010) Genome Research 20, 1165-73.