dccia chapter 3: comparing observed and modeled … change 2013-2014...delaware climate change...
TRANSCRIPT

Delaware Climate Change Impact Assessment | 2014
Section 2: Delaware’s ClimateChapter 2 – Delaware Climate Trends (Daniel J. Leathers)
Chapter 3 – Comparing Observed and Modeled Historic Data (Daniel J. Leathers and Katharine Hayhoe)
Chapter 4 – Delaware Climate Projections (Katharine Hayhoe, Anne Stoner, and Rodica Gelca)
DELAWAREClimate Change
Impact AssessmentPREPARED BY
Division of Energy and ClimateDelaware Department of Natural Resources and Environmental Control
Chapter 2 Delaware Climate Trends (Daniel J. Leathers)
2-2 Delaware Climate Change Impact Assessment | 2014
Key Terms and DefinitionsClimate indicators – Represent the state of a given environmental condition over a certain area and a specified period of time, such as the mean annual temperature in Delaware for the period 1895-2011 or 2020-2039.
Temperature – Air temperatures over land surface, typically recorded at a height of 2 meters, in degrees Fahrenheit as ˚F.
Precipitation – Includes rain and snow, typically recorded as cumulative amount over a given time period ranging from a day to a year, in inches.
Temperature and precipitation extremes – Extremes can be measured using fixed thresholds (e.g., days per year over 100˚F) or using percentiles (e.g., number of days colder than the coldest 1 pecent of days).
Maximum temperature – The highest temperature value in a given time period (daily, seasonal, or annual). Unless otherwise stated, all daily maximum temperatures in this report refer to values recorded within a 24-hour period, usually (but not always) occurring in the afternoon (also described as daytime temperatures).
Minimum temperature – The lowest temperature value in a given time period (daily, seasonal, or annual). Unless otherwise
stated, all daily minimum temperatures in this report refer to values recorded within a 24-hour period, usually occurring at night (also described as nighttime temperatures).
Observations – Data collected from weather stations, usually daily, with measurement instruments. Data usually consists of temperature and precipitation, but weather stations may also collect data on humidity, wind speed, and other conditions.
Cooling degree-days and heating degree-days – An indicator of energy demand for heating and cooling. This represents demand for electricity in the summer (for air conditioning) and natural gas or oil in the winter (for space heating). Degree-days are typically calculated as the cumulative number of hours per year above (for cooling) or below (for heating) a given temperature threshold. For this analysis the threshold value is 65˚F.
Natural climate variability – Variation in seasonal, year-to-year, and even multiyear cycles that can result in wetter or drier, hotter or cooler periods than “average” weather measurements. Most natural climate variability occurs over time scales shorter than 20 to 30 years.
Growing season – The “frost-free” period between the last frost in spring and the first frost in fall or winter, defined as the last and first time that nighttime minimum temperature falls below 32o.
Chapter 2 Delaware Climate Trends (Daniel J. Leathers)
Delaware Climate Change Impact Assessment | 2014 2-3
Chapter 2 Delaware Climate TrendsAuthor: Dr. Daniel J. Leathers, Delaware State Climatologist, University of Delaware
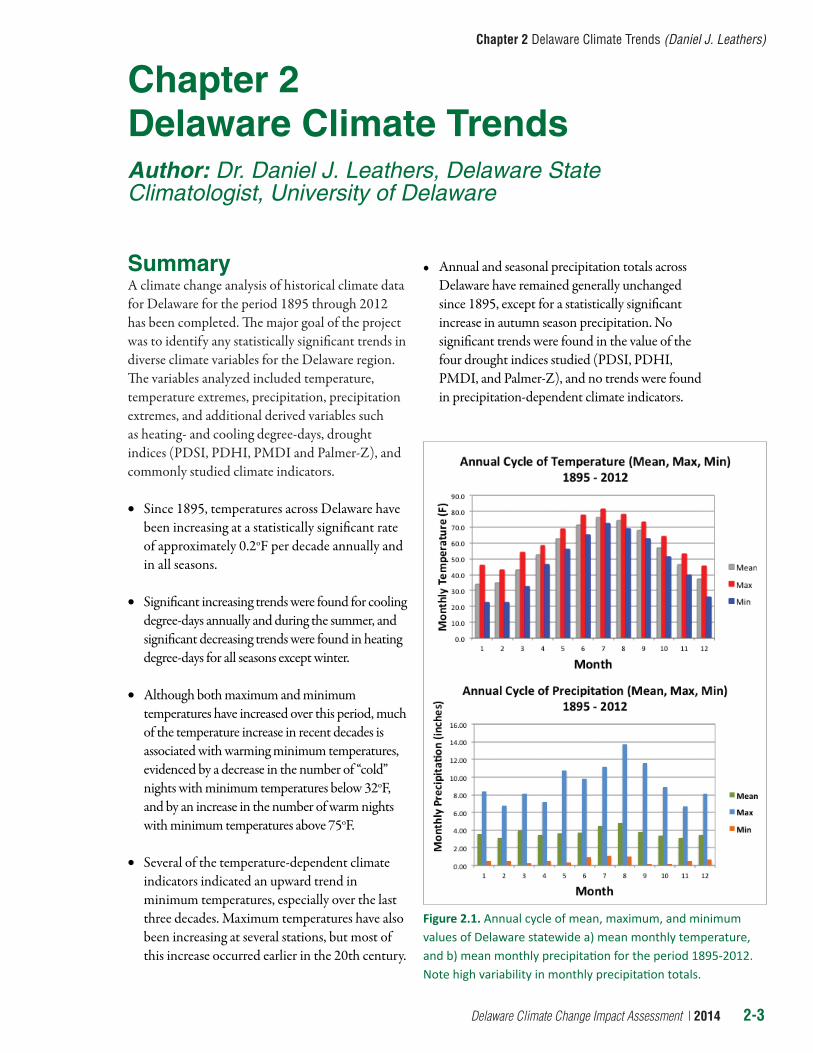
SummaryA climate change analysis of historical climate data for Delaware for the period 1895 through 2012 has been completed. The major goal of the project was to identify any statistically significant trends in diverse climate variables for the Delaware region. The variables analyzed included temperature, temperature extremes, precipitation, precipitation extremes, and additional derived variables such as heating- and cooling degree-days, drought indices (PDSI, PDHI, PMDI and Palmer-Z), and commonly studied climate indicators.
• Since 1895, temperatures across Delaware have been increasing at a statistically significant rate of approximately 0.2oF per decade annually and in all seasons.
• Significant increasing trends were found for cooling degree-days annually and during the summer, and significant decreasing trends were found in heating degree-days for all seasons except winter.
• Although both maximum and minimum temperatures have increased over this period, much of the temperature increase in recent decades is associated with warming minimum temperatures, evidencedbyadecreaseinthenumberof“cold”nights with minimum temperatures below 32oF, and by an increase in the number of warm nights with minimum temperatures above 75oF.
• Several of the temperature-dependent climate indicators indicated an upward trend in minimum temperatures, especially over the last three decades. Maximum temperatures have also been increasing at several stations, but most of this increase occurred earlier in the 20th century.
• AnnualandseasonalprecipitationtotalsacrossDelaware have remained generally unchanged since 1895, except for a statistically significant increase in autumn season precipitation. No significant trends were found in the value of the four drought indices studied (PDSI, PDHI, PMDI, and Palmer-Z), and no trends were found in precipitation-dependent climate indicators.
Figure 2.1. Annual cycle of mean, maximum, and minimum values of Delaware statewide a) mean monthly temperature, and b) mean monthly precipitation for the period 1895-2012. Note high variability in monthly precipitation totals.

Chapter 2 Delaware Climate Trends (Daniel J. Leathers)
2-4 Delaware Climate Change Impact Assessment | 2014
Graphs for Temperature and Precipitation Indicators
• Statewide mean annual, mean winter, mean spring, mean summer, and mean autumn temperatures
• Growing season length
• Annual number of days with minimum temperatureslessthan32˚F
• Annual number of days with minimum temperatureslessthan20˚F
• Annual number of days with minimum temperaturesgreaterthan75˚F
• Summer mean minimum seasonal temperature
• Statewide annual, winter, spring, summer, and autumn precipitation
2.1. BackgroundLocated along the Atlantic Coast of the eastern United States, the State of Delaware is situated in a transition zone between humid subtropical climate conditions to the south and humid continental conditions to the north. The moderating effects of surrounding water bodies, including the Atlantic Ocean and Delaware Bay to the east, and Chesapeake Bay to the west, lessen temperature extremes compared to nearby interior locations. Even so, the state has a continental climate, with cold winter temperatures, hot summers, and ample but highly variable precipitation throughout the year (Figure 2.1 a-b). Delaware’s precipitation patterns show great interannual and intra-annual variability. Although the average annual precipitation is approximately 45 inches, statewide annual values have varied from as low as 28.29 inches in 1930 to as high as 62.08 inches in 1948.
2.2. Data and MethodsObserved climate data can be affected by a number of issues, including observer bias, time of observation bias, station moves, instrument
changes, and missing data to name just a few. To ameliorate as many of these difficulties as much as possible, metadata for each data set used in this study were carefully evaluated, and only the most appropriate data for climate studies were used. Missing data are also a substantial problem, especially when daily thresholds in temperature or precipitation are being investigated. Unfortunately, daily precipitation data are more greatly affected, because in many instances observers fail to record any observation on days with no precipitation falling. A lack of observation of precipitation for a given day must then be treated as missing data because the intent of the observer cannot be presumed. For this study, data for a given year were considered complete for temperature when 95 percent of the days in a year were available and when 90 percent were available for precipitation.
2.2.1. Statewide and Divisional Temperature, Precipitation, and Drought Index DataStatewide and divisional temperature, precipitation, and drought index data are available for the period 1895 through 2012 from the National Climatic Data Center.1 These data are made available by NCDC for the study of climate variability and change. When necessary, observations have been adjusted to account for the effects introduced into the climate record by factors such as instrument changes, station relocations, changes in observer or observing practice, urbanization, etc.2 Similar data are also available for the state’s two climate divisions: division 1 (New Castle County) and division 2 (Kent and Sussex Counties).3,4 These data are available through both the Office of the Delaware State Climatologist and the NCDC. These data were used in the analysis of temperature and precipitation variability and large-scale drought (PDSI, PDHI, PMDI, and Palmer-Z) for the state as a whole and for each of Delaware’s two climate divisions since 1895. Keim et al.5 discussed some possible problems in the divisional data associated with stations coming into and out of the divisional calculation over time, especially if the station changes

Chapter 2 Delaware Climate Trends (Daniel J. Leathers)
Delaware Climate Change Impact Assessment | 2014 2-5
include large elevation differences. Given the small elevation differences across Delaware and the small size of the climate division areas, this problem should not be of major concern in this study. The statewide data are calculated from National Weather Service Cooperative Station data from 1931 to the present. Prior to 1931, statewide data are derived from United States Department of Agriculture data.
2.2.2. Cooperative Daily Weather Station DataThe DSI-3200 data set, available through NCDC, includes 23 National Weather Service Cooperative stations that have been located in Delaware at some point since the late 19th century (Figure 2.2). The DSI-3200 data include daily observations of maximum temperature, minimum temperature, total liquid precipitation, snowfall, and snow cover on the ground. Although the data have been quality controlled, care must still be taken in their use to account for time of observation biases, poor sensor placement, etc. For this study, metadata on all stations were collected and analyzed to ascertain those stations and period
of record that are suitable for the investigation of climate variability. The Cooperative station data identified as suitable for further evaluation are used in the analysis of temperature and temperature extremes, precipitation and precipitation extremes, and potential asymmetric changes in temperature (changes in maximum compared to minimum temperatures). Nine stations out of the initial list of 23 possibilities were retained for further analysis. A complete list of the climate change indicators calculated from the cooperative station data is given in Table 2.1; Figure 2.2 shows the locations of the stations used in the analysis. It is important to note that only those climate indicators that showed significant trends at a number of stations are discussed in this report. However, all 41 climate indicators were investigated at all nine stations used in this study (369 separate trends were analyzed). Moreover, four high-quality stations (Wilmington Porter Reservoir, Wilmington NCC Airport, Dover, Lewes), spanning the
Table 2.1. Listing of climate indicators calculated from National Weather Service Cooperative station data.
Figure 2.2. Spatial distribution of National Weather Service Cooperative weather stations used in the analysis.

Chapter 2 Delaware Climate Trends (Daniel J. Leathers)
2-6 Delaware Climate Change Impact Assessment | 2014
length of Delaware, are used in this report to illustrate the trends across the state for specific climate indicators.
2.2.3. MethodsArguably, the most common analysis technique used to ascertain the presence of statistically significant trends in climate data is simple linear regression, which describes the linear relationship between two variables. In the case of climate
studies, these two variables are typically time and the meteorological variable of interest. Linear regression techniques were used in the current study to ascertain the presence of a statistically significant trend between the independent variable (time) and the dependent climatological variable.6 A variety of statistical tests were used to ascertain the significance of the relationship between time and the variable of interest.
2.3. Climate Trends Analysis – Temperature2.3.1. Statewide ResultsAn analysis of Delaware statewide mean annual and mean seasonal temperatures using the
Figure 2.3. Delaware statewide a) mean annual, b) mean winter, c) mean spring, d) mean summer, and e) mean autumn temperatures, 1895-2012. Red line indicates linear regression trend line for the period of record.
(a)
Mean annual tem
perature increased from
approx. 54˚F to 56˚F.
Mean seasonal w
inter tem
perature increased from
approx. 34˚F to 36˚F.
Mean seasonal spring
temperature increased from
approx. 52˚F to 54˚F.
Mean seasonal sum
mer
temperature increased from
approx. 73˚F to 75˚F.
Mean seasonal autum
n tem
perature increased from
approx. 56˚F to 58˚F.
(b)
(c)
(d)
(e)
Figure 2.4. Growing season length: a) Wilmington Porter Reservoir, b) Wilmington NCC Airport, c) Dover, and d) Lewes. Growing season is defined as number of days between last spring freeze and first fall freeze.
(a)
Three of the four stations show an increase in grow
ing season length. Only the W
ilmington A
irport station shows no trend.
(b)
(c)
(d)

Chapter 2 Delaware Climate Trends (Daniel J. Leathers)
Delaware Climate Change Impact Assessment | 2014 2-7
“ClimateDivisionTimeBiasedCorrectedTemperatureandPrecipitationData”maintainedby the NCDC shows a statistically significant increasing trend in temperatures during the period 1895 through 2012 annually and for all seasons.7,8 An increasing trend of 0.2oF per decade was identified for mean annual, and mean seasonal winter, spring, and summer temperatures (Figure 2.3 a-d). Autumn mean seasonal temperatures have also seen a significant increase, but at a rate of 0.1oF per decade (Figure 2.3e). A modest increasing trend in statewide mean annual temperatures is detectable before 1960, with a more apparent trend after that year. The last two years of the record (2011, 2012) have been the two warmest since 1895 for mean annual temperature. Individual seasons show a more
monotonic long-term upward trend from 1895 through the present.
Significant increasing trends were found for statewide cooling degree-days annually and during the summer, and significant decreasing trends were found in heating degree-days for all seasons except winter. These results are expected, because cooling- and heating-degree day data are calculated directly from mean temperature statistics.
Cooperative Station ResultsSeveral temperature-dependent climate indicators also show statistically significant trends during the period of record, including growing season length, the annual number of days with minimum
Figure 2.5. Annual number of days with minimum temperature less than 32oF a) Wilmington Porter Reservoir, b) Wilmington NCC Airport, c) Dover, and d) Lewes.
(a)
All four stations show
decreasing number of cold days (below
32˚F).
(b)
(c)
(d)
Figure 2.6. Annual number of days with minimum temperature less than 20oF a) Wilmington Porter Reservoir, b) Wilmington NCC Airport, c) Dover, and d) Lewes.
(a)
Porter and Lewes stations show
a decrease in very cold days (below 20˚F).
(b)
(c)
(d)

Chapter 2 Delaware Climate Trends (Daniel J. Leathers)
2-8 Delaware Climate Change Impact Assessment | 2014
temperatures below 32ºF and 20ºF, the number of days annually with minimum temperatures above 75ºF, and seasonal mean minimum and maximum temperatures. Of the four Cooperative stations that have significant data extending into the last decade, three (Wilmington Porter Reservoir, Dover, and Lewes) show significant increasing trends in growing season length associatedwithanearlier“lastfreeze”dateinthespringandalater“firstfreeze”dateinthefall.However, the Wilmington New Castle County Airport site shows no significant trend in growing season length (Figure 2.4 a-d). Examining the number of days per year with temperatures below 32ºF, all four stations (Wilmington Porter Reservoir, Wilmington Airport, Dover, and Lewes) show significant decreasing trends in the
number of days with minimum temperatures below freezing (Figure 2.5 a-d). Very cold days, with minimum temperatures below 20ºF, have seen significant decreases at both Wilmington Porter Reservoir and Lewes, with decreases at the Wilmington Airport nearly reaching the 95% significance level (Figure 2.6 a-d). For minimum temperatures greater than 75ºF, Wilmington Porter Reservoir, Wilmington Airport, and Lewes all show significant increasing trends in the annual number of warm minimum temperatures (Figure 2.7 a-d). An analysis of mean seasonal temperatures at the Cooperative stations indicates statistically significant increasing trends in seasonal mean minimum temperatures during the period of record in each season. Figures 2.8a-d show mean summer season minimum temperatures for each of the four locations as an example. Increasing
Figure 2.7. Annual number of days with minimum temperature greater than 75oF a) Wilmington Porter Reservoir, b) Wilmington NCC Airport, c) Dover, and d) Lewes.
(a)Porter Reservoir, W
ilmington A
irport, and Lewes all show
upward trends in the annual num
ber of warm
minim
um tem
peratures.
(b)
(c)
(d)
Figure 2.8. Summer mean minimum seasonal temperature (JJA) for a) Porter Reservoir, b) Wilmington NCC Airport, c) Dover, and d) Lewes.
(a)
Upw
ard trends in seasonal minim
um tem
peratures are shown for all seasons. Sum
mer season show
n here as an example.
(b)
(c)
(d)

Chapter 2 Delaware Climate Trends (Daniel J. Leathers)
Delaware Climate Change Impact Assessment | 2014 2-9
trends in seasonal mean maximum temperatures were also found for several stations in diverse seasons. The majority of these increasing trends were associated with temperature increases early in the 20th century, with less warming of maximum temperatures in recent decades. Only Lewes showed a significant increasing trend in days above 90ºF (not shown).
2.3.2. Temperature Summary In summary, the analysis of historical temperature data indicates that temperatures across Delaware have been increasing at a rate of approximately 0.2oF per decade since 1895. An analysis of the Cooperative station data, used in the statewide values, suggests that much of the long-term trend in annual and seasonal temperatures is being driven by increasing minimum temperatures, especially later in the period of record. Mean seasonal maximum temperatures have increased at many stations, with the primary period of warming occurring earlier in the 20th century at most locations. The analysis also shows that days with minimum temperatures below 32oF and 20oF (cold nighttime low temperatures) are decreasing, while days with minimum temperatures above 75oF (warm nighttime low temperatures) have been increasing in recent decades. Therefore, nighttime low temperatures are asymmetrically increasing across Delaware compared with daytime maximum temperatures, especially in the later portion of the period of record.
2.4. Climate Trends Analysis – Precipitation2.4.1. Statewide Results“ClimateDivisionTimeBiasedCorrectedTemperatureandPrecipitationData”maintainedby the NCDC were used to study changes in observed precipitation across Delaware.9,10 No significant trends were identified in statewide precipitation for the period 1895-2012 annually, or during the winter, spring, or summer seasons (Figure 2.9 a-e). Only autumn season statewide precipitation was found to have a statistically significantincreasingtrendof0.27”perdecade.
During the observational record, the most important characteristic of Delaware precipitation has been large annual and seasonal precipitation variability, with statewide annual values varying between28.29”in1930and62.08”in1948.Inaddition, there has been a tendency for decadal-scale variations in annual precipitation, including a continuously wet period from 1932 through 1939
Figure 2.9. Delaware statewide a) annual, b) winter, c) spring, d) summer, and e) autumn precipitation 1895-2012. Red line indicates linear regression trend line for the period of record.
(a)
No trends in statew
ide precipitation shown except for an upw
ard trend in autumn precipitation.
(b)
(c)
(d)
(e)

Chapter 2 Delaware Climate Trends (Daniel J. Leathers)
2-10 Delaware Climate Change Impact Assessment | 2014
and an exceptionally dry period during the 1960s (Figure 2.9a).
Cooperative Station ResultsAn analysis of Cooperative station results for precipitation show no significant long-term trends in any of the climate indicators based on daily precipitation thresholds (see Table 2.1). Only a few of the nine stations for which data were analyzed show any significant trends for any precipitation variable, except for autumn season precipitation. For that variable, three stations of the nine showed significant upward increasing trends in precipitation.
Precipitation SummaryIn summary, Delaware statewide precipitation has shown no significant changes since 1895, except for a significant upward increasing trend during the autumn season. The major characteristic of precipitation across Delaware during this period has been large interannual and intra-annual variability. For example, the two-month period of June through July 2012 saw a statewide precipitationtotalofonly5.40”,the17thdrieston record. One year later, the June through July period of 2013 saw a statewide precipitation total of16.47”,thewettestsuchperiodsince1895.Ananalysis of Cooperative station precipitation data showed no homogeneous trends in precipitation thresholds for the stations analyzed, except for an upward increasing trend in precipitation at several locations during the autumn season.
Sources1 National Climatic Data Center. Data can be accessed at
http://www.ncdc.noaa.gov/oa/ncdc.html
2 Guttman, N. B., & Quayle, R. G. (1995). A historical perspective of U.S. climate divisions. Bulletin of the American Meteorological Society, 77, 2, 293-303.
3 Keim, B. D., Wilson, A. M., Wake, C. M., & Huntington, T. G. (2003). Are there spurious temperature trends in the United States Climate Division database? Geophysical Research Letters, 30, 7, 1404, doi:10.1029/2002GL016295.
4 Keim, B. D., Fischer, M. R., & Wilson, A. M. (2005). Are there spurious precipitation trends in the United States Climate Division database? Geophysical Research Letters, 32, L04702, doi:10.1029/2004GL021895.
5 See endnotes 3 and 4.
6 Wilks, D. S. (1995). Statistical methods in the atmospheric sciences. San Diego, CA: Academic Press, 465 pp.
7 NCDC. (1994). Time bias corrected divisional temperature-precipitation-drought index. Documentation for dataset TD-9640. Available from DBMB, NCDC, NOAA, Federal Building, 37 Battery Park Ave. Asheville, NC 28801-2733. 12 pp.
8 Guttman, N. B., & R. G. Quayle. (1995). A historical perspective of U.S. climate divisions. Bulletin of the American Meteorological Society, 77, 2, 293-303.
9 NCDC. (1994). Time bias corrected divisional temperature-precipitation-drought index. Documentation for dataset TD-9640. Available from DBMB, NCDC, NOAA, Federal Building, 37 Battery Park Ave. Asheville, NC 28801-2733. 12 pp.
10 Guttman, N. B., & Quayle, R. G. (1995). A historical perspective of U.S. climate divisions. Bulletin of the American Meteorological Society, 77, 2, 293-303.

Delaware Climate Change Impact Assessment | 2014 3-1
Chapter 3 Comparing Observed and Modeled Historic DataAuthors: Dr. Katharine Hayhoe, ATMOS Research & Consulting
Dr. Daniel J. Leathers, Delaware State Climatologist, University of Delaware
3.1. Can Global Climate Models Reproduce Observed Historical Trends? To assess the robustness of the global climate models used to generate projections of future climate, we compared modeled and observed historical trends from 1960 to 2011. Both models and observations show significant
positive (warming) trends in all minimum temperature and most maximum temperature indicators. Models and observations also agree that there are few to no consistent trends in precipitation-related indicators. For minimum temperature and a few maximum temperature indicators, modeled trends tend to slightly underestimate observed warming, while for other maximum temperature indicators, modeled trends tend to slightly overestimate observed warming. Considering
Key Terms and DefinitionsGlobal climate models (GCMs) – Complex, three-dimensional models that incorporate all the primary components of the earth’s climate system, including atmospheric and ocean dynamics. Earlier versions that only modeled the atmosphere and ocean were known as general circulation models. (See detailed description in Appendix.)
Climate projections – A description of the future climate conditions based on global climate model simulations driven by a range of scenarios describing future emissions from human activities. A climate projection is usually a statement about the likelihood that something will happen over climate time scales (i.e., several decades to centuries in the future) if a given emissions or forcing pathway is followed. In contrast to a prediction (such as a weather prediction), a projection specifically allows for significant changes in the set of boundary conditions, such as an increase in greenhouse gases, which might influence the future climate. As a result, what emerge are conditional expectations (if X happens, then Y is what is expected).
Observations – Data collected from weather stations, usually daily, using measurement instruments. Data usually consists of temperature and precipitation, but weather stations may also collect data on humidity, wind speed, and other conditions.
Climate indicators – Represent the state of a given environmental condition over a certain area and a specified period of time, such as the mean annual temperature in Delaware for the period 1895-2011 or 2020-2039.
Temperature – Air temperatures over land surface, typically recorded at a height of 2 meters, in degrees Fahrenheit as ˚F.
Precipitation – Includes rain and snow, typically recorded as cumulative amount over a given time period ranging from a day to a year, in inches.
Temperature and precipitation extremes – Extremes can be measured using fixed thresholds (e.g., days per year over 100˚F) or using percentiles (e.g., number of days colder than the coldest 1% of days).

3-2 Delaware Climate Change Impact Assessment | 2014
Chapter 3 Comparing Observed and Modeled Historic Data (Daniel J. Leathers and Katharine Hayhoe)
that global models are expected to be accurate only over geographic regions far larger than the state of Delaware, the correspondence between model and observed historical trends is notable. This comparison establishes the basis for confidence in the use of these models to generate future projections.
We compared model-simulated trends with observed data for 1960 through 2011, a period when information is available from both sources. We used observed data from the four highest-quality long-term weather stations and compared them with statistically downscaled simulations from global climate models for those same four stations. The stations used in the comparison run from north to south through the state: Wilmington Porter Reservoir, Wilmington New Castle County Airport, Dover, and Lewes. These sites were chosen because of the quality and quantity of observed data during the historical period.
Trends in 17 temperature and 11 precipitation variables were calculated independently from the model simulations and observations at each station (Table 3.1). The Mann-Kendall trend test was used to measure the direction and strength of the trend. Results were averaged across all four stations used in the analysis if at least two of the stations had a statistically significant trend above the 90% confidence level. If only one or no
stations had a significant trend, then the mean trend value was set to zero, so only trends that were regionally consistent across the state were compared.
For the following tables (Tables 3.2, 3.3, and 3.4), the numbers result from the Mann-Kendall trend test, which ranges from -1 for a very negativetrendto0fornotrendto+1foraverypositive trend. Only trends that are significant atthe90%levelorhigher(p<0.10)areshown.The color shading represents the magnitude of the trends: darker for larger trends, lighter for smaller ones.
For maximum temperature (Table 3.2), modeled trend values matched observed trends quite well. The mean trend from all models is very similar to the mean trend from the four stations used in the analysis for most variables. Both the observations and the multi-model averages show an upward trend in the majority of maximum temperature indicators. The multi-model mean better replicates some trends than others. For example, modeled trends for summer and autumn temperature and for annual numbers of days above 90oF are generally greater than observed. In contrast, modeled trends for winter and for 5-day maximum temperature are not significant, while observed trends are. Also, certain models better replicate observed
Maximum Temperature (abbrevia-tion used in Tables 3.2-3.4)
Minimum Temperature Precipitation
Mean Annual (ann) Mean Annual Annual
Mean Winter (djf, [Dec.-Jan.-Feb.]) Mean Winter Winter
Mean Spring (mam, [March-April-May])
Mean Spring Spring
Mean Summer (jja, [June, July, Aug.]) Mean Summer Summer
Mean Autumn (son, [Sept., Oct., Nov.])
Mean Autumn Autumn
# Days > 90oF (90d) # Days < 32oF Days > 2” (2in)
# Days > 100oF (100d) Coldest Day of the Year (1dx) Days > 3” (3in)
Hottest Day of the Year (1dx) Coldest 5 Consecutive Days (5dx) Wettest Day of the Year (1dx)
Hottest 5 Consecutive Days (5dx) Wettest 5-day Period (5dx)
Precipitation Intensity (int)
# of Dry Days (dry)
Table 3.1. Climate indicators used in the analysis for each station for the period 1960-2011

Delaware Climate Change Impact Assessment | 2014 3-3
Chapter 3 Comparing Observed and Modeled Historic Data (Daniel J. Leathers and Katharine Hayhoe)
trends than others. For example, the CCSM4 and IPSL-CM5A models tend to over-estimate observed maximum temperature trends, while the CNRM-CM5, HadGEM2 and INMCM4 models tend to under-estimate the trends. These differences illustrate why it is important to rely on simulations from multiple climate models. In general, however, the sign and magnitude of observed and multi-model average trends match quite closely.
For minimum temperature (Table 3.3), the mean of all models (ALLMOD) corresponds closely to the mean of the station observations (OBS) in both sign and magnitude. Here, most model trends are smaller than observed. However, both observations and the multi-model averages show significant trends in every indicator, indicating rising minimum temperatures. It is important to note that both observed and modeled trends in minimum temperature are greater than observed and modeled trends in maximum temperatures, suggesting that the models are able to reproduce the observed asymmetry in recent warming.
For precipitation (Table 3.4), neither observations nor models show consistent trends for any of the 11 precipitation variables examined. Observations indicate very weak upward trends for annual precipitation, 5-day maximum precipitation, and precipitation amounts greater than 3 inches, and a weak decreasing trend in the number of dry days. One model (MIROC5) shows similar increases in annual precipitation, 5-day maximum precipitation, and precipitation amounts greater than 3 inches. The remaining models have few significant trends. Given the weakness and inconsistency of observed trends, model results correspond well with observations in showing little to no appreciable changes in precipitation-related variables during the analysis period.
In summary, both models and observations show trends toward warmer conditions in the maximum and minimum temperature indicators examined. Both modeled and observed trends are stronger for minimum temperature than for maximum. Multi-model ensemble averages tend to correspond well with observations. While most individual
Table 3.2. This table compares observed and modeled trends in maximum temperature indicators. The first column lists the indicator (see Table 3.1 for full names). The second column shows the four-station mean observed trends (OBS). The third column shows the four-station mean of all models (ALLMOD), while the remaining columns show the individual values for each model.
Table 3.3. This table compares observed and modeled trends in minimum temperature indicators. The first column lists the indicator (see Table 3.1 for full names). The second column shows the four-station mean observed trends (OBS). The third column shows the four-station mean of all models (ALLMOD), while the remaining columns show the individual values for each model.

3-4 Delaware Climate Change Impact Assessment | 2014
Chapter 3 Comparing Observed and Modeled Historic Data (Daniel J. Leathers and Katharine Hayhoe)
model trends are consistent with the observed, some are typically greater or less than observed for maximum and minimum temperature variables. Neither observations nor models show a consistent and robust signal in any of the precipitation indicators that were assessed. Thus, the models were consistent with the observations in showing little if any significant changes in precipitation during the period of analysis.
Table 3.4. This table compares observed and modeled trends in precipitation indicators. The first column lists the indicator (see Table 3.1 for full names). The second column shows the four-station mean observed trends (OBS). The third column shows the four-station mean of all models (ALLMOD), while the remaining columns show the individual values for each model.