delaware city hazard mitigation and climate adaptation ... city hazard... · delaware city hazard...
TRANSCRIPT

Delaware City Hazard Mitigation and Climate Adaptation
Action Plan
January 2014

Delaware City Hazard Mitigation and Climate Adaptation
Action Plan
A community guide developed to improve public safety, minimize losses and create greater city-wide resilience.
Presented to Delaware City by
The University of Delaware Sea Grant College Program The Partnership for the Delaware Estuary
The Resiliency Place
Prepared in conjunction with
The Delaware City Project Community Task Force The Delaware City Project Advisory Committee
January 2014

AcknowledgmentsDelaware City, in conjunction with the University of Delaware Sea Grant College Program (DESG), The Partnership for the Delaware Estuary (PDE), and The Resiliency Place (TRP), gratefully acknowledges the participation and efforts of the following people, agencies and organizations in developing this plan. This document is representative of the effort and input from many individuals, including city staff, citizens and committee members. Building on previous Delaware City hazard mitigation planning efforts, the summary of existing natural hazards was compiled from several existing documents, including the 2008 Delaware City Comprehensive Plan, the 2000 Duffield Associates Flood Mitigation Plan for the City of Delaware City, and the 2010 New Castle County Office of Emergency Management’s All Hazard Mitigation Plan. This action plan is a compilation of ideas, issues of concern, discussions and recommendations brought forward through a series of workshops and meetings to address current hazards, climate change impacts, and future risks. The authors acknowledge the City’s commitment to creating a more sustainable and hazard/climate resilient community, with a special acknowledgement to the following individuals, commissions, agencies and organizations. Delaware City Stanley E. Green, Mayor Paul H. Johnson Sr., Vice Mayor Betty Barrett, City Council John P. Buchheit III, City Council Megan C. Titus, City Council
Bob Malinowski, City Council Richard C. Cathcart, City Manager Michelle Hartman, City Clerk/Treasurer Kathleen Clifton, Assistant City Clerk Dawn K. Gwynn, City Secretary
The Community Task Force, including Dick Cathcart, Paul Johnson, Betty Barrett, Stan Green, Carol Schofield, Paul Parets, Debra Martin, Kevin Whittaker, Marian Young, Art Jensen The Advisory Committee, including Dave Carpenter, John Gysling, Kevin Donnelly, Brooks Cahall, Mike Powell, Jennifer de Mooy, Susan Love, Michael Kirkpatrick, Dave Carlson, Ed Strouse, Bill Swiatek, Tamika Graham, Keith Rudy, Jason Miller Open House Exhibitors, including Ed Lewandowski (Delaware Sea Grant Marine Advisory Service), Mike Powell (DNREC Flood Mitigation Program), Molly Ellwood (DNREC Delaware Coastal Programs) Other Workshop Participants – individuals, committees, and agencies including Steve Beaston, Jon Beeson, Wayne and Vivien Brittingham, Mike and Diane Maxwell, Paul Morrill, Joe Neel, Herb Netsch, Casey Pedrick, Mick Pollinger, Liz Saunders, Amber Woodall Mapping and GIS Development – Nicole Minni, GIS/Graphics Specialist, Water Resources Administration, University of Delaware Institute for Public Administration Project Implementation – Workshop planning, development, and coordination: Wendy Carey (DESG), Sari Rothrock (PDE), Daniella Hirschfeld (TRP); Final action plan report: Wendy Carey and Sari Rothrock Funding Support ‐ This project and publication is the result of work sponsored by Delaware Sea Grant with funds from the National Oceanic and Atmospheric Administration (NOAA) Office of Sea Grant, U. S. Department of Commerce, and the University of Delaware Sustainable Coastal Communities Program. The statements, findings, conclusions, and recommendations are those of the authors and do not necessarily reflect the views of Delaware Sea Grant or the U.S. Department of Commerce. Cover page photo credits: top of page – Delaware City home page (http://delawarecity.delaware.gov/); bottom page top left – Jon Beeson; remaining three images – Delaware Sea Grant

TableofContents Executive Summary Section 1: Introduction…………………………………………………………………………………………………. 1‐1 1.1 Introduction and Core Values…………………………………………………………………………………… 1‐1 1.2 History, Geography, and Demographics…………………………………………………………………… 1‐2 1.2.1 History…........................................................................................................ 1‐2 1.2.2 Geography and Land Use… ……………………………………………………………………….. 1‐5 1.2.3 Demographics…………………………………………………………………………………………… 1‐9 1.3 General Overview of the Project………………………………………………………………………………. 1‐11 1.3.1 Project Team…………………………………………………………………………………………….. 1‐12 1.3.2 Community Task Force……………………………………………………………………………… 1‐12 1.3.3 Advisory Committee…………………………………………………………………………………. 1‐13 1.3.4 List of Meetings and General Purpose of Each………………………………………….. 1‐15 1.4 Works Cited……………………………………………………………………………………………………………... 1‐17 Section 2: Why Plan to Mitigate Natural Hazards and Adapt to Climate Change………… 2‐1 Section 3: Current Natural Hazards—New Castle County and Delaware City……………… 3‐1 3.1 Identification of Current Natural Hazards………………………………………………………………… 3‐1 3.1.1 New Castle County‐ Hazard Identification………………………………………………… 3‐1 3.2 Overview of Natural Hazards in Delaware City…………………………………………………………. 3‐2 3.2.1 Flooding……………………………………………………………………………………………………. 3‐2 3.2.2 Coastal Storms‐ Tropical Systems and Northeasters…………………………………. 3‐4 3.2.3 Wind…………………………………………………………………………………………………………. 3‐12 3.2.4 Earthquake……………………………………………………………………………………………….. 3‐12 3.2.5 Winter Storms………………………………………………………………………………………….. 3‐13 3.2.6 Severe Thunderstorms……………………………………………………………………………… 3‐13 3.2.7 Extreme Heat/Drought…………………………………………………………………………….. 3‐14 3.2.8 Tornadoes………………………………………………………………………………………………… 3‐14 3.3 Works Cited……………………………………………………………………………………………………………… 3‐16 Section 4: Climate Change and Potential Impacts on Natural Hazards…………………………. 4‐1 4.1 Climate Change – Overview……………………………………………………………………………………… 4‐1 4.2 Regional Climate Trends…………………………………………………………………………………………… 4‐2 4.3 Delaware’s Climate…………………………………………………………………………………………………… 4‐4 4.3.1 Delaware Weather and Climate Trends……………………………………………………. 4‐4 4.3.2 Delaware Statewide Climate Change Assessment and Projections…………... 4‐7 4.3.3 Sea Level Rise…………………………………………………………………………………………… 4‐8 4.4 Climate Change Impacts to People and the Environment………………………………………… 4‐10 4.5 Linking Climate Change Impacts to Natural Hazard Risks in Delaware City………………. 4‐13 4.5.1 Coastal Storms………………………………………………………………………………….……… 4‐13 4.5.2 Floods…………………………………………………………………………………………………….… 4‐14 4.5.3 Severe Thunderstorms……………………………………………………………………………... 4‐14 4.5.4 Wind………………………………………………………………………………………………………… 4‐15 4.5.5 Winter Storms………………………………………………………………………………………….. 4‐15

Section 4: Climate Change and Potential Impacts on Natural Hazards (continued) 4.5 Linking Climate Change Impacts to Natural Hazard Risks in Delaware City (continued)
4.5.6 Drought…. ………………………………………………………………………………………………… 4‐15 4.5.7 Wildfire…………………………………………………………………………………………………….. 4‐16 4.5.8 Sea Level Rise…………………………………………………………………………………………… 4‐16 4.6 Works Cited……………………………………………………………………………………………………………… 4‐18 Section 5: Assessing Delaware City’s Current and Future Vulnerability……………………….. 5‐1 5.1 Risks and Vulnerabilities: Delaware City Self‐Assessment……………………………….……….. 5‐1
5.1.1 Hazard Identification and Analysis………………………………………………….………… 5‐1 5.1.2 Primary hazards of concern in Delaware City…………………………………………… 5‐2 5.1.3 Present day concerns……………………………………………………………………………….. 5‐3 5.1.4 Recent Hurricanes and Tidal Events…………………………………………………………. 5‐6 5.1.5 Critical Facilities Analysis………………………………………………………………………….. 5‐7 5.1.6 Critical Roadways……………………………………………………………………………………… 5‐8 5.1.7 Societal Analysis……………………………………………………………………………………….. 5‐9 5.1.8 Economic Analysis……………………………………………………….…………………………… 5‐10 5.1.9 Environmental Analysis……………………………………………………………………………. 5‐12
5.2 Future Vulnerability…………………………………………………………………………………………………. 5‐15 5.3 Selecting Key Vulnerabilities……………………………………………………………………………………. 5‐16 5.4 Works Cited……………………………………………………………………………………………………………… 5‐17 Section 6: Strategies for Addressing Vulnerabilities to Hazards and Climate Change….. 6‐1 6.1 Current Hazard Mitigation Actions…………………………………………………….…………………….. 6‐1 6.2 Potential Hazard Mitigation and Climate Change Adaptation Strategies………………….. 6‐2 6.3 Strategy Prioritization………………………………………………………………………………………………. 6‐4 6.4 Primary Hazard Mitigation and Climate Change Adaptation Actions………………………... 6‐8 Section 7: Moving Forward ‐ Monitoring and Implementation Guidance……………………. 7‐1 Strategy 1: Evaluate the dynamics of Delaware City’s vulnerability to flood impacts,
including city infrastructure and public safety issues………………………………………… 7‐3 Strategy 2: Establish a Community Planning Team to support an ongoing mitigation
program for Delaware City……………………………………………………………………………….. 7‐5 Strategy 3: Initiate educational programs to alert residents to community
vulnerabilities and heighten awareness of current and future flood risk………….. 7‐7 Strategy 4: Enhance Delaware City’s stormwater drainage capacity, and
improve stormwater management planning…………………………………………………….. 7‐9 Strategy 5: Build hazard mitigation and climate adaptation needs into
local planning and regulatory actions………………………………………………………………… 7‐11
Appendix A: Maps Appendix B: Workshop and meeting agendas, notes, and handouts Appendix C: Additional guidance documents

ListofFigures Figure 1‐1. In the locks at Delaware City, circa 1910. Image retrieved from Chesapeake City, MD historic
website (Collins, Juergens, & LeGates, 2011). Figure 1‐2. Map of Delaware City showing its relationship to adjacent waterways. ‘Downtown’ Delaware
City’s street grid can be seen in the dark grey. Map retrieved from http://mapsof.net/uploads/static‐maps/delaware_city_map.jpg.
Figure 1‐3. Map of Delaware City’s flood hazard areas as based on the draft FEMA guidance as of May
2013. Areas in purple are 500‐year flood zones, light blue are ‘AE’ zones (high risk zones), and orange areas are ‘VE’ zones (‘velocity’ zones, or high risk coastal zones). Flood insurance is mandatory in areas that are light blue or orange.
Figure 1‐4. Delaware City land use in acreage. Information retrieved from Delaware City's 2008
Comprehensive Plan. Figure 1‐5. Delaware City housing stock by year structure was built. Data retrieved from
http://factfinder2.census.gov/. Figure 1‐6. Age of Buildings in Delaware City, DE, retrieved from the Field Guide to Delaware City
Architecture (Ames & Walker). Figure 1‐7. Delaware City population by decade, 1950 through 2010. Data retrieved from Delaware City's
2008 Comprehensive Plan and the 2010 Census. Figure 1‐8. Delaware City – annual income by number of households. Graphic generated by Sari
Rothrock, data retrieved from http://factfinder2.census.gov. Figure 3‐1. Overall risk ranking for New Castle County, Delaware (New Castle County All Hazard
Mitigation Plan, 2010). Figure 3‐2. March 1962 – widespread flooding in Delaware City – lower end of town, Washington Street
to Clinton Street (Photo courtesy Cordelia Bennett). Figure 3‐3. March 1962 – widespread flooding in Delaware City – lower end of Clinton Street facing
Sterling’s Café (Photo courtesy Cordelia Bennett). Figure 3‐4. June 1972 – Hurricane Agnes resulted in flooding throughout Delaware City (Photo courtesy
Cordelia Bennett). Figure 3‐5. The October 1980 northeaster caused significant flooding in downtown Delaware City (Image
courtesy of The News Journal, October 26, 1980). Figure 3‐6. Extensive flooding along Canal Street and other areas of town occurred during the December
1992 northeaster (Photos courtesy Cordelia Bennett).

Figure 3‐7. Tidal flooding along Dragon Run during Hurricane Floyd in 1999 (Photo courtesy J. Jenkins). Figure 3‐8. In December 2012, strong southeast winds combined with high tides to cause major tidal
flooding in the vicinity of Solomon’s Place and Monroe Street (Photo courtesy Jon Beeson). Figure 3‐9. Without much warning, the December 2012 weather event resulted in extensive flooding
and property damage at Solomon’s Place and Monroe Street (Photos courtesy Jon Beeson). Figure 3‐10. Location of historical tornado occurrences in New Castle County, Delaware (1950‐2009)
(New Castle County All Hazard Mitigation Plan, 2010). Figure 4‐1. Summary of Delaware annual average temperature and precipitation – 1981‐2010 (images
courtesy Dr. Daniel J. Leathers, Delaware State Climatologist, Department of Geography, University of Delaware).
Figure 4‐2. Graph of Delaware’s annual temperature cycle – January through December, showing
monthly temperature mean, maximum, and minimum (graph courtesy Dr. Daniel J. Leathers, Delaware State Climatologist, Department of Geography, University of Delaware).
Figure 4‐3. Graph showing upward trend in Delaware’s statewide annual temperature from 1895
through 2012 (graph courtesy Dr. Daniel J. Leathers, Delaware State Climatologist, Department of Geography, University of Delaware).
Figure 4‐4. Graph showing variability in Delaware’s statewide annual precipitation from 1895 through
2012 (graph courtesy Dr. Daniel J. Leathers, Delaware State Climatologist, Department of Geography, University of Delaware).
Figure 4‐5. Graph of Delaware’s annual precipitation cycle – January through December, showing
monthly precipitation mean, maximum, and minimum (graph courtesy Dr. Daniel J. Leathers, Delaware State Climatologist, Department of Geography, University of Delaware).
Figure 4‐6. Graph showing upward trend in autumn precipitation from 1895 through 2012 (graph
courtesy Dr. Daniel J. Leathers, Delaware State Climatologist, Department of Geography, University of Delaware).
Figure 4‐7. Historic global sea level observations (red) and future projections (dashed lines). The shaded
areas represent future sea level rise projections (CCSP, 2009). Figure 4‐8. Tide gauge data from Reedy Point, Delaware from 1956 to 2006 (data from NOAA National
Ocean Service). Figure 4‐9. Heat index, a measure of the weather experience that is a combination of temperature and
humidity, for the NYC Tri‐State area (diagram from NECIA, 2007). Figure 4‐10‐. Current high water levels in Delaware City, Delaware under three different sea level rise
planning scenarios as projected by Delaware DNREC – low (1.6 feet of increased sea level by 2100), medium (3.3 feet of increased sea level by 2100, and high (4.9 feet of increased sea level by 2100).

Figure 5‐1. December 1992 Northeaster. Photo courtesy Delaware City Flood Mitigation Plan Report. Figure 5‐2. March 1994 Northeaster, Washington and Front Streets. Photo Credit Dolly Powell. Figure 5‐3. Google Earth view of Delaware City. Yellow pushpins indicate areas that residents identified
as problem flooding areas. Figure 5‐4. Pump outfall at Stauffer Slip, at the end of Washington Street. Figure 5‐5. Standing water at culvert backing up to Solomon Place. Figure 5‐6. Sign in front of Delaware City's Mobile home community. Figure 5‐7. Flanked on either side by marsh, this road is highly susceptible to flooding. Figure 5‐8. Multiple Delaware City residents lost their cars in the floods on December 21, 2012. Photo
credit Jon Beeson. Figure 5‐9. Map of Environmental Features from the Delaware City comprehensive plan. Light green
represents tidal wetlands, dark green represents non‐tidal wetlands, and light blue represents streams (Institute for Public Administration, 2008).

ListofTables Table 3‐1. Reedy Point, Delaware – Maximum tide levels from 2000‐2010. Historic tide data retrieved
from NOAA NOS (http://tidesandcurrents.noaa.gov/). Table 3.2. Delaware City, Delaware – Maximum tide levels from 2000 – 2010. Historic tide data retrieved
from NOAA NOS (http://tidesandcurrents.noaa.gov/). Table 4‐1. Summary of observed and documented current climate trends in the Northeast region
(information summarized after Heffner et al, 2012). Table 4‐2. Likelihood of occurrence for major climate change conditions in the Mid‐Atlantic by 2100
(information summarized after Najjar, 2012). Table 4‐3. Delaware relative sea level rise planning scenarios and estimates for 2100 (Delaware DNREC,
2012).
Guide to Appendices A ‐ C
Appendix A Appendix A includes the following maps:
Map 1. Aerial view of Delaware City
Map 2. Roads and Boundaries
Map 3. FEMA Flood Plains (effective maps)
Map 4. DRAFT, New FEMA National Flood Hazard Areas (preliminary maps)
Map 5. DRAFT, New FEMA National Flood Hazard Areas with Delaware City Commercial Zones
Map 6. DRAFT, New FEMA National Flood Hazard Areas with Historic Locations
Map 7. Outdoor Resource Inventory Sites with Flood Plains
Map 8. Existing Land Use
Map 9. Existing Zoning
Map 10. Adjacent Area Zoning
Map 11. Environmental Features
Map 12. Future Land Use
Map 13. Annexation and Future Land Use

Appendix B Appendix B includes the following agendas, notes, and handouts from the following meetings:
Agenda and notes from the September 27, 2012 task force meeting
Agenda and notes from the December 5, 2012 advisory committee meeting
Agenda and notes from the December 5, 2012 task force meeting
Agenda and notes from the January 16, 2013 task force meeting
Agenda and notes from the February 26, 2013 advisory committee meeting
Agenda and notes from the February 26, 2013 task force meeting
May 15, 2013: Open House ‘agenda’ and poster with adaptation actions
July 15, 2013: Mayor and Council Meeting slide with adaptation actions
Appendix C
Appendix C includes the following:
Table of NFIP CRS activity points and accompanying worksheet
Preparing for Future Flood Risk: Recommended Planning, Regulatory, and Management Options
DNREC’s Floodplain Management and Drainage Standards and worksheet
DNREC’s Floodplain Management and Drainage Standards document
Recommendations for Adapting to Sea Level Rise in Delaware – Executive Summary

ExecutiveSummary
Delaware City, Delaware, is a coastal town with a geographical and historical bond to the Delaware River and Bay. As a result of its proximity to the River, Delaware City has weathered its share of storms and associated storm surge impacts, ultimately resulting in implementation of certain mitigation and adaptation measures. Additionally, Delaware City’s geomorphology (that includes abundant wetlands and creeks) has led to flooding issues, as well as to efforts towards improving and reducing stormwater and drainage problems. As a result of its experiences, its landscape, and its proximity to a tidal body of water, Delaware City is well‐poised to take advantage of an increasing understanding of natural hazard and climate change impacts. Increasing impacts from coastal storms, sea‐level rise, and extreme precipitation events associated with climate change will likely exacerbate known hazards that Delaware City faces today. While these expected changes cannot be prevented, the effects of these events are dependent upon the choices and actions that Delaware City makes over the coming years. Given the current hazards of storms and flooding, and potential future impacts of climate change, the goal of this hazard mitigation and climate adaptation planning project has been to identify existing vulnerabilities, to learn about how they will be exacerbated in the future, and to create community‐vetted strategies to address issues. These strategies, in addition to addressing issues, also aim to improve overall community sustainability and resilience. The project relied on three groups of people for input: a steering committee (comprised of community leaders and officials), an advisory committee (comprised of county and state agency employees and consultants with expertise in hazard mitigation or climate adaptation work), and the general public. The general public was invited to all four steering committee meetings, as well as a public meeting and a presentation at a mayor and council meeting in July 2013. This process has produced the work detailed in this report. The subsequent sections provide further details on the project, the methods used, and the outcomes of the effort. Section 1 focuses on providing a context for this effort, including an overview of Delaware City history, geography, and demographics, as well as details regarding process methodology. Section 2 provides a case for engaging in both hazard mitigation and climate adaptation. Section 3 details the natural hazards assessed. Section 4 focuses on current climate change knowledge, and the impact of climate change on natural hazards. Section 5 outlines Delaware City vulnerabilities as shared by workshop and meeting participants, as well as those evident to the authors as a result of gathering other information. The greatest, most repeatedly‐voiced concern from residents was the vulnerability of Delaware City homes, businesses, and roads to flooding. Section 6 describes the process by which the community task force selected strategies for addressing the concerns detailed in Section 5. Finally, Section 7 provides implementation guidance for these identified strategies. The resulting strategies are as follows:
Evaluate the dynamics of Delaware City’s vulnerability to flood impacts, including city infrastructure and public safety issues. Recommended actions and implementation guidance are included on page 7‐3.
Establish a Community Planning Team to support an ongoing mitigation program for Delaware City. Recommended actions and implementation guidance are included on page 7‐5.

Initiate educational programs to alert residents to community vulnerabilities and heighten awareness of current and future flood risk. Recommended actions and implementation guidance are included on page 7‐7.
Enhance Delaware City’s stormwater drainage capacity, and improve stormwater management planning. Recommended actions and implementation guidance are included on page 7‐9.
Build hazard mitigation and climate adaptation needs into local planning and regulatory actions. Recommended actions and implementation guidance are included on page 7‐11.

1-1
Section 1: Introduction
1.1 Introduction and Core Values
Delaware City is a small town (roughly 1.3 square miles in size) of about 1700 people situated on the
Delaware Bayshore, about 15 miles south of Wilmington, DE. The town consists of residential
neighborhoods, a central commercial district, a historic district, and large swaths of open space (in
addition to numerous water bodies and wetlands). The city stretches for about a mile along the
Delaware River, and much of the community’s heritage – both past and present – is closely connected to
the river, the Chesapeake and Delaware Canal, and adjacent waterways (Institute for Public
Administration, 2008).
Delaware City’s most recent comprehensive plan (2008) reports that the city is dedicated to preserving
characteristics that make the community special, including its walkable layout, architectural assets, mix
of retail use for both tourists and residents, and open space for active and passive recreational activities
(Institute for Public Administration, 2008). Among the goals established and approved by the Planning
Commission are the following: (note – a complete list of Delaware City Planning Commission goals is
available in the 2008 Delaware City Comprehensive Plan)
1. Balance the mix of retail uses so that tourists and residents are each adequately served.
2. Incorporate economic development efforts with historic preservation.
3. Provide sound and affordable housing for residents of all income levels.
4. Preserve Delaware City’s heritage.
5. Provide an adequate supply of open space for active and passive recreational activities.
6. Define and preserve a distinct boundary, or perimeter, around the city through a
planned, undeveloped buffer or greenbelt.
7. Increase the public revenue and protect the community character of Delaware City and
the surrounding area through negotiations with the refinery, in cooperation with the
state and county.
It is evident that residents of Delaware City have great affection for their town. At a meeting on
September 27th, 2012, attendees were asked why they enjoy living in Delaware City, and what makes it
unique. Participants provided the following answers:

1-2
It’s walkable, has historic architecture, and the neighbors are friendly.
If small town America still has meaning, that meaning is here.
There’s a small town feel. Everybody knows each other.
Delaware City Days is a great celebration.
It’s a diamond in the rough.
Perhaps the character of the town can best be summarized by the introductory language of the
Delaware City Main Street website, which reads,
Welcome to Historic Delaware City, where we are tied to the water. Our history, arts and nature
converge along the banks of the Delaware River and C&D Canal. We invite you to be our guest,
come hear our stories, experience our art, and discover our nature (Delaware City Main Street,
2013).
The core goals of the town include the preservation of the historic district and buildings, ensuring that
there continue to be a ‘small town feel,’ and encouraging eco- and historical tourism in the City.
1.2 History, Geography, and Demographics
1.2.1 History
Delaware City has a rich heritage, dating back to 1801, when the first tract of land was purchased on the
future site of the town. Foresighted settler John Newbold learned about plans for a canal being dug to
expedite the journey of ships from the Delaware River to the Chesapeake Bay. With this in mind, he
planned and built a town that would prosper from being positioned at the eastern terminus of the canal.
He began his plans in 1826, and by 1829 Newbold and his sons had built ten houses in the town that
became known as Delaware City (Delaware City Main Street, 2013).
The waterway (known as the Chesapeake and Delaware [or ‘C&D’] Canal) brought prosperity to the
nascent town (Figure 1-1). Delaware City became a hub for shipping, and a railroad was built to connect
surrounding areas to the port (Dobbs, Harendza, Paulus, Ames, & Sheppard, 2003). The town’s
prosperity was reinforced by what has come to be known as the ‘peach boom.’ Led by Mayor Philip
Reybold (who himself owned over 100,000 peach trees), property owners were encouraged to plant and

1-3
sell peaches (Benson & Hoffecker, 2007). Delaware City became renowned for its peaches up and down
the east coast. The peach boom lasted until the 1880s, when a virus-like disease called ‘peach yellows’
decimated Delaware orchards (Kee, 2007). Following this, fishing for sturgeon, shad, and herring proved
lucrative until the Delaware River became too polluted to sustain the fish population (Institute for Public
Administration, 2008).
Figure 1-1. In the locks at Delaware City, circa 1910. Image retrieved from Chesapeake City, MD historic website (Collins, Juergens, & LeGates, 2011).
In the 1919, the company that owned the canal encountered financial difficulties and sold the canal to
the U.S. government. The federal government decided that the canal was too shallow and narrow for
the latest maritime vehicles, and the canal was closed for eight years in order to make improvements.
One of those improvements necessitated shifting the Delaware River port of the canal several miles
south to Reedy Point, cutting out Delaware City entirely (Collins, Juergens, & LeGates, 2011). As the
traffic to Delaware City’s port dwindled and died out, railway service and street car service to Delaware
City also gradually fell away (Dobbs, Harendza, Paulus, Ames, & Sheppard, 2003). Another blow was
dealt to the town in the 1940s, when the nearby Forts of Delaware and DuPont closed their doors. The
forts had provided the town with a steady flow of soldiers, and, therefore, a steady flow of economic
activity (Institute for Public Administration, 2008).

1-4
In 1954, a refinery was constructed in Delaware City by the Tidewater Oil Company. Other heavy
industry came to the area in the years immediately following the opening of the refinery, including
chemical manufacturing companies.
Figure 1-2. Map of Delaware City showing its relationship to adjacent waterways. ‘Downtown’ Delaware City’s street grid can be seen in the dark grey. Map retrieved from http://mapsof.net/uploads/static-maps/delaware_city_map.jpg.
Today, Delaware City continues to strengthen its economic development efforts by focusing on
environmental and historical assets. A nonprofit called Delaware City Main Street is engaged with
making Delaware City’s downtown more vibrant. According to its facebook page, “Main Street
Delaware City is a non-profit organization dedicated to the revitalization of Delaware City as a hub for

1-5
ecotourism, history and the arts (Delaware City Main Street, 2013).” The organization encourages
visitors to shop at the historic downtown, see the town’s historic Italianate architecture of the 1850s,
and visit Pea Patch Island to see Fort Delaware and the island’s heronry and wading bird colonies.
1.2.2. Geography and Land Use
Delaware City is framed by water. The town is bordered on the west by the Dragon Run Creek, on the
south by the pre-1920s eastern terminus of the C&D Canal, and to the north and east by the Delaware
River (Figure 1-2). Other bodies of water dot the land inland of Delaware City, and are associated with
the tidal and non-tidal wetlands of the town.
Figure 1-3. Map of Delaware City’s flood hazard areas as based on the draft FEMA guidance as of May 2013. Areas in purple are 500-year flood zones, light blue are ‘AE’ zones (high risk zones), and orange areas are ‘VE’ zones (‘velocity’ zones, or high risk coastal zones). Flood insurance is mandatory in areas that are light blue or orange.

1-6
Much of Delaware City sits in the 100 year floodplain (Figure 1-3). This means that there is a 1% chance
that this area will flood each year. Delaware City has developed a floodplain ordinance to preserve the
health and well-being of its residents. The floodplain ordinance states that “the identified floodplain
area shall be those areas of the City of Delaware City which are subject to the one hundred (100) year
flood, as shown on the Flood Insurance Rate Map…” (Delaware City, 1993). The ordinance states that it
is unlawful to build in the floodplain area without a permit from the City. It should be noted, though,
that much of Delaware City was developed before the original ordinance (4010A) went into effect in
February 1977. Of the households in Delaware City, 44% are within the 100 year floodplain (Rothrock,
2012).
Delaware City is relatively flat, which contributes to stormwater issues. According to its comprehensive
plan, “Delaware City’s topography is in the 0.3-percent-slope category, which means that it is nearly
level; no area in the city exceeds 50 feet above sea level” (Institute for Public Administration, 2008).
Delaware City sits on mostly clay and swampy soils, which also contributes to its stormwater issues. Clay
soils and swampy soils do not allow for water to percolate downward as well as other soil types. The city
is enclosed by both tidal and non-tidal wetlands (Salisbury State University, 1988).
As a result of the amount of tidal wetlands and waterways, much of the land within Delaware City’s
municipal boundaries is labeled as open space or simply vacant (Figure 1-4). The city’s next largest area
of land use is residential.

1-7
Figure 1-4. Delaware City land use in acreage. Information retrieved from Delaware City's 2008 Comprehensive Plan
Most of the homes in Delaware City’s residential sector are single family detached homes. According to
the most recent American Community Survey, there are 788 total housing units in Delaware City, and
about 131 of them are unoccupied. As shown in Figure 1-5, about a quarter of the homes in Delaware
City were built in the 1970s, while another quarter were built in the 1930s or earlier (U.S. Census
Bureau, 2007-2011).
Figure 1-5. Delaware City housing stock by year structure was built. Data retrieved from http://factfinder2.census.gov/
113.4 52.5 322.7
891.9
1637.3
24.7
4920.9
Land Use in Acreage
Commercial
Industrial
Institutional
Open Space
Residential
Utilities
Vacant
1%
5%
9%
10%
29% 5%
12%
3%
26%
Housing Stock: Year Structure Built
Built 2005 or later
Built 2000 to 2004
Built 1990 to 1999
Built 1980 to 1989
Built 1970 to 1979
Built 1960 to 1969
Built 1950 to 1959
Built 1940 to 1949
Built 1939 or earlier

1-8
Much of Delaware City’s housing stock is historic (Figure 1-6). The preservation of architectural
treasures can be attributed to the town’s difficult economic period following the closure of the canal in
the 1920s. According to the history related in Delaware City’s Clinton Street design guidelines, “the
abruptness of Delaware City’s decline contributed to the preservation of its historic buildings and to the
historic integrity of the town” (Dobbs, Harendza, Paulus, Ames, & Sheppard, 2003). Today, Delaware
City’s architectural heritage is celebrated and the town works hard to further enhance historic
preservation goals.

1-9
Figure 1-6. Age of Buildings in Delaware City, DE, retrieved from the Field Guide to Delaware City Architecture (Ames &
Walker).
1.2.3 Demographics
As of the 2010 Census, Delaware City was home to 1695 people (U.S. Census Bureau, 2010). The
population has increased 16% since the last Census in 2000 (Figure 1-7).

1-10
Figure 1-7. Delaware City population by decade, 1950 through 2010. Data retrieved from Delaware City's 2008 Comprehensive Plan and the 2010 Census.
Delaware City is a predominantly white, early-middle age town, with 83% of the population identifying
as white, and 40.8 being the median age (U.S. Census Bureau, 2007-2011). Of the 1,695 people in
Delaware City, 99 are under the age of 5, and 225 are over the age of 65.
80.6% of Delaware City residents have a high school diploma or higher education (U.S. Census Bureau,
2007-2011).
The median household income is $51,845, and the mean household income is $61,278. 15.1% of all
people in Delaware City fell below the poverty level in 2011 (U.S. Census Bureau, 2007-2011) (Figure 1-
8).
1363 1658
2024 1858
1682 1453
1695
0
500
1000
1500
2000
2500
1950 1960 1970 1980 1990 2000 2010
Year
Delaware City Population by Decade
Population

1-11
Figure 1-8. Delaware City – annual income by number of households. Data retrieved from http://factfinder2.census.gov
1.3 General overview of the project
In late 2011, Delaware Sea Grant became aware of an opportunity to apply for a grant to help a
Delaware community create a hazard mitigation and climate adaptation plan. Delaware Sea Grant was
uniquely prepared for just such a project, as it had recently completed similar work in Lewes, DE only six
months prior. Another organization called ‘The Resiliency Place’ had helped Delaware Sea Grant with
the work in Lewes, and was also interested in continuing to work with Delaware communities on climate
change adaptation.
Since Delaware Sea Grant and The Resiliency Place (TRP) had just worked with Lewes, DE, they were
hoping to work next with a community in northern Delaware. However, the project team members
were not as familiar with Delaware communities in New Castle County as they were with southern
Delaware communities. As a result, DE Sea Grant contacted the Partnership for the Delaware Estuary
(PDE) to become a partner on the project. PDE’s role was to help establish communication with a town
that could have interest in the project, and to generally work alongside DE Sea Grant and TRP. When DE
Sea Grant and TRP asked for towns that might be interested in the project, PDE suggested partnering
with Delaware City, DE.
14
55
108
62 74
127
100 94
23
Annual Income by Number of Households
Number of Households

1-12
Delaware City, DE was suggested as a result of PDE contact with the former head of the Delaware City
Environmental Coalition. The Delaware City Environmental Coalition was anticipated to be a strong
project partner that would help publicize the project in the town and help to bring it through to
completion. After an initial phone conversation with the former head of the Delaware City
Environmental Coalition and the city manager, Richard Cathcart, Delaware City agreed to participate.
DE Sea Grant applied for the grant, and the proposal was funded in May 2012.
The goal of the project was to provide assistance and guidance to Delaware City to develop a plan for
mitigation and adaptation to natural hazards and climate change. The process endeavored to fulfill this
charge by working with a Community Task Force and Advisory Committee to identify the town’s risks
and vulnerabilities, determine the best actions to address current and future risks, and to ultimately
develop strategies tailored to Delaware City to improve its sustainability and resilience to impacts and
hazards. The motivation for the project stemmed from the scientific consensus that coastal communities
in the Mid‐Atlantic currently face threats from natural hazards that may be exacerbated by climate
change impacts, and that creating a positive vision of resilience through an integrated hazard/climate
change process is important locally and regionally.
1.3.1 Project Team
The project team consisted of three members:
Wendy Carey, Coastal Processes/Coastal Hazards Specialist at Delaware Sea Grant
Daniella Hirschfeld, Principal at The Resiliency Place
Sari Rothrock, Watershed Program Specialist at the Partnership for the Delaware Estuary.
These three are referred to in this document as “the project team.”
1.3.2 Community Task Force
At the onset of the project, the former head of the Delaware City Environmental Coalition stepped
down, the Coalition dissolved, and the project team no longer had a dedicated city group to publicize
meetings or a means to attract parties to the project. However, the project team knew that, to be
successful, the project would require public input. In order to ensure that there would be some
representation from the public, the project team invited civically-active Delaware City residents to sit on

1-13
a community task force. Community task force members are defined as individuals that were invited
and that participated in one or more task force meetings or otherwise provided support. Community
task force members were as follows:
Name Affiliation / Title
Dick Cathcart Delaware City Manager
Paul H. Johnson Delaware City Vice-Mayor / City Council Member
Betty Barrett Delaware City Council Member
Stan Green Delaware City Council Member (currently Mayor – 2013)
Carol Schofield Delaware City Planning Commission, Chair
Paul Parets Delaware City Board of Adjustment
Debra Martin Delaware City Historic Preservation Commission, Chair
Kevin Whittaker Main Street Delaware City, Inc., President
Marian Young Main Street Delaware City, Inc., EcoTourism Chair; Brightfields, Inc.
Art Jensen PBF Energy/Refinery Company, Mechanical Reliability Manager
All task force meetings were open to the public, and the public was actively encouraged to attend.
Meetings were publicized in the community newsletter and intermittently through flyers that were
posted in various town locations.
The task force met four times: September 28, 2012, December 5, 2012, January 16, 2013, and February
26, 2013.
1.3.3 Advisory Committee
The project team recognized that it would need outside expertise to better respond to public concerns
and understand the particular needs of Delaware City. It put together a team of people to function as
an advisory committee. Individuals were invited to sit on the advisory committee if they had knowledge
of Delaware City from past projects, or if their department or expertise had direct bearing on the town
or the hazard mitigation and climate adaptation project. Members of the advisory committee are
defined as individuals that were invited and participated in one or more advisory committee meetings.

1-14
Advisory committee members were as follows:
Name Affiliation
Dave Carpenter New Castle County Office of Emergency Management
John Gysling New Castle County Department of Land Use
Kevin Donnelly New Castle Conservation District
Brooks Cahall Delaware DNREC, Division of Watershed Stewardship
Mike Powell Delaware DNREC Flood Mitigation Program, Division of
Watershed Stewardship
Jennifer de Mooy Delaware DNREC Division of Energy and Climate
Susan Love Delaware DNREC Delaware Coastal Management Program
Michael Kirkpatrick DelDOT
Dave Carlson and
Ed Strouse
Delaware Emergency Management Agency
Bill Swiatek and Tamika Graham Wilmington Area Planning Council
Keith Rudy Landmark Engineering/JCM Environmental
Jason Miller U.S. Army Corps of Engineers, Philadelphia District
Legislators Nicole Poore (Senate District 12) and Valerie Longhurst (House District 15) were also invited
to sit on the advisory committee and/or the task force. Although they expressed interest in learning
more about the initiative and participating in meetings and discussions they were unable to attend the
workshops as scheduled.
The advisory committee met twice: December 5, 2012 and February 26, 2013. All advisory committee
meetings were also advertised to the members of the task force, but they were not advertised in the
community newsletter or on flyers.

1-15
1.3.4 List of Meetings and general purpose of each
September 27, 2012: First task force meeting
The purpose of the first meeting was meant to accomplish four things: to introduce the project and the
project team, to learn about the community’s values, to find out about the current hazard mitigation
techniques in the city, and to introduce planning for climate change and natural hazards. The first
meeting was also intended as an opportunity for community members to share thoughts about
Delaware City vulnerabilities.
December 5, 2012: First advisory committee meeting
The purpose of the first advisory committee meeting was to introduce participants to Delaware City. It
was also intended to introduce members to the project, review the impact of Hurricane Sandy, and
educate the committee members about the town’s priority issues. The bulk of the meeting was spent in
discussion and sharing of expertise on the following assets: homes and businesses, roads and
transportation, utilities and support infrastructure, economy and economic development, natural
environment, and public health.
December 5, 2012: Second task force meeting
The second task force meeting was intended to review the take-aways from the first task force meeting,
inform participants of what the project team learned from the first advisory committee meeting, get
reactions to the information that had been provided, and to begin to discuss options for increasing
resilience to hazards.
January 16, 2013: Third task force meeting
The purpose of the third task force meeting was to review best practices and actions for increasing
community resilience, and to populate a list of possible adaptation actions specific to Delaware City.
February 26, 2013: Second advisory committee meeting
The second advisory committee meeting was intended to get feedback from members on the preferred
actions identified by the task force at the January 16th task force meeting. The project team specifically
asked for feedback regarding the feasibility of preferred tools and actions, general reactions to the tools,
and actions that the advisory committee felt was missing.

1-16
February 26, 2013: Fourth task force meeting
The fourth workshop was designed to build off of the outcomes from the first three task force meetings,
as well as the advisory committee’s advice on specific actions. This last task force meeting provided an
opportunity for community members to review the list of specific actions the City can take to address
hazards and vulnerabilities. The workshop focused on a discussion of factors such as time-frame, cost,
integration with existing priorities, political support, and community support to determine near-term,
medium-term, and long-term activities that were feasible for Delaware City.
April 24, 2013: Meeting of the project team and city manager
Wendy Carey and Sari Rothrock met with city manager Dick Cathcart to review the finalized list of
strategies and phasing.
May 15, 2013: Public engagement session intended to present process findings and relevant information
to the public, and to receive input on one of the strategies derived from the process.
July 15, 2013: Mayor & Council Meeting
Wendy Carey and Sari Rothrock attended the July 15th Mayor and Council meeting to present on the
strategies that emerged from the process, to propose the creation of a resolution by the City to endorse
the findings of the process, and to thank the City for its participation.
Notes and outcomes from all meetings can be found in Appendix B of this document.

1-17
1.4 Works Cited
Ames, D., & Walker, V. (n.d.). Field Guide to Delaware City Architecture. Newark: Center for Historic
Architecture & Design, University of Delaware.
Benson, D. B., & Hoffecker, D. C. (2007). The Delaware Adventure. Layton: Gibbs Smith.
Collins, L., Juergens, R., & LeGates, D. (2011). Delaware City, DE. Retrieved May 24, 2013, from
Chesapeake City, MD (and other nearby areas of interest):
www.cecilhistory.org/chesapeakecity/Delaware%20City/Delaware%20City.html
Delaware Audubon. (2007, October 4). 20-Year Court Battle Against Texaco Ends; Oil Giant Held
Accountable. Retrieved May 28, 2013, from Delaware Audubon:
http://www.delawareaudubon.org/conservation/oct07texacosettlement.html
Delaware City. (1993, April 16). Chapter 48: Flood Plain. Delaware City Code. Delaware City, DE.
Retrieved May 21, 2013, from
http://delawarecity.delaware.gov/files/2013/03/ch48floodplain.pdf
Delaware City Board of Health. (2012, October 12). Delaware City Board of Health, Wednesday, October
12, 2012. Retrieved 28 2013, May, from Delaware City Board of Health Meeting Minutes:
http://delawarecity.delaware.gov/files/2013/05/121010bohminutes.pdf
Delaware City Main Street. (2013). Delaware City Main Street. Retrieved May 28, 2013, from
Facebook.com: https://www.facebook.com/DelawareCityMainStreet
Delaware City Main Street. (2013). Visit & Learn. Retrieved May 24, 2013, from Delaware City Main
Street: http://www.delawarecitymainstreet.com/visit/visit-learn.html
Delaware Department of Natural Resources and Environmental Control. (2012, November). 2011 Data
Summary. Retrieved May 28, 2013, from Delaware Toxic Release Inventory:
www.dnrec.delaware.gov/SERC/TRI%20Reports/2011%20TRI%20Summary%20Report.pdf
Delaware Sierra Club. (2013, March 27). Delaware City Bucket Brigade. Retrieved May 28, 2013, from
Sierra Club: Delaware Chapter: http://delaware.sierraclub.org/bucket
Dobbs, K. W., Harendza, H., Paulus, E., Ames, D. L., & Sheppard, R. J. (2003). Historic Design Standards
for the Clinton Street Historic Commerical District. Newark: Center for Historic Architecture &
Design, University of Delaware.
Environmental Protection Agency. (2012, November). Delaware City Clean-ups. Retrieved May 28, 2013,
from EPA.gov: http://www.epa.gov/reg3wcmd/ca/de/kml/decity-v1.kml

1-18
Institute for Public Administration. (2008). Delaware City Comprehensive Plan. Newark: University of
Delaware.
Kee, E. (2007). Delaware Farming. Charleston: Arcadia Publishing.
Montgomery, J. (2013, April 28). Progress reported in cleaning up Delaware's largest Superfund site. The
News Journal, p. 3. Retrieved May 28, 2013, from
www.delawareonline.com/article/20130429/NEWS08/304290034/Progress-reported-cleaning-
up-Delaware-s-largest-Superfund-site
Rothrock, S. (2012, December 5). Advisory Committee Meeting. 1. Delaware City, DE.
Salisbury State University. (1988, March 22). State Regulated Wetland Map Index, Map 344. Retrieved
May 28, 2013, from Delaware Wetlands:
www.dnrec.delaware.gov/Admin/DelawareWetlands/Pages/Wetlands-Maps.aspx
U.S. Census Bureau. (2007-2011). 2007-2011 American Community Survey. U.S. Census. Retrieved May
21, 2013, from http://factfinder2.census.gov/
U.S. Census Bureau. (2010). Delaware City, DE: Profile of General Population and Housing
Characteristics: 2010. 2010 Census. Retrieved May 21, 2013, from http://factfinder2.census.gov/
U.S. Department of Justice. (2005, September 20). Motiva Enterprises Settles Federal-State Lawsuit
Resulting from Explosion at Delaware City Refinery. Retrieved May 28, 2013, from Department
of Justice: www.justice.gov/opa/pr/2005/September/05_enrd_488.html
U.S. Environmental Protection Agency. (2012, October 10). Delaware City Refinery (Formerly: Motiva
Enterprises). Retrieved May 28, 2013, from US EPA: Mid-Atlantic Corrective Action:
http://www.epa.gov/reg3wcmd/ca/de/pdf/ded002329738.pdf

2-1
Section 2: Why Plan to Mitigate Natural Hazards and Adapt to Climate Change
Delaware City, Delaware, is vulnerable to many natural hazards including coastal storms, flooding, and
high winds. With the climate changing and thus increasing the threats from natural hazards, the City is
becoming increasingly vulnerable. Because of its proximity to the Delaware River and adjacent
waterways, the community is exposed to flood hazards related to tidal flooding and intense rainfall
events, as well as related stormwater and drainage issues. In fact, a flood mitigation plan developed by
Duffield Associates (2000) concluded that nearly 49% of the City is within the FEMA 100-year (1 percent
chance) floodplain. Additionally, a sizable portion of the City would be inundated at the 10-year flood
level, including roads and bridges leading in and out of the City (Duffield Associates, 2000).
Alterations in the earth’s atmosphere are resulting in changes in climate. There are many indications
that these changes are already underway: temperatures are rising, glaciers are retreating, snowpack is
disappearing, spring is arriving earlier, and sea levels are rising. These changes will affect Delaware City
in a number of ways, and the community is facing new risks. Temperature increases will lead to more
heat waves, while shifting precipitation patterns and rising seas will result in increased flooding. While
these changes cannot be prevented, the effects of these events are dependent upon the choices and
actions that Delaware City makes today.
Given these known natural hazard risks and the ever-increasing certainty of climate change impacts,
there are a number of reasons for municipalities to proactively mitigate natural hazards and adapt to
climate change. First, today’s choices will shape tomorrow’s communities and determine how
vulnerable or resilient a community will be. Therefore, since a role of local governments is to provide a
safe and sustainable home for its citizens, it is imperative that communities take action today to
mitigate natural hazards and adapt to climate change as this will help provide a strong and resilient
community in the future. Additionally, due to the fact that significant time is required to motivate,
develop adaptive capacity, and to implement changes, acting now will allow for the time needed to
achieve these long-term goals.
Another major reason to begin enhancing Delaware City’s hazard mitigation efforts with climate change
adaptation is that proactive planning is often more effective and less costly than reactive planning, and

2-2
can provide immediate benefits. Moreover, significant cost savings can be seen through hazard
mitigation efforts. According to the National Institute of Building Sciences, on average, every dollar
spent by FEMA on natural hazard mitigation resulted in four dollars of future benefits (National Institute
of Building Science, 2005). Delaware City is already doing a number of things to mitigate natural
hazards, and it is generally thought that climate change adaptation planning will lead to actions that
have multiple co-benefits and are cost-effective as well. By using existing authority and modifying
policies and programs that are already in place, local governments can address many of the risks posed
by a changing climate to create a more prosperous future.
Finally, climate change impacts are projected to get worse in the coming years; therefore, acting today
will help prepare Delaware City for these impacts. By gathering further knowledge about the City’s
vulnerability, creating an engaged and committed community and by taking proactive steps to reduce
the community’s vulnerability, Delaware City will be ready for the increased threats that climate change
poses to its natural hazard risks.

3-1
Section 3: Current Natural Hazards – New Castle County and Delaware City
3.1 Identification of Current Natural Hazards
New Castle County, Delaware, is vulnerable to a wide range of natural hazards, including flooding,
tornadoes, tropical systems, winter storms, and earthquakes. These hazards have the potential to
damage or destroy both public and private property and disrupt the local economy and overall quality of
life (New Castle County All Hazard Mitigation Plan (NCCAHMP), 2010). While the threat posed by
natural hazards cannot be fully eliminated, there are many steps a community can take to reduce the
potential impact of these hazards on citizens and structures alike.
A first step towards building community resilience is to recognize and identify natural hazards and the
potential impact of these hazards on all community sectors. Natural hazards impact every element of a
community, from residents and individual homes, to businesses and natural resources, to city buildings
and associated services.
3.1.1. New Castle County – Hazard Identification
The New Castle County All Hazard Mitigation Plan (2010) identified nine natural hazards that have the
greatest potential to adversely affect the people,
property, economy, and environment of New
Castle County. In order of overall risk ranking,
these natural hazards include: coastal flood,
riverine flood, hurricane wind, earthquake, winter
storm, severe thunderstorm, extreme
temperatures, tornado, lightning, hail, and
drought (Figure 3-1; NCCAHMP, 2010). Some
hazards (like severe thunderstorms) can cause
related hazards (like lightning). Other hazards are
even more interrelated (like flooding, which is
dependent upon the interactions of multiple other
hazards.) A synopsis of the primary hazards and the
risks they pose is included in Section 3.2 below.
Figure 3-1. Overall risk ranking for New Castle County, Delaware (New Castle County All Hazard Mitigation Plan, 2010).

3-2
During the Delaware City hazard mitigation and climate adaptation project process, the Community Task
Force engaged in a vulnerability self-assessment to identify specific hazards of concern to the
community. These community-identified specific hazards of concern are described and addressed in
Section 6 of this report.
3.2 Overview of Natural Hazards in Delaware City
3.2.1 Flooding
Not only is flooding the most frequent and costly natural hazard in the United States (NCCAHMP, 2010),
but it has also been identified as a primary hazard of concern in Delaware City. Delaware City is subject
to the threat of flooding from two sources: 1) inland flooding associated with intense rainfall, and 2)
coastal flooding associated with high tides, storm surge, and wind-driven waves during coastal storm
events (tropical systems and northeasters).
Inland flooding is generally related to excessive precipitation, run-off, and infiltration factors that are
affected by general topography, drainage features, stormwater facilities, and elevation of structures and
roadways relative to the floodplain throughout Delaware City. Coastal flooding is caused by high tides
and storm surge from coastal storm events such as northeasters and tropical systems (described below).
Both coastal and inland flooding are not only threats to human life, but can also cause extensive damage
to property.
In general, there are two types of inland flooding – riverine flooding and flash flooding. Riverine
flooding occurs from heavy rains and excessive run-off volumes within the watershed of a stream or
river. In extreme cases, riverine floods can last a week or more. Flash flooding occurs in creeks,
streams, and urban areas within a few minutes or hours of excessive rainfall. The type of heavy rainfall
that causes flash flood conditions can result from slow-moving thunderstorms or heavy precipitation
associated with tropical systems. Rapidly rising water can reach heights of 10 feet or more and flood
waters move at very high speeds. Flash flooding occurs in natural waterways but is also common in
urbanized areas with impervious surfaces. Urban flooding causes problems when storm drains become
overwhelmed or clogged by debris and may be exacerbated in areas where development has impacted
or restricted stream flow and increased impermeable surfaces.

3-3
At first glance, the link between inland flooding and coastal storms may not be obvious. However,
torrential rainfall (6 inches or more of precipitation) typically accompanies tropical storm systems and
can produce deadly and destructive flooding. Both tropical systems and northeasters can bring rain in
large volumes and long duration, which may cause extensive flooding in both coastal and non-coastal
areas. Typically, greater rainfall amounts and flooding are associated with tropical systems that have a
slow forward speed or stall over an area. This is a major threat to inland areas in Delaware and all
Delaware City residents should be aware that the impact of coastal storms is not limited to shorelines
but can be widespread throughout the community.
Flooding in Delaware City has two primary causes: drainage issues and tidal effects (Duffield Associates,
2000). Drainage-related flooding is usually associated with rainfall events, but may also be linked to
coastal storms and tidal flooding. Historically, Delaware City residents have reported incidents of
drainage problems, as well as street and yard flooding multiple times each year.
Duffield Associates (2000) reports that there are several potential factors contributing to drainage issues
and associated street and yard flooding in Delaware City. The existing method of runoff collection and
conveyance for a majority of the City is comprised of “a drainage system composed of elements of
varied ages, materials, and construction methods providing insufficient capacity to adequately convey
runoff associated with frequent storm events” (Duffield Associates, 2000, pg 3-1).
Because of its proximity to the Delaware River, tidal flooding is recognized as presenting the greatest
potential for damage to Delaware City. Information about historic tide heights are available from
Delaware River tide gauges. The National Oceanic and Atmospheric Administration (NOAA) currently
operates two tide gauges in the vicinity of Delaware City, including the Reedy Point gauge and the
Delaware City gauge. The Reedy Point gauge (Station ID: 8551910) has been collecting data since 1956,
and is located on the Corps of Engineers pier east of the bridge, on the south side the C&D Canal. The
Delaware City tide gauge (Station ID: 8551762) was established in October 2001, and is located on the
Delaware River adjacent to the Delaware Refinery fuel docks.
The NOAA Tides and Currents website (http://tidesandcurrents.noaa.gov/index.shtml) provides
information on tide/water levels, tide predications, meteorological observations, and historic tide data

3-4
for these (and other) tide gauge stations. A summary of extreme high tide levels over the past ten years
for the Reedy Point and Delaware City tide gauges is included in Tables 3-1 and 3-2 below.
Tables 3-1 and 3-2. Tide level data for Reedy Point (left) and Delaware City (right), Delaware – Maximum tide levels from 2000-2010. Historic tide data retrieved from NOAA NOS (http://tidesandcurrents.noaa.gov/).
Many of the record tides over the past decade have been related to coastal storms – either tropical
systems (hurricanes, tropical storms, or tropical depressions), or northeasters. In fact, Duffield
Associates (2000) reviewed the “Top 50” high tides recorded at the Reedy Point gauge from 1956
through 1999, and determined that thirteen (or 26%) of the fifty highest recorded tides were attributed
to northeasters, while the “Top 50” identifies four peak measurements associated with hurricanes, and
one for a tropical storm. This suggests that there is a greater likelihood, in any given year, for Delaware
City to experience a flood caused by a northeaster rather than a hurricane.
3.2.2 Coastal Storms – Tropical Systems and Northeasters
Delaware City can be affected by both tropical systems and extratropical systems (often called
northeasters). Tropical systems, which include tropical depressions, tropical storms, and hurricanes,
have strong winds circulating around a well-defined center and generally originate in the warm waters
Maximum Tide Levels from 2000-2010 for
Reedy Point, Delaware (Station #8551910)
Rank Recorded Tide Level
MLLW (feet)
Date
1 9.23 4/16/2011
2 9.17 12/21/2012
3 9.10 10/30/2012
4 8.65 9/19/2003
5 8.32 5/12/2008
6 8.23 10/30/2012
7 8.03 4/2/2005
8 8.02 8/28/2011
9 8.00 3/29/2010
10 7.96 9/29/2011
Maximum Tide Levels from 2000-2010 for
Delaware City, Delaware (Station #8551762)
Rank Recorded Tide Level
MLLW (feet)
Date
1 9.74 10/30/2012
2 9.48 12/21/2012
3 9.38 4/16/2011
4 9.13 5/12/2008
5 8.83 8/28/2011
6 8.71 9/19/2003
7 8.42 6/5/2012
8 8.38 3/13/2010
9 8.38 10/30/2012
10 8.27 4/19/2007
3-5
of the Atlantic Ocean, Caribbean Sea, or Gulf of Mexico. Extratropical systems develop outside the
tropics and typically result from development of one or more low pressure systems, with winds blowing
from the northeast as the storm passes by the coast. While the season for tropical systems runs from
June 1 through November 30, northeasters are a year-round threat to coastal Delaware and Delaware
City.
Tropical systems. Tropical storms are a type of tropical system characterized by sustained winds
averaging from 39 to 74 miles per hour (mph). When sustained winds intensify to speeds greater than
74 mph, the resulting tropical system is called a hurricane. Since records have been collected, the State
of Delaware has never experienced a direct hit by a hurricane, but tropical systems (including tropical
depressions, tropical storms, and/or hurricanes) have passed over and near Delaware annually, usually
accompanied by high waves, high tides, and heavy rainfall.
Northeasters or extratropical systems. While not as powerful in terms of wind speeds as hurricanes,
northeasters occur more frequently in Delaware. Because they cover a larger area and are typically slow
moving storms, northeasters usually affect a large portion of the coast and exert significant impacts on
beaches, dunes, buildings and roads over several successive tides. Northeasters are most damaging
when they stall off the coast, as is evidenced by the coastal storm of record in Delaware – the March
1962 storm.
Coastal storm impacts. Although the origins of these storms differ, tropical systems and northeasters
share many characteristics, and their impacts on the coast can be similar. Both types of storms are
characterized by strong winds, high waves and storm surges causing higher storm tides. High winds can
blow shingles off roofs, and knock down trees and power lines. Large objects can be lifted and blown
through the air, thus becoming hurling projectiles and causing additional destruction. The effect of
torrential rainfall that accompanies these storms often includes overtopping of creeks, streams and
rivers, as well as flooding of roadways and homes. High waves, tides and storm surge result in extensive
flooding of low-lying coastal areas. Structural debris that ends up in the turbulent water can act as
battering rams, increasing the amount of damage done to buildings, particularly foundations.
History of coastal storms in the vicinity of Delaware City. Historical data indicate that both tropical
systems and northeasters have caused significant damage in Delaware City. Much of the specific hazard

3-6
information has been gathered from a report completed in 2000 by Duffield Associates for Delaware
City - A Flood Mitigation Plan for the City of Delaware City – as well as the 2010 New Castle County All
Hazard Mitigation Plan.
As noted above, Delaware City is most susceptible to
flooding caused by northeasters. Historically,
northeasters have resulted in the heaviest rainfalls,
highest tides, and most significant damage to the coast.
These slow-moving storms allow ocean tides and storm
surge to cause water levels to rise in Delaware Bay and
adjacent tributaries. Rising water levels in waterways
such as Dragon Run results in flooding of low-lying areas
and could potentially cause significant damage to
Delaware City. Although tropical storms and hurricanes
are less likely to cause impacts, they possess the potential
to cause significant damage to coastal areas.
The New Castle County All Hazard Mitigation Plan
includes a list of coastal storms and flood events that
have significantly impacted people, property, and the
environment in New Castle County over the past several
decades (NCCAHMP, 2010). Several coastal storms and
flood events that have impacted the vicinity of Delaware
City are listed below:
Hurricane Hazel (October 1954) – Hurricane
Hazel resulted in seven deaths in Delaware, and
caused widespread wind-related damage on the
Delmarva Peninsula. Extreme tides associated with Hurricane Hazel were reported to be three
to four feet high on building walls in Port Penn (Duffield Associates, 2000).
Figure 3-3. March 1962 – widespread flooding in Delaware City – lower end of Clinton Street facing Sterling’s Café (Photo courtesy Cordelia Bennett).
Figure 3-2. March 1962 – widespread flooding in Delaware City – lower end of town, Washington Street to Clinton Street (Photo courtesy Cordelia Bennett).

3-7
Northeaster (March 1962) – From March 6-8, 1962, a severe northeaster impacted the entire
state of Delaware, resulting in seven deaths and $50 million in damage. Photographs of
widespread flooding in Delaware City are shown in Figures 3-2 and 3-3. It should be noted that
neither the steel bulkhead nor the sea walls in Battery Park were in-place at the time of this
storm. It’s been reported that since these seawalls were constructed, tidal flooding from the
Delaware River has not occurred in this
downtown area in the vicinity of Clinton
and Washington Streets.
Hurricane Agnes (June 1972) – Agnes
caused record flooding in Mid-Atlantic
States, including Delaware. Although the
Reedy Point tide gauge was not
operational during the 1954 and 1972
hurricanes, historical accounts and high
water marks left on building provide
evidence of the widespread damage
they caused throughout New Castle
County and Delaware City (Figure 3-4).
Northeaster (October 1980) – The
northeaster of October 25, 1980,
resulted in significant flooding of
downtown Delaware City. Newspaper
accounts report that Clinton,
Washington, Front, and Second Streets
were inundated with several feet of
water (Figure 3-5). Several townsfolk
required rescue when the water began
overtopping stoops of shops on Clinton
Figure 3-4. June 1972 – Hurricane Agnes resulted in flooding throughout Delaware City (Photo courtesy Cordelia Bennett).
Figure 3-5. The October 1980 northeaster caused significant flooding in downtown Delaware City (Image courtesy of The News Journal, October 26, 1980).

3-8
Street and entered into the first floors of buildings (Duffield Associates, 2000; The News Journal,
October 26, 1980).
Northeasters (December 1992, November 1993, March 1994) – These northeasters caused
serious flooding in Delaware City and included overtopping of the Canal banks along Canal
Street and other areas of town (Figures 3.6 and 3.7).
Hurricane Floyd (September 1999) – Floyd was a fast-moving hurricane that became a tropical
storm just before reaching the Delmarva Peninsula. Floyd brought wind gusts of approximately
sixty miles per hour, and large amounts of rainfall that caused severe flooding throughout New
Castle County. Because Floyd passed by Delaware City during the low tide, the community was
spared the full impact of
storm surge. However, severe
tidal flooding did occur in
residential areas adjacent to
Dragon Run (Figure 3-7).
Although flooding occurred in
Delaware City from torrential
rainfall, widespread damage
did not occur as it did in other
communities such as Glennville in New Castle County. Statewide, Hurricane Floyd caused a total
of $8 million in property damage, along with two fatalities – the first hurricane-related deaths in
Figure 3-7. Extensive flooding along Canal Street and other areas of town occurred during the December 1992 northeaster (Photos courtesy Cordelia Bennett).
Figure 3-6. Tidal flooding along Dragon Run during Hurricane Floyd in 1999 (Photo courtesy J. Jenkins).

3-9
the state since Hazel in 1954.
Tropical Storm Isabel (September 2003) – Tropical Storm Isabel caused not only flash flooding
from heavy rains, but also produced strong winds, and tidal flooding up Delaware Bay. Isabel’s
track west of Chesapeake Bay resulted in flooding along coastal areas all the way into New
Castle County. Rivers and streams in New Castle County flooded from both the heavy rain
(inland flooding) and from the storm surge of approximately 5 feet (tidal flooding).
Northeaster (May 12, 2008) – Two low pressure systems combined as this storm strengthened
rapidly, and a strong northeasterly wind developed and persisted through the evening of May
12th. The prolonged northeast flow combined with higher than normal tides, causing widespread
minor to moderate tidal flooding along the coast of Delaware. It was reported that downtown
Delaware City (New Castle County) flooded at high tide, which took place from 5:30 AM to 6:00
AM EDT on the 12th. Locations that were impacted by flooding included the first blocks of
Clinton and Washington streets, as well as around the entrance to the trailer park. The high tide
also caused damage to the Delaware City Park off of Clinton Street as the waves tore up some of
the brick sidewalk along the sea wall.
Coastal Flood (April 16, 2011) – A strong southeast wind up the Delaware Bay and River
combined with 1) already high astronomical tides associated with the full moon, and 2) fresh
water runoff from heavy rain to produce severe tidal flooding along the Delaware River and tidal
sections of its tributaries in New Castle County. The strong southeast winds persisted and
reached peak levels as the high tide was working its way up the Delaware Bay and River. The
high tide at Reedy Point established an all-time record high of 9.23 feet above mean lower low
water. In Delaware City, tidal flooding occurred along both the Delaware River and the C&D
Canal. Flooding was reported in the vicinity of the 5th Street Bridge. Approximately five homes in
that vicinity had knee-deep flood waters into their first floor. Flood waters surrounded homes in
the mobile home park off of 7th Street.
Tropical Storm Irene (August 28, 2011) – Tropical Storm Irene produced moderate to severe
coastal flooding and beach erosion, caused two flood-related deaths, and forced evacuations of
approximately 100,000 people from the Atlantic coast. Event precipitation totals averaged 5 to

3-10
12 inches, and caused widespread and, in some instances, record breaking flooding. The storm
surge of 3 to 4 feet caused minor to moderate tidal flooding along tidal sections of the Delaware
River and upper Delaware Bay.
Flash Flood (June 22, 2012) – Thunderstorms with very heavy downpours produced localized
flash flooding in New Castle County. Associated torrential downpours caused poor drainage and
small creek flash flooding in and around Delaware City.
Hurricane Sandy (October 30, 2012) – Sandy caused an estimated $5.5 million dollars of damage
in Delaware, including $2.8 million in New Castle County which was the hardest hit county in the
state. Damages were due in part to inland flooding caused by excessive rainfall, as up to 10
inches of rain were reported. In addition, high winds resulted in many trees and wires coming
down statewide. This created 100,000 power outages and resulted in many road closures due to
downed trees and flooding. Prior to Sandy’s arrival, Governor Markell declared a State of
Emergency and ordered a mandatory evacuation of 50,000 coastal residents in areas three
quarters of a mile from the shoreline and other low-lying coastal communities in Sussex, Kent,
and New Castle Counties. In New Castle County, evacuations occurred as far north along the
Delaware River as the southeast part of Wilmington. Approximately 35 roads were closed
because of flooding or high wind, with most of them near the Delaware Bay including Delaware
State Route 9. The storm surge averaged 4-
5 feet in the upper Delaware Bay and lower
tidal Delaware River, and the record high
tide at Delaware City reached 9.74 feet
above mean lower low water.
Low pressure system (December 21, 2012)
– A deep low pressure system and
associated cold front swept through the
Mid-Atlantic region and across Delaware
during the early morning of December 21,
2012. In addition, a secondary area of low
pressure formed along the frontal boundary, west of Delaware Bay, and deepened rapidly.
Figure 3-8. In December 2012, strong southeast winds combined with high tides to cause major tidal flooding in the vicinity of Solomon’s Place and Monroe Street (Photo courtesy Jon Beeson).

3-11
These systems produced a strong southeasterly flow over the region that resulted in peak
southeast wind gusts up to 60 miles per hour at the New Castle County Airport. The wind
damaged trees, tree limbs, and knocked down power lines. Moderate to heavy rain fell across
the state, with storm totals ranging between 1 to 3 inches. This rain resulted in minor to
moderate flooding of creeks and rivers in northern Delaware. In addition, the significant
southeast flow allowed water to pile up along the Delaware Coast and into the Delaware Bay,
producing major coastal flooding at the time of high tide on the morning of the 21st. The
magnitude of tidal flooding increased northwestward through the Delaware Bay into tidal
sections of the Delaware River, causing major tidal flooding to occur at Reedy Point and
Delaware City (Figure 3-9).
Figure 3-9. Without much warning, the December 2012 weather event resulted in extensive flooding and property damage at Solomon’s Place and Monroe Street (Photos courtesy Jon Beeson).

3-12
3.2.3 Wind
According to NOAA’s National Climatic Data Center (NCDC, 2013), 91 strong-wind storm events were
reported in New Castle County between January 1996 and April 2013. Strong winds can result in
significant damage to structures and can cause power outages due to downed trees and tree limbs.
Strong to high winds can be caused by many meteorological events, including winds associated with the
movements of fronts through the area, high or low pressure systems, and the pressure gradient or
difference between high- and low pressure systems. Damaging winds can also be associated with
thunderstorms and tornadoes. Straight-line winds associated with severe thunderstorms can exceed
125 mile per hour and are responsible for most thunderstorm damage.
Destructive winds may also be associated with coastal storm events. Severe wind events resulting from
hurricanes, tropical storms and nor’easters can cause widespread damage and loss life, as evidenced by
the numerous coastal events that have impacted the State of Delaware. Although Delaware has not
experienced a direct strike from a major hurricane in more than two decades, Delaware has experienced
the effects of as many as 14 hurricanes and at least one significant tropical storm since the 1920s.
Historical evidence shows that the State of Delaware is vulnerable to hurricane and tropical storm-force
winds.
3.2.4 Earthquake
The Delaware Geological Survey (2013) reports that 59 earthquakes have impacted the State of
Delaware during a period from 1638 through 2009. The largest event occurring in Delaware happened in
1871 and had an estimated magnitude of 4.1. The largest recorded event in Delaware occurred in 1973
and had an estimated magnitude of 3.8. More recently, in August 2011, a magnitude 5.8 quake,
centered in Virginia, was felt from northernmost New Castle County to coastal and inland Sussex
County. Many Delaware residents reported moderate building shaking and movement, or shaking of
furniture.
In 1997, Delaware was reclassified from being a low seismic-risk state to being a medium seismic-risk
state by FEMA and the U.S. Geological Survey. While New Castle County has felt earthquakes every so
often, none have been significant enough to cause any damage for well over 100 years. The coastal plain

3-13
of the Mid-Atlantic is a seismically-quiet zone. However, if a serious earthquake were to occur, the
losses would likely be significant.
3.2.5 Winter Storms
Delaware City may be impacted by winter storms that bring snow and ice to the area. Records from the
National Climatic Data Center (NCDC, 2013) indicate that New Castle County has recently experienced
storms that have deposited heavy snow. In February 2010, a major winter storm dropped 15 to 25
inches of snow across most of Delaware. The 25.8 inches of snow that fell at New Castle County Airport
was the largest single snowfall event on record breaking the previous record of 22.7 inches set during
the blizzard of January 1996.
Winter storm events in coastal areas throughout Delaware are likely to produce not only snow, but
other forms of winter precipitation, including sleet, ice pellets and freezing rain. Sleet, or rain that
freezes into ice pellets before reaching the ground, can accumulate like snow to cause hazardous road
conditions. Freezing rain is rain that falls onto a frozen surface, forming a coating of ice. Even minor
accumulations of ice can cause significant hazards to roadways, power lines, and trees.
Ice and snow events in Delaware City can cause a variety of problems including electrical/utility system
disruptions, transportation disruptions, and secondary hazards to businesses and homeowners.
3.2.6 Severe Thunderstorms
Though thunderstorms typically impact a small area, they can be extremely dangerous due to their
ability to generate tornadoes, hailstorms, strong winds, flash flooding, and damaging lightning. These
storms can move through an area very quickly or linger for several hours, with longer duration resulting
in the possibility of excessive precipitation and increased likelihood of flash floods.
Based on information provided by the 2010 New Castle County All Hazards Mitigation Plan and the
National Climatic Data Center (NCDC, 2013), New Castle County experienced 275 thunderstorm high
wind events for the period January 1950 through April 2013. These events resulted in three (3) deaths,
four (4) injuries and a total of approximately $11.367 million in property damage (NCDC, 2013). The total
estimated annualized losses for the county equal $1,122,247 (NCCAHMP, 2010).

3-14
A specific report for Delaware City was recorded for a thunderstorm that occurred in July 2008. With
winds gusting to 57 mph, a severe thunderstorm downed trees in and around Delaware City. These
fallen trees damaged two homes. The storm caused outages to approximately 9,000 homes and
businesses in New Castle County. Marble-sized hail (half inch) was reported in Bear, Delaware.
3.2.7 Extreme Heat/Drought
An extreme heat condition is commonly identified when prolonged temperatures are greater than or
equal to 10 degrees above the average high temperature for a region. Periods of extreme heat in
Delaware are often accompanied by high humidity. Extreme heat can cause medical problems and pose
significant risks to humans, especially the elderly, young children, and to persons with respiratory
difficulties. Studies have shown that a significant rise in heat-related illness occurs when excessive heat
persists for more than two days. Livestock, pets, and vegetation are also vulnerable to heat effects.
Delaware City is especially susceptible to extreme summer weather resulting from very high
temperatures and humidity. According to the National Climatic Data Center, New Castle County has
experienced 20 excessive heat occurrences from January 1996 through April 2013 (NCDC, 2013).
Drought conditions are the result of extended periods of limited precipitation. Human activities, high
temperatures, high winds, and low humidity can worsen drought conditions and may also make areas
more susceptible to wildfires. Periods of drought can have significant negative impacts on agriculture,
water reservoir levels, surface and groundwater supplies, and any water-dependent resources or
products. According to the National Climatic Data Center, the State of Delaware has experienced 55
reported droughts and/or periods of unseasonably dry weather from 1950 through April 2013, most of
which affected the entire forecast zone of New Castle, Kent and Sussex Counties (NCDC, 2013).
3.2.8 Tornadoes
Tornadoes most often result from the intersection and interaction of cool dry air as it overrides warm
moist air, causing the warm air to rise rapidly. These conditions are also associated with extreme
thunderstorms, so it follows that tornadoes are often generated by thunderstorms, including those
associated with tropical systems such as hurricanes. With wind speeds ranging from 40 mph to more
than 300 mph, tornadoes can cause fatalities and devastate neighborhoods in seconds.
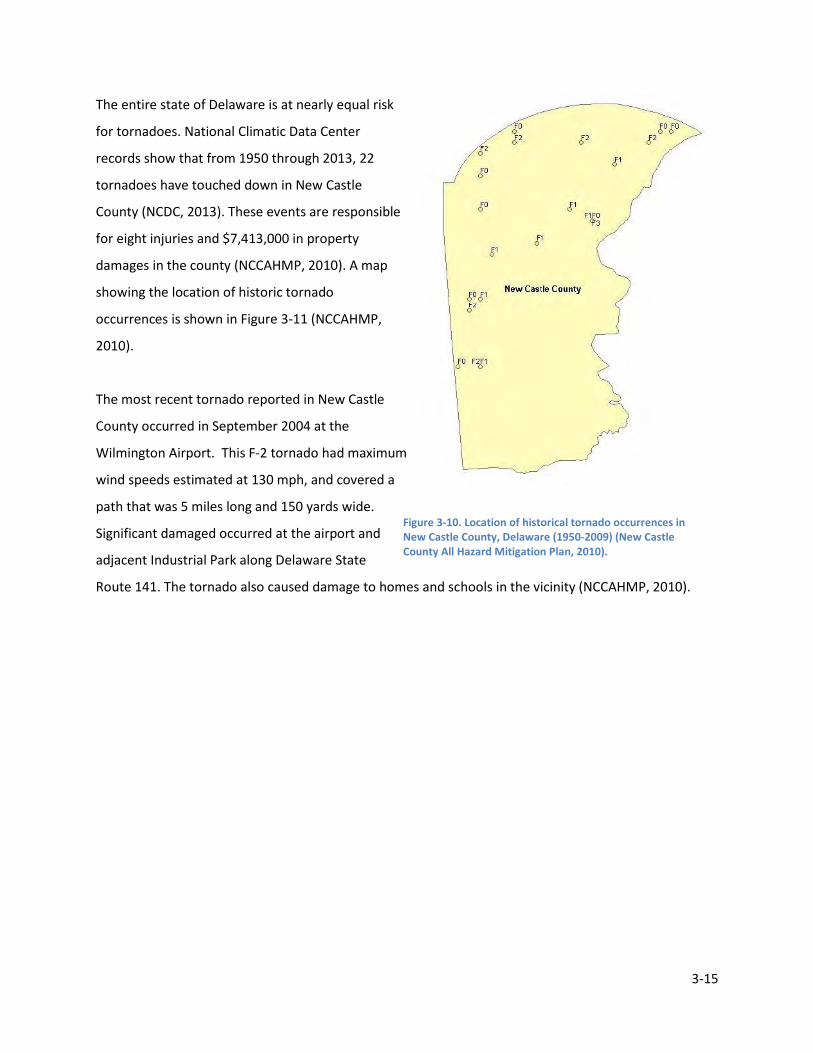
3-15
The entire state of Delaware is at nearly equal risk
for tornadoes. National Climatic Data Center
records show that from 1950 through 2013, 22
tornadoes have touched down in New Castle
County (NCDC, 2013). These events are responsible
for eight injuries and $7,413,000 in property
damages in the county (NCCAHMP, 2010). A map
showing the location of historic tornado
occurrences is shown in Figure 3-11 (NCCAHMP,
2010).
The most recent tornado reported in New Castle
County occurred in September 2004 at the
Wilmington Airport. This F-2 tornado had maximum
wind speeds estimated at 130 mph, and covered a
path that was 5 miles long and 150 yards wide.
Significant damaged occurred at the airport and
adjacent Industrial Park along Delaware State
Route 141. The tornado also caused damage to homes and schools in the vicinity (NCCAHMP, 2010).
Figure 3-10. Location of historical tornado occurrences in New Castle County, Delaware (1950-2009) (New Castle County All Hazard Mitigation Plan, 2010).

3-16
3.3 Works Cited
Delaware Geological Survey, 2013. Overview of Earthquakes in Delaware. Information accessed on-line
in July 2013 at: http://www.dgs.udel.edu/delaware-geology/overview-earthquakes-delaware.
Duffield Associates, 2000. A Flood Mitigation Plan for the City of Delaware City. Prepared for the City of
Delaware City, Delaware by Duffield Associates.
National Climatic Data Center (NCDC), 2013. NOAA NCDC severe weather database accessed on-line in
July 2013 at: http://www.ncdc.noaa.gov/data-access/severe-weather.
New Castle County All Hazard Mitigation Plan, 2010. Plan Executive Summary; New Castle County
Department of Public Safety, Office of Emergency Management.
4‐1
Section4: ClimateChangeandPotentialImpactsonNaturalHazards
Many scientists consider climate change to be the preeminent environmental issue of our time.
Delaware faces multiple challenges from climate change that impact physical, ecological, economical,
and cultural aspects of the entire state, especially coastal communities such as Delaware City. Climate
change effects in Delaware will likely include more extreme weather events (e.g., more droughts, more
intense rainfall, more intense storms and flooding), sea‐level rise, and warmer temperatures. These
changes are likely to magnify the impacts of many of the natural hazards that we already face, and this is
another good reason to be prepared with strategies and actions to increase the resilience of our homes
and communities. This section provides an overview of climate change and regional climate trends, and
describes how these changes may make impacts of natural hazards worse for people and the
environment.
4.1 Climate Change ‐ Overview
Climate is the description of the overall, long‐term pattern of weather in a specific area. Weather is
typically measured over a period of days or weeks, while climate can be defined as the average weather
for a particular region over a 20 to 30 year period. When scientists talk about climate, they’re looking at
long‐term averages of weather (for example: precipitation, temperature, humidity, sunshine, wind) that
occur at a certain place.
Climate change refers to changes in the long‐term record of climate components (such as air
temperature) sustained over a time period of several decades or longer. Climate change is caused by a
combination of natural influences and human activities.
While earth’s climate has experienced periods of natural changes over hundreds and thousands of
years, the large and rapid changes underway today are unprecedented. There have been numerous
documented changes in global climate conditions over the past century. The world has seen increases in
annual average temperatures, rates of sea‐level rise, and changing precipitation patterns.
Internationally, other trends are also apparent, such as increases in weather extremes, changes in the
onset of seasons, and the melting of glaciers.

4‐2
These trends are expected to continue into the future, and the rate of change for many of these
variables is expected to increase (U.S. Global Climate Change Research Program (USGCCRP), 2009).
Many of these changes have negative consequences for people and natural resources. Individuals and
communities are working to reduce their risks from today’s climate hazards and tomorrow’s effects of
climate change.
4.2 Regional Climate Trends
In general, the world is getting warmer, the oceans are getting warmer, storms are getting more
intense, and sea levels are rising at an accelerated rate. However, these general trends and their impacts
vary by region. The northeast and Mid‐Atlantic regions of the United States have experienced significant
variability in extreme events related to weather and climate—floods, droughts, heat waves, and severe
storms are characteristic throughout the geographic area (USGCCRP, 2009).
While the observed impacts of climate change – melting of snow and ice, rising sea level, and changing
weather patterns – may seem distant, climate change may have drastic consequences at the local level.
Major cities across the United Sates have experienced episodes of increased illness and deaths during
heat waves (USGCCRP, 2009). Table 4.1 summarizes some documented climate trends for the Northeast
region.
Table 4.1. Summary of observed and documented current climate trends in the Northeast region
(information summarized after Heffner et al, 2012).
Climate Change
Variable
Current Trend in the Northeast Region
What This Means
Air Temperature Since 1900, the annual mean
temperature has risen 1.5⁰F, with more
rapid increases occurring over the past
few decades (2⁰F since 1970).
Longer, hotter summers increasing drought
potential and human health effects.
Ocean Water
Temperature
Annual average temperatures in the
waters off the southern New England
coast have increased by 2.2 F since the
1970s.
Change in species composition and
dynamics. Decline of some fish species
while other southern species increase.
Potential for more harmful algal blooms
and invasive species.

4‐3
Precipitation and
Weather
Studies have found a 5 to 17 percent
increase in regional precipitation during
roughly the last 100 years.
More rainfall in more intense storms means
increased risk of flooding. Less snow in
winter.
Storminess Hurricane intensity in the western
North Atlantic Ocean has increased.
Increased erosion and damage to roads,
bridges, buildings. Interruption of business.
Sea‐Level Rise Rates of local relative sea‐level rise are
variable across the Northeast region.
Sea level in Delaware has risen 13
inches over the past 100 years.
Increased flooding. Loss of waterfront
property and impacts to public access.
U.S. climate scientists report that the annual average temperature in the Northeast region (which
includes the state of Delaware) has increased by 2°F since 1970, with winter temperatures rising twice
this much. Warming has resulted in many other climate‐related changes including more frequent very
hot days and longer growing seasons (USGCCRP, 2009). Rainfall amounts have generally increased over
the past 100 years, and the occurrence of extreme rainfall events appears to be on the rise (USGCCRP,
2009). In winter months, less precipitation is falling as snow and more as rain. For the region as a whole,
the period between the first and last dates with snow on the ground has decreased by seven days over
the past 50 years (USGCCRP, 2009). While it cannot be proven with certainty, climatologists have
predicted that the rate of sea‐level rise occurring today will likely become greater in the decades to
come.
Climate data and modeling scenarios that have been compiled and synthesized by a number of
organizations can be used to project possible impacts of climate change. Table 4.2 includes a list of
possible climate change impacts in the Mid‐Atlantic region for the end of this century (Najjar, 2012).
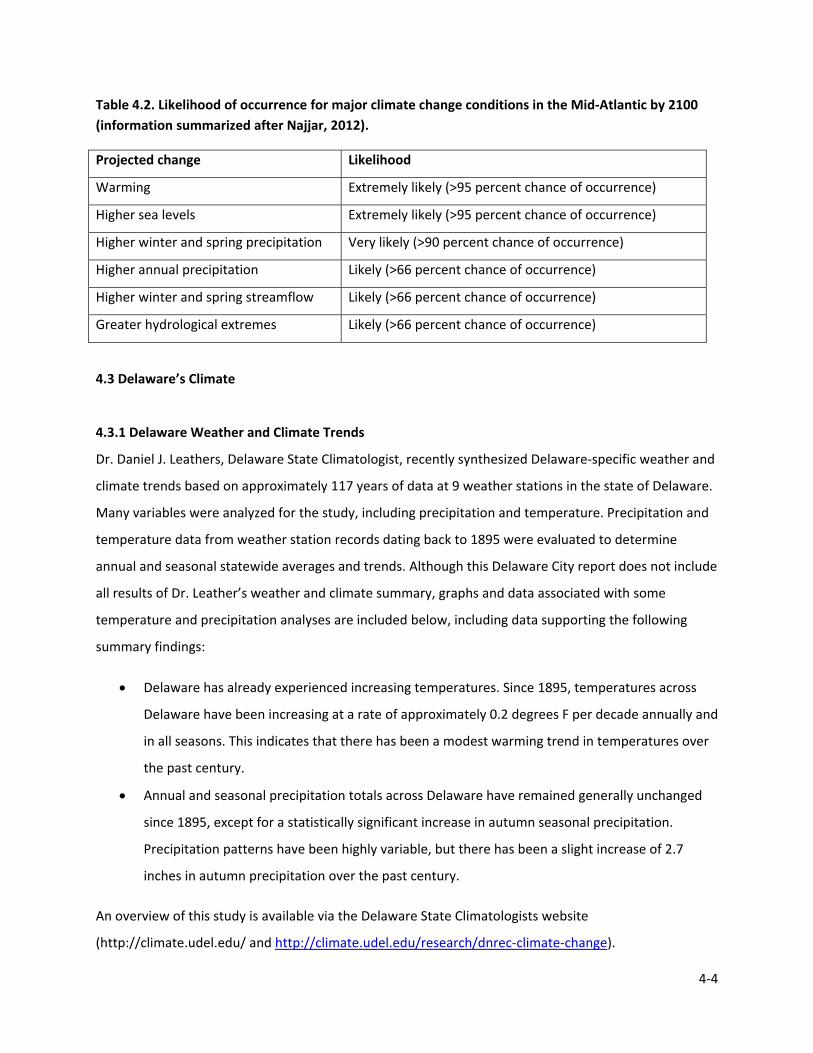
4‐4
Table 4.2. Likelihood of occurrence for major climate change conditions in the Mid‐Atlantic by 2100
(information summarized after Najjar, 2012).
Projected change Likelihood
Warming Extremely likely (>95 percent chance of occurrence)
Higher sea levels Extremely likely (>95 percent chance of occurrence)
Higher winter and spring precipitation Very likely (>90 percent chance of occurrence)
Higher annual precipitation Likely (>66 percent chance of occurrence)
Higher winter and spring streamflow Likely (>66 percent chance of occurrence)
Greater hydrological extremes Likely (>66 percent chance of occurrence)
4.3 Delaware’s Climate
4.3.1 Delaware Weather and Climate Trends
Dr. Daniel J. Leathers, Delaware State Climatologist, recently synthesized Delaware‐specific weather and
climate trends based on approximately 117 years of data at 9 weather stations in the state of Delaware.
Many variables were analyzed for the study, including precipitation and temperature. Precipitation and
temperature data from weather station records dating back to 1895 were evaluated to determine
annual and seasonal statewide averages and trends. Although this Delaware City report does not include
all results of Dr. Leather’s weather and climate summary, graphs and data associated with some
temperature and precipitation analyses are included below, including data supporting the following
summary findings:
Delaware has already experienced increasing temperatures. Since 1895, temperatures across
Delaware have been increasing at a rate of approximately 0.2 degrees F per decade annually and
in all seasons. This indicates that there has been a modest warming trend in temperatures over
the past century.
Annual and seasonal precipitation totals across Delaware have remained generally unchanged
since 1895, except for a statistically significant increase in autumn seasonal precipitation.
Precipitation patterns have been highly variable, but there has been a slight increase of 2.7
inches in autumn precipitation over the past century.
An overview of this study is available via the Delaware State Climatologists website
(http://climate.udel.edu/ and http://climate.udel.edu/research/dnrec‐climate‐change).

4‐5
Figure 4‐1: 1981‐2010: Delaware Annual Average Temperature (at left) and Delaware Annual Average Precipitation (at right). (Images courtesy Dr. Daniel J. Leathers, Delaware State Climatologist, Department of Geography, University of Delaware.)
Dr. Leathers also analyzed additional data from the National Climatic Data Center (NCDC) from 1981
through 2010. These analyses provide an overall picture of Delaware’s statewide climate normal over
the past 30 years (Figure 4‐1).
Temperature. Data from 1895 through 2012 were collected from temperature recording stations, and a
graph of the annual cycle of temperatures
(mean, maximum and minimum) was
generated for the State of Delaware (Figure
4‐2). Over the past century, there has been
an upward trend in Delaware’s statewide
mean annual temperature of +0.2oF per
decade (Leathers, 2013, personal
communication) (Figure 4‐3).
Figure 4‐2. 1895‐2012: Annual cycle of temperatures. (Image courtesy Dr. Daniel J. Leathers, Delaware State Climatologist, Department of Geography, University of Delaware.)

4‐6
Although there has been variability in
statewide mean annual temperature from
1895 to 2012, there has been an overall
increase from approximately 54oF to 56oF
(Leathers, 2013, personal communication).
Similar trends have been observed in
seasonal trends, with winter (December,
January, February), spring (March, April,
May), and summer (June, July, August)
temperatures exhibiting upward trends of
+0.2oF per decade for the 1895‐2012 period
of record. Delaware’s seasonal temperature
for autumn (September, October,
November) shows an upward trend of
+0.1oF per decade from 1895 through 2012
(Leathers, 2013, personal communication).
Precipitation. Leathers (2013, personal
communication) summarized annual
precipitation data for Delaware and found
that although the annual average amount of
precipitation is 45 inches (Figure 4‐4), there
is a large amount of variability across the
state and through various timeframes, as
shown in Figure 4‐5.
Precipitation data from 1895 through 2012
were also evaluated on a seasonal basis, and
there were no significant trends observed for
winter, spring, and summer months. However, since 1895 an upward trend of 0.27” per decade was
observed for autumn precipitation (Figure 4‐6) (Leathers, 2013, personal communication).
Figure 4‐3. 1895‐2012: Statewide Mean Annual Temperature 1895‐2012. (Image courtesy Dr. Daniel J. Leathers, Delaware State Climatologist, Department of Geography, University of Delaware.)
Figure 4‐4. 1895‐2012: Statewide Annual Precipitation 1895‐2012. (Image courtesy Dr. Daniel J. Leathers, Delaware State Climatologist, Department of Geography, University of Delaware.)
Figure 4‐5. Annual cycle of precipitation. (Image courtesy Dr. Daniel J. Leathers, Delaware State Climatologist, Department of Geography, University of Delaware.)

4‐7
4.3.2 Delaware Statewide Climate Change Assessment and Projections
Delaware DNREC’s Division of Energy and Climate is currently conducting a statewide climate change
impact assessment that includes an evaluation of state‐specific climate trends and high‐resolution
climate projections for the state of Delaware. The reader is referred to DNREC’s Delaware Climate
Change Impact Assessment (DCCIA) report (Delaware Division of Energy & Climate, 2014, in press) for
additional details and information. The DCCIA report “provides a summary of the best available science
on the potential impacts of climate change to people, places, and resources in Delaware” (Delaware
Division of Energy & Climate, 2014, in press). The assessment will be available online (in PDF format) in
March 2014. Please see the Delaware Division of Energy & Climate website:
http://www.dnrec.delaware.gov/energy/Pages/Climate.aspx.
The DNREC climate change impact assessment also includes Delaware climate projections for average,
seasonal, and extreme temperature and precipitation. These analyses were conducted by Dr. Katherine
Hayhoe, one of the nation’s leading atmospheric scientists. The resulting projections of Delaware’s
changing climate are based on two possible scenarios (lower and higher) to determine possible changes
in precipitation and temperature that can be expected in the future for the state of Delaware. Using
various scenarios, models, simulations, and downscaling methods, Dr. Hayhoe’s findings include the
following future projections (excerpted from Hayhoe et. al., 2013):
Over the coming century, climate change is expected to affect Delaware by increasing average
and seasonal temperatures.
Figure 4‐6. 1895‐2012: Delaware Statewide Autumn Precipitation. (Image courtesy Dr. Daniel J. Leathers, Delaware State Climatologist, Department of Geography, University of Delaware.)

4‐8
Temperature extremes are also projected to change. For example, heat waves are projected to
become longer and more frequent; the number of very cold days is projected to decrease.
Average precipitation is projected to increase by an estimated 10 percent by late‐century,
consistent with projected increases in mid‐latitude precipitation in general.
Rainfall extremes are also projected to increase. By late‐century, nearly every model simulation
shows projected increases in the frequency and amount of heavy precipitation events.
There is greatest certainty in projected increases in annual and seasonal temperatures, high
temperatures, increased evaporation, precipitation intensity, and frequency of heavy
precipitation. There is moderate certainty in projected changes in cold temperatures and a slight
increase in average precipitation, particularly in winter. There is less certainty in projected
changes in precipitation in other seasons…, and in the magnitude of projected changes in events
that are historically rare.
Although climate projections are not perfect, they provide enough information to make sound policy
decision to manage risk, prevent economic loss and environmental harm, and minimize vulnerabilities of
people and property.
4.3.3 Sea Level Rise
Sea level rise is expected to continue at an
accelerated rate over the coming century.
Global or eustatic sea level rise is based on
the rising waters due to the thermal
expansion of water and the melting of land‐
based ice commonly called glaciers. The IPCC
estimated that global sea level rise will
increase from 0.59 ft to 1.9 ft based solely on
thermal expansion of water (IPCC, 2007).
However, many scientists consider these
estimates to be low due in part to the fact
that they do not include glacial melt. More
recent estimates that incorporate additional components of sea level rise, including land‐based ice melt,
suggest that eustatic sea level rise could be as high as 4.6 ft (Rahmstorf, 2009). The range of estimates
Figure 4‐7. Historic global sea level observations (red) and future projections (dashed lines). The shaded areas represent future sea level rise projection (CCSP, 2009).

4‐9
and the global historic trend can be seen in Figure 4‐7. Several additional factors, including circulation
patterns and land elevations changes, are known to impact local or relative sea level rise.
The historic sea level rise observations and trends for Reedy Point, Delaware, are shown in Figure 4‐8.
The mean sea level trend is 3.46 millimeters/year based on monthly mean sea level data from 1956 to
2006. This is equivalent to a change of 1.14 feet in 100 years. Were this trend to continue, Delaware
City could expect another one‐foot increase in sea level by the year 2100.
Figure 4‐8. Historic sea level rise observations and trends for Reedy Point, DE from 1956‐ 2006. (data from NOAA National Ocean Service.)
As noted earlier, scientists are expecting sea level rise rates to increase in the coming century. Many
regional reports have taken this expected increase and incorporated it with specific local data to create
ranges of relative sea level rise predictions for the coming century. All of these reports take additional
localized factors into account; however, it should be noted that not all reports take exactly the same
factors into account. These regional relative sea level rise changes are summarized in Table 4.3.
Furthermore, it is important to note that based on this information, the State of Delaware’s Department
of Natural Resources and Environmental Control is currently working with the range of future sea level
rise between 1.6 ft and 4.9 ft. for planning purposes.

4‐10
Table 4.3: Delaware relative sea level rise (SLR) planning scenario estimates for 2100.
Report Name Location Low rate SLR Medium rate SLR High rate SLR
Delaware Department of Natural
Resources & Environmental Control –
Sea Level Rise Advisory Committee
(DNREC, 2012)
Delaware 1.6 feet 3.3 feet 4.9 feet
Climate Change and the Delaware
Estuary: Three Case Studies in
Vulnerability Assessment and
Adaptation Planning (Kreeger, et al,
2010)
Delaware
Estuary 2.6 feet
5.6 feet
4.4 Climate Change Impacts to People and the Environment
Local governments already address many issues that may be
associated with climate change such as water availability,
storm damage, and public safety. However, the predicted
increased severity and frequency of climate impacts will take
a greater and greater toll on communities’ citizens and
finances.
Changing climate conditions, though important in and of
themselves, are also indicators of a broader set of impacts
that the region can expect in the coming century. One way
to look at these future changes is through a heat index,
which is a measure of how hot it feels based on temperature
and humidity. For southern coastal New Jersey, by 2100, the
area’s summers will feel like Northern North Carolina under
a low GHG emissions scenario and like Southern Georgia
under a high emissions scenario (Figure 4‐9). A similar shift
should be expected in Delaware. Imagining this change can
Figure 4‐9. Heat index, a measure of the weather experience that is a combination of temperature and humidity, for the NYC Tri‐State Area (NECIA, 2007, p. 7).

4‐11
be hard, but a focused look at some of the direct impacts can help put it into perspective.
Example ‐ More Extreme Heat
In Delaware, temperatures are expected to rise and extreme heat events are expected to become more
prevalent. More extreme heat can result in more intense and frequent heat waves or consecutive high‐
temperature days, when temperatures do not drop at night. A significant increase in the number of
extreme heat days will lead to more people at risk of experiencing heat stress, heat exhaustion and life
threatening heat stroke. This increase will in turn lead to a greater stress on medical facilities and on
the systems in place to provide people with help during heat waves. While air conditioning can reduce
the risk that high temperatures and heat waves pose to citizen’s health, the demand for cooling
buildings can drive the demand for electricity. High demand for electricity during heat waves can result
in brownouts and blackouts that can increase the risk of the entire service area.
Higher temperatures pose an additional health threat by contributing to the formation of air pollutants
and allergens. Increases in asthma and respiratory illness are also expected as temperatures rise with
climate change. Rising temperatures may also result in an increase in infectious disease. While the
health consequences of extreme heat may be far reaching, some populations may be more affected
than others. For example, the elderly are more vulnerable to heat, and individuals suffering from
chronic illnesses such as asthma and respiratory disease are more vulnerable to heat extremes.
Similarly, the poor and impoverished often lack the resources to reduce their exposure to climate
change impacts.
Example – Increased Intense Precipitation
Though the interactions of temperature and precipitation changes can be extremely complex, it is these
interactions that may contribute to some of the Delaware City’s greatest impacts. An increase in heavy
precipitation events means not only an increase in the number of days with heavy precipitation, but also
an increase in the amount and rate of precipitation during events. Heavy downpours can overwhelm
stormwater infrastructure leading to flooding and erosion. Heavy rainfall can produce both short‐lived
flash floods and longer‐duration river floods that can have tremendous impacts to a community such as
Delaware City. Flash flooding can occur as a result of thunderstorms in the spring and summer that
produce heavy rainfall in localized areas. In winter months, slow moving systems may produce large
areas of heavy rainfall that can also result in flooding.

4‐12
Heavy precipitation can cause costly damage to property and community infrastructure as well as lost
revenue from non‐operating systems. Flooded roadways pose a significant impact to public safety, and
can also disrupt the economy by affecting the mobility of people and goods. Infrastructure may also
require maintenance or replacement following a flood event. Most importantly, however, are the public
health impacts of flooding, including injury and death. Public health consequences of floods may last
long after high waters have subsided, especially when impacts include the loss of one’s home and
property. Heavy rainfall can cause flooding of sewage systems and toxic waste facilities. Flooding and
standing water caused by heavy precipitation may also increase the prevalence of vector‐borne diseases
transmitted by mosquitoes.
Increased temperatures combined with increases in the intensity of rainfall are likely to result in
increases in the intensity of extreme weather events, meaning that the area’s coastal storm events –
including tropical and extratropical systems – will become more severe. These storm impacts will likely
be felt along the immediate coast with increased erosion related damages and increased flooding.
Example – Sea Level Rise and Coastal Flooding
Sea level rise is known to have impacts on the land as well as on the marine and estuarine
environments. On the estuarine side, the Delaware Bay can expect increases in submerged wetlands,
salinity variability, harmful algae and hypoxia. The Bay will also see a reduction in eelgrass and altered
interactions amongst tropic levels (Najjar, 2012). These impacts, as well as an increase in invasive
species, may have further cascading effects and could result in the loss of key estuarine species in the
area (Kreeger et al, 2010). On the landward side, a known impact of sea level rise is inundation, which is
the change in the mean higher high tide line resulting in areas that were once dry becoming
permanently wet. A second result of sea level rise is an increase in coastal flooding frequency.
Researchers have found that in Atlantic City, the current 1 percent chance storm (100‐year storm) could
be seen as frequently as once every 4 years by 2050 and once every 2 years by the end of the century
under either GHG emissions scenario (Kirshen et al, 2008).
A second impact of rising sea levels is that the 1 percent chance storm and associated flooding could
reach farther landward, affecting a greater overall area. Both of these sea level rise impacts will result in
increased flooding impacts to Delaware City’s built environment – including commercial, residential and

4‐13
industrial buildings, its sewage and septic systems, as well as transportation infrastructure. In addition
to changes in flooding patterns, sea level rise will also cause increased erosion on non‐hardened
shorelines and the landward migration of natural environments (USCCSP, 2009). One last impact from
sea level rise in many places is increased salt water intrusion into local and regional aquifers. In the next
section of this report we look more carefully at the impacts of climate change on natural hazards in
Delaware City.
4.5 Linking Climate Change Impacts to Natural Hazards Risks in Delaware City
As described above, Delaware is vulnerable to climate change in several ways. We can expect to see
warmer temperatures, more extreme weather events, rising sea levels, shorter winters and longer
summers, and winters with less snowfall and more rainfall. Bridges and roads will be more susceptible to
damage because of more severe storms and heavy rainfall, resulting in possible impacts to evacuation
routes. Sea‐level rise and increased storminess may threaten public and private property at the coast,
with increased risk of flooding and loss of waterfront land. Increased flooding could also affect inland
areas, structures, and facilities.
Changing climate conditions such as temperature increases, altered precipitation patterns, and sea‐level
rise are projected to exacerbate impacts of natural hazards in Delaware. Some climate change impacts
such as precipitation and heat waves will occur quickly in response to increasing temperatures. Others,
such as sea‐level rise, will continue on longer time scales from decades to hundreds of years. A general
overview of potential impacts to coastal storms, floods, winter storms, drought, and other natural
hazards is included below.
4.5.1 Coastal Storms
Coastal storms, which can lead to flooding, wind, and coastal erosion impacts, will be affected by climate
change in several ways. Climate change may affect tropical system intensity, track, size, and/or rainfall.
There is growing evidence that warming sea surfaces have resulted in the increased potential for
destructive Atlantic tropical storms since 1970. The increasing intensity of tropical storms is likely to
continue in the coming century as ocean waters continue to warm. It has also been found that major
storm tracks have been moving northward and this has been attributed to changing climate (Yin, 2005).

4‐14
It is important to note, however, that owing to difficulties in measuring tropical systems, separating the
effects of human‐influenced climate change from natural variability on hurricane activity is very difficult.
At present, it remains uncertain whether past changes in hurricane activity have exceeded the trends
and variability due to natural causes (Ginis, 2011).
Rising sea levels will exacerbate the negative effects of coastal storms, making impacts like erosion and
flooding more severe. Although the exact destructive potential of storms depends on a given storm’s
track, it can be said that the threat Delaware faces of future flooding, erosion, and wind impacts is
greater than it is today.
4.5.2 Floods
With higher sea levels and more intense storms, the probability will increase for major coastal and
inland flooding to occur. Coastal flooding will most directly increase due to sea‐level rise and higher
storm surge impacts. A rise in sea level will increase the extent of flood damage over time, with areas of
lower elevation more susceptible to flooding. Inland flooding will increase due to the changing
precipitation patterns (i.e., increased intensity of rainfall events) that are expected for the region. This
type of flooding could also be directly affected by land‐use decisions, as the amount of permeable
surface affects rainfall’s infiltration potential. During heavy rain events, not only will some roads be
impassable due to flooding, but after waters recede, more roads and culverts may need repair.
Additionally, the increase in precipitation levels will change streamflow and sediment delivery, with the
potential for scouring of bridge foundations.
Looking at specific coastal storm data, researchers have found that there will be an increased frequency
of current design storms (i.e., the 100‐year storm) across the Northeast and Mid‐Atlantic. In Atlantic
City the present 1 percent chance storm (100‐year storm) could be seen as frequently as once every 4
years by 2050 and once every 2 years by the end of the century under both a high and low GHG
emissions scenario (Kirshen, 2008). Moreover, sea level rise will cause the 1 percent chance storm to
reach farther landward affecting a greater overall area of Delaware City.
4.5.3 Severe Thunderstorms
The research to date on climate change and storms is for major tropical and extratropical storms, not for
isolated severe thunderstorms. However, some thunderstorms are associated with these bigger storm

4‐15
systems, and in these cases, intensity may increase. Additionally, as with other storm events, higher
seas and more intense rainfall could lead to greater inland and coastal flooding and greater erosion
during these storm events.
4.5.4 Wind
With the increased intensity of tropical storms caused by climate change comes an increase in future
wind speeds. Increased wind speeds threaten buildings, ecosystems and human health in the Mid‐
Atlantic region. Although there is a projected increase in speeds, the exact amount is not yet fully
understood. This anticipated threat may be tempered by the fact that there is some evidence that the
increased intensity will coincide with a decreased frequency of intense storm events (Boesch and
Hawkey, 2008). It should be noted that the strength of winds associated with future extratropical
storms, thunderstorms, or tornadoes is not yet known. Given this mix of semi‐contradictory
information, Delaware City should remain aware of wind risks; however, they are not likely its greatest
future threat.
4.5.5 Winter Storms
Currently there are two climate change impacts that are likely to affect winter storms in Delaware City.
First, it is believed that precipitation in the winter will become more episodic, with greater amounts of
winter precipitation falling in more extreme events (NECIA, 2006). These extremes could exacerbate
current winter storms, making the overall effects of the storms worse. Additionally, the increase in
average temperature will likely cause a reduction in the amount of precipitation falling as snow or ice—
due to warmer temperatures, precipitation will more likely fall as rain (NECIA, 2006). When snow and ice
are reduced and the increased episodic precipitation is rain, Delaware City could see an increase in the
occurrence of inland flooding during winter storm events.
4.5.6 Drought
Climate change is expected to increase the number and intensity of drought and extreme heat events. In
Delaware, the first six months of 2012 were the warmest and driest period across the state since records
began in 1895 (Delaware State Climatologist website, 2012). Drought can be caused by both a reduction
of precipitation as well as by heat that causes increases in evaporation. Current climate change
predictions for the region indicate that precipitation may become more irregular, thus reducing the

4‐16
amount of precipitation that reaches the groundwater system. Additionally, higher temperatures in the
region will cause increases in evaporation. These interactions will likely increase the number of short‐
term droughts—those that last one to three months—making them occur as frequently as once per year
(NECIA, 2006).
4.5.7 Wildfire
Wildfires could become a greater threat to Delaware City with changing climate conditions. Areas with
large amounts of dry fuel are particularly susceptible to wildfires and in Delaware City these areas are
primarily Phragmites stands. As climate change impacts the species in the area’s wetlands, it may bring
in more Phragmites stands thereby increasing the region’s wildfire risk. Dry hot summer days –
particularly extreme heat days – will exacerbate these wildfire risks, leaving more plants dry and
potentially even reducing the amount of water in the system to treat such a threat.
4.5.8 Sea Level Rise
Delaware City will experience multiple impacts from sea level rise. This section is a summary of all the
threats that were called out in the previous sections. First, sea level rise will change flood patterns in
Delaware City – causing current design flood events to occur more frequently. Additionally, sea level
rise will cause coastal flooding to reach farther landward, thus covering greater areas of land in the City
of Delaware City. These flood pattern changes can be applied to the many different hazardous events –
coastal storms, severe thunderstorms, winter storms and tsunamis – that can cause flooding. Sea level
rise will also cause certain dry areas in Delaware City to become inundated, meaning that they will
become permanently wet. A third effect of sea level rise in Delaware City is to cause increased shoreline
erosion – along the Delaware River, Branch Canal, and other land/water interface areas. Sea level rise is
known to cause saltwater intrusion into coastal aquifers. Finally, in addition to the effects that sea level
rise will have on natural hazards, it was noted in Section 3 that sea level rise will alter local habitats and
natural systems.
Figure 4‐10 shows the current mean higher high water line in Delaware City as well as possible future
inundation scenarios that are based upon different amounts of sea level rise. These inundation maps
were developed in the Department of Natural Resources and Environmental Control (DNREC) inundation
map viewer.1
1 DNREC’s viewer can be found at http://www.dnrec.delaware.gov/Pages/SLRMaps.aspx

4‐17
These maps (Figure 4‐10) are examples of a technique called single‐value surface modeling, or, more
commonly, “bathtub” models. Bathtub models are methods of visualizing sea level rise at various
heights. While they are useful, it is important to take into account their limitations. These models are
based on two inputs—inundation level and ground elevation (National Ocean and Atmospheric
Administration, 2010). The result is an output that is created as if water is being poured into a bathtub,
with points below the given inundation level submerged, and points above the given inundation level
dry. While the resulting scenarios are useful to help understand vulnerabilities at different levels of sea
level rise, they do not provide information that is actionable at the ground level. These scenarios are
unable to take into consideration adaptation and mitigation tactics, including the impact of flood walls,
berms, or other similar types of infrastructure. Delaware City, for example, has a flood wall that has
proved invaluable in helping to protect the town from storm surge.
Figure 4‐10. Bathtub models of current high tides and future projections for Delaware City from DNREC’s sea level rise viewer. Clockwise from top left: Current mean higher high water, inundation with 0.5 meters of sea level rise, inundation with 1.0 meters of sea level rise, and inundation with 1.5 meters of sea level rise. Please see below for more information on bathtub models.

4‐18
4.6 Works Cited
Boesch, D.F., and Hawkey, J.M. (editors), 2008. Comprehensive Assessment of Climate Change Impacts
in Maryland. Report to the Maryland Commission on Climate Change Chapter 2. Available online
at mde.maryland.gov/programs/air/climatechange/documents/final‐
chapt%202%20impacts_web.pdf.
Climate Change Science Program (CCSP), 2009. Northeast Regional Highlights Fact Sheet. From Global
Climate Change Impacts in the United States report. Available online at
www.globalchange.gov/images/cir/region‐pdf/NortheastFactSheet.pdf.
Delaware Department of Natural Resources and Environmental Control (DNREC), 2012. Preparing for
Tomorrow’s High Tide. Sea Level Rise Vulnerability Assessment for the State of Delaware.
Available online at
www.dnrec.delaware.gov/coastal/Documents/SeaLevelRise/AssesmentForWeb.pdf.
Delaware Division of Energy & Climate, 2014. Delaware Climate Change Impact Assessment. The report
will be available online (in PDF format) in March 2014. Please see Delaware Division of Energy &
Climate website: http://www.dnrec.delaware.gov/energy/Pages/Climate.aspx.
Delaware State Climatologist website, 2012. First Six Months of 2012 Warmest and Driest in Last 118
Years. News from the Office of the Delaware State Climatologist, 2012. Available online at
climate.udel.edu.
Ginnis, I.,2011. Projections of Future Tropical Cyclone Activity. University of Rhode Island Climate
Change Science Symposium, May 5, 2011.
Hayhoe, K., Stoner, A., & Gelca, R., 2013. Climate Projections and Indicators for Delaware. The report is
available online at the Delaware Division of Energy & Climate website:
http://www.dnrec.delaware.gov/energy/Pages/Climate.aspx.
Heffner, L., R. Williams, V. Lee, P. Rubinoff, and C. Lord, 2012. Climate Change & Rhode Island’s Coasts –
Past, Present, and Future. URI Coastal Resources Center/Rhode Island Sea Grant. Available
online at http://seagrant.gso.uri.edu/z_downloads/coast/climate_change_summ_web.pdf.

4‐19
Intergovernmental Panel on Climate Change (IPCC), 2007. Global Climate Projections. Chapter 10 in
Climate Change 2007: Working Group I: The Physical Science Basis by the Intergovernmental
Panel on Climate Change (IPCC). Available online at
www.ipcc.ch/publications_and_data/publications_and_data.shtml#.Ui4IshfD‐70.
Kirshen, P., C. Watson, E. Douglas, A. Gontz, J. Lee, and Y. Tian. 2008. Coastal Flooding in the
Northeastern United States Due to Climate Change. Mitigation and Adaptation Strategies for
Global Change 13: 437–451.
Kreeger, D., J. Adkins, P. Cole, R. G. Najjar, D. Velinsky, P. Conolly, and J. Kraeuter, 2010. Climate Change
and the Delaware Estuary: Three Case Studies in Vulnerability Assessment and Adaptation
Planning. Partnership for the Delaware Estuary, PDE Report No.10‐01. Available online at
http://deestuaryarchive.mobiusnm.com/science_projects_climate_ready_products.asp.
Leathers, D. J., 2013. Personal communication. Delaware State Climatologist and Department of
Geography, University of Delaware, Newark, Delaware.
National Ocean and Atmospheric Administration. (2010). Mapping Inundation Uncertainty. Charleston: Coastal Services Center. Available online at http://www.csc.noaa.gov/digitalcoast/_/pdf/ElevationMappingConfidence.pdf.
Najjar, R. G., 2012. Climate Change and Uncertainty in the Mid‐Atlantic Region. Coastal Habitat
Conservation in a Changing Climate: Strategies and Tools in the Mid‐Atlantic Region.
Wilmington, Del., 2012. Available online at
collaborate.csc.noaa.gov/climateadaptation/Coastal%20Habitat%20Conservation/Workshop%2
0Presentations/Najjar_MidAtlanticCC_Jun21.pdf.
Northeast Climate Impacts Assessment Report (NECIA), 2006. Northeast Climate Impacts Assessment
Report. Climate Change in the U.S. Northeast. Available online at
www.climatechoices.org/assets/documents/climatechoices/NECIA_climate_report_final.pdf.
Northeast Climate Impacts Assessment Report (NECIA), 2007. Confronting Climate Change in the U.S.
Northeast: Science, Impacts, and Solutions. Available online at

4‐20
www.climatechoices.org/assets/documents/climatechoices/confronting‐climate‐change‐in‐the‐
u‐s‐northeast.pdf.
Rahmstorf, S. , 2007. A semi‐empirical approach to projecting future sea‐level rise. Science; 315: 368–70.
U.S. Global Climate Change Research Program (USGCCRP), 2009. Global Climate Change Impacts in the
United States. Available online at globalchange.gov.
U.S. Climate Change Science Program (USCCSP), 2009. Coastal Sensitivity to Sea‐Level Rise: A Focus on
the Mid‐Atlantic Region. Final Report, Synthesis and Assessment Product 4.1 Available online at
http://www.climatescience.gov/Library/sap/sap4‐1/final‐report/.
Yin, J.H., 2005. A Consistent Poleward Shift of the Storm Tracks in Simulations of 21st Century Climate.
Geophysical Research Letters 32: L18701, DOI:10.1029/2005/GL023684. Available online at
www.cgd.ucar.edu/~jyin/IPCC_paper_GRL_Jeff_Yin_final.pdf.
5-1
Section 5: Assessing Delaware City’s Current and Future Vulnerability
This next section provides a general overview and assessment of Delaware City’s current and future
vulnerability to natural hazards. This information was gleaned from community task force meetings and
advisory committee meetings, as well as information in the town’s comprehensive plan, FEMA flood
maps, and Census data.
While this project did not include a formal hazard vulnerability and risk assessment for Delaware City, a
broad-based community self-assessment was accomplished via workshops, meetings, and discussions
with Community Task Force and Advisory Committee members. From the onset of the process, it was
clear that the main concern of Delaware City’s residents, as indicated by its city manager and various
members of the public, was flooding. When the project team asked community members to think of
Delaware City’s most pressing natural hazards and environmental threats, they repeatedly voiced some
degree of unease over flood risk and stormwater issues. They were concerned about stormwater being
unable to properly drain in several areas throughout the city, worried about flood waters overtopping
Dragon Run and the Branch Canal, and uncomfortable with the possibility that the Delaware River’s high
tides combined with storm surge and rainfall could breach the town’s sea wall.
5.1 Risks and Vulnerabilities: Delaware City Self-Assessment
5.1.1 Hazard Identification and Analysis
A hazards self-assessment provides a community with the opportunity to identify hazards of concern. It
also helps a community to focus on the areas most susceptible to these hazards. Hazard maps can then
be created to assist in determining which areas are most susceptible to individual hazards, multiple
hazards, or possibly all hazards that have been identified. This information can then be used by
appropriate decision-makers to make informed decisions about potential actions to reduce hazards.
While Section 4 of this report includes an overview of natural hazards that may impact Delaware City, a
historical perspective (past, present, future) of coastal storms, flooding, and stormwater infrastructure is
included here, as these issues were discussed throughout the project workshops.

5-2
5.1.2 Primary hazards of concern - coastal storms, flooding, and stormwater infrastructure in
Delaware City
Delaware City sits on the coast of the Delaware River and is bounded to the north by the Dragon Run
Creek and Reybold Cove, and to the south by the Branch Canal. As a result of its geography, Delaware
City has weathered its share of storm surge from hurricanes and northeasters. According to the
Delaware City website,
Delaware City’s storm of record is the unnamed Hurricane of 1878, during which a storm surge
of almost 12′ did extensive damage to the Delaware Bay and River coastline. Water was
reported to have reached nearly to the second
floor of the Delaware City Hotel at the foot of
Clinton Street. (Delaware City).
The hurricane severely impacted the canal’s infrastructure,
damaging its locks and washing away the toll house.
Reportedly, multiple roofs blew off of houses, part of the
town was under water for an entire afternoon, and
communication to the town ceased for two days. (Ramsey &
Reilly, 2002).
While the 1878 storm was the worst that the town has
ever faced, it’s not the only storm that generated serious
storm surge and subsequent flooding issues for Delaware
City. The pictures at right (Figures 5-1 and 5-2) show the
impact of two different northeasters on the town in the
early 1990s. The town began planning for better
stormwater infrastructure in 2000, and between 2002 and
2005 it installed a new closed drainage system to
complement its older system of open roadside ditches
(Institute for Public Administration, 2008). In 2005, the
town erected a removable flood wall with funds from
FEMA (Associated Press, 2005).
Figure 5-1. December 1992 Northeaster. Photo courtesy Delaware City Flood Mitigation Plan Report.
Figure 5-2. March 1994 Northeaster, Washington and Front Streets. Photo Credit Dolly Powell.

5-3
5.1.3 Present day concerns
While the stormwater infrastructure introduced in the early 2000s provided significant benefit to the
town, there are still some issues. Present day concerns from residents are characterized by continued
issues with flooding in specific locations, as well as concerns regarding impassable evacuation routes.
Flooding issues were attributed to the town’s low elevation, faulty flood gates, and a buildup of the
invasive grass Phragmites. It was evident that flooding is an ongoing concern, independent of recent
resident experiences with extreme weather. Flooding worries were identified at the first community
task force meeting in September 2012, prior to the impacts of October 2012 that include Hurricane
Sandy and the December 21st floods.
The map below (Figure 5-3) shows locations of regular flooding in Delaware City as identified by the
community task force and the members of the community that joined us at those meetings.
Figure 5-3. Google Earth view of Delaware City. Yellow pushpins indicate areas that residents identified as problem flooding areas.
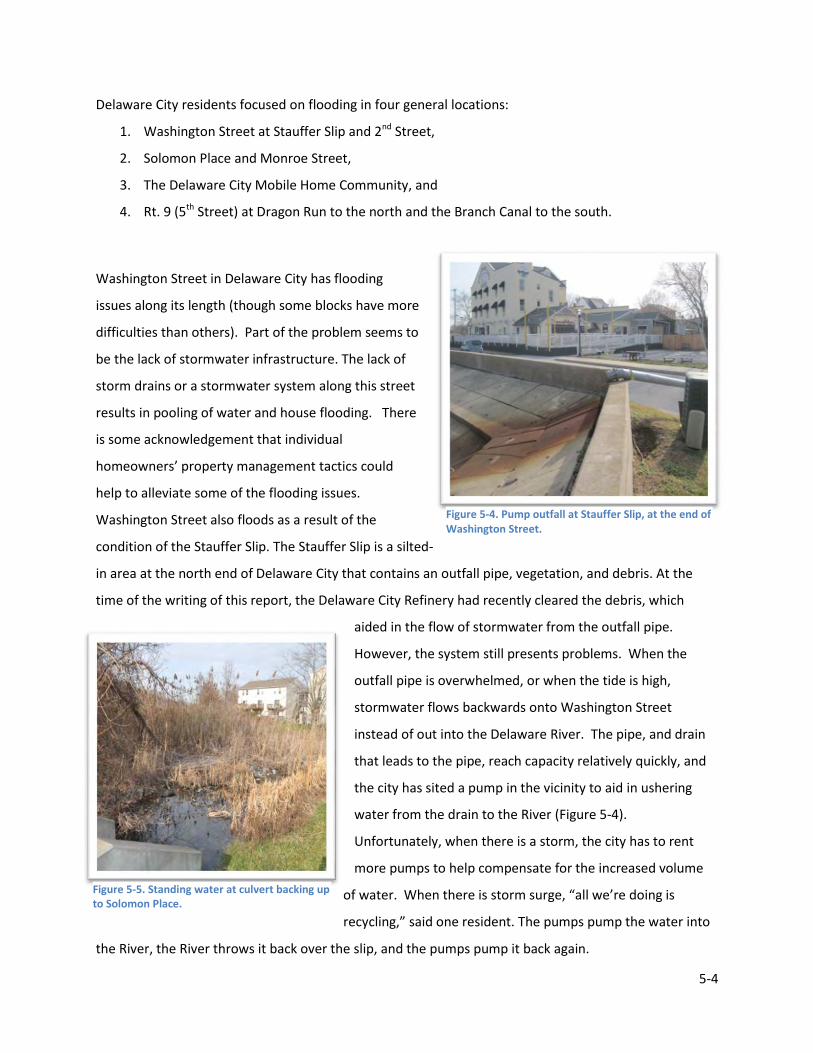
5-4
Delaware City residents focused on flooding in four general locations:
1. Washington Street at Stauffer Slip and 2nd Street,
2. Solomon Place and Monroe Street,
3. The Delaware City Mobile Home Community, and
4. Rt. 9 (5th Street) at Dragon Run to the north and the Branch Canal to the south.
Washington Street in Delaware City has flooding
issues along its length (though some blocks have more
difficulties than others). Part of the problem seems to
be the lack of stormwater infrastructure. The lack of
storm drains or a stormwater system along this street
results in pooling of water and house flooding. There
is some acknowledgement that individual
homeowners’ property management tactics could
help to alleviate some of the flooding issues.
Washington Street also floods as a result of the
condition of the Stauffer Slip. The Stauffer Slip is a silted-
in area at the north end of Delaware City that contains an outfall pipe, vegetation, and debris. At the
time of the writing of this report, the Delaware City Refinery had recently cleared the debris, which
aided in the flow of stormwater from the outfall pipe.
However, the system still presents problems. When the
outfall pipe is overwhelmed, or when the tide is high,
stormwater flows backwards onto Washington Street
instead of out into the Delaware River. The pipe, and drain
that leads to the pipe, reach capacity relatively quickly, and
the city has sited a pump in the vicinity to aid in ushering
water from the drain to the River (Figure 5-4).
Unfortunately, when there is a storm, the city has to rent
more pumps to help compensate for the increased volume
of water. When there is storm surge, “all we’re doing is
recycling,” said one resident. The pumps pump the water into
the River, the River throws it back over the slip, and the pumps pump it back again.
Figure 5-4. Pump outfall at Stauffer Slip, at the end of Washington Street.
Figure 5-5. Standing water at culvert backing up to Solomon Place.

5-5
Solomon Place and Monroe Street have difficulties with drainage and flooding from Dragon Run.
Standing water, even days after a rain, is a common sight (Figure 5-5). Residents attribute the problems
primarily to a broken flood gate on the Dragon Run Creek near Williams Street (north of the railroad
track and bridge). The flood gate seems to be broken open, and the general perception is that, if the
gate were closed, water wouldn’t settle in the area prior to a storm, and the area could act as a holding
space for stormwater, thus preventing property flooding.
The Delaware City Mobile Home Community is
located next to the Branch Canal (Figure 5-6).
There are serious flooding issues at this location,
and the front row of trailers has been flooded
repeatedly. There was some concern expressed at
our advisory committee meetings particularly
about mold and health concerns pertaining to
repeated flood events. The community task force
also spoke about the issues at the mobile home community, and one participant suggested installing
some type of holding pond to mitigate these issues. The mobile home community was also specifically
called out as a flooding problem area as part of group discussions about Hurricane Sandy impacts.
Figure 5-6. Sign in front of Delaware City's Mobile home community.

5-6
Route 9 (Wrangle Hill Road, 5th Street) flooding was cited as a top concern of the community. Route 9
runs through Delaware City;
aside from it, the only other road
in or out is Cox Neck Road
(Clinton Street), whose eastern
leg terminates at the town.
Route 9 North floods out near
the baseball fields during high
high tides (water backfills into
pipes and flows into the streets). Route 9 South has flooded out during storms at the Branch Canal.
(During Hurricane Sandy, the Branch Canal was breeched at Wiso’s, a local crab house.) There is some
concern from residents about getting trapped in the city during extreme storm events, since the
alternative road, which leads to Route 13, can get flooded out at Army Creek during storms, as well.
5.1.4 Recent Hurricanes and Tidal Events
A discussion regarding current vulnerabilities would not be complete without a description of the impact
of Hurricanes Irene (2011) and Sandy (2012). Delaware City was evacuated (by Governor’s order) for the
first time for Hurricane Irene (Summer 2011), and was evacuated a second time for Hurricane Sandy
(October 2012). The city had a 98% evacuation rate for Irene, and a 90% evacuation rate for Sandy. The
Hurricane Sandy evacuation was successful only
because the city government opted to have fire
trucks drive down the streets and police officers
go door-to-door, encouraging residents to leave.
Perhaps one of Delaware City’s vulnerabilities,
then, is that its residents need to learn to take
evacuation orders more seriously.
During Hurricane Irene, there was a 24‐hour
period in which all three of the roads into and out
of Delaware City were blocked by flood waters
(Wrangle Hill Road to the north and south and Cox Neck Road to the west). During Irene and Sandy, the
Figure 5-7. Flanked on either side by marsh, this road is highly susceptible to flooding.
Figure 5-8. Multiple Delaware City residents lost their cars in the floods on December 21, 2012. Photo credit Jon Beeson.

5-7
town deployed five pumps (three in the park, and two by Stauffer slip) to pump water back into the
River. There was a crew sent out to ensure that storm drains were open and uncluttered, and businesses
were sandbagged. The preparation and clean up for Irene cost around $75,000, and Sandy cost around
$60,000, with expenses for both storms primarily related to manpower and pump rental and operation.
According to residents, though, Delaware City considers itself lucky. If the tide projections for Sandy had
come to fruition, the storm surge would have hit three feet above the sea wall.
Delaware City was also recently impacted by the December 21, 2012 flood (Figure 5-8). The primary
cause of the flooding was not an extreme storm, but rather a normal storm with high winds during an
extreme high tide. Delaware City was one of many Delaware Bay towns that were impacted. While
Delaware City has immediate access to two tide gauges, the town would be less vulnerable to flooding
from these events if it had access to an early warning system. As it stands, the town is vulnerable to
extreme high tides like these.
5.1.5 Critical Facilities Analysis
The critical facilities analysis focuses on determining the exposure of key individual facilities, roadways,
transportation corridors, or resources within the community to natural hazards. Because these facilities
play a central role in disaster response and recovery, it is important that critical facilities remain fully
accessible and functional before, during, and after a hazard event to ensure that service interruption is
reduced or eliminated.
The term “critical facilities” normally includes
all public and private facilities that a community considers essential for the delivery of
vital services and for the protection of the community. They usually include emergency
response facilities (fire stations, police stations, rescue squads, and emergency
operation centers [EOCs]), custodial facilities (jails and other detention centers, long-
term care facilities, hospitals, and other health care facilities), schools, emergency
shelters, utilities (water supply, wastewater treatment facilities, and power),
communications facilities, and any other assets determined by the community to be of
critical importance for the protection of the health and safety of the population (Federal
Emergency Management Agency, 2007).

5-8
Delaware City, like many small Delaware towns, does not have all of these types of critical facilities sited
within its boundaries. Schools, utilities, jails, hospitals, and power and treatment plants are nearby but
not in the town. Critical facilities within community boundaries include infrastructure such as City Hall
(city administration and police department), the Delaware City Community Center (library, meeting
space, youth center), the Delaware City Volunteer Fire Company, and the U.S. Post Office. The Delaware
City Flood Mitigation Plan (Duffield Associates, 2000) notes that while several identified critical facilities
in Delaware City such as City Hall are located outside the 100-year floodplain, other critical facilities are
located within the 10-year and 100-year floodplains.
Delaware City works closely with the New Castle County Office of Emergency Management and DEMA
on issues related to critical facilities. It is suggested that detailed information on assessment of hazards,
risks, and vulnerabilities related to critical facilities remain between municipal, county, and state
officials.
5.1.6 Critical Roadways
Critical roadways are ones that function as evacuation routes or that provide access to critical facilities
outside of the town. There are two such roads in Delaware City-- Route 9 (Wrangle Hill Road, 5th Street)
and Cox Neck Road (Clinton Street). There are only three ways into and out of town by road—north or
south on Route 9, or west on Cox Neck Road. As noted in the city’s Flood Mitigation Plan (Duffield
Associates, 2000), tidal flooding imposes a significant limitation on evacuation routes, and extreme
flooding events could prevent access to the City of several days.
While many sections of these roadways are elevated sufficiently to avoid inundation during normal
flood events, portions of these roads are subject to flooding during the 10-year event and more
frequently. The preservation of at least one emergency access road during a severe tidal event for
evacuation and/or to administer emergency services was a critical goal established in the Flood
Mitigation Plan (Duffield Associates, 2000).
In 2009 the Wilmington Area Planning Council (WILMAPCO) worked with Delaware City and the
Delaware Department of Transportation (DelDOT) to develop a transportation plan for the community.
The report includes relevant transportation and land use data, and a review of transportation issues in
Delaware City. Flooding and emergency evacuation issues are highlighted as transportation issues in the
study which notes that the potential for heavy flooding within Delaware City is a reality (WILMAPCO,
2009). Additionally, a specific transportation concern “is the ability of residents to effectively evacuate
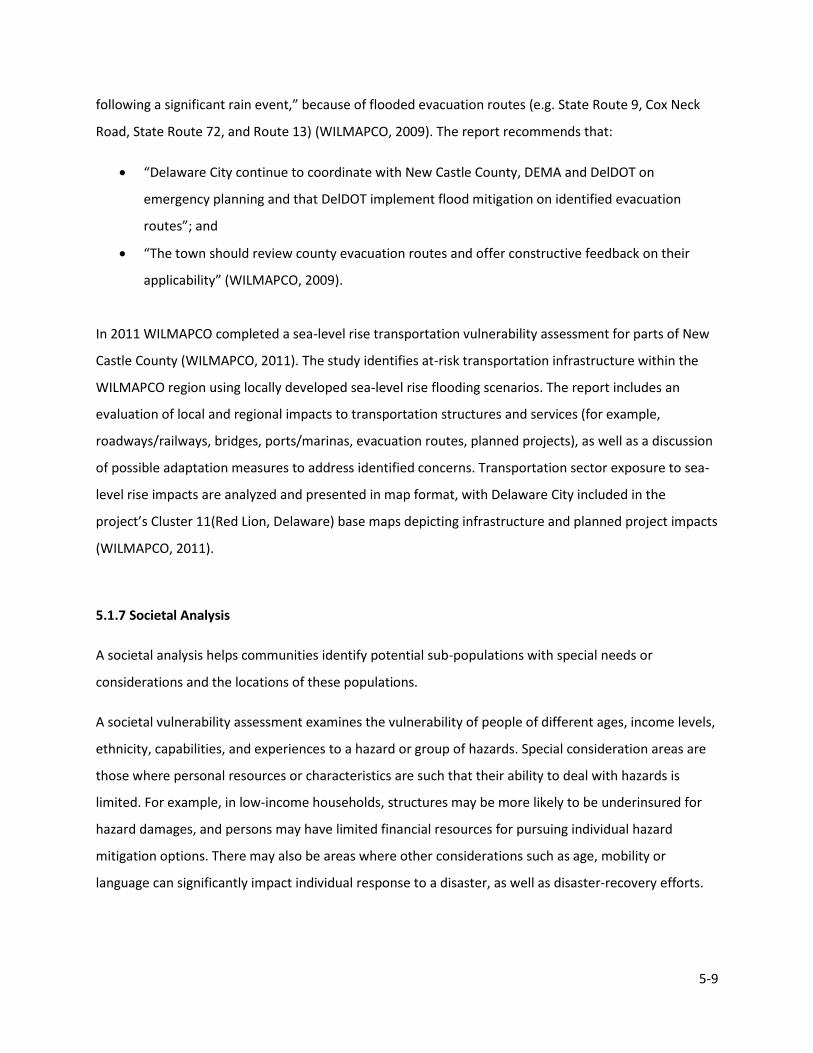
5-9
following a significant rain event,” because of flooded evacuation routes (e.g. State Route 9, Cox Neck
Road, State Route 72, and Route 13) (WILMAPCO, 2009). The report recommends that:
“Delaware City continue to coordinate with New Castle County, DEMA and DelDOT on
emergency planning and that DelDOT implement flood mitigation on identified evacuation
routes”; and
“The town should review county evacuation routes and offer constructive feedback on their
applicability” (WILMAPCO, 2009).
In 2011 WILMAPCO completed a sea-level rise transportation vulnerability assessment for parts of New
Castle County (WILMAPCO, 2011). The study identifies at-risk transportation infrastructure within the
WILMAPCO region using locally developed sea-level rise flooding scenarios. The report includes an
evaluation of local and regional impacts to transportation structures and services (for example,
roadways/railways, bridges, ports/marinas, evacuation routes, planned projects), as well as a discussion
of possible adaptation measures to address identified concerns. Transportation sector exposure to sea-
level rise impacts are analyzed and presented in map format, with Delaware City included in the
project’s Cluster 11(Red Lion, Delaware) base maps depicting infrastructure and planned project impacts
(WILMAPCO, 2011).
5.1.7 Societal Analysis
A societal analysis helps communities identify potential sub-populations with special needs or
considerations and the locations of these populations.
A societal vulnerability assessment examines the vulnerability of people of different ages, income levels,
ethnicity, capabilities, and experiences to a hazard or group of hazards. Special consideration areas are
those where personal resources or characteristics are such that their ability to deal with hazards is
limited. For example, in low‐income households, structures may be more likely to be underinsured for
hazard damages, and persons may have limited financial resources for pursuing individual hazard
mitigation options. There may also be areas where other considerations such as age, mobility or
language can significantly impact individual response to a disaster, as well as disaster‐recovery efforts.

5-10
2010 Census data show that the majority of Delaware City residents (78%) are between 18 and 64 years
of age, with 13% (225 residents) are age 65 and older, while 22% (380 residents) are under age 18. Thus,
although there may be individual age-based need for public services and assistance during hazard
events, there does not appear to be a high concentration of a vulnerable aging population.
With regard to housing status, 2010 Census data show that of the 659 occupied homes in Delaware City,
71% (466 total) are owner-occupied, and 29% (193 total) are renter-occupied. These data may be useful
in determining how best to reach and communicate with residents concerning education and outreach
information regarding flood hazards, flood risk, flood insurance, flood mitigation, and safety issues.
According to American Community Survey data, in Delaware City, 15% of all people and 17% of all
families in Delaware City fall below the poverty line (a total of 71 households had food stamp benefits in
2010). For 2.1% of residents, English is not their first language. Additionally, there is no vehicle in 9.9%
of Delaware City households (U.S. Census Bureau, 2007-2011). The people and families that fall into
these categories are more vulnerable to natural hazards than the rest of the population due to their
inability to quickly access cash or credit for preparation or repairs, their reliance on public
transportation, and their inability to understand warnings or public service announcements due to a
language barrier.
5.1.8 Economic Analysis
The purpose of this analysis is to identify economic vulnerabilities to hazard impacts. Some of the most
devastating disaster impacts to a community include the loss of income associated with business
interruption and the loss of jobs as a result of business closures. This analysis focuses on determining
the flood exposure of centers of economic activity, and the largest employers within the community.
Historically, Delaware City’s economy has been linked to the Delaware River and Chesapeake and
Delaware (C&D) Canal. In fact, the community was initially established in 1826 in a location near the
main entrance to the C&D Canal. This location made Delaware City a commercial hub for fishing,
farming, and shipping through most of the late 1800s. During the 19th century, small-scale industrial
businesses such as a blacksmith shop, carriage shop, and grist mill kept Delaware City’s economy
relatively strong. Heavy industry did not arrive in Delaware City until 1954 when the Tidewater Oil
Company Refinery (now the Delaware City Refinery) was established.

5-11
Today, Delaware City is using its historic past and abundant environmental resources to invigorate its
economy. An organization called Delaware City Main Streets has made it its business to energize the
town. According to its website, Delaware City Main Street
is committed to assisting residents, local merchants, and property owners in enhancing their
property values, boosting their businesses, and promoting a healthy community where people
want to live and work (Delaware City Main Street, 2013).
Delaware City Main Street’s webpage provides businesses interested in Delaware City with incentives
for moving there. Additionally, businesses currently in Delaware City can opt into the Main Street
program with a business membership. With a business membership, businesses receive advertising
through Delaware City Main Streets (which provides a card to its members that gives them discounts at
shops in town).
Looking ahead, Delaware City Main Street anticipates increased investment in the town resulting from a
number of different initiatives, most of which will be ecotourism-oriented. First, the Mike N. Castle trail
along the C&D canal is anticipated to bring more tourism (and specifically eco-tourists) to Delaware City.
The Trail will be a 16-mile long shared-use recreational trail that will run from Delaware City to
Chesapeake City when completed. Second, Delaware City will be benefitting from the Delaware
Bayshore Initiative, a program that is part of the U.S. Department of the Interior’s national Great
Outdoors vision. According to the press release, the purpose of the Delaware Bayshore Initiative is to
“enhance and promote the Bayshore area as a world-class conservation and low-impact recreation area,
strengthen historic local communities, and improve the quality of life for all Delawareans (Rapp, 2012).”
Delaware City sees itself as the northern Gateway to the Bayshore, and anticipates being able to provide
services to tourists seeking a Bayshore experience. Third, leadership of Delaware City Main Streets
believes that, should the Fort DuPont annexation and master plan come to fruition, it will serve to
further enhance the business prospects and ecotourism potential of the town (Chura, 2013).
In terms of economic drivers of the town, the largest company within the city limits is the Delaware City
refinery. However, according to Mark Chura, manager of Delaware City Main Street, the main economic
driver is the service industry. This includes restaurants (like Crabby Dick’s), retail, the Delaware City
marina, and tourism to Pea Patch Island and Fort Delaware (Chura, 2013). Popular events like Delaware
City Days are also economic generators.

5-12
During the hazard mitigation and climate adaptation process that the project team led with the City,
concerns about economic interests were made clear by Community Task Force and Advisory Committee
members. These concerns were three-fold: first, Advisory Committee members were concerned about
economic impacts to the town if hazard mitigation plans did not evolve alongside future projections of
hazards. Second, Community Task Force members were vocally concerned about economic impacts to
the town resulting from unsubstantiated projections of future hazards. Third, both Advisory Committee
members and Community Task Force members were concerned about the impact of rising flood
insurance costs on the town.
Members of the Community Task Force particularly stressed that sea level rise projections can
negatively impact the economic development of a community by scaring away investors. The group
agreed that it is important to talk about risks, but it is simultaneously important to maintain a vibrant
economic community. Further discussion is likely needed to discern the best manner in which to
promote economic development while also assuring that the town is preparing adequately for future
hazards.
5.1.9 Environmental Analysis
Environmental Resources
Key environmental resources in Delaware City include the Delaware River and river bottom, tidal
wetlands, Dragon Run creek, the Branch Canal, and Pea Patch Island. Additional environmental
resources that should be considered in the vulnerability analysis include recreational areas, as well as
cultural, historical, and archeological sites in the town. Areas of special interest and value include tidal
wetlands, especially those on Pea Patch Island.

5-13
Figure 5-9. Map of Environmental Features from the Delaware City comprehensive plan. Light green represents tidal wetlands, dark green represents non-tidal wetlands, and light blue represents streams (Institute for Public Administration, 2008).
It is important to note that Delaware City is surrounded almost in its entirety by either a waterbody or a
wetland (Figure 5-9). Wetlands are not only valuable natural resource areas that provide habitat,
nesting, and resting areas for many animals, but also important flood protection to adjacent structures
and infrastructure. When tidal flooding occurs, the wetlands areas serve as buffers by storing
floodwaters during severe storms.
Delaware City is also rich in open space. According to the comprehensive plan,
Delaware City has a large amount of open space, though the space is limited to one area of the
city. Open space is land that is not slated for development. Delaware City’s largest open spaces
are south of Fifth Street between Clinton Street and the canal. These parcels are part of the
Chesapeake and Delaware Canal Wildlife Area and are owned by the state and federal

5-14
government. Smaller pockets of open space are scattered around the city (Institute for Public
Administration, 2008).
While this open space is certainly an asset and may help with stormwater more than a developed area
might, Delaware City’s soils are not amenable to a high degree of infiltration. The city’s soils are silty
and contain clay, which does not allow for much downward percolation.
Secondary Site Risks
The location of potentially hazardous facilities relative to primary hazard zones (e.g. flood zones) is
critical to identification of secondary risk sites. Hazardous facilities or secondary risk sites may pose
threats not only to environmental resources but also to human health and properties. For example, a
sewage treatment plant located in a flood zone may be damaged during an extreme event, thus
releasing untreated sewage into a nearby water system. This could not only harm the local ecosystem,
but could also contaminate adjacent waterways and flooded properties. By identifying and prioritizing
hazardous facilities that intersect with environmental resources, mitigation strategies to protect both
can be developed.
When moving forward with the creation of hazard mitigation and climate adaptation strategies for
Delaware City, it is important to keep in mind the nearby manufacturing facilities. While these facilities
are not within the boundaries of Delaware City, it is important to acknowledge their impact to the
surrounding environs. Chemicals, and the water and air that can carry them, do not respect manmade
political boundaries. It is important, therefore, to maintain infrastructure that serves as a buffer to
impeding the unintentional distribution of material at RCRA corrective action and superfund sites.
Red Lion Dike, which protects the Delaware Route 9 byway from flooding, is an example of the type of
infrastructure that needs to be maintained for multiple purposes. In addition to protecting Route 9 from
flooding, it also protects “two significant hazardous waste contaminated sites (Delaware Department of
Natural Resources and Environmental Control, 2011).” A DNREC report from 2011 goes on to state that,
in the future, the agency might be open to removing the dike, but only if the road is raised and the
hazardous waste sites are remediated.

5-15
When the DNREC report above was published, the Red Lion Dike was in danger of failing due to severe
erosion. However, reconstruction of the dike was initiated at the beginning of August 2013 and is
anticipated to be completed in November of the same year. The dike will be raised to a height of 9 feet,
where it is anticipated to “guard against 10-year floods and meet federal standards for rehabilitation
assistance following a disaster” (Burke, 2013).
While the Red Lion Dike stops flood waters from coming into contact with contaminated sites, there
needs to be equal attention paid to protecting clean well recharge areas from potential threats.
According to the Delaware City comprehensive plan, “Protecting these areas from contaminants is
critical since these areas allow for the rapid transmission of potential contaminants to drinking water
sources and, ultimately, to water bodies” (Institute for Public Administration, 2008). Well recharge areas
are mostly located northwest of the town’s municipal boundary, and one due west of town just north of
Cox Neck Rd.
5.2 Future Vulnerability
Using the information about existing natural hazards and climate change, combined with the critical
systems information discussed above, it is possible to create an assessment of future exposure risks.
From this analysis, it is believed that coastal storms, floods, wind, drought/extreme heat and coastal
hazards, such as erosion, are the primary natural hazards that will be affected by climate change. Severe
thunderstorms, wildfire and winter storms may also be experienced at a greater frequency or a greater
intensity in the future due to climate impacts, but the extent of this change is unclear.
In the case of flooding, some additional specific data was used to create a better understanding of the
City’s future flood vulnerability. First, as the maps developed through the Department of Natural
Resources and Environmental Control (DNREC) inundation map viewer (Figure 4.7 in Section 4) reveal
the future areas of the City likely to be inundated will be greater. In addition to conceptualizing future
flooding in terms of it physically covering more ground, one should recognize that future flood heights
will be higher in any one location than they will be today. Moreover, scientific analyses have shown that
flood frequencies will be greater in the future. In other words, the 100‐yearstormoftoday could become
the 10‐year or even 5‐year storm event. Specifically in Atlantic City, researchers found that the present 1
percent chance storm (100‐year storm) could be seen as frequently as once every 4 years by 2050 and
once every 2 years by the end of the century (Kirshen, 2008).
5-16
The following additional vulnerabilities may also be of concern in the future:
Societal Impacts
Evacuation route closes from flooding leading to isolation of citizens,
Increased public health risks including air quality,
Physical loss of homes due to flooding,
Low-income population less able to cope,
Historic structures and places (the canal, Fort Delaware, homes, African Union Church
Cemetery) and could be damaged or inaccessible
Economic Impacts
Increased cost of flood insurance,
Loss of tourism from loss of land on Pea Patch Island,
Flooded roads lead to supply flow issues,
Loss of homes leading to loss of ratable property
Environmental impacts
Loss of heronry on Pea Patch Island,
Loss of tidal wetlands and associated habitat and species,
Contamination of water bodies
5.3 Selecting Key Vulnerabilities
From the information gathered in this portion of the project, it is possible to deduce ‘key vulnerabilities’
for Delaware City. Key vulnerabilities are those that are of greatest concern to a community.
Participants in the process repeatedly voiced their concerns regarding one particular issue: the
vulnerability of homes, businesses, and roads to flooding. The next section—Section 6: Strategies for
Addressing Vulnerabilities—discusses the process through which specific vulnerabilities were identified
by process participants and time frames for actions were selected.

5-17
5.4 Works Cited
Associated Press. (2005, May 18). Delaware City flood wall ready in time for hurricane season. Delaware
News Journal.
Burke, M. N. (2013, August 13). Repairs to NCCo dikes along Delaware River underway. The News
Journal.
Chura, M. (2013, August 26). Delaware City Main Street . (S. Rothrock, Interviewer)
Delaware City. (n.d.). Emergency Services. Retrieved from Delaware City, DE:
http://delawarecity.delaware.gov/emergency-services/
Delaware City Main Street. (2013). Delaware City Main Street. Retrieved May 28, 2013, from
Facebook.com: https://www.facebook.com/DelawareCityMainStreet
Delaware Department of Natural Resources and Environmental Control. (2011, June 2). City of New
Castle Dike Management and Improvements. Retrieved from
http://www.dnrec.delaware.gov/coastal/DNERR/Documents/Coastal%20Training%20Program/
New%20Castle%20Flood%20Dikes%20Overview.pdf
Delaware Department of Natural Resources and Environmental Control. (2012, November). 2011 Data
Summary. Retrieved May 28, 2013, from Delaware Toxic Release Inventory:
www.dnrec.delaware.gov/SERC/TRI%20Reports/2011%20TRI%20Summary%20Report.pdf
Environmental Protection Agency. (2013, August 1). Toxic Release Inventory (TRI) Program. Retrieved
from Learn about the TRI program: http://www2.epa.gov/toxics-release-inventory-tri-
program/learn-about-toxics-release-inventory
Federal Emergency Management Agency. (2007). Design Guide for Improving Critical Facility Safety from
Flooding and High Winds. U.S. Department of Homeland Security. Washington, D.C.: GPO.
Institute for Public Administration. (2008). Delaware City Comprehensive Plan. Newark: University of
Delaware.
Ramsey, K., & Reilly, M. J. (2002). The Hurricane Of October 21-24, 1878. Newark: Delaware Geologial
Survey.

5-18
Rapp, M. (2012). Delaware Bayshore Initiative launched to spur conservation, recreation and eco-tourism
in state's coastal communities. Dover: DNREC Public Affairs.
U.S. Census Bureau. (2007-2011). 2007-2011 American Community Survey. U.S. Census. Retrieved May
21, 2013, from http://factfinder2.census.gov/
Wilmington Area Planning Council (WILMAPCO). (2009). Delaware City Transportation Plan. Prepared
by WILMAPCO for Delaware City. Available online : www.wilmapco.org/DelawareCity.
Wilmington Area Planning Council (WILMAPCO). (2011). Sea-Level Rise – A Transportation Vulnerability
Assessment of the Wilmington, Delaware Region. Available online: www.wilmapco.org/slr/.

6‐1
Section6: StrategiesforAddressingVulnerabilitiestoHazardsand
ClimateChange
This section provides information on ways for the City to move forward with improving its resilience
towards natural hazards and climate change. Included in this chapter is information on work that
Delaware has already done in the area of natural hazard mitigation as well as the work that the
Delaware City has proposed in the New Castle County All Hazard Mitigation Plan. Additionally, this
section covers best practices discussed at Community Task Force meetings, which includes a strategy
prioritization exercise and the final actions that the community Task Force identified for implementation
by the City.
6.1 Current Hazard Mitigation Actions
Delaware City and New Castle County have a long‐term partnership and commitment to addressing
hazard mitigation issues, and are invested in making the community more resilient to natural hazards.
Additionally, Delaware City has recently been accepted into the NFIP Community Rating System (CRS)
program, demonstrating the City’s effective and proactive approach in addressing flooding, one of its
primary hazard vulnerabilities.
In 2010, Delaware City updated its list of hazard mitigation actions as part of New Castle County’s All
Hazard Mitigation Plan, which has been approved by both the Delaware Emergency Management
Agency (DEMA) and the Federal Emergency Management Agency (FEMA). During this recent update to
the hazard mitigation strategy, the City identified a suite of actions to accomplish within the coming five
years. As noted with an asterisk in the list below, several of the strategies recommended through this
project are the same as or will enhance the actions identified in the 2010 New Castle County All Hazard
Mitigation Plan:
1. Join the Community Rating System.*[Note: This strategy was completed/achieved in 2013]
2. Purchase equipment (heavy equipment, grinders, etc.) or contract services to manage disaster‐
generated debris.
3. Establish a coastal flood warning and notification system.
4. Create displays for use at public events (health fair, public awareness day, county fair, etc.).

6‐2
5. Construct a flood barrier, drainage improvements, and wetlands enhancements for Dragon
Run.*
6. Evaluate solutions for flooding of Route 9 at Dragon Run which is a major evacuation route out
of Delaware City.*
7. Evaluate solutions for flooding of Route 72 between the refinery and Route 13 which is a major
evacuation route out of Delaware City.*
8. Include citizen preparedness information on Delaware City’s website and incorporate specific
actions that residents can take to reduce the impacts of natural hazards.*
9. Distribute letters to all property owners in Delaware City regarding potential flood hazards as
required for participation in the Community Rating System (CRS).*
10. Utilize the media for the distribution and publication of hazard information to residents.
11. Provide training for Delaware City Town Council on the CRS program and encourage residents to
participate.
12. Construct flood barrier and drainage improvement along C&D Canal and evaluate wetlands
enhancements.*
13. Develop a Phragmites elimination program.*
14. Locate a hazard resource center in the Delaware City Town Hall and library. The center will act
as a repository for information on local hazards, preparedness, and mitigation strategies.*
15. Replace the tide gate and re‐engineer outfall into Delaware River at Washington and Harbor
Streets.
16. Replace or eliminate tidal flushing pipe and valve at Old Locks.
17. Floodproof the Delaware City Community shelter for potential use as a shelter.
18. Acquire NOAA weather radios for key City and fire company personnel so they can provide
timely notice to the public on the changing weather conditions.
19. Work with the County to conduct a detailed flood vulnerability study for the entire City.*
Delaware City has made progress in addressing the actions in this plan, and will continue to do so in the
coming years.
6.2 Potential Hazard Mitigation and Climate Change Adaptation Strategies
Though there are many strategies that can be used to address both flooding and drainage concerns, this
section focuses on a few types of strategies likely to be of relevance for Delaware City. A complete list
of all the strategies suggested during this process can be found in Appendix B. In general, strategies for

6‐3
any system can be broken down into 7 different types – listed below along with examples for flooding
and water resource systems.
1. Planning Tools
Planning tools are those used to focus on an approach or create a strategy. Examples include:
• Including future climate threats in current hazard mitigation plans,
• Working hazard and climate concerns into local comprehensive plans through land use
decisions, and
• Creating a system for assessing hazard / climate threats when building and designing
city infrastructure.
2. Information Gathering Tools
Decisions are easier if you have the right information. Information gathering tools allow leaders
to make better decisions. Examples include:
• Periodic review of current and projected sea levels,
• Improving mapping of flood zones to include future sea level rise, and
• Creating an index of vulnerable homes based upon home heights and projected sea
level rise.
3. Regulatory Tools
These tools involve changes or enhancements to laws. Examples include:
• Zoning and floodplain overlays that prohibit new homes in highly vulnerable areas,
• Enhancing development standards and/or building codes, and
• Requiring setbacks to ensure that new homes be built a minimum distance from
floodplains, rivers, or shorelines.
4. Spending Tools
Spending tools involve using financial resources to protect places and residents. Examples
include:
• Capital improvements,
• Infrastructure changes, and
• Acquisition of vulnerable lands.

6‐4
5. Tax and Market‐Based Tools
This is a cluster of tools that works with market mechanisms to foster change. Examples include:
• Additional financial incentives for building above the building code,
• Real estate disclosure statements and policies, and
• Creating a stormwater utility.
6. Community Engagement Tools
These tools focus on enhancing community understanding of a topic, or engaging people to help
with an issue. Examples include:
• Improving outreach and education related to evacuation routes and citizen safety,
• Educating the public about the benefits of retrofitting of structures – with a focus on
non‐compliant homes, and
• Developing signage along the waterfront to inform citizens and tourists about historic
flood threats.
7. Ecosystem‐Based Tools
These tools help to improve natural habitats and protect human and non‐human communities.
Examples include:
• Creating buffer zones around a wetland or stream for inland migration of natural
resources,
• Restoring the health of natural flood control mechanisms, and
• Converting vulnerable land to protected natural system uses.
6.3 Strategy Prioritization
After introducing Community Task force and public participants to the tools listed above, the project
team presented the group with a list of 26 potential actions to help Delaware City mitigate hazards and
adapt to climate change. The list of 26 actions contained actions from each of the tool categories, and
was pre‐selected by the project team (complete list included in Appendix B). The project team had
cooperatively pre‐selected the group of actions from a more comprehensive list of suggestions.

6‐5
Participants were provided with worksheets containing the pre‐selected actions (see Appendix B), and
were asked to put a checkmark next to the actions they believed would prove beneficial for Delaware
City. Participants were also asked to add actions that they believed were missing. The results of the
exercise (see Appendix B) indicated that, as a group, the Community Task Force agreed that all of the
pre‐selected actions could potentially be beneficial. Some actions, however, did receive more votes
than others.
Actions that received ten or more checks included:
Category Action
Planning Tool Use an integrated planning approach; build adaptation and natural hazards into
the town's normal planning procedures and documents (for example include
coastal flooding and sea‐level rise in the City's Hazard Mitigation Plan).
Planning Tool Create a comprehensive watershed management plan for debris, storm drains,
tide gates, and culverts in partnership with appropriate organizations and
agencies.
Planning Tool Increase the use of climate, weather, and flood vulnerability information in
managing stormwater/flood risk and individual events (for example work with
FEMA to update flood maps in a way that reflects changing risks associated with
climate change).
Information
Gathering Tool
Evaluate Delaware City infrastructure's vulnerability to direct flood impacts, as
well as vulnerabilities to indirect flood impacts (for example ‐ flooding of access
routes).
Information
Gathering Tool
Continue to evaluate need for public flood protection projects that could include
barriers to coastal floodwaters such as temporary flood walls, and improvements
to the drainage system such as installation of backflow preventers on storm drain
outflows into the river/bay.
Ecosystem
Based Tool
Restore the health of some selected wetlands to provide additional natural flood
control (for example, create buffer zones around a wetlands or streams for inland
migration of natural resources).
Regulatory
Tool
Manage and regulate development to future risk level, not past. Update flood
maps to include future flood risk.

6‐6
Spending Tool Identify and fund drainage improvement projects, specifically measures that
reduce street flooding during rain events. For example, increase capacity of
stormwater collection systems to accommodate increased risk and water levels.
Also where appropriate install backflow preventers in storm drains.
Next, the project team gave the Community Task Force participants five star stickers, and asked each
participant to put a star next to five of the actions they had already selected that they felt were most
important for Delaware City.
Three actions received more than five star stickers:
Category Action
Planning Tool Create a comprehensive watershed management plan for debris, storm drains, tide
gates, and culverts in partnership with appropriate organizations and agencies.
Information
Gathering Tool
Continue to evaluate need for public flood protection projects that could include
barriers to coastal floodwaters such as temporary flood walls, and improvements
to the drainage system such as installation of backflow preventers on storm drain
outflows into the river/bay.
Spending Tool Identify and fund drainage improvement projects, specifically measures that
reduce street flooding during rain events. For example, increase capacity of
stormwater collection systems to accommodate increased risk and water levels.
Also where appropriate install backflow preventers in storm drains.
From this process, rather than a strict strategy prioritization, the project team was able to discern which
actions participants felt would be useful and worthwhile and should be included in the realm of
strategies for the future o f Delaware City.
The results of this exercise were presented at the following Advisory Task Force meeting. Advisory task
force members were asked to react to the results, and to provide guidance regarding whether CTF‐
favorite strategies were feasible. They were also asked whether any actions were missing.
6‐7
At the subsequent Community Task force meeting, the project team presented the results of the
‘strategy prioritization,’ relayed the advice from the Advisory Committee, and asked participants to help
place all preferred strategies and actions on a timeline. Participants were given a list of the preferred
strategies, and were asked to indicate two things: first, how feasible an action was and whether it had
significant barriers to its implementation; and second, whether that action could be initiated in the short
term (within 5 years), mid‐term (10 years), or long‐term (twenty years). By asking about project
feasibility, participants were forced to think about the ease of implementation prior to suggesting when
such an action could be embarked upon.
The group was then engaged in an interactive discussion where they were asked to share their results,
and to collaboratively add actions to large sheets of paper labeled “short term,” “mid‐term,” and “long
term.” Through discussion with the group, actions that were seen as very important (regardless of
feasibility) moved to the more immediate time frame, as did easily‐initiated but less urgent actions.
Actions that were important, but not urgent, and that required more funding or more political will
moved to the ‘long term’ category. In this way, Delaware City residents showed the project team the
actions that they felt were not only the most urgent and valuable, but also the order in which the
actions or strategies should be undertaken. Thus the group developed a collaborative and realistic
framework for the future of climate adaptation and hazard mitigation in Delaware City.

6‐8
6.4 Primary Hazard Mitigation and Climate Change Adaptation Actions
As indicated above, the results of the strategy prioritization/timeline process were initially broken into
three lists: short‐term strategies, mid‐term strategies, and long‐term strategies. Many of the strategies,
however, were linked to one another. For example, before a long‐term strategy could be embarked
upon, two short‐term strategies needed to be initiated. It became clear that certain activities were
inextricably linked, and that others were thematically relevant. As a result, the project team worked
with the City Manager to group short‐, mid‐, and long‐term strategies together by theme, creating a
more comprehensive set of actions.
The process resulted in a list of five overarching strategies, with each strategy containing a series of
short‐, mid‐, and long‐term actions that will aid in achieving the overall goal. The strategies are as
follows:
1. Evaluate the dynamics of Delaware City’s vulnerability to flood impacts, including city
infrastructure and public safety issues.
2. Establish a Community Planning Team to support an ongoing mitigation program for Delaware
City.
3. Initiate educational programs to alert residents to community vulnerabilities and heighten
awareness of current and future flood risk
4. Enhance Delaware City’s stormwater drainage capacity, and improve stormwater management
planning.
5. Build hazard mitigation and climate adaptation needs into local planning and regulatory
actions.
Below is a more thorough investigation of each strategy, and includes the actions and time frame
proposed to achieve each. Please note that ‘Short Term’ suggests beginning implementation within five
years, ‘Mid Term’ suggests beginning implementation within ten years, and ‘Long Term’ suggests
beginning implementation within twenty years.

6‐9
1. Evaluate the dynamics of Delaware City’s vulnerability to flood impacts, including city
infrastructure and public safety issues.
SHORT TERM Complete a comprehensive drainage study.
Carefully consider evacuation routes with regard to ingress/egress during flood
events.
MID TERM Identify and fund drainage improvement projects, specifically measures that reduce
street flooding during rain events. (This will inform strategy #4.)
Evaluate elevation and vulnerability of critical facilities.
Identify sites for green infrastructure/places to implement ecosystem tools.
LONG TERM Continue to evaluate need for public flood protection projects such as flood walls,
and drainage system improvements.
Description: This priority action is already underway. For example, the Pennoni report has already been
completed for flooding issues related to Phragmites, condition of the berm and tide gate function in the
vicinity of Dragon Run Creek and Solomon Place. Additionally, a comprehensive drainage study for the
Route 9/Washington Street/Dragon Run vicinity has been included in the scope of work for a recently
funded Delaware Coastal Management Assistance Program grant. This action is critical to the safety of
the community for current and future storm preparation.
2. Establish a Community Planning Team to support an ongoing mitigation program for Delaware City
SHORT TERM Organize a community planning team (Delaware City will determine name of
planning group) to continue work on hazard mitigation and adaptation priorities,
strategies, and opportunities.
Identify funding sources for ‘short‐‘, ‘mid‐’ and ‘long term’ actions in all priorities.
Consider economic benefits of regulatory tools (as defined in strategy #5) and
quantify these benefits.
MID TERM ‐‐
LONG TERM ‐‐

6‐10
Description: Creating a community planning team (modeled on Lewes, Delaware’s Hazard Mitigation
Planning Team) was a high priority for Delaware City. The team’s role would specifically be to support
on‐going hazard mitigation and climate adaptation programs and to identify and implement future
actions.
3. Initiate educational programs to alert residents to community vulnerabilities and heighten
awareness of current and future flood risk
Educational
program
strategies are
ongoing, and
should begin in
the SHORT
TERM and
continue
throughout the
MID TERM and
LONG TERM.
Focus on citizen engagement and community outreach, particularly on topics such as
community vulnerabilities, storm surge, flooding, and sea level rise.
Educate residents about securing debris, propane tanks, yard items, or store objects
that may otherwise be swept away.
Educate homeowners about keeping storm drains clear of debris during storms.
Use GIS to map areas that are at risk of flooding.
Educate property owners (homeowners, commercial property owners, and town
property managers) on specific actions they can take to reduce flooding on their
property. (This should happen alongside actions in strategy #4.)
Obtain depth grid data and use it to illustrate flood risk to citizens.
Hold workshops for homeowners on specific issues including storm surge, flood risk
and safety, flood mitigation techniques, and personal preparedness.
Conduct NFIP community workshops to provide information and incentives for
property owners to acquire flood insurance. (The importance of this should be
underscored by actions in strategy #5.)
Ongoing education on coastal storms, climate change, and sea level rise
Description: Ensuring that residents are engaged in educational programs informing them about natural
hazards and climate change vulnerabilities was considered to be both important and easily
accomplished. There was some discussion about bringing in outside organizations to engage residents
in this manner.

6‐11
4. Enhance Delaware City’s stormwater drainage capacity, and improve stormwater management
planning
SHORT TERM Develop a plan to conduct regular maintenance for drainage systems and flood
control structures
Encourage the use of porous pavement, vegetative buffers, and islands in large
parking areas (this should work hand‐in‐hand with strategy #3).
Promote on‐site water retention and management on individual properties (this
should work hand‐in‐hand with strategy #3).
MID TERM Create a watershed management plan for debris, storm drains, tide gates, and
culverts in partnership with appropriate organizations and agencies. The
comprehensive drainage study (completed in the short term as per strategy #1) will
assist in identifying necessary actions and associated costs.
Encourage the use of Low Impact Development techniques, and develop engineering
guidelines for drainage from new developments .
LONG TERM Implement certain ecosystem actions to provide additional natural flood control.
Possible actions include: restoring the health of selected wetlands, reducing
pavement, creating retention ponds, and other green infrastructure (This should
follow the completion of mid‐term actions in strategy #1).
Description: A watershed management plan is so important that we spoke of it being its own priority
strategy (and not coupled with the comprehensive drainage study or the local planning and regulatory
actions).

6‐12
5. Build hazard mitigation and climate adaptation needs into local planning and regulatory actions
SHORT TERM Develop partnerships among local, state, and regional entities to support floodplain
management, expand resources, and improve coordination. (This should be done
after the establishment of the Community Planning Team in strategy #2.)
Collaborate with New Castle County on building code changes/upgrades, especially
related to the NFIP; for example, consider adoption of adding “freeboard”
requirements in the flood damage ordinance; require standard tide‐downs of
propane tanks
MID TERM Update flood mitigation and floodplain management plan
Make changes to land use/zoning (based on study of economic benefits from short‐
term)
Incorporate review of flood‐risk impacts to new developments and new construction,
especially related to street flooding and evacuation considerations.
Identify sites for green infrastructure/places to implement ecosystem tools
Implement certain ecosystem actions, possibly including restoring the health of
selected wetlands, reducing pavement, creating retention ponds, other green
infrastructure (following the short term action in strategy #4).
LONG TERM Create a plan to update/maintain/create new infrastructure in order to protect
future generations. Should include information on dikes, sea walls, retention ponds,
and maintaining wetlands. (This should be informed by strategy #1.)
Purchase land in select vulnerable locations (to potentially be turned into a park)
Description: Local planning and regulatory actions in support of climate change adaptation and natural
hazard mitigation was considered another top priority activity. Building consideration of future flood risk
and climate change into land use and zoning, as well as into building codes, was considered both very
important and more easily accomplished. Specific goals to work toward throughout all time frames of
this action/strategy include: improve the level of participation in the NFIP Community Rating System
(CRS), incorporate flood mitigation into local planning, improve zoning and land use regulations to
discourage development in flood hazard areas, reduce investment in at‐risk areas, update building codes
and development standards to require more flood resistant structures in floodplains, and incorporate
information on future flood risk and sea level rise into local planning projects and ecosystem restoration
projects.

7‐1
Section7: MovingForward–MonitoringandImplementationGuidance
The fulfillment of the strategies proposed by this project is contingent upon the continued interest by
Delaware City governance, as well as the continued investment of time and energy by a committed
group of people. Potentially one of the most critical short‐term actions, then, is the creation of a
Community Planning Team (Strategy #2). This action should be implemented quickly, so as not to lose
the momentum gained from this hazard mitigation and climate adaptation process. The creation of a
Community Planning Team will create a mechanism by which other decisions can be made and sub‐
groups formed. This team will ensure that progress will be made on the other strategies.
The main role of the Community Planning Team will be to work toward the implementation of actions
proposed in the strategies conceived through this process, as well as any new strategies that are
otherwise responsive to the town’s climate adaptation or hazard mitigation needs. The Community
Planning Team should also function to monitor associated actions that are underway. If implementation
is not progressing, the team should work to determine what barriers are preventing implementation,
and work to devise solutions for those barriers. It is proposed that the Team meet quarterly to report
out on projects, react to new and relevant developments, and initiate new action.
The Community Planning Team should consist of representatives involved with this process, making
certain that this includes equal representation from the City staff and volunteers from City committees.
It should also include members of this project’s Advisory Committee, or representatives from some of
the same organizations and agencies.
Below is a set of implementation plans that are intended to help guide Delaware City and the
Community Planning Team toward the fulfillment of the proposed climate adaptation and hazard
mitigation strategies. For each strategy, a lead contact is identified as the primary person responsible
for overseeing the complete strategy; however, key additional staff and resources are also identified in
order to provide the lead with the assistance necessary to complete specific tasks. Going forward, the
lead will initiate specific strategy steps and determine the timeline while the other people, departments
or outside resources identified may complete the majority of the specific work. Also included in the
guidance below are key steps in the process, general information on possible timelines, as well as some
points regarding monitoring for each strategy.

7‐2
Please note that the identified strategies and actions are fluid and will need to be updated and revised
as plans and needs change. Appendix C of this document contains additional resources that may be
helpful in the event that revisions are needed. This appendix includes a table of NFIP CRS activity points
and worksheet, DNREC’s floodplain management and drainage standards and worksheet, and DNREC’s
sea level rise adaptation recommendations.
7‐3
Strategy 1: Evaluate the dynamics of Delaware City’s vulnerability to flood impacts, including city
infrastructure and public safety issues.
A. Alignment with Existing Priorities & Co‐Benefits
Delaware City has long been invested in reducing its residents’ exposure to flood impacts and
improving community safety in the face of impending storms.
As a result of the town’s existing interest in public safety issues, projects to address this strategy
and some of its actions are already completed or underway:
o A report by Duffield Associates has been completed for flooding issues relating to the
invasive species Phragmites, the condition of the berm and tide gate function in the
vicinity of Dragon Run Creek and Solomon Place.
o A comprehensive drainage study for the Route 9/Washington Street/Dragon Run vicinity
has been included in the scope of work for a recently‐funded Delaware Coastal
Management Assistance Program grant.
Depending on the exact zoning code changes that are made, these actions could help to
improve Community Rating System (CRS) scores.
Working on this strategy alongside other governmental organizations agencies aligns with goal
#15 of the city’s Planning Commission goals, as detailed in the Delaware City Comprehensive
Plan: “Maintain proactive relationships with appropriate governments and agencies through a
conscientious intergovernmental coordination effort.”
B. Administration and Staffing
Led by an individual(s) as assigned; accountable to the City Manager.
Input necessary from community engineer and DelDOT.
The Community Planning Team would provide assistance as needed.
C. Implementation Steps
Step 1: Establish regular communications between the leaders of the comprehensive drainage
study and the Community Planning Team either in the form of post‐meeting email updates or
through attendance of key meetings by representative members. Ensure that the
comprehensive drainage study takes into consideration evacuation route issues.
Step 2: Develop and complete the comprehensive drainage study.

7‐4
Step 3: Review the results of the study. If the study does not contain recommendations, create a
subgroup of the Community Planning Team to propose recommendations to present to the
group. Recommendations should include sites and properties that would benefit from specific
interventions or provide benefit to the town as a whole if altered.
Step 4: Look for funding for the recommended projects. Once secured, begin implementation.
Step 5: Conduct an evaluation of the vulnerability of the town’s critical facilities to various heights
of flooding. If vulnerable, the Community Planning Team should make appropriate
recommendations.
Step 6: Continue to evaluate need for public flood protection projects such as flood walls, and
drainage system improvements. Create a mechanism for review.
D. Timeline Information
Step 1 should be undertaken as soon as the Community Planning Team has been formed and
the drainage study is underway.
Step 2 has been initiated.
Steps 3‐5 should be initiated within the next ten years.
Step 6 should be initiated within the next twenty years.
E. Financing and Budget
This work can vary greatly in cost; however, the initial review and changes to lay the
groundwork for future updates could be done for limited costs.
Costs are likely to increase if contracts with professional services or consulting firm are required,
and/or if review by an attorney is required.
F. Monitoring
An indicator of complete success would be the inclusion of several standards that go beyond the
NFIP minimums and improved CRS scores.

7‐5
Strategy 2: Establish a Community Planning Team to support an ongoing mitigation program for
Delaware City.
A. Alignment with Existing Priorities & Co‐Benefits
Delaware City has a core group of citizens and municipal volunteers or employees interested
and invested in hazard mitigation and climate change adaptation.
The town is already taking concerted steps to understand the basis of its vulnerability.
o A comprehensive drainage study for the Route 9/Washington Street/Dragon Run vicinity
has been included in the scope of work for a recently‐funded Delaware Coastal
Management Assistance Program grant.
B. Administration and Staffing
Led by the City Manager (or individual(s) as assigned who will report to City Manager).
Participants should include members of the Community Task Force and the Advisory Committee.
C. Implementation Steps
Step 1: Determine participants and official group name.
Step 2: Establish Community Planning Team goals and expectations for members. Establish a
meeting schedule (suggested frequency: quarterly).
Step 3: Work to identify potential funding sources for actions/steps in all strategies.
Step 4: Work to consider economic benefits of various regulatory tools, as defined in Strategy #5,
and quantify those benefits.
D. Timeline Information
All Community Planning Team activities should begin immediately after the team is organized.
The Community Planning Team should be considered an ongoing organization, not a one project
necessity.
If and when all strategies and actions are met, the Community Planning Team will establish new
goals to work toward increased resilience and sustainability for the City.
E. Financing and Budget
This work requires a time commitment from the team members. The members of the
Community Planning Team will be either volunteers or city staff.

7‐6
F. Monitoring
The Team should meet at least quarterly.
The Team should strive to have an appointed representative from the City council.

7‐7
Strategy 3: Initiate educational programs to alert residents to community vulnerabilities and heighten
awareness of current and future flood risk.
A. Alignment with Existing Priorities & Co‐Benefits
Annual reminders of the flood threat, safety precautions, warning signals, etc., have been shown
to be helpful in keeping up awareness of the hazard and what individuals should do.
Coordination with and enhancement of CRS education/outreach activities may ultimately result
in improvement of Delaware City’s CRS rating.
B. Administration and Staffing
This effort would be led by the Community Planning Team. Individual members of the
Community Planning Team will provide assistance as needed, especially related to specific
hazards and areas of expertise. (For example, a representative of the Historic Preservation
board will be the primary point of contact on topics related to retrofits for historic homes. The
Delaware City Fire Company will be the primary point of contact on fire‐related hazards.)
Delaware Sea Grant College Program will provide assistance with education and outreach
efforts. Partnership for the Delaware Estuary can also provide support in the form of
information and science‐based talks.
C. Implementation Steps
Step 1. Determine whether outreach programs will be coordinated by the Community Planning
Team or a subgroup thereof.
Step 2. Compile a list of topics for general education about climate change impacts and natural
hazards. Topics can include: community vulnerabilities, storm surge, flooding, and sea level rise.
Determine which topics are best for a talk, a workshop, or another outreach activity to educate
the community. Schedule and advertise the activity or event.
Step 3: Consider a list of topics regarding climate change impacts or natural hazards that would
appeal to certain groups of people, like homeowners.
o Topics for a workshop for homeowners concerned about storms and flooding could
include how (and why) to secure yard items, how to store other items in advance of a
natural hazard, why it is beneficial to keep nearby storm drains clear, and how to reduce
flooding on a property.

7‐8
o Conduct NFIP community workshops to provide information and incentives for property
owners to acquire flood insurance.
Step 4: Compile resources that help to show flood risk, like maps derived from updated depth
grids, or maps showing the levels of storm surge from historic storms.
Step 5: Use compiled resources (like maps or pictures) to help educate residents about hazards.
Step 6: Create a mechanism to ensure that outreach talks on these subjects will be ongoing.
D. Timing Information
All education/outreach activities can and should begin immediately.
Outreach should be considered an ongoing activity rather than a one‐time event.
Activities can be implemented at any time – timing is not critical, but information sharing and
public events can be tied to external events (hurricane season, ’62 storm anniversary).
In general, most education and outreach activities could and should be coordinated to enhance
objectives of various programs and committees within Delaware City. For example, there are
many opportunities for collaboration between Community Planning Team education activities
and Delaware City NFIP/CRS outreach programs.
E. Financing and Budget
While education and outreach activities are presently included as part of the Community
Planning Team efforts, additional activities and goals may go beyond basic expectations of
current staff.
Additional funds may be needed for print publications and web‐based materials.
At this time it is not known if additional funding sources are available, but the Community
Planning Team can explore funding opportunities via DEMA, FEMA, DNREC, Delaware Sea Grant,
and other agencies. At this time it is not known how much additional funding may be required.
F. Monitoring
Indicators to gauge success would include: a list of print and web‐based educational materials
created and delivered to City stakeholders, residents, and property owners; an inventory list of
outside agency publications made available to residents and property owners; a list of training
courses, workshops and seminars presented to residents, property owners, and City officials,
etc.
An additional indicator of success would be the number of CRS credits achieved through
education and outreach activities.

7‐9
Strategy 4: Enhance Delaware City’s stormwater drainage capacity, and improve stormwater
management planning.
A. Alignment with Existing Priorities & Co‐Benefits
The Delaware City comprehensive plan indicates that one of the goals of stormwater
management in the town is to “Improve stormwater drainage in identified problem areas.”
Coordination with and enhancement of stormwater management may ultimately result in
improvement of Delaware City’s CRS rating.
B. Administration and Staffing
Led by the City Manager (or individual(s) as assigned who will report to City Manager).
Input necessary from community engineer and DelDOT.
The Community Planning Team would provide assistance as needed.
C. Implementation Steps
Step 1. Develop a plan to conduct regular maintenance for drainage systems and flood control
structures.
Step 2. Encourage the use of porous pavement, vegetative buffers, and islands in large parking
areas (this should work hand‐in‐hand with strategy #3).
Step 3: Promote on‐site water retention and management on individual properties (this should
work hand‐in‐hand with strategy #3).
Step 4: Create a watershed management plan for debris, storm drains, tide gates, and culverts in
partnership with appropriate organizations and agencies. The comprehensive drainage study
(completed in the short term as per strategy #1) will assist in identifying necessary actions and
associated costs.
Step 5: Encourage the use of Low Impact Development techniques, and develop engineering
guidelines for drainage from new developments.
Step 6: Implement certain ecosystem actions to provide additional natural flood control.
Possible actions include: restoring the health of selected wetlands, reducing pavement, creating
retention ponds, and other green infrastructure (This should follow the completion of mid‐term
actions in strategy #1).

7‐10
D. Timing Information
Steps 1‐3 are short term actions, and should begin as soon as possible. They should be coupled
with educational activities in strategy 3. Outreach should be considered an ongoing activity
rather than a one‐time event.
Steps 4‐5 are mid‐term activities. Step 4 should be coordinated with activities in strategy #1.
Step 6 is a long‐term activity, though the community planning team should be aware of
opportunities to implement ecosystem/green infrastructure opportunities at all time frames,
due to the synergistic nature of these options.
E. Financing and Budget
This work can vary greatly in cost; however, the initial review and changes to lay the
groundwork for future updates could be done for limited costs.
Costs are likely to increase if contracts with professional services or consulting firm are required,
and/or if review by an attorney is required.
F. Monitoring
Indicators to gauge success would include demonstration of decreased flooding and stormwater
management issues. The Community Planning Team should use anecdotal information and
photographs to ascertain progress and success.
An additional indicator of success would be the number of CRS credits achieved through
education and outreach activities.

7‐11
Strategy 5: Build hazard mitigation and climate adaptation needs into local planning and regulatory
actions.
A. Alignment with Existing Priorities & Co‐Benefits
Delaware City’s meaningful relationship with the Delaware River and Bay, a core community
value, would be greatly enhanced by recognizing in advance that the relationship will change as
sea levels rise. Integrating natural hazards and climate change into planning efforts will help to
maintain this meaningful relationship with the sea.
o This is also in alignment with goal #5 of the city’s Planning Commission goals, to
“preserve Delaware City’s heritage,” which is closely linked to the continued vibrancy of
the town’s waterfront historical district.
Depending on the exact zoning code changes that are made, these actions could help to
improve Community Rating System (CRS) scores.
Working on this strategy alongside other governmental organizations agencies aligns with goal
#15 of the city’s Planning Commission goals, as detailed in the Delaware City Comprehensive
Plan: “Maintain proactive relationships with appropriate governments and agencies through a
conscientious intergovernmental coordination effort.”
B. Administration and Staffing
Led by the Planning Commission with the chairperson as the primary point of contact.
The Community Planning Team would provide assistance as needed.
C. Implementation Steps
Step 1: After the Community Planning Team has been established, determine how to best create
regular communication between the city Planning Commission, the Community Planning Team,
the Office of Emergency Management, and other relevant planning entities.
o Regular communications could take the form of post‐meeting email updates or through
attendance of key meetings by representative members.
It is essential, though, that the Community Planning Team and the Planning
Commission be somehow involved in relevant planning updates.

7‐12
Step 2: Collaborate with New Castle County on building code changes/upgrades, especially
related to the NFIP.
o Review, and when appropriate, adopt the following specific suggestion for regulations
that exceed the National Flood Insurance Program (NFIP) minimum.
Create a freeboard standard for homes in the floodplain
This is an additional height requirement above the current base flood
elevation (BFE) that provides a margin of safety and saves people money on
their flood insurance.
Create specific development prohibition in floodplain areas. Examples include:
The prohibition of new sheds in the floodplain
Prohibiting the expansion of the footprint of existing homes
Update flood maps to include future flood risks.
Step 3: Update flood mitigation and flood management plan with changes as per work with New
Castle County, and with other new developments (as per results and/or lessons learned from
comprehensive drainage study).
Step 4: Using information from the economic benefit study on potential land use/zoning
changes, conduct public outreach. Ensure that Delaware City residents understand and are
interested in potential updates.
Step 5: Once public understanding/approval is secured, proceed to update land use and zoning
codes, and incorporate review of flood‐risk impacts to new developments and new construction
(especially related to street flooding and evacuation considerations).
Step 6: Work to identify sites for green infrastructure improvements, and implement where
feasible.
o Green infrastructure actions to consider include
restoring the health of selected wetlands,
reducing pavement,
creating retention ponds
Step 7: Create a plan to update/maintain/create new infrastructure in order to protect future
generations.
o Should include information on dikes, sea walls, retention ponds, and maintaining
wetlands. (This should be informed by strategy #1.)

7‐13
o Should include information and/or plans for purchasing land in vulnerable places (to be
turned into parkland).
D. Timeline Information
Step 1, which would be an ongoing action with no specific end date, can also be started
immediately as it could greatly benefit both the Community Planning Team and the Planning
Commission and does not require a significant amount of time to complete.
Step 2 should begin as soon as the Community Planning Team has been created and has defined
an avenue for communication.
Steps 3‐6 are mid‐term actions, and should be initiated within the next ten years.
Step 7 is a long‐term action that should be initiated within the next twenty years.
E. Financing and Budget
This work can vary greatly in cost; however, the initial review and changes to lay the
groundwork for future updates could be done for limited costs.
Costs are likely to increase if a contract with professional services or consulting firm are
required, and/or if review by an attorney is required.
F. Monitoring
An indicator of complete success would be the inclusion of several standards that go beyond the
NFIP minimums and improved CRS scores.