day 2 • tuesday 27 - national laboratory association...
TRANSCRIPT

You should also note the wide diversity of the papers that
will be presented and which I am confident will ensure that the T&M 2016
Conference will be a very worthwhile event; addressing various aspects related to Testing,
Metrology/Calibration, Accreditation and Quality Assurance.
Shortly after the event you will be able to download the papers and presentations from the Conference from the NLA web site so
please check back in a few weeks after the conference ends.
Of course the information obtained at the formal sessions is important, but I would like to remind you that it is vital that you make the best use of the
networking opportunity that the Conference affords you, thereby deriving the maximum value of your attendance.
Finally, please remember to support the Exhibition, since without the support of the suppliers much of what has been achieved in the growth of this event would not have taken place.
Once again thank you for electing to attend this year’s T&M Conference and we look forward to your continued support in the future.
Steve SidneyChairmanTest & Measurement 2016 Conference and Workshop N A T I O N A L
A S S O C I A T I O NS O U T H A F R I C A
L A B O R A T O R YPO Box 298 • Persequor Park • 0020 • 1 De Havilland CrescentPersequor Technopark • Pretoria • South Africa • Tel: +27(0)12 349 1500 Fax: +27(0)12 349 1501 • E-mail: [email protected]
www.nla.org.za
NA
TIO
NA
LLA
BO
RATORY ASSOCIATION
-SO
UT
HA
FR
ICA
Dear delegateWelcome to the Test & Measurement 2016 Conference and Workshop.
Although the theme, “Imagine IT, Measure IT”, of this year’s event is somewhat lighthearted it stands on the shoulders of one the most famous personalities of the movie industry. Walt Disney made a huge contribution to the cartoon and movie industry and his motto was “ If you can visualize it, if you can dream it, there’s some way to do it” and this approach to life can certainly be used when it comes to making measurements.
It was Walt’s dream to entertain American families with animated films that led to the invention of Technicolor, and this in turn resulted in huge improvements in the reliability of colour measurements.
It is my sincere hope that you will be inspired by the papers, presentations, posters, tutorials and workshops that form an integral part of the T&M event and that your everyday testing and calibration will benefit in some way.
I would also like to highlight the following Streams which will run on various days. Please check the programme for the details
• Food Workshop• Civils Materials Testing• Water & Microbiology• Stack Gas Emission Testing• Calibration / Metrology

1
Saint George Hotel and Convention Centre, Rietvleidam, Centurion, Gauteng
26 - 28 September 2016
Supported by: PageDAY 1: Monday 26 September 2016 1DAY 2: Tuesday 27 September 2016 2DAY 3: Wednesday 28 September 2016 3
ABSTRACTS for Day 1 5ABSTRACTS for Day 2 12ABSTRACTS for Day 3 18POSTERS 22
Why become an NLA-SA Member? 24Application Form 26
CONTENTS
NA
TIO
NA
LLA
BO
RATORY ASSOCIATION
-SO
UT
HA
FR
ICA
PROGRAMME
SUNDAY 25TH SEPTEMBER 2016
16h30 – 18h00 REGISTRATION
18h00 – 18h30 COCKTAILS AND GET TOGETHER
18h30 onwards DINNER
DAY 1 • MONDAY 26TH SEPTEMBER 2016
07h45 REGISTRATION AND COFFEE
09h00 OPENING AND WELCOME
Stream PLENARY
09h15Dave Lockwood
ImagineNaledi3d Factory
10h00Willie May
Metrology: A Catalyst for Change. How Better Measurements Enable a Better FutureNIST, USA
10h45 TEA/COFFEE
M102
M103
M101

DAY 2 • TUESDAY 27TH SEPTEMBER 2016
07h45 REGISTRATION AND COFFEE
Stream PLENARY
09h00Ndwakhulu Mukhufhi
Imagine Africa at the Forefront of Measurement ScienceNMISA
09h45Heleen Temple
Imagine it! Dream it! Standardise it!SABS
10h30 TEA/COFFEE AND MANNED POSTER SESSION
T101
Stream Imagine it! Calibration Stack Emission Testing
14h00
Maggi LoubserCreative Ways of using X-ray
Fluorescence Spectrometry to investigate Art and Artefacts
GeoMag GeoChem
Flippie PrinslooTiming errors in energy meter
calibrationNMISA
Sarah DikgaleCalibration of L-type pitot tubes at low
speedsCSIR
14h30
Abram BodibaAccuracy evaluation of matrix
matching calibration of manganese ore on X-Ray fluorescence
South 32 Hotazel manganese mine
Pritesh JivanDesign concept for free space optics
NMISA
Dheshan NaranMeasurement and prediction of coal
flow rates in pulverised fuel pipesESKOM
15h00
Wendy ThokaCommissioning of the Beta Secondary
Standard (BSS2)NMISA
Mariesa NelLinking fibre optic power
measurements in SANMISA
Ncobile NkosiFine particulate emissions from domestic burning in low income
settlements: a case study in KwadelaNorth West University
15h30 TEA/COFFEE – EXHIBITION VIEWING
Stream Imagine it! Calibration Stack Emission Testing
16h00
Ljiljana MarjanovicThe imagination, innovation and the
reality in a commercial labSGS South Africa
Gavin van RooyAnybody can take an IR Picture but
what does it mean?Comtest
Distribution (Pty) Ltd
Monray BelelieEmissions of Mercury from the South
African power sectorNorth West University
16h30
Hein ErwinSo you thought that calibrating a
Standard Resistor is easyKoCoS Measurement &
Control (Pty) Ltd
Gavin McQuillanOptimization of a Thermal Radiation
Source for High Temperature Infrared Thermometer Calibration
Fluke Calibration
Quentin HurtValidation and verification for quality
emission testsSKYSIDE
17h00 SPONSORED COCKTAILS
18h00 BRAAI
M108
M109
M208
M209
M308
M309
M107
M207 M307
M110
M210 M310
M106
M211 M311
T102
2
Stream Imagine it! Calibration Stack Emission Testing
11h15
Guy SnellingFROM UNITS TO UNITY (A Brief History
of Measurement Units)Intercal
Thomas MautjanaMy Balance is Calibrated
NMISA
Gerald WoollattEstimating measurement uncertainty for
particulate emissions from stationary sourcesLevego
11h45Wynand Louw
Single Electron Counting is not Imagine Anymore
NMISA
Bongani NdlovuVolume/Density Measurements of
Irregular Objects at NMISANMISA
Vusi MahlanguDetermination of common metal analytes in diesel particulate matter samples from
South African minesCSIR
12h15
Dineo MokobodiDesign and development of an
absolute ballistic gravimeter using pneumatic actuators
NMISA
Mpilo DlaminiCalibration of bubble flow meters
NMISA
12h45 LUNCH – EXHIBITION VIEWING
M105
M205
M206
M305
M306
M104 M204 M304
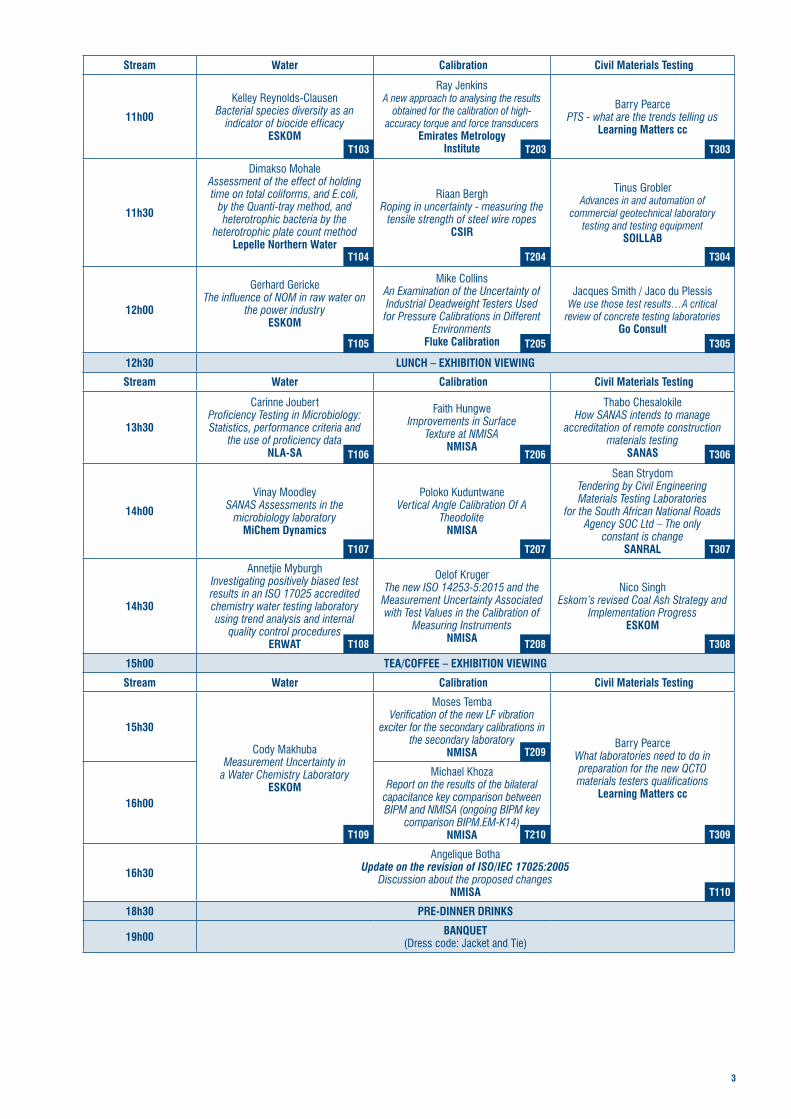
Stream Water Calibration Civil Materials Testing
13h30
Carinne JoubertProficiency Testing in Microbiology: Statistics, performance criteria and
the use of proficiency dataNLA-SA
Faith HungweImprovements in Surface
Texture at NMISANMISA
Thabo ChesalokileHow SANAS intends to manage
accreditation of remote construction materials testing
SANAS
14h00
Vinay MoodleySANAS Assessments in the
microbiology laboratoryMiChem Dynamics
Poloko KuduntwaneVertical Angle Calibration Of A
TheodoliteNMISA
Sean StrydomTendering by Civil Engineering Materials Testing Laboratories
for the South African National Roads Agency SOC Ltd – The only
constant is changeSANRAL
14h30
Annetjie MyburghInvestigating positively biased test results in an ISO 17025 accredited chemistry water testing laboratory using trend analysis and internal
quality control proceduresERWAT
Oelof KrugerThe new ISO 14253-5:2015 and the
Measurement Uncertainty Associatedwith Test Values in the Calibration of
Measuring InstrumentsNMISA
Nico SinghEskom’s revised Coal Ash Strategy and
Implementation ProgressESKOM
15h00 TEA/COFFEE – EXHIBITION VIEWING
Stream Water Calibration Civil Materials Testing
15h30
Cody MakhubaMeasurement Uncertainty in
a Water Chemistry LaboratoryESKOM
Moses TembaVerification of the new LF vibration
exciter for the secondary calibrations in the secondary laboratory
NMISABarry Pearce
What laboratories need to do in preparation for the new QCTO materials testers qualifications
Learning Matters cc16h00
Michael KhozaReport on the results of the bilateral
capacitance key comparison between BIPM and NMISA (ongoing BIPM key
comparison BIPM.EM-K14)NMISA
16h30
Angelique BothaUpdate on the revision of ISO/IEC 17025:2005
Discussion about the proposed changesNMISA
18h30 PRE-DINNER DRINKS
19h00 BANQUET(Dress code: Jacket and Tie)
T107 T207 T307
T108 T208 T308
T106 T206 T306
T109 T210 T309
T209
T110
3
Stream Water Calibration Civil Materials Testing
11h00
Kelley Reynolds-ClausenBacterial species diversity as an
indicator of biocide efficacyESKOM
Ray JenkinsA new approach to analysing the results
obtained for the calibration of high-accuracy torque and force transducers
Emirates Metrology Institute
Barry PearcePTS - what are the trends telling us
Learning Matters cc
11h30
Dimakso MohaleAssessment of the effect of holding time on total coliforms, and E.coli,
by the Quanti-tray method, and heterotrophic bacteria by the
heterotrophic plate count methodLepelle Northern Water
Riaan BerghRoping in uncertainty - measuring the
tensile strength of steel wire ropesCSIR
Tinus GroblerAdvances in and automation of
commercial geotechnical laboratory testing and testing equipment
SOILLAB
12h00
Gerhard GerickeThe influence of NOM in raw water on
the power industryESKOM
Mike CollinsAn Examination of the Uncertainty of Industrial Deadweight Testers Used for Pressure Calibrations in Different
EnvironmentsFluke Calibration
Jacques Smith / Jaco du PlessisWe use those test results…A critical
review of concrete testing laboratoriesGo Consult
12h30 LUNCH – EXHIBITION VIEWING
T104 T204 T304
T103 T203 T303
T105 T205 T305

Stream Quality Testing Calibration
11h00
Peter BachmayrMeasurement Risks: Consumer
and Producer viewsKeithley Instruments
Elzabe TruterUse and Maintenance of Reference
Cultures in MicrobiologyISO-LAB Consulting
John WilsonWhat is the “Decision Rule”
all about?AMS (Pty) Ltd
11h30
Dharmarai NaickerLIMS: Reengineering the way
South African Laboratories conduct business
PPECB
12h00
Neill RosenthalUsing Digital Signatures in an
Accredited LaboratoryTechnology Systems Integration (Pty) Ltd
12h30 LUNCH
Stream Quality Testing Calibration
13h30
Dion KeetISO/IEC 17025:2005 in a fishbone
Archimedes Laboratory Solutions
Ingrid FlemmingSleuthing sources of error
in laboratoriesIFM Quality Services (Pty) Ltd
Angelique BothaGuidelines for the interpretation of
inter-laboratory comparison results for calibration laboratories
NMISA14h00
Cecilia MakirimaniRecruitment, Training and Competency Evaluation of
Laboratory StaffWorley Parsons
Consulting Engineers
John WilsonExplanation of the MetCert
CPD points systemAMS (Pty) Ltd
14h30
Sam ThemaA National Quality Infrastructure
Model for the promotion of Small and Medium-sized
Enterprises competitiveness in South Africa
SANAS
15h00 CONFERENCE CLOSING
W104
W204 W304
W105
W106
W107
W205 W306
W108
W109
W305
4
DAY 3 • WEDNESDAY 28TH SEPTEMBER 2016
07h45 REGISTRATION AND COFFEE
Stream PLENARY
08h30Thomas Madzivhe
From trade to legal metrologyNRCS
09h15Shadrack Phophi
Accreditation: A Global Tool to Support Public PolicySANAS
10h00Steve Sidney
Imagine no NLA-SA!!NLA-SA
10h30 TEA/COFFEE AND MANNED POSTER SESSION
W101
W102
W103

5
ABSTRACTS • DAY 1 • MONDAY 26TH SEPTEMBER 2016
DAY 1 • M102
Mr Dave Lockwood, Chief Executive Officer, Naledi3d Factory, South Africa
IMAGINE
Imagine: To form a picture or idea in your mind of something that is not real or present. merriam-websterSolomon (c. 976 to 931 BC): “A false balance is an abomination to the Lord, but an accurate weight is his delight”Metrology, the science of accurate measurement, is a highly complex domain based on physical constants, entailing meticulous physical activities. In today’s digital world however, where 3D visualisation is starting to play a major role, actual physical measurement may also become more complex. Turning to 3D visualisation, we often say that a picture paints a thousand words. We read novels, but do we actually read the words? When someone explains something, we often respond by saying “I see what you are saying”. This is because our brains are wired visually, and also why interactive 3D visualisation will become a part of our lives. In Star Trek, the USS Enterprise’s Holodeck bears testament to this.Imagine a world where a picture actually paints a million words. In this world, you would climb into the picture, move around in it, move things around and also interact with them. In this imagined virtual world, the opportunities to explore, and to experiment, would be limitless. However, this world already exists. It is called virtual reality and can be used in many ways. Today’s smart phones and tablets now allow us to embrace new immersive headset technologies such as the Samsung Gear. There are however also many other ways that VR can help us to visualise, and to imagine. The I-Cube for example, allows us to paint those million words as we move around the picture and move things around, explore, and test out our new ideas. The possibilities are indeed, now endless.Huge opportunities also exist to train new practitioners to a level of precision and measurement accuracy (by showing visually); or to explain metrology and measurement to new SME owners, and the public. It is a time to work together to explore how else these new technologies can help us.Who knows where our paths may lead… as we continue to imagine it... (Imagine (John Lennon, 1971): You may say I’m a dreamer / But I’m not the only one / I hope someday you’ll join us / And the world will be as one
DAY 1 • M103
Dr Willie E May, Director, National Institute of Standards and Technology (NIST), United States
METROLOGY: A CATALYST FOR CHANGE. HOW BETTER MEASUREMENTS ENABLE A BETTER FUTURE
Measurements are central to our lives. Our cell phones, internet connections, medical tests, forensic methods, weather and climate forecasts, cybersecurity, engineering standards, and even our sports equipment depend on them. Metrology or “measurement science” facilitates new technology development and acceptance in the marketplace. To paraphrase Lord Kelvin, “to measure is to know.” And a corollary to this is that measurements of known accuracy and uncertainty are a prerequisite to making products reliably and cost effectively. As the last 100 years has shown, advanced measurement methods open up new scientific frontiers, making today’s sophisticated technologies possible. Laser eye surgery, LEDs, 3D printing, autonomous vehicles and GPS, rescue robots, DNA sequencing – all were made possible or advanced by ground breaking measurement science.This talk will focus on how the advanced metrology taking place at NIST is not only helping to re-determining fundamental constants like Avogadro’s number and the Kilogram, improving our realization of time to one part in 15 billion, but also enabling new technologies that will make our cars lighter and stronger, our computers dramatically smarter and faster, our health care to be tailored to each person’s specific genetic makeup, and support next generation communications.
DAY 1 • M104
Mr Guy Snelling, Technical Director, Intercal, South Africa
FROM UNITS TO UNITY (A BRIEF HISTORY OF MEASUREMENT UNITS)
“Imagine It, Measure It!” is the theme of the 2016 Test & Measurement Conference but by the 21st Century man has managed to measure almost everything he can see or indeed can imagine. We have measured the length of the observable universe and have weighed a virus. We can measure the speed of an atomic particle (but not its simultaneous position) and the rate at which caesium atoms oscillate. We can measure the temperature of the sun and (just about) measure the point at which all molecular activity ceases. But what of the past? Our ancestors had the same need to make measurements as we have, just to make their daily lives easier, but the methods often did not exist. Allowing their imagination to roam freely over the centuries allowed the required measurements to firstly be made, and then to be standardised.This paper will take a look back over the eons to a time before metres, litres, minutes and miles. To a life dictated by the length of an arm and a foot, to food sold in baskets and beer sold in caskets and to a period where you slept when it was dark and ate when you were hungry.We will discover how rudimentary measurements were made and how they were refined into the units and standards that we know (and love) today.Join me on a journey through time, itself only an arbitrary measurement, and discover the roots of our ancient profession.
6
DAY 1 • M105
Dr Wynand Louw, Director RIID, National Metrology Institute of South Africa (NMISA), South Africa
SINGLE ELECTRON COUNTING IS NOT IMAGINE ANYMORE
In 2018 four of the seven base units of the International System of Units (the SI) will be redefined with the others to follow. Based on fundamentals of nature, the current definitions although serving science well for many decades, still relies on an artefact as the definitive kilogram (the International Prototype of the Kilogram or IPK) and have an interdependency for the kilogram, ampere, mole and candela. The 2018 re-definition aims to address this and fundamental constants are to serve as the defining reference values for all seven base units and for all derived units in the future. The new definitions stimulates the imagination of how to realise the units in future. The maintenance and dissemination of the IPK is relatively straightforward-but the new definition in terms of the Planck constant requires a Watt balance or Avogadro project to realise, and quantum standards are required for the ampere and its derived units. Exciting concepts for metrologists!The presentation explains the rationale behind the re-definition, explains the consequences for the measurement community, touches on the research conducted in preparation of the new definitions and peep into the future of metrology. Find out what the Watt balance, Avogadro, Optical clock and Quantum Hall projects at the NMISA entail and how the traceability chain will be shortened for Africa.
DAY 1 • M106
Ms Maggi Loubser, Consultant, GeoMag GeoChem, South Africa
CREATIVE WAYS OF USING X-RAY FLUORESCENCE SPECTROMETRY TO INVESTIGATE ART AND ARTEFACTS
X-ray Fluorescence spectroscopy is a mature technique with the theory well described and routinely applied in process control, exploration, mining and manufacturing apart from research and development applications.The “big shrink” as in most analytical technologies was the result of improved electronics and computer chips, and together with the advance of the SDD detector Energy Dispersive XRF was ready to enter the playground. Handheld XRF moved from a metal sorting scanner to an actual quantitative analytical tool.With the sudden mobility, applications were limited only by imagination: Art and Artefacts, the Mars Rovers, Zebra Fish Biology, Archeology, In-Vivo XRF on humans, all became possibilities....but the operating in Cowboy mode will still present you with the data you deserve!This is the part where analytical scientists have to dig deep into their right brain capabilities to find innovative ways to overcome the restrictions the nature of the technique implies, but also the restrictions inherent to the material analysed.In this paper case studies will be discussed, showing how art and artifact analyses are approaced to overcome problems of representative sampling, layering, experimental design, location, infinite thickness etc., and showing the importance of applying imagination when approaching novel applications for the technique.
DAY 1 • M107
Mr Lesibana Abram Bodiba, Chief Chemist, South 32 Hotazel manganese mine, South Africa
ACCURACY EVALUATION OF MATRIX MATCHING CALIBRATION OF MANGANESE ORE ON X-RAY FLUORESCENCE
X-ray fluorescence (XRF) spectrometry is a comparative method of analysis. Press pellet preparation is considered the most economical, fast and easy techniques for analysing the ore. It is well-known that sample mineralogy affect the accuracy of ore samples in the press pellets techniques. The study is aimed at evaluating the current approach of matrix matching as the solution of the above mentioned problems. The secondary standards were sourced from the low grade Kalahari basin for XRF calibration. The experimental results compared very well with true values of the certified reference materials (CRMs) created from the Kalahari basin. The matrix matching method has been successfully used for the analysis of the major and minor elements in the low grade manganese ore of the Kalahari basin.
DAY 1 • M108
Ms Ramakgahlela Wendy Thoka, Metrologist, National Metrology Institute of South Africa, South Africa
COMMISSIONING OF THE BETA SECONDARY STANDARD (BSS2)
The National Metrology Institute of South Africa (NMISA) Dosimetry Section through NMISA’s recapitalization procured a beta secondary standard irradiation facility type 2 (BSS 2). Beta radiation consists of electrons generated in the nucleus by the decay of a neutron into a proton (or vice versa), an electron and a neutrino. The calibration quantities are H’(0.07) and Hp (0.07) as operational quantities to estimate the local skin dose and H’(3) and Hp (3) as operational quantities to estimate the dose to the lens of the eye. The system was commissioned by verification of the personal dose equivalent (Hp (0.07), and software calculated time was checked for correctness using a calibrated stopwatch. An electronic personal dosimeter (EPD) was used to measure the personal dose equivalent (PDE) for 85Kr and 90Sr + 90Y using polymethylmethacrylate (PPMA) and water phantoms with the results for both irradiation medium presented on this paper.

7
DAY 1 • M109
Dr Ljiljana Marjanovic, Technical Specialist, SGS South Africa, South Africa
THE IMAGINATION, INNOVATION AND THE REALITY IN A COMMERCIAL LAB
Year 1878: A small grain inspection house was established somewhere in Europe. The dream was to transform grain trading in Europe, but at some time this dream would wander off to Société Générale de Surveillance, possibly becoming the world’s leading inspection, verification, testing and certification company. Continual improvement and innovation, support to customers and continual improvement of productivity lead to 1800 offices across the world currently and more than 85000 SGS employees. The service activities extended to cover all industry sectors and touch the products and services that consumers around the world rely on every day.The dream has become reality...The company serves a wide range of industries with comprehensive solutions, including minerals, government and institutions, consumer testing, agricultural, industrial, oil, gas and chemical, and environmental services. Experts in different fields of industry are helping the clients on a daily basis to make the most of market developments and advances in technology, enabling them to maximize opportunities and stay ahead of the competitors. The company is constantly expanding the service offering across the global network of industry experts and cutting-edge facilities - delivering competitive advantage to the clients at every stage. Year 2016: in a world of globalization, technology advancement, increasing regulation and fluctuating markets, exploration and mining face more complex challenges than ever before. Quality management systems are constantly adapting and improving to respond to changes in technology and client requirements. While for example South Africa grew at an average of 4.5 percent year-on-year from 2002 to 2008, failure to address structural problems such as the widening gap between rich and poor, low-skilled labour force, high unemployment rate, deteriorating infrastructure, high corruption and crime rates, resulted in current South African growth below African average. GDP from mining in South Africa for example decreased to 219657 ZAR Million in the first quarter of 2016 from 230877 ZAR Million in the fourth quarter of 2015 and it continues to decrease resulting in fewer sample analyses, cancellation of many of the exploration projects. Where does this put the Geochemistry laboratory - with the number of samples halved in the past 2-3 years requiring re-evaluation of the equipment, staff, skills etc.South Africa represents about 73% of the world’s platinum mine production (2013 data), and about 5% of global mining production of gold takes place in RSA with its gold accounting for about 11% of the world’s gold reserves. The nation is the world’s sixth-largest exporter of coal; it produces nearly half of the world’s chromium, and is a significant producer of iron ore, vermiculite, vanadium, rutile, as well as many other metals and minerals. Would it be just our imagination that the geochemistry labs will be great again – let’s see it reached at the next T&M conference.
DAY 1 • M110
Mr Hein Erwin, Managing Director, KoCoS Measurement & Control (PTY) LTD, South Africa
SO YOU THOUGHT THAT CALIBRATING A STANDARD RESISTOR IS EASY
The lowest level of calibration is the R in Ohm’s lawIt is a passive device and if manufactured as a standard, a very good passive device.The author will demonstrate how many factors there are that still can have a bearing on the calibration of Standard Resistors and with visual proof of laboratory results logged over many weeks of monitoring 7 x Standard Resistors even “Old” metrologists will frown upon.Can you really substantiate your claims made in your uncertainty matrix after seeing the results!
DAY 1 • M204
Mr Thomas Mautjana, Section Head Mass and Force, National Metrology Institute of South Africa (NMISA), South Africa
MY BALANCE IS CALIBRATED
Weighing instruments (balances/scales) are widely used to determine mass of various quantities. Their other applications are subject to legal metrology control such as type approval, verification etc. therefore there is a need for them to be confirmed by calibration. Measurements on weighing instruments get affected by local gravity, the load temperature, load density, temperature and density of the surrounding air. The measurements uncertainties provided depend significantly on properties of the instrument itself. In most cases the test does not resemble the operations that are routinely performed by the user. The paper will discuss calibration of weighing instruments and challenges experienced by end users.
DAY 1 • M205
Mr Bongani Ndlovu, Scientist, National Metrology Institute of South Africa (NMISA), South Africa
VOLUME/DENSITY MEASUREMENTS OF IRREGULAR OBJECTS AT NMISA
Accurate volume determination of irregular objects can be complex because there are no standard formulas to be applied. One technique to apply is the water displacement method which is not very accurate. The other is using Archimedes’ principle where the buoyant force exerted by a fluid on the submerged object is equated to the weight of the object. By measuring the mass of the object and knowing the fluid density, the volume of the object can be determined. At NMISA, hydrostatic weighing is applied in the FC-40 fluid to determine the volume of the mass pieces from 1 g to 1 kg. The results for volumes of some of the mass pieces such as the OIML-shaped 50 g weights were measured to within an accuracy of 99.996% with measurement uncertainties of ± 0.0005 cm3. These measurements lead to the determination and confirmation of densities of the materials which is critical for high accuracy mass measurements. This paper will present volume results found for various mass pieces which were used to determine densities of their material.

8
DAY 1 • M206
Mr Dineo Mokobodi, Student, National Metrology Institute of South Africa (NMISA), South Africa
DESIGN AND DEVELOPMENT OF AN ABSOLUTE BALLISTIC GRAVIMETER USING PNEUMATIC ACTUATORS
National Metrology Institute of South Africa (NIMSA) is the metrological institute of SA tasked with development and maintenance of measurements standards in the country. Gravitational force is one the fundamental forces of the universe. The force depends of gravitational acceleration, which is significant value in some base units of measurements and finds major contribution in the fields of geodesy, geophysics and metrology. Absolute gravity measurements provide computation of force and pressure in calibrations labs as weight, and in “Redefinition of Kilogram” it is required to be measured with uncertainty done to a few parts in 109. Ballistic gravimeters uses free falling test mass in a vacuum to determine gravitational acceleration using distance and time coordinate travelled of the test mass.Measuring gravitational acceleration in National Metrology Institutes (NMIs) to uncertainty of 10-7 Gal has become a requirement for maintenance of relevancy in international precision and accurate standard measurements. NMISA is designing a pneumatic powered mechanical controlled vacuum chamber gravimeter using double sided test mass prism to enhance measurements rates. An optical Michelson interferometer using He-Ne 632.8 nm laser as length standard is used to measure the displacement.Signal processing forms the base of the electronics data acquisition and measurements system. Matlab program is used to process the interference signal outputs using real time data while post processing the signal for gravitational acceleration computation using high speed codes programed digitizers.Numerical simulations are performed to simulate free fall gravitational acceleration by introducing noise to the perfect light intensity signal produced by photo receiver. The gravitation acceleration from digital generated data with implemented zero phase change digital filter shows agreements of data with average of 5 parts in 108. Digital signal processing for that matter is adopted for processing the gravitation computation and development. The prototype results will be compared with the signal generated by the simulations.
DAY 1 • M207
Mr Flippie Prinsloo, DCLF Metrologist, National Metrology Institute of South Africa (NMISA), South Africa
TIMING ERRORS IN ENERGY METER CALIBRATION
Since electrical energy is expressed in Wh and is a function of power over a time period, calibration of certain energy meters can be very time consuming. Where legacy power sources are used in the calibration, the problem is to synchronise the start time when power is applied as well as the stop time when power is removed. To reduce this start/stop error a long time period can be used for this measurement. The result is a compromise between small uncertainties and short calibration time.The NMISA developed and implemented a switching mechanism that allows for accurate period measurement between the time that power is applied and the time that power is removed, thus reducing the start/stop error. This presentation describes the method and system that the NMISA implemented to achieve both small uncertainties and short calibration times.
DAY 1 • M208
Mr Pritesh Prakash Jivan, Fiber optics and Time & Frequency, National Metrology Institute of South Africa (NMISA), South Africa
DESIGN CONCEPT FOR FREE SPACE OPTICS
The Time and Frequency department of the National metrology institute of South Africa (NMISA) are in the process of developing an optical time and frequency standard. As a result, a wide range of theory within the field of photonics and fiber optics will be implemented. An understanding of free space optics theory has been undertaken in order to perform calculations on the type of lenses and mirrors required for an initial set-up. The set-up would require beam shaping to be done in order to focus a laser beam onto a rubidium gas cell.Gaussian optics is used to theoretically characterise a simple free space – lens – free space optical system. Various equations are derived in order to verify the type of lenses required and at what distances these lenses are needed to be placed. These equations are derived taking into consideration important beam parameters such as the beam’s Rayleigh range, the radius of curvature and beam waist. The ABCD matrix or ray transfer matrix is used as the basis for the derivations. The equations are derived from first principles and are verified using computer software known as paraxia. The paraxia software will also utilise Gaussian optics to perform simulations. The design concept can then be utilised in the development and innovation of more complex free space optics system, to be used as part of an optical frequency standard.
DAY 1 • M209
Mrs Mariesa Nel, R&D metrologist: Fibre optics, National Metrology Institute of South Africa (NMISA), South Africa
LINKING FIBRE OPTIC POWER MEASUREMENTS IN SA
Have you ever wondered how you are able to instantly login your email or other information anywhere in the world, stream your favourite movie or connect your TV to the internet? Fibre optic networks are the answer to high speed data transmission. High speed and broadband transmissions are very important to animated film companies who recently started to store all their work on the internet, backwards and forwards editing and storing in a secure location. The installation of fibre networks must therefore be done efficiently. One way to test fibre links are with optical power meters measuring the intensity of light (optical power) exiting a fibre optic cable or being generated by an optical source (e.g. laser, laser diode). Optical power is a useful indicator of system performance because it yields the ‘efficiency’ of light transfer of the fibre optic link. A comparison between the optical power received at the end of the link, and the power provided at the fibre input, gives an indication of the amount of power ‘lost’ at each component or connector along the link. Optical power measurements are therefore widely used during installation and maintenance of fibre networks to ensure that the maximum possible signal is transferred. The Fibre optics and Radiometry laboratory at NMISA worked together to calibrate an InGaAs power detector based on both free-space and fibre optic transmission architectures.

9
DAY 1 • M210
Mr Gavin van Rooy, Product Specialist, Comtest Distribution (Pty) LTD., South Africa
ANYBODY CAN TAKE AN IR PICTURE BUT WHAT DOES IT MEAN?
Modern technology makes it very easy to take an Infra-Red picture using a Thermal Imaging Camera but it is the interpretation of the picture that is not so easy. This paper will demonstrate how easy it is to misinterpret the picture and give guidelines on how to approach the correct picture interpretation.
DAY 1 • M211
Mr Gavin McQuillan, Manager CEU, Russia & Israel, Fluke Calibration, United Kingdom
OPTIMIZATION OF A THERMAL RADIATION SOURCE FOR HIGH TEMPERATURE INFRARED THERMOMETER CALIBRATION
Industrial level infrared thermometers are being increasingly designed to measure temperatures above 500 °C. A thermal radiation source is needed to calibrate these instruments. The infrared thermometers designed to measure these temperatures generally measure with a smaller field-of-view. This means there is a possibility of using a blackbody cavity as the thermal radiation source. A previous attempt was made to use a cavity mounted inside of a furnace meant for thermocouple calibration for a thermal radiation source. However, when the cavity’s emissivity was measured, it was found the emissivity was not constant for different wavelengths and was very dependent on cavity position. This paper discuses a new attempt to mount a cavity inside a thermocouple furnace with much better temperature uniformity. It discusses the measurements made to verify the emissivity of the cavity using industrial radiation thermometers. It also talks about measurements made with industrial handheld infrared thermometers and compares these measurements to measurements made using other thermal radiation sources and the associated measurement uncertainty.
DAY 1 • M304
Mr Gerald Woollatt, Director, Levego, South Africa
ESTIMATING MEASUREMENT UNCERTAINTY FOR PARTICULATE EMISSIONS FROM STATIONARY SOURCES
Quantifying or estimating emission uncertainty for particulate matter from stationary sources in South Africa.The estimation of measurement uncertainty with regards to hazardous air pollution emissions from stationary sources is currently the most uncertain element associated with obtaining relevant, valid stack emission data in South Africa. This project is aimed at developing an appropriate method to evaluate the uncertainty associated with particulate matter measurements conducted for stationary source emissions in the South African context. A series of In-Stack measurements were taken in accordance with recognized international methodology (ISO 9096:1992, and 2003) on two different industrial processes, representing a best and worst case scenario. A comparison between the two scenarios was made in an attempt to establish what components of the sampling technique have the greatest error. The effect of cumulative errors in the sampling train as well as external factors that may influence the results were evaluated and included in the final estimate of uncertainty. Some of the factors used included the sampling location, industrial process and external environmental factors.The overarching goal of this project was to establish an estimate of the cumulative uncertainty on the final emission values obtained, inclusive of both analytical, field sampling and process related variables that may result in a cumulative error associated with quantifying stationary source particulate matter emission values. The results of the study found that the estimated combined expanded uncertainty for both sets of data was calculated to be between 62 – 72%. Upon closer analysis of the data it was ascertained that the data obtained were inadequate and the calculation of the uncertainty of the results both with the compliant and non-compliant sampling campaigns revealed that the variability of the results was too great for both scenarios to make any statistically valid observations or conclusions about the data. In lieu of this, and considering the significant costs, time and labour involved in order to obtain enough data to enable adequate quantification of an uncertainty budget for the results obtained, the author has developed an alternative tool for assessing the quality and reliability of reported emission figures. The author has developed what he has named a sampling suitability matrix, this tool although subjective in nature will add significant value (in the authors opinion) to the interpretation of the quality and reliability of the final emission results reported. The intention of this tool is to be incorporated as supplementary information into all emission reports in future. This will enable the plant operator and regulator to assess the quality of reported data and final emission results, thus assisting in establishing whether the plant is in compliance with their Air Emission License (AEL) requirements or not.

10
DAY 1 • M305
Mr Vusi Mahlangu, Laboratory Supervisor, CSIR, South Africa
DETERMINATION OF COMMON METAL ANALYTES IN DIESEL PARTICULATE MATTER SAMPLES FROM SOUTH AFRICAN MINES
An ideal combustion reaction of diesel fuel in a diesel engine yields water vapour (H2O), carbon dioxide (CO2) and some amounts of unused charged air released in the form of emissions. Depending on various factors, the released emissions may vary in composition, including unburnt hydrocarbons, carbon monoxide (CO), nitrogen oxides (NOx) and non-hydrocarbon sulphur compounds.Part of the composition of the released emissions is formed by an aerosol of nano-particles which are known as DPM (diesel particulate matter). These are airborne particles that are coated with heavy toxic hydrocarbons (poly-aromatic hydrocarbons) released as a hot aerosol from the engine exhaust. Their measurement is calculated as a ratio of EC/OC using an aerosol carbon analyser instrument (Thermo-Optical Analyser). The composition of EC (elemental carbon) and OC (organic carbon) is dependent on various factors: (a) the design or type of engine used, (b) fuel additives, (c) burning of engine oil, (d) engine load during diesel combustion, and (e) catalytic converters and diesel particulate filters installed in the engines to minimize the toxicity of the released compounds.Combustion of fuel additives and engine oil gives yield to metals, sulphates and other toxic hydrocarbons while combustion under high engine load gives rise to unburnt hydrocarbons (incomplete combustion). This paper discusses some of the techniques used to characterise the particulate components of DPM samples that were taken from different South African mines. These samples were screened for common analytes and apparent markers using analytical techniques such as X-ray Fluorescence and Atomic Absorption.
DAY 1 • M306
Mr Wiseman Mpilo Dlamini, Scientist: Pressure, Vacuum, National Metrology Institute of South Africa (NMISA), South Africa
CALIBRATION OF BUBBLE FLOW METERS
The Gas Flow laboratory of NMISA currently calibrates the majority of gas flow instrumentation in the range 0,5 ml/min to 50 l/min for the South African industry. This has led to unacceptably long lead times for calibration slots, which has had an adverse effect on the industry.In an effort to encourage industry to develop gas flow calibration capacity to improve this situation, the Gas Flow laboratory of NMISA investigated several calibration methods that can be employed to perform bubble flow meter calibrations. These methods include the use of Mass Flow Meters, Laminar Flow Elements and Piston Provers as Reference Standards. Needle valves and Mass Flow Controllers were used to control the gas flow rate. A standard Bubble Flow Meter Cell (20 cc – 6 LPM) was used as the unit under test (UUT) during the measurements.This paper discusses the different calibration methods, compares the results obtained and their associated measurement uncertainties and then analyses the advantages and disadvantages of each method.
DAY 1 • M307
Mrs Moyahabo Sarah Dikgale, Wind Tunnel Technologist/Calibration, CSIR, South Africa
CALIBRATION OF L-TYPE PITOT TUBES AT LOW SPEEDS
In industry, the air flow speed through ducts and tubing are difficult to obtain using anemometers, which measures wind speeds. A more practical pressure measuring instrument, the pitot tube, is used to measure the fluid flow velocity at a given point. The low pressure levels at low speeds result in reduced accuracy for these pressure sensitive devices. L-type pitot tubes are frequently used as standard reference instruments. The behaviour of several L-type pitot tubes at various speeds as determined in CSIR’s calibration wind tunnel facility are discussed.
DAY 1 • M308
Mr Dheshan Naran, Materials & Plant Integrity, Eskom, South Africa
MEASUREMENT AND PREDICTION OF COAL FLOW RATES IN PULVERISED FUEL PIPES
Purpose: This study has identified various standards, procedure and practices associated with PF sampling which have been evaluated at a full scale Power Stations. Based on the results obtained a level of accuracy for the sampling methods has been established. The purpose of the study was to recommend best practice for PF measurements in Power Utilities. Theoretical framework: Directed interviews were carried out at five Eskom Power Stations and with Subject Matter Experts from Eskom. The scope of the project and the establishment of the following hypothesis; “Current standards and practices for PF measurement used in Eskom are not accurate enough to control the PF distribution to the required accuracy for improving combustion efficiency and LNB implementation” were then developed.Testing this hypothesis involved site tests at one of Eskom’s Power Stations, validation of results and CFD modelling.An automated rotating 4 nozzle sampler and a single nozzle manual sampler were identified as the current equipment utilised by Eskom for PF sampling. The manual sampler was utilised in one of three ways at different sites. Samples could be extracted by carrying out a single axis traverse, a 3 axis traverse or in conjunction with a target plate. These four methods of sample extraction were investigated during the site tests. A site that utilises gravimetric coal feeders was selected for the site tests to facilitate accurate comparisons of the PF mass flows. A total of 924 PF samples were extracted. These samples were further analysed in a Laboratory to determine the moisture content and size fractions. Additional work was carried out to compare results yielded from sampling in vertical pipes to that obtained when sampling in horizontal pipes. The effect of adjusting setting such as velocity and g-factor on the automated sampler were also investigated. The coal flow rates were also compared to models utilised by Research, Testing and Developments in Eskom.Flow pattern development was also studied during the site tests by carrying out incremental sampling. This made it possible to establish the velocity, mass flow and particle size distribution at each point. The information obtained was utilised to visualise the flow development through a cross section of PF pipe.
Continued on next page

11
DAY 1 • M308 (continued)
When utilising a target plate the sampling nozzle is forced to operate at different angles to reach the sampling point locations within the PF pipe. A CFD model was utilised to simulate angles that a sampling nozzle would be subjected to and to predicts the effect on the sample being extracted. Results and conclusions: Preliminary results of the CFD modelling results correlated well with the experimental results showed an increase in the number of particles collected in an angled nozzle compared to a nozzle oriented in the axial direction of flow. The preliminary results of the site testing highlighted that the target plate sampling method overestimated the coal flow, the 3 axis method and the automated rotary sampler yielded very similar consistent and accurate results and the 1 axis sampling unreliable results and proved to be erratic.
DAY 1 • M309
Miss Ncobile Nkosi, Student, NWU, South Africa
FINE PARTICULATE EMISSIONS FROM DOMESTIC BURNING IN LOW INCOME SETTLEMENTS: A CASE STUDY IN KWADELA
Domestic burning is a major source of fine particulate matter (PM10, PM2.5), and widely practiced activity in South Africa. There’s a full body of literature linking emissions of fine PM to cardiovascular and respiratory diseases, but there’s a limited number of local reports on fine PM emission factors. Emission factors are significant because they are used as input parameters to model air quality and to determine source specific emissions. Local emission factors are central to managing air quality for they give real time and space measurements that are representative of an area. The aim of the study was to quantify fine particulate emissions from domestic burning. The objectives of the study are to Characterise KwaDela residents burning habits and quantify PM10 and PM2.5 emission factors. Qualitative and quantitative methods were used; KwaDela residents participated in a fuel use questionnaire conducted by NOVA. The responses to the questionnaires were used to determine the predominant solid fuel used, common medium used to burn fuel and to characterise the resident’s typical burning event. Isokinetic (2015) and direct stack sampling (2014) stack sampling tests were done to quantify PM10 and PM2.5 emitted per kg of fuel burned. The results showed that coal is the predominant fuel used in KwaDela; paper and wood are used as secondary resources to start the fire. The medium used to burn fuel is traditional coal and wood cast iron stove. PM10 emission factor ranged from 2.1-3.5 g.kg-1 of fuel burned and PM2.5 emission factor ranged from 1.5-2.8 g.kg-1 of fuel burned.
DAY 1 • M310
Mr Monray Dean Belelie, Student, North West University, South Africa
EMISSIONS OF MERCURY FROM THE SOUTH AFRICAN POWER SECTOR
Mercury (Hg) is a volatile metal which is ubiquitous in the environment. It has adverse effects on pristine ecosystems and human health due to its persistency, bioaccumulation in the food chain, and toxicity. Unlike other heavy metals, which tend to exist in the atmosphere in particulate phase, Hg mainly exists in the gaseous phase. It is emitted into the atmosphere as gaseous elemental mercury (GEM), reactive gaseous mercury (RGM), and particle-bound mercury (PBM), with the former being the most common atmospheric form. GEM constitutes about 53% of total atmospheric mercury, followed by RGM (37%) and PBM (10%). These species are emitted into the atmosphere by both natural and anthropogenic sources. The former includes volcanoes and outgassing from water bodies and soil, while the latter comprises of artisanal gold mining and fossil fuel combustion. Although the contribution of Hg from natural activities are substantial, anthropogenic activities result in the larger part of annual atmospheric emissions. Of all possible anthropogenic sources of Hg, coal combustion in power generating plants dominates the contribution to the environmental burden thereof. The GEM species are more volatile, less soluble, and more stable in the atmosphere and therefore have longer atmospheric residence times. RGM and PBM have the complete opposite characteristics, hence why they can readily be scavenged by clouds. The different chemical characteristics of these various forms are extremely important, as it determines their environmental behaviour.
Continued from previous page
DAY 1 • M311
Mr Quentin Hurt, Director, SKYSIDE, South Africa
VALIDATION AND VERIFICATION FOR QUALITY EMISSION TESTS
Environmental Protection Agency Test Methods. These methods are set in regulation, are freely available and comprehensive in scope. The tests are widely applied internationally, however, they are difficult to apply to ISO 17025 because they lack verification and validation data in the method.The European methods by contrast, include certain verification tests and validation data as part of the method. This makes these methods well suited to the application of ISO 17025 to emission testing. This paper examines some of the data, checks and tests recommended inthe European methods.Validation is the confirmation that a particular method is suitable for the type of test being conducted. Examples are presented whereby the European methods include this data and the level of detail included, allowing the user to confirm that the tests will be suitable to produce the quality of data required for a specific range of process conditions.Verification is the process of establishing the validity of each test by comparing two or more items or the use of supplementary tests to ensure the accuracy and correctness of information collected during a test. The European methods typically specify a series of checks to be implemented during or after each test to draw this conclusion. This allows the tester to confirm that they have conducted the test correctly and gives the data user confidence in the test result.Both data sets meet the requirements of Section 5.4 (Test and Calibration Methods and Method Validation) of the ISO 17025 standard. South African Minimum Emission Standards (Section 16e) requires that testing is conducted by a SANAS accredited laboratory. The authors argue therefore that the European Test Methods for Emission Testing are a better route for South African test houses to apply in the pursuit of accreditation for their services and compliance with legislation.

12
ABSTRACTS • DAY 2 • TUESDAY 27TH SEPTEMBER 2015
DAY 2 • T101
Mr Ndwakhulu Mukhufhi, Chief Executive Officer, National Metrology Institute of South Africa (NMISA), South Africa
IMAGINE AFRICA AT THE FOREFRONT OF MEASUREMENT SCIENCE
The National Metrology Institute of South Africa (NMISA) as the custodian of the national measurement system not only provides the link to the international measurement system for South Africa, but plays a major role in establishing an internationally recognised measurement system for Africa.Accurate measurement is one of the cornerstones of the economy and an essential capability that needs to be established across the continent. Intra-Africa trade is at 12% of Africa’s total trade –in the words of Minister Jeff Radebe –a scandalous situation. With the continental free trade area (CFTA) a top priority on the AU agenda, imagine an Africa without custom borders, where products can move freely across borders supported by certificates of analysis or calibration that is not only accepted within the continent, but also internationally.This is the dream NMISA has, to establish a direct traceability route for Africa to the International System of Units (the SI) for the base units and to broaden the dissemination of the traceability to support all trade products. To achieve this, NMISA takes the lead with other NMIs in Africa, such as NIS of Egypt, KEBS of Kenya and the ANM / DEFNAT of Tunisia, to develop measurement infrastructure in the region to facilitate a free trade region for the African continent.In the current changing world, focussed on economies moving into the 4th industrial revolution (Industry 4.0) and with the increasing importance of measurements in a dynamic world that must elevate the continent to “dynamic Africa”, the availability of a strong metrology institute and a continental metrology system connected to the wider world is critical to support the required innovation and research that will keep our industry competitive both locally and internationally. The shortening of the traceability chain for the country and continent therefore remains a key strategic focus for the NMISA.
DAY 2 • T102
Mrs Heleen Temple, Senior Manager Standards Development, South African Bureau of Standards (SABS, South Africa)
IMAGINE IT! DREAM IT! STANDARDISE IT!
Does Standardization in and for Conformity assessment mean there is no route for change, improvement or following a different more effective route? This is a paper that will highlight how we can be the master of a standard that meet our needs. Imagine it, Dream it, Standardize it!When we are using standards, they should enhance compatibility, interoperability, safety, quality however in our strive to continuously improve the deliverable there should be no limits. What if it is a new invention? Can we write a standard? What if it is something that nobody else is thinking about? What if it is a new LIMS that can improve reporting in the laboratory or in our sector?If any person in South Africa wants to submit a new idea for a standard the proposal could be done on the SABS website http://www.sabs.co.za
The proposal should be clear and include all of the following:• What type of deliverable do you want – a new standard, a revision or an amendment?• What should the standard cover / be about? Topic to clear with a scope.• Type of standard, ie a test method, product standard, performance standard a guidance standard (how to) or a management system standard? • Are you aware of any other standard or document that already addressing this topic?• Did you write a draft? This is optional, it however can shorten the development process because the committee will understand what you want to achieve.• Experts in the field should be identified
Once SABS Standards Division receive the proposal • Will be verified for national relevance• Will be evaluated for completeness• May be rejected if in conflict with legislation• May be returned for more information
• May be allocated to a relevant committee• May lead to establishment of new committee• Proposer may be advised of an existing standard or a standard under development • Proposer may be requested to convene a WG
Development of a National Standard (SANS)• Submission of proposal to SABS Standards• Research and impact assessment done• Allocation of PWI to relevant committee• Establishment of WG • Development of WD• Circulation of CD• Circulation of DSS for public enquiry• Publication of SANS• Maintenance of SANS
Where SABS fits into StandardizationThe South African Bureau of Standards offers a full spectrum of standards development, information and conformity assessment services for over 70 years! We reorganized the entity over the past few years to separate some activities to ensure impartiality and proper accountability of our subsidy grant. SABS has a proud record of participation in the development of international standards, and as an established standards body in a developing region, SABS has a significant role to play in the development of a Standards, Quality assurance, Accreditation and Metrology (SQAM) infrastructure in the South African Development Community (SADC). SABS is a member of regional standard coordination forum, SADCSTAN as well as member of ARSO.SABS is committed to providing standardization services that improve the competitiveness of South Africa through the understanding and development of standardization products and services within South Africa, regionally and internationally.”

13
DAY 2 • T105
Mr Gerhard Gericke, Snr Consultant, Eskom RT&D, South Africa
THE INFLUENCE OF NOM IN RAW WATER ON THE POWER INDUSTRY
The focus of this paper is on the influence of natural organic matter (NOM) in the Eskom power generation plants of South Africa and the strides taken by the Eskom power utility to deal with the challenges presented by the occurrence of NOM. This paper concludes the research programme that was established by Eskom to identify and address the organics presents in the raw water and their impact on power plant operation. Characterization of raw water sources supplying Eskom was done by extensively sampling the raw water systems on a monthly basis. The NOM composition of all the samples was studied first by applying conventional (industrial) techniques (UV, DOC, SUVA-254 and bulk water parameters). NOM characterization was further conducted using advanced techniques (BDOC, PRAM and FEEM) which were aimed at developing rapid assessment protocols. The treatability and removal of the NOM in a water treatment train was investigated by determining the character and composition of the NOM samples taken at various stages of the water treatment process. Identification of NOM in Eskom Identification of NOM in Eskom raw water supplies was performed by making use of LC-OCD and SUVA-254 to determine the treatability of the water from the various catchments supplying the Eskom power plants.
DAY 2 • T104
Miss Dimakso Mohale, Graduate technicican Microbiologist, Lepelle Northern Water, South Africa
ASSESSMENT OF THE EFFECT OF HOLDING TIME ON TOTAL COLIFORMS, AND E.COLI, BY THE QUANTI-TRAY METHOD, AND HETEROTROPHIC BACTERIA BY THE HETEROTROPHIC PLATE COUNT METHOD
Background: Holding time can have a significant impact on the density of microbiological indicators at the time of sample analysis. Holding time and temperature according to the standard method 2005:9060 B, E.coli; must be analysed within 8 hours after collection, or kept overnight (24 hours) at < 8°C, sample storage must not exceed 30 hours. Total coliforms must be analysed on the day of receipt, if not, the samples must be refrigeratead overnight at a temperature of < 8°C and must not exceed 30 hours holding time from collection to analysis. Heterotrophic plate count must be analysed within 8 hours of sample collection, or within 24 hours when stored at <8°C. Most water laboratories serve large geographical areas and receives samples from distant water supplies. These samples must be packed in a cooler box with ice packs at a temperature of < 10°C after collection and transported to the laboratory. Some samples arrive late in the laboratory due to long travelling distances and cannot be analysed within the 8 hour period, they must be stored in a refrigerator at a temperature of < 8°C for 24 hours. Method: Collect samples and divide them into 4, analyse the first batch and store the other two replicate at 8°C for 24 and 48hours. Using Colilert 18 iddex quanti-tray method for total coliform, and E.coli, pour plate for heterotrophic plate counts. Analyse each and every sample in duplicate, after incubation count the first replicate and store the other replicate in a fridge at <8°C for 24-48 hoursResults: A total of 30 samples were collected, 3.33% significant difference in heterotrophs, however samples with low bacterial counts will not be detected after 24 hours holding time i;e this study indicated that samples with 5 and less colony forming units will not be detected after 24 hours holding time. Out of 30 samples only one sample showed significant decrease in colony forming units.E.coli holding time indicated 16% difference and 20% difference after 24 and 48 hours holding times respectively. However 8% of the samples indicated, that samples that contains 5 or less E.coli have a slight probability of being undetectedConclusion: Water samples for the detection of HPC,TC,FC, and E.coli can be stored up to 24 hours provided they are stored at <10°C immediately after sampling.
DAY 2 • T106
Miss Carinne Joubert, Senior Project Manager, National Laboratory Association-South Africa, South Africa
PROFICIENCY TESTING IN MICROBIOLOGY: STATISTICS, PERFORMANCE CRITERIA AND THE USE OF PROFICIENCY DATA
Many laboratories participate in proficiency testing because it is a requirement of laboratory accreditation. However, do both management and staff understand the principles of the statistical analysis of proficiency data and how to effectively interpret and use the proficiency performance results as part of the quality management system in the laboratory? This presentation will give a brief overview of statistical methods and performance criteria used by the NLA-SA in its Food and Water Microbiology proficiency testing schemes, as well as how to effectively use and follow up on proficiency testing results.
DAY 2 • T103
Mrs Kelley Reynolds-Clausen, Senior Consultant - Microbiology, Eskom Holdings, South Africa
BACTERIAL SPECIES DIVERSITY AS AN INDICATOR OF BIOCIDE EFFICACY
Biological control of microbiology in water systems is conventionally controlled by the use of biocides and biodispersants. There is however no simple means of determining the efficacy of the chemical dosage. At present this is conducted by complex bacterial culturing in an analytical microbiology laboratory. The concept of survival of the fittest is not new and can be readily applied to the bacterial community. If a stress is applied to a bacterial environment it is therefore likely that the numbers and bacterial species diversity will change. Biolog Ecoplates have been used to detect changes in bacterial population in waste water plants, natural rivers and soils. These plates comprise of 31 different carbon substrates, repeated in triplicate, on a microtitre plate. Once the sample is added to the wells, the bacteria capable of metabolising the carbon source respire the substrate and cause the water in the well to turn purple. This is indicative of a positive result. It is hypothesized that the addition of a biocide to an aquatic environment should cause the resident bacterial population to change both in terms of numbers and species diversity.
14
DAY 2 • T108
Mrs Anna Catharina Myburgh, Quality Control Chemist, East Rand Water Care Company (ERWAT), South Africa
INVESTIGATING POSITIVELY BIASED TEST RESULTS IN AN ISO 17025 ACCREDITED CHEMISTRY WATER TESTING LABORATORY USING TREND ANALYSIS AND INTERNAL QUALITY CONTROL PROCEDURES
Having protocols in place to monitor trends in quality control and analytical test results is a requirement from ISO/IEC 17025. ERWAT Laboratory has various procedures and protocols in place to ensure valid test results and identify any trends. Bias can be defined as the deviation from the true test value. When evaluated, two test methods employed by ERWAT Laboratory – i.e. for analysing zinc (Zn) and chloride (Cl) in water and wastewater samples – showed positively biased results. The use of Certified Reference Materials (CRMs), in-house quality controls and participation in Proficiency Testing Schemes (PTS) all proved highly valuable in evaluating trends and identifying biased results. In this case study, daily QC testing and results from participation in PT schemes showed positively biased test results for both the Zn and Cl methods employed by ERWAT Laboratory. Finding the cause of the biased results is challenging and investigations are still underway. Ishikawa diagrams were used to identify possible causes, but none of the identified causes could be attributed to the biased results. However, because ERWAT Laboratory often test samples for compliance to national laws and municipal by-laws, biased results are considered significant and therefor both methods have temporarily been suspended. This paper describes how trend analyses of PTS and quality control data showed positively biased test results and discuss possible action plans needed to rectify the biased results.
DAY 2 • T109
Mrs Codliver Constance (Cody) Makhuba, Snr Advisor Chemistry, Eskom Holdings Soc Ltd, South Africa
MEASUREMENT UNCERTAINTY IN A WATER CHEMISTRY LABORATORY
The tutorial outlines the uncertainty budget estimation for the analysis of Reactive-silica(SiO2) using the Ultra-Violet Visible Spectrophotometry technique in a water chemistry laboratory.The approach involves the identification of various components contributing as errors in a test method, which are then grouped and characterized. The components were then quantified statistically and combined to give the expanded uncertainty of the method.The description of these components and the illustration of the characterization have proven to be an effective way of training the laboratory staff on uncertainty budget estimation.Although the measurement uncertainty is not frequently requested by customers, understanding the errors associated with a specific task has become a strict requirement for testing and calibration laboratories.
DAY 2 • T110
Dr Angelique Botha, Chief metrologist, National Metrology Institute of South Africa (NMISA), South Africa
UPDATE ON THE REVISION OF ISO/IEC 17025:2005
The revision of ISO/IEC 17025:2005, which started at the end of 2014 has now reached the stage where the draft text for the draft international standard (DIS) will be discussed at the 5th meeting of ISO/CASCO/WG44. During this revision the document has been aligned to the agreed format of the ISO 17000 series conformity assessment standards.The major issues that were debated since the early stages of the revision included the question whether sampling can be accredited under ISO/IEC 17025 as a stand-alone activity. Another issue was the extent to which the revised standard will allow the subcontracting of calibration and testing services by laboratories. The clause on metrological traceability has also sparked a lot of debate and has been revised to be more inclusive of the emerging testing fields, such as biological measurement where reference materials instead of measurement standards are used for the dissemination of measurement traceability.This paper will give an introduction to the major changes that is being proposed in the new standard and will include a discussion session for all interested parties in the calibration and testing community of South African and the rest of the African region.
DAY 2 • T107
Mr Vinay Moodley, Director, MiChem Dynamics (Pty) Ltd, South Africa
SANAS ASSESSMENTS IN THE MICROBIOLOGY LABORATORY
Conforming to ISO/IEC 17025:2005 and tailored SANAS requirements are key in becoming a SANAS accredited laboratory. Obtaining this accreditation is usually a once-off exercise, but subsequent to that, there will be old hands leaving, new junior staff joining, equipment replaced, suppliers changed, new methods introduced and ultimately customer requirements altered, in a rapid changing business environment. These challenges makes it difficult for laboratories to maintain their SANAS accreditation. Recurring and common non-conformance’s found in the microbiology laboratory will be the theme of this paper. Detailed discussion will take place on the following topics:Staff competency, with emphasis on the laboratory analyst and the technical signatories; Method validation, focusing on validation parameters; Equipment calibration, stressing the importance of frequency and certificate evaluation; Daily quality control; and Reporting of uncertainty of measurement on final test reports.

15
DAY 2 • T204
Mr Riaan Bergh, Business manager, CSIR, South Africa
ROPING IN UNCERTAINTY - MEASURING THE TENSILE STRENGTH OF STEEL WIRE ROPES
The CSIR Rope Testing Laboratory is responsible for destructive tensile testing of samples from steel wire ropes used on mine winders throughout South Africa. The regular testing of winder ropes are not only a legal requirement, but also of critical importance to enable early detection of degradation of the condition of the rope so that it may be replaced before the safety of people and equipment is endangered. To this end it is important the result of the tensile strength test is reported with known uncertainty. The estimation of the uncertainty of the measured breaking strength poses some interesting challenges for which practical solutions had to be developed.
DAY 2 • T205
Mr Mike Collins, Regional Product Manager, Fluke Calibration, South Africa
AN EXAMINATION OF THE UNCERTAINTY OF INDUSTRIAL DEADWEIGHT TESTERS USED FOR PRESSURE CALIBRATIONS IN DIFFERENT ENVIRONMENTS
The industrial deadweight tester (IDWT) is a dead weight pressure gauge that is designed, built, and calibrated to be used without having to make corrections or calculate pressure. In practice, the level of corrections ranges from no corrections, or relying on the pressure value engraved on the weights, to using the full pressure equation to calculate a reference pressure. The environments in which IDWTs are used also differ. Some IDWTs are portable enough to be used in an open environment, some are used on production floors, and some are used as references in laboratories with a controlled environment. It is not always clear what the uncertainty specifications are for the variety of levels of corrections and environments. This paper carefully examines the levels of corrections made and applies them to an industrial environment, and provides the tools to be able to perform a valid uncertainty analysis in pressure.
DAY 2 • T206
Ms Faith Hungwe, Scientist, National Metrology Institute of South Africa, National Metrology Institute of South Africa (NMISA), South Africa
IMPROVEMENTS IN SURFACE TEXTURE AT NMISA
Surface texture, or surface finish is the nature of a surface and this can be broken down into 3 components; roughness, waviness and form. In engineering, surface texture, (often shorten to roughness) is what is normally referred to as surface finish. This quality plays a very important role in machined parts as it affects the performance of the parts such as efficiency, durability and airtightness. The National Metrology Institute of South Africa supplies to traceability to industrial surface texture measurements by calibrating their standards.In an effort to continuously improve our offerings and services to industry, the NMISA’s Length section’s surface texture machine was upgraded. The upgraded system was validated through an international inter-comparison and consequently, we extended our scope of accreditation for one more surface roughness parameter. We will present the new upgraded capability and the results of the inter-comparison.
DAY 2 • T207
Mr Poloko Theophillus Kuduntwane, Scientist/Engineer, National Metrology Institute of South Africa (NMISA), South Africa
VERTICAL ANGLE CALIBRATION OF A THEODOLITE
Theodolites are one of a wide range of geodetic measuring instruments used in the geodesy, surveying and civil engineering industry. They are used to perform accurate angle measurements in both horizontal and vertical planes. Testing and calibration of these instruments is quite a complicated task, especially their vertical angles. Calibration of horizontal angles can be performed relatively easier by using angle reference standards, but these methods cannot be practically used for calibration of vertical angles. This paper will describe and investigate other practical methods for calibration of vertical angles. The first method is based on the polygon-autocollimator system. The polygon has 12 mirrors that give 30° angle increments. The second method is based on a trigonometric angle determination.
DAY 2 • T203
Mr Ray Jenkins, Head of Force, Torque and Pressure, Emirates Metrology Institute, United Arab Emirates
A NEW APPROACH TO ANALYSING THE RESULTS OBTAINED FOR THE CALIBRATION OF HIGH-ACCURACY TORQUE AND FORCE TRANSDUCERS
An inter laboratory comparison of the torque standard machines at EMI and Norbar Torque Tools was undertaken over the range 100 N•m to 1000 N•m using both supported and unsupported calibration beams. Results obtained with the 1000 N•m transfer standard torque transducer were analysed using methods given in various national and international procedure standards to determine measurement uncertainty. The contribution due to reproducibility was significantly reduced by using the method of least-squares to determine a best-fit sinusoidal relationship between the transducer’s output and its position of rotation in the torque standard machine.The paper gives the results of the inter laboratory comparison and the calculations of uncertainty using different methods. The same approach was used for analysing the results obtained for the verification of the EMI 5 MN force standard machine using transfer standard force transducers.

16
DAY 2 • T209
Mr Moses Temba, Metrologist, NMISA, South Africa
VERIFICATION OF THE NEW LF VIBRATION EXCITER FOR THE SECONDARY CALIBRATIONS IN THE SECONDARY LABORATORY
The Vibration laboratory of the National Metrology Institute of South Africa (NMISA) has recently acquired new low frequency exciters during the recapitalization, in replacing the old low frequency exciters. These exciters will be used with the secondary vibration calibration system, also acquired recently, to disseminate measurements in low frequency ranges down to 0,2 Hz.Measurements results of a particular transducer obtained from different laboratories using their own systems were compared. A transducer which was calibrated at Spektra and NMISA, using the primary calibration method, was used as the transfer standard to compare with the results obtained using the new secondary setup. The calibration systems used, are employed using different calibration methodologies, i.e. methods in compliance with ISO 16063-11 and ISO16063-21 standard documents. In practice one would not expect any significant differences between the calibration results obtained from different laboratories, though they might be using different exciter types, i.e. the air bearing and the ball bearing type for the measurement in low frequency. A study was undertaken where calibration results from three different laboratory systems were compared. The results were then evaluated in order to identify if there was any significant difference. The comparison protocol followed and the results thereof are presented in this paper. Conclusions will be made to identify best practices to be employed when performing accelerometer calibrations.
DAY 2 • T210
Mr Michael Khoza, DC low frequency Metrologist, NMISA, South Africa
REPORT ON THE RESULTS OF THE BILATERAL CAPACITANCE KEY COMPARISON BETWEEN BIPM, FRANCE AND NMISA, SOUTH AFRICA (ONGOING BIPM KEY COMPARISON BIPM.EM-K14)
The National Metrology Institute of South Africa (NMISA) has participated in the bilateral key comparison of 10 pF and 100 pF capacitance standards (BIPM.EM-K14), between NMISA, South Africa and BIPM, France. Measurements were performed at 1 000 Hz and 1 592 Hz. The primary objectives of NMISA participating in the comparison are to prove competency, support the accredited measurement capabilities, quality assurance of the results, support mutual confidence and recognition, and demonstrate the international degrees of equivalence in capacitance measurements amongst other national metrology institutes. The comparison was carried out in BIPM-NMISA-BIPM measurement sequence. The standards were measured by BIPM, then NMISA and lastly BIPM. The BIPM was the pilot laboratory. This report details the measurement setup, procedure, results and uncertainty budget.
DAY 2 • T303
Mr Barry Pearce, Member/Owner, Learning Matters etc, South Africa
PTS - WHAT ARE THE TRENDS TELLING US
This paper will outline what the trends of the previous 5 years of PTS are telling us regarding the improvement in laboratory testing as well as areas still requiring some attention.A general overview of the changes made to the analysis methods used & the automatic system now utilized to generate the reports will also be covered.
DAY 2 • T208
Mr Oelof Kruger, Section Head, NMISA, South Africa
THE NEW ISO 14253-5:2015 AND THE MEASUREMENT UNCERTAINTY ASSOCIATED IN VERIFICATION TESTING OF INDICATING MEASURING INSTRUMENTS
ISO 14253-1 has been published more than 10 years ago but over the last few years updates on the implementation of these were/are still published in the form of different parts. These parts are to clarify the use of this ISO standard in practise. In 2015 a new part to this series was published, part 5.ISO 14253 is a series of the Geometrical product specification (GPS) family of standards. ISO 14253 is – Inspection by measurement of workpieces and measuring equipment.Part 5: Uncertainty in verification testing of indicating measuring instruments is in addition to part 2 which is: Guidance for the estimation of uncertainty in GPS measurement, in calibration of measuring equipment and in product verification.During the presentation these ISO standards will be explained but will focus on part 5. The practical impact of these will be explained with examples. The examples will focus on dimensional measuring equipment eg. External micrometer and Vernier callipers will be some of the examples used.

17
DAY 2 • T305
Mr Jacques Henry Smith, Managing Member, Go Consult, South Africa
WE USE THOSE TEST RESULTS…A CRITICAL REVIEW OF CONCRETE TESTING LABORATORIES
Albeit that Go Consult does some testing of concrete and concrete aggregates, Go Consult is also involved with the disputes that arise from materials that allegedly do not comply with specifications based on test results obtained from various testing houses. The concept in our law is that he who claims must provide proof and if these results are not obtained in such a manner that the balance of probability points towards a failure, then these allegations cannot be made. In a lot of cases these results are interpreted by Engineers who will use fractions to base very expensive decisions on. Frequently the testing houses will not even test that accurately and we have even found huge differences in testing of the same material between accredited facilities. We then have to sit on the receiving end of results that are obviously not correct. This is a view from the perspective of the receiver of the test results and how small errors have huge implications by giving a few examples of what has happened in the past.
DAY 2 • T306
Mr Thabo Chesalokile, Accreditation Manager, SANAS, South Africa
HOW SANAS INTENDS TO MANAGE ACCREDITATION OF REMOTE CONSTRUCTION MATERIALS TESTING
It has been a while now since we have been considering a possible and suitable solution for accreditation of remote Construction Materials testing facilities.The challenge we are faced with is that most of the contracts awarded to accredited facilities to do site work do not last long enough to allow for an assessment to take place in line with SANAS’s normal timelines. It is for this reason that we need to look at each application on its merit and take into consideration its unique circumstances.We aim to discuss the link between the base laboratory and the remote laboratory. This will cover the responsibilities of the technical signatories and technical personnel who might also be part of the remote testing facilities.An accredited base laboratory cannot assume that its remote facility falls under the SANAS accreditation if SANAS has not granted approval for such.The remote facilities accreditation period will be directly linked to the contract lifespan. SANAS will ensure that all requirements are met at all times and that they are not compromised due to the short lifespan of the remote testing facilities.
DAY 2 • T307
Mr Sean Strydom, Materials Specilist, South African National Roads Agency SOC Ltd, South Africa
TENDERING BY CIVIL ENGINEERING MATERIALS TESTING LABORATORIES FOR THE SOUTH AFRICAN NATIONAL ROADS AGENCY SOC LTD – THE ONLY CONSTANT IS CHANGE
The continuous development and improvements in Supply Chain Management being sought and prescribed for State Owned Companies by National Treasury means that the only constant is change.In the past year it has occurrence numerous times that the SANRAL procure the service of laboratories directly meaning that all the First Tier Procurement regulation has to be met. As such the standard Procurement Proforma Tender document has to be ready for either First or Second Tier Procurement.Very much still part of the Tender documentation is the functionality or quality threshold. Although not much has changed in this area, the system will once again be explained and a practical example demonstrated.Of the changes made in recent updates in the proforma, the introduction of the matrix of laboratory type and class, is the most significant and clarity around this will be part of the presentation.The future holds the introduction of the two-envelope system for laboratory tenders and commercial laboratories interested in tendering shall certainly find gain in attending this informative session.
DAY 2 • T304
Mr Tinus Grobler, Technical Manager, Soillab, South Africa
ADVANCES IN AND AUTOMATION OF GEOTECHNICAL LABORATORY TESTING AND TESTING EQUIPMENT
Geotechnical laboratory testing plays an integral part in geotechnical investigations and projects. Due to an increasing demand in the quantity of quality geotechnical testing results, there were some significant technological improvements used in geotechnical laboratory. One of the advances is the use of computers and computer software for data acquisition, processing of raw data and operation of equipment. Automation of geotechnical testing is now employed, but is still a controversial topic. The increasing demand to deliver results in a shorter turn-around time was the main driving force behind the automation of testing. The disadvantages of automation can mostly be overcome by the use of quality measuring and monitoring equipment, the use of remote desktop equipment to control and monitor testing and the extensive training of technicians.The advances in equipment create exciting opportunities for the development of new geotechnical laboratory test methods.

18
DAY 2 • T308
Mr Nico Singh, BMS Manager, Eskom Holdings, South Africa
ESKOM’S REVISED COAL ASH STRATEGY AND IMPLEMENTATION PROGRESS
Eskom has embarked on a process to increase the utilisation of the ash produced through the electricity generation process at its coal fired power stations.In the 2014/15 financial year, 119.2 million tons of coal was consumed, producing 34.4 million tons (28.9%) of ash. Approximately 7% of the Eskom ash is sold from 6 of the 13 Eskom coal-fired power stations. Many stations are currently running out of ash storage space - expansion of the ash disposal facilities is required and could impact security of supply. In addition, recent legislative requirements have led to extra requirements for ash storage facilities, requiring high capital expenditure. Increased utilisation of ash will postpone or ultimately avoid such capital expenditure. The South African legislative framework pertaining to waste management strictly governs ash utilisation. Unlocking legislation would be a key enabler to market development of ash applications. It is for this reason that Eskom has rejuvenated its Ash Utilisation Project by submitting a landmark application to the Department of Environmental Affairs on behalf of the industry. Eskom is therefore leading a strong advocacy campaign for ash utilisation and calls on ash producers to support the initiative.Ash could play a key role in business development, job creation and localisation – specifically in the brick making and construction industries. The development of small brick making facilities in close proximity to power stations is ideal. It is imperative to simultaneously develop new markets that consume high volumes of ash - these include road construction and soil amelioration. The backfilling of mines with ash may provide an ideal opportunity – tied collieries are located in close proximity to the power stations and could utilise large volumes of ash. At the same time this will benefit the ability to rehabilitate mines more cost efficiently and minimise subsidence. Naturally, care needs to be taken on the environmental and health impact of this application.Multiple benefits can be derived from dealing with ash in an environmentally responsible way. Not only will the environmental footprint be limited, new applications will reduce CO2 emissions, acid mine drainage can be treated and mine rehabilitation supported. Eskom cost reduction benefits could eventually filter through to the electricity consumer in terms of the electricity price and satisfactory socio-economic benefits can be realised through enterprise business development, localisation and job creation.
DAY 2 • T309
Mr Barry Pearce, Member/Owner, Learning Matters etc, South Africa
WHAT LABORATORIES NEED TO DO IN PREPARATION FOR THE NEW QCTO MATERIALS TESTERS QUALIFICATIONS
This presentation will outline to the laboratory personnel present what they need to do to prepare themselves for undertaking the training on their premises. There will also be a brief outline of the course itself including time lines plus the various options available to the delegates.In preparation to undertake the training, the laboratories will need to look at the following:• Registration as a training provider & appointing a training provider for the modules they can’t present.• Ranking their staff to undertake the training & scheduling who will be undertaking the studies in which years.• Completing the FLC assessments• Registering of internal mentors, moderators & assessors• Inter-lab training agreements• Recording of correct documentation• Registering the delegates• Summative vs formative assessments• RPL proceduresThere will be an opportunity for Q&A after the presentation to clear up aspects that are not clear or where further details are necessary. This will also be ab opportunity to put forward suggestions that can still be incorporated into the framework document which will be submitted to QCTO during the 1st quarter of 2017.
ABSTRACTS • DAY 3 • WEDNESDAY 28TH SEPTEMBER 2015
DAY 3 • W101
Mr Thomas Madzivhe, General Manager : Legal Metrol, NRCS, South Africa
FROM TRADE TO LEGAL METROLOGY
The presentation will give a background as to why legal metrology is necessary in a modern society. It will also give a brief history of what necessitated the implementation of the Legal Metrology Act in 2014. The paper will further deal with the implications of introducing this new Act and what the current status of implementation is. It will furthermore unpack the development of technical regulation in support of the Act and discuss the possible impact thereof on other South African regulators and technical infrastructure entities. It would also highlight key issues that the dti, with assistance from the NRCS, has to deal with, for example: the separation of the repair and verification functions to deal with possible conflict of interest between these activities; the registration of importers, manufacturers and persons who offer for sale any prescribed measuring instrument, product or services and ensuring adequate capacity and resources to implement the Act effectively. The paper will conclude on the way forward to ensure a strong legal measurement system in South Africa.

19
DAY 3 • W102
Mr Shadrack Phophi, Accreditation Manager, SANAS, South Africa
ACCREDITATION: A GLOBAL TOOL TO SUPPORT PUBLIC POLICY
SANAS, as the largest accreditation body in Africa, continued to play a leading role in SADC and on the African continent by supporting the creation of the required internationally recognised accreditation infrastructure for SADC and Africa. SANAS plays a key role in South Africa’s economy by facilitating a network of competent conformity assessment bodies (CABs) through an impartial and transparent mechanism for organisations to independently demonstrate their competence, providing national, regional and global trust in the quality of its goods and services, fostering the beneficial exchange of goods and services, and providing a service that is recognised as equitable to best international practice. The value that SANAS offers to the South African economy is a growing network of accredited conformity assessment facilities that can service the testing, inspection and certification needs of South African manufacturers and exporters of products and services, as well as supporting socio-economic issues such as health, safety and environmental protection. This is combined with highly specialised knowledge and a competent skills base, and the facilitation of the international recognition of conformity assessment results produced by accredited CABs both.
DAY 3 • W103
Mr Steve Sidney, Director, National Laboratory Association-South Africa, South Africa
IMAGINE NO NLA-SA !!
Today it is hard to imagine a testing and calibration world without the National Laboratory Association – South Africa. Going back a short 16 years or so, the NLA-SA and its role in both the South African and broader Africa context had not been clearly envisaged. However, in what has been this relatively short time the organisation has grown and matured to the point where it now fills many roles and has become a household name for both Calibration as well as Testing Laboratories.The author will provide a short overview of what the NLA-SA does and will also serve as an update in the following key areas.• Training• PT Schemes• Professional Registration – MetCert • Conferences• SRLAThe objective of the presentation is to both inform those who are not that familiar with the NLA-SA as well as to update the membership on some current developments
DAY 3 • W104
Eng. Peter Bachmayr, Technical Marketing Manager, Keithley Instruments, United Kingdom
MEASUREMENT RISKS: CONSUMER AND PRODUCER VIEWS
This paper will address the risks that are associated with measurements and covers matters such as Guardbanding and other accepted methods of Risk Qualification as seen from both the producer and consumer points of view.
DAY 3 • W105
Dr Dharmarai Naicker, GM: Laboratory, PPECB, South Africa
LIMS: REENGINEERING THE WAY SOUTH AFRICAN LABORATORIES CONDUCT BUSINESS
One of the most important aims of a LIMS is the integration of many different processes such as the receipt of samples, testing as per the customer’s requirements, generating results and certificates of analysis. By bringing together and consolidating the efforts of many analysts and speeding up these processes, LIMS can save considerable amounts of time and dramatically improve the access of results to analysts and ultimately the customer. A study was conducted to assess the current implementation of LIMS in testing laboratories in South Africa, as part of the business process re engineering of the life science industry using a mixed methodology approach. Of the 328 laboratories that were requested to participate in the survey only 72 (22%) of the laboratories responded, with 66 (92%) agreeing to participate and 8% declining to participate further in the survey. Of the 72 laboratories, 32 completed the questionnaire. The majority of these laboratories (24%) use LIMS for sample management while 20% use LIMS for analyses with calculations, 19% for user reporting, 14% for workflow automation, 11% for quality assurance and control and 36% for instrument connection. When investigating the status of LIMS service providers in the South African market and their strengths and weakness and opportunities for improvement, Lab Ware was the preferred vendor for 36% of the respondents. Cost was mentioned as a weakness of some of the LIMS vendors by half of the respondents in the survey. Just under half of the respondents (46.7%) mentioned costly improvements as a weakness of the LIMS. In analyzing what laboratories thought about the future of LIMS, 58% indicated that they plan to implement LIMS in the cloud, 25% through mobile devices and 17% through tablets. By following the steps of conducting a proper needs analysis, identifying the project, determining the functional requirements, functional design, implementation, system integration and system evaluation, it is envisaged that laboratories will be able to implement a LIMS that will meet the objectives of faster turnaround times, automation, increased productivity, higher quality of data, electronic reporting, and integration with other enterprise databases.

20
DAY 3 • W106
Mr Neill Rosenthal, Director, Technology Systems Integration (Pty) Ltd, South Africa
USING DIGITAL SIGNATURES IN AN ACCREDITED LABORATORY
Introduction: The use of digital signatures in the laboratory (and in general) promises a number of benefits such as increased security and faster turn-around times as well as reduction in printing costs and storage space. Although the technology has been available for some time, it is not yet in widespread use in South African laboratories. In this paper we will attempt to remove some of the mystery surrounding digital signatures. We will demonstrate how digital signing can be integrated into the lab’s workflow with a practical example.What is a digital signature? The term digital signature – or electronic signature – means different things to different people. We will explain what is meant by the term in the context of it being legally equivalent to a hand-written signature. How does it work? We’ll have a simple look at the complex technology behind digital signatures.The SANAS view: All well and good, but can it be used it in an accredited laboratory? Let’s see what SANAS says … How to obtain a digital signature: There is a strictly defined process for obtaining a legally valid digital signature. We will explain what it involves and what the costs are.Digital signing in the lab: Finally we will demonstrate with a practical example how digital signing has been integrated with a LIMS for signing Certificates of Analysis.
DAY 3 • W107
Mr Dion Keet, Archimedes Laboratory Solutions, South Africa
ISO/IEC 17025:2005 IN A FISHBONE. GENERAL REQUIREMENTS FOR THE COMPETENCE OF TESTING AND CALIBRATION LABORATORIES IN A FISH BONE.
Ishikawa diagrams (also called fishbone diagrams, herringbone diagrams, cause-and-effect diagrams, or Fishikawa) are causal diagrams created by Kaoru Ishikawa (1968) that show the causes of a specific event. Common uses of the Ishikawa diagram are product design and quality defect prevention to identify potential factors causing an overall effect. Each cause or reason for imperfection is a source of variation. Causes are usually grouped into major categories to identify these sources of variation. The technical categories include• Sampling 5.7: Material or product is taken to provide for testing or calibration a representative sample of the whole. Sampling.• Handling 5.8: The transportation, receipt, handling, protection, retention and/or disposal of test and/or calibration items.• Personnel 5.2: Anyone involved with the process.• Methods 5.4: How the process is performed and the specific requirements for doing it, such as policies, procedures, rules, regulations and laws.• Machines Equipment 5.5: Any equipment, computers, tools, etc. required to accomplish the job.• Materials: Raw materials: Parts, pens, paper, etc. used to produce the final product.• Traceability Measurement 5.6: Data generated from the process that are used to evaluate its quality.• Environment Conditions 5.3: The conditions, such as location, time, temperature, and culture in which the process operates.• Assuring of test and calibration results 5.9: Data that is analyzed and, found to be outside pre-defined criteria.As so to bring in the management requirements section four.This all starts with 4.4 Review of requests, tenders and contracts and end with a reporting the resultsThe fishbone has an ancillary benefit as well. Because people by nature often like to get right to determining what to do about ISO 17025, this can help bring out a more thorough exploration of the issues behind ISO 17025 – which will lead to do the right thing the first time, every time to achieve consistency, continual improvement as way of life.
DAY 3 • W108
Ms Cecilia Makirimani, Senior Materials Technician, Worley Parsons Consulting Engineers, South Africa
RECRUITMENT, TRAINING AND COMPETENCY EVALUATION OF LABORATORY STAFF
Many economical and life related decisions are made based on laboratory test results. The credibility of the testing laboratory is dependent on the human resources who carry out the testing work. It is on this premise that this paper focuses on laboratory staff that are responsible for carrying out the testing. This paper seeks to expound the importance of recruiting the right calibre of staff in the laboratory, enhancement of quality through training and the competency evaluation of the laboratory staff. The recruitment process should consider culture compatibility of the organisation and that of the staff members. If the organisation has a culture of being the leader, excellence, innovation and the drive for vertical expansion, then the recruitment process should focus on employees who are innovative, have the drive to excel beyond all odds and with high aspirations. Training involves in-house training as well as external training. The purpose of training will spell out whether it should be external or internal. Consideration should be given to the budget, purpose of training such as retention or meeting future goals of the organisation. Competency evaluation is done for reasons such as salary increase, identifying further training needs, retention or lay-off needs, expansion needs of the organisation, rating the credibility and competency of the organisation as a whole, system development, budgeting purposes as well as goal orientation. The success of any competency evaluation program is determined by how it is done, who does it and for what purpose. If employees regard competency evaluation as extra papers required by management or directorate, then the system is regarded as a failure. This paper will conclude by giving a hint on the best procedures in recruitment, training and competency evaluation procedures which will ensure the success of laboratories.

DAY 3 • W109
Mr Sam Thema, Assessment specialist, SANAS, South Africa
A NATIONAL QUALITY INFRASTRUCTURE MODEL FOR THE PROMOTION OF SMALL AND MEDIUM-SIZED ENTERPRISES COMPETITIVENESS IN SOUTH AFRICA
For sustainable development to be achieved, there has to be a national quality infrastructure (comprised of standardization, metrology, accreditation and conformity assessment bodies), which supports all the three facets of economic and social development as well as environmental protection. Small and medium enterprises (SMEs) on the other hand, driven largely by their potential to contribute towards the economy and the creation of opportunities for employment, have been identified in South Africa as one of the critical component for economic development. However, SMEs have been faced by a number of obstacles and challenges that inhibit their potential to make a meaningful contribution towards economic development. Building on the previous literature reports and theoretical models, the objectives of this study is to determine the relationship between a national quality infrastructure and SMEs productivity in South Africa. Previous research on the impact assessment of a national quality infrastructure has been dominated by the investigation of a single component, especially standardisation, whilst comprehensive studies of the whole system that includes metrology, accreditation and conformity assessment are rare. This study therefore seek to close this literature gap and add to the existing body of knowledge in this field of research. The study will specifically address the following objectives: (1) to explore variables, from a national quality infrastructure perspective, that influence SMEs productivity (2) to explain the strength of the relationship between a national quality infrastructure and SMEs productivity (3) to determine if activities by conformity assessment bodies (comprised of certification, testing, inspection and calibration) mediate the relationship between a national quality infrastructure and SMEs productivity and (4) to develop a model that can explain the effect of a national quality infrastructure variables on SMEs productivity. In order to address these research objectives, the study will select a mixed research approach. Thus phenomenological (qualitative) and positivist (quantitative) philosophical paradigms will be employed in order to obtain a greater insight of the relationship between a national quality infrastructure and SMEs productivity in South Africa.
DAY 3 • W204
Mrs Elzabe Truter, Consultant, ISO-LAB Consulting, South Africa
USE AND MAINTENANCE OF REFERENCE CULTURES IN MICROBIOLOGY
One of the most important steps for any microbiology laboratory is to maintain a collection of bacterial and fungal stock cultures. Accredited laboratories need to have a procedure and records for the maintenance of their stock and working cultures. Proper identification and verification are essential for ensuring acceptable performance as well as traceability to international culture collections. Repeated sub culturing may lead to genotypic/phenotype changes, contamination and loss of viability. Effective maintenance of stock cultures is essential for quality control, method validation and research purposes. Maintenance of stock cultures needs to be well-organised with attention to detail. The focus will be on personnel training, traceability, receiving, identification, verification, labelling and maintenance of reference stock and working cultures in the microbiology laboratory.
DAY 3 • W205
Ms Ingrid Flemming, Director, IFM Quality Services Pty Ltd, Australia
SLEUTHING SOURCES OF ERROR IN LABORATORIES
Frequently laboratories do not realise they are making errors until they are reported to have done so in a proficiency test, or perhaps during a technical audit.The first question a technical staff could be encouraged to ask is, “how do you know the answer is right?” However, sometimes the question really should be “How do you know the answer is not wrong?”.......Thereafter follows a series of events to determine the nature and cause of the error and building of possible solutions. The complex web we weave includes actions required by our accreditation, and therefore frequently ends up being thought of as plain hard work.A focussed approach towards more voluntary building of capacity can improve the rate of acceptable results and yield other added benefits.This workshop/tutorial begins with some case studies including successful and unsuccessful pathways taken by laboratories and gives opportunities for participants to build a tool kit that can be used in their own laboratories.
DAY 3 • W304
Mr John GP Wilson, Director, AMS (Pty) Ltd, South Africa
WHAT IS THE “DECISION RULE” ALL ABOUT?
The new version of ISO 17025 is likely going to have a paragraph or two relating to the use and expression of the decision rule. This is particular importance when issuing a certificate of conformance. This paper will explain what is meant by the decision rule and will give several examples as to how it might be applied.
21

DAY 3 • W305
Dr Angelique Botha, Chief metrologist, National Metrology Institute of South Africa NMISA, South Africa
GUIDELINES FOR THE INTERPRETATION OF INTERLABORATORY COMPARISON RESULTS FOR CALIBRATION LABORATORIES
The SANAS technical requirements document (TR) 48 gives requirements and guidelines to calibration laboratories for the organisation of inter-laboratory comparisons to meet the requirements of ISO/IEC 17025 for assuring the quality of results. The establishment of an independent reference value for a comparison study is possibly the most important requirement, because it facilitates the comparison of the results of the participants in an unbiased manner. Through the use of the reference value a valid conclusion on the competence of the participants can be drawn and opportunities for improvement can be identified.This paper will provide a number of different mechanisms for establishing the comparison reference value and the pro’s and cons associated with them.Furthermore it will also discuss various do’s and don’ts related to the establishment of the comparison reference value and how it can be used to interpret the results of an inter-laboratory comparison.
DAY 3 • W306
Mr John GP Wilson, Director, AMS (Pty) Ltd, South Africa
EXPLANATION OF THE METCERT CPD POINTS SYSTEM
Many of the current holders of the NLA-SA MetCert are currently due to renew their MetCert. This session will be an explanation of the revised requirements for the NLA-SA Met/Cert renewal process and how to “gather” the required CPD points.
POSTERS
Mrs Ana Paula Mandlaze, Chairman of Board, Laboratory Associtation of Mozambique, Mozambique
LABORATORY ASSOCIATION OF MOZAMBIQUE
Background: Under the Project to Support Business Environment and Trade Facilitation Project ( BESTF ) implemented by the Organization of the United Nations Industrial Development Organization (UNIDO ) and funded by the European Union launched the creation of the Association of Mozambique Laboratories ( ALM ) in November 2011. With the project o projecto “Competir com Qualidade”, financed by the European Union and UNIDO and implemented by UNIDO, in 2013/2014 the activities of ALM received a new and relevant support.Methods: Promoting cooperation between different existing laboratories in Mozambique consists cooperate with the authorities in developing policies to protect the health , safety and environment , trade agreements or contracts with public or private entities to provide services for its members , develop training and further training of laboratory personnel , promote the acquisition of materials and equipment to facilitate research and daily work of the laboratories and assist in the interpretation of accreditation requirements , and identify the general requirements of national accreditation .Results: We have observed a trust in ALM , since the number of members increased from 10 to 30, the ALM signed an sub-agreement for hiring human resources , conducted 6 seminars and 8 courses, signed a bilateral cooperation agreement with RELACRE, provided samples for chemical water proficiency tests , and surveys prepared directory to promote ALM .Conclusion: The results have shown that the creation of ALM has brought benefits to its members at low enough costs.
Ms Akashnie Raghu, Engineer, Eskom Holdings SOC Ltd, South Africa
EVALUATION OF WATER TREATMENT PROCESSES IN THE POWER GENERATION INDUSTRY
With Eskom being the single largest user of fresh water resources and key supplier of energy in the country, it is imperative that current water treatment processes are optimized and various technologies are considered to essentially reduce and reuse water with a particular focus on the energy requirements for each process.At Eskom Research, Testing & Development, the Motswedi Water Centre (Motswedi meaning ”natural spring”) has been built to facilitate research, testing and demonstration in water treatment processes/applications such as clarification, sand filtration, microfiltration, reverse osmosis, open evaporative cooling, ion exchange, eutectic freeze crystallization and, chemical and biological control. The pilot plants are in the process of being commissioned. Upon commissioning and depending on the process, different variables can be tested within their range/target and the parameters are measured/evaluated as per the instrumentation installed. Data is logged and upon analysis, important conclusions can be drawn regarding optimization of existing water treatment processes and the feasibility of new technologies with the aim of reducing the industry’s water usage per energy unit sent out and complying with zero liquid effluent discharge.
22

POSTERS
Mrs Jenny Reeves, Chief Chemist, Eskom Holdings SOE, South Africa
WATER SUPPLY FOR THE REST OF THE CENTURY AND BEYOND: NO PROBLEM
Imagine the treatment of all waste water and a percentage of seawater to potable water standards so that we have a renewable and consistent fresh water supply. Imagine doing this on a scale that we no longer have to worry about fighting wars over water. Just consider the facts:• Over 75% of the earth’s surface is covered with water, with 97% of this water being saline.• Approximately 36% of the world’s population lives in water scarce regions.• Global warming is reducing the amount of fresh water available, which is already a scarce resource.• Water is required to sustain life. There are many treatment technologies available which, among others, include filtration, clarification, thermal desalination (by heating and freezing) and reverse osmosis. The question is, are they economically viable? However, even if they are not viable now, considerable strides are being taken to reduce costs.As analytical chemists, it is important to be prepared to analyse trace elements in highly saline and contaminated waters. There are techniques available to carry out these analyses effectively, but they can be very time-consuming and subject to analytical error. Innovative ways of performing these analyses needs to be developed. Validation of methods will be crucial if non-standard methods are implemented. In this paper, innovative analytical techniques will be explored to support the improvement in quality of life imagined above.
Ms Ramakgahlela Wendy Thoka, Metrologist, National Metrology Institute of South Africa, South Africa
INSTRUMENTS USED IN RADIATION PROTECTION
Radiation exposure monitoring is a standard protocol in hospitals, nuclear plants, mines and industries working with radioactive sources. In order to achieve this, radiation monitoring devices are used. This devices are used for both area and personal monitoring. This paper will be focusing on different types of radiation monitors and their functions.
23

N A T I O N A L
A S S O C I A T I O NS O U T H A F R I C A
W H Y B E C O M E A N N L A - S A M E M B E R ?
AN OVERVIEW
Introduction
Whilst the National Laboratory Association, (NLA), was formed in 1998; its origins began over 20 years ago when the National Calibration Service (NCS) was formed at the National Physical Research Laboratory (NPRL) of the CSIR.
The NLA continued the rich heritage of both Calibration services and Accreditation in the country and these two organisations then brought South Africa to the point where accreditation was not only required for laboratories but it was also necessary to extend this capability into other areas such as Inspection and Certification. The NLA was then requested to develop a new company and established the South African National Accreditation System, SANAS.
The accreditation activities were transferred into SANAS, and the laboratory community decided that it would be advantageous that a new organisation be formed in order to be in a position to represent the interests of the laboratories.
This new non-profit organisation felt that it should retain some continuity with the past and decided to retain the NLA acronym but renamed the organisation the National Laboratory Association. In 2012 the association was renamed NLA-SA (National Laboratory Association – South Africa).
Membership
The membership of the Association comprises of the following components.
•Companies• Individuals
1. Membership
It was decided from the outset that the NLA-SA would target as broad a base as possible in order to draw on potential members and therefore membership is open to laboratories that are either accredited or not accredited. The only proviso is that members subscribe to the ethical principles of the association. This “Code of Conduct” has been designed with the view that all members need to adhere to it and that it recognises that voluntary adherence is a very strong motivator when dealing with the market place. It does not do away with the need for accreditation but rather enhances and strengthens the laboratory’s position. The need for an ethically strong community is clear and forms the basis of South Africa’s strong international reputation. This approach is one that the Association via its members wishes to continue supporting.
While the vast majority of NLA-SA members are corporate structures, both large and small, the Association also has created two associate categories. One is for individuals, who for whatever reason are not employed permanently in a laboratory and the other for organisations, typically suppliers, who wish to be associated with the NLA-SA. The fees for all these categories are detailed in the table below.
In line with a Board decision the following fee structure was approved for 2016.
These categories have been designed to rationalise the disparity between small and large organisations and apply irrespective of Accreditation status.
What does the NLA-SA do?
The association is active in the following major areas
•TechnicalTraining•ProfessionalRecognition(MetCertSchemeforMetrologists)•ProficiencyTesting(PT)-TestingandCalibrationSchemes•AnnualWorkshop&Conferences•RepresentationLocally&Internationally•SubCommittees
1. Training
In the past the various organisations mentioned above in the introductory paragraph actively provided and organised technical trainingforCalibration/Metrologylaboratories.TheNLA-SAviaitstraining initiative continues to provide this service. During 2015 the NLA-SA plans to once again co-ordinate and arrange more than 30 courses for the laboratory community
For an updated Course schedule, readers are requested to go to ourwebsite or contact the Office and speak toMsMaggieRossouw.
CATEGORY of NUMBER OF TECHNICAL MEMBERSHIP ORGANISATION STAFF MEMBERS FEE 2016*
Category 1 0 – 10 R 1 975.00
Category 2 11 – 30 R 4 200.00
Category 3 > 30 R 7 000.00
AssociateMember Corporate R3000.00
AssociateMember Individual R400.00
*NB: Fees exclude 14% VAT
NA
TIO
NA
LLA
BORATORY ASSOCIATIO
N
-SO
UT
HA
FR
ICA
24

N A T I O N A L
A S S O C I A T I O NS O U T H A F R I C A
NA
TIO
NA
LLA
BORATORY ASSOCIATIO
N
-SO
UT
HA
FR
ICA
2. Professional Recognition for Metrologists
The past two and half years has seen SANAS adopt this scheme as one of the ways that Metrologists working in Calibrationlaboratories as meeting the basic requirements for Technical Signatory status.
During the previous year the NLA-SA experienced substantial growth in the number of applications and to date, August 2016, more than 220 metrologists have been certified. At the same time there were approximately 60 applications that were in various stages of the review process and it is expected that these will be complete by the end of 2016.
Further information, as well as the application documents, can be viewed / downloaded from the NLA-SA web site under the MetCertheadingonthehomepage.
3. Annual Test & Measurement Conference
For more than 25 years the NLA-SA has organised and co-ordinatedtheT&MConference. Thiseventcontinuestobethehighlight of the year for the Association. About 200 people attended the 2015 Conference which was held in the Lord Charles Hotel in Somerset West during October 2015. This event is a truly wonderful opportunity for networking and sharing of knowledge and experience to take place.
Over the years the Conference has grown in size and stature substantially and many attendees, especially from outside the country have remarked on the fact that this is an extremely professional and well run conference, on a par with anything available elsewhere in the world.
4. Representation – Locally & Internationally
It is vital that the laboratory community is adequately represented at various forums both locally and internationally in order to, where necessary, provide a cohesive voice and input to matters which ultimately have a direct impact on the community.
The NLA-SA has therefore established a number of relationships inordertoachievethisgoalamongstwhichSANAS,NMISAandSABS Standards Division are the most important locally.
In addition a good working relationship with the Department of Trade and Industry, (dti), exists, giving the association the opportunity to make issues raised by members known to government.
Internationally, the NLA-SA is directly represented on the International Laboratory Accreditation Co-operation, ILAC, via its committee known as the Laboratory Committee, LC. Through this committee, the NLA-SA is in a position to directly contribute
to the technical issues being raised on an international level as well as Accreditation Policy and Arrangement level issues. This role ensures that the opinions of the membership are directly communicated to ILAC and helps to influence the various decisions taken.
In addition the NLA-SA is an International AffiliateMember ofthe Eurolab Organisation and this also helps to provide the South African Laboratory Community with vital information regarding developments in Europe especially with regard to EU Legislation as it affects measurements.
During the past few years recent development in this regard is the formal relationship that has been entered into between the NLA-SA and the US based NCSLI (National Conference for Standards Laboratories International). With its history of more than 60 years, the NLA-SA is confident that this will help in furthering its aim of assisting South African laboratories to learn and improve.
5. Proficiency Testing (PT)
The NLA-SA has since its inception in 1998 run various schemes for calibration laboratories. Over the past number of years this has been extended into various testing laboratory fields and we are now pleased to able to offer the following schemes.
•CalibrationSchemes
Field of Metrology DCLF The dates for these schemesTemperature can be obtained from theMass websiteortheNLA-SAoffice.TorqueForce
Various Closed Schemes with sponsorship from SANAS were also offered during 2013/2014 and will be repeated in 2015/2016. •TestingSchemes
Programme No of Rounds Pesticide Formulations 4 For the dates of the various rounds please WaterMicrobiology 6 contacttheNLA-SA Office FoodMicrobiology 4
CivilsMaterialTesting 12 Planned
For pricing and technical details regarding all the schemes as well as any requests for new schemes, please contact the NLA-SA Office.
25

N A T I O N A L
A S S O C I A T I O NS O U T H A F R I C A
So why become a member of the NLA-SA? The reasons that companies and individuals have chosen to become members of the association are varied, however it is apparent that there are two major benefits to being a member.
1. The first is that by becoming active in the NLA-SA and supporting its aims and goals, members are directly contributing to the continued success of this unique and rewarding industry. The measurement and testing laboratories collectively represent a very important and vital capability. It is essential that these skills are not lost and that members of the community at large are made aware of their importance. Whilst individual companies may not be able to communicate this message on their own, clearly an association such as the NLA-SA can be effective in this role.
In addition, a single voice speaking on behalf of the community is much more likely to gain the attention of other organisations rather than the lone voice in the wilderness which is often the case for individuals.
2. On a practical level, membership of this association ensures that members are provided with a suitable financial incentive when attending or participating in any of the following activities.
•Trainingcourses •AnnualWorkshop •PT
The ‘discount’ for using the NLA-SA’s services will virtually ensure that the annual membership fee is paid.
So can there be any clearer reason why you and/or your organisation shouldn’t join the current members and become a member of the National Laboratory Association – South Africa today.
We look forward to welcoming you and printing your membership certificate.
You can find us at http://www.nla.org.za where you can fill in the form electronically or you can post us the completed application form that we sent with this letter back to the NLA-SA office for processing.
NA
TIO
NA
LLA
BORATORY ASSOCIATIO
N
-SO
UT
HA
FR
ICA
6. Subcommittees
During the past few years the NLA-SA has broadened its structure by introducing various sub-committees. The purpose of these committees is to address those aspects that are of specific interest to a discipline or sector. To that end the following sub committees have been established:
•Civil&RoadEngineering(MatCivils)•Water•StackTesters(STSA)
It is hoped that more of these will be established in the future and that in this way even more companies / laboratories will derive benefit from their membership.
7. The Future
The NLA-SA’s primary objective is to attract as many companies/organisations, which have laboratory or measurement interests, into becoming members and the current membership of the NLA-SA has grown to more than 220.
desi
gn •
ww
w.t
ulip
grap
hic
s.co
.za
26

N A T I O N A L
A S S O C I A T I O NS O U T H A F R I C A
NA
TIO
NA
LLA
BORATORY ASSOCIATIO
N
-SO
UT
HA
FR
ICA