date target buyer(s) segment - sdr-uyfpxh6dk.netdna-ssl.com · date target buyer(s) segment amount...
TRANSCRIPT


Date Target Buyer(s) SegmentAmount
($ in Mil)TEV/ Rev TEV/ EBITDA
3/15/2017 RKI Instruments, Inc. Riken Keiki Co., Ltd. Industrial 35.58 1.06x -
3/13/2017 Plumrose USA, Inc. JBS USA LLC Food & Beverage 230.00 - -
3/7/2017 Dominion Terminal Associates Ashland Terminal, Inc. Industrial 20.45 - -
2/24/2017 Comfort Foods, Inc. Coffee Holding Co., Inc. Food & Beverage 2.30 - -
2/16/2017 Peninsula Packaging LLC Sonoco Products Co. Industrial 230.00 1.21x -
2/14/2017 Carrier Enterprise Northeast LLC Watsco, Inc. Industrial 430.00 0.86x -
2/1/2017 Triton Stone Group Brand Triton Stone Group New Orleans LLC Industrial 40.00 - -
1/17/2017 Daymon Worldwide, Inc. Bain Capital Investors LLC Food & Beverage 413.00 - -
1/10/2017 Denali Group, Inc. WNS (Holdings) Ltd. Logistics Providers 40.00 - -
1/4/2017 Jackson-Mitchell, Inc. Emmi AG Food & Beverage 31.10 - -
1/3/2017 Flyte Tyme Worldwide Transportation The Carlyle Group LP Trucking 25.00 0.38x -
Strategic83%
Financial17%
3 1 2
15
25
1 - 5 7 5
11
-
5
10
15
20
25
30

Strategic Buyer Inv. Date Select Corporate Acquisitions
GMS, Inc. 12/6/2016 ▪ SGI, Inc.11/1/2016 ▪ Ryan Building Materials, Inc.10/4/2016 ▪ United Building Materials, Inc.9/2/2016 ▪ Olympia Building Supplies, LLC8/30/2016 ▪ Steven Kempf Building Material Company7/6/2016 ▪ RockWise, LLC4/1/2016 ▪ Professional Handling and Distribution, Inc.1/5/2016 ▪ Gypsum Supply Co., Inc.12/9/2015 ▪ Hathaway & Sons Inc.12/2/2015 ▪ Badgerland Supply, Inc.
SRS Distribution, Inc. 12/2/2016 ▪ Metro Roofing Supplies11/7/2016 ▪ Tri State Aluminum Products
10/24/2016 ▪ MidSouth Building Supply
8/22/2016 ▪ National Building & Roofing Supplies
8/8/2016 ▪ Monroe Aluminum Products, Inc.
5/10/2016 ▪ Atlantic Roofing Distributors LLC
12/21/2015 ▪ Willoughby Supply Company's South Florida Locations
XPO Logistics, Inc. (NYSE:XPO) 9/9/2015 ▪ Con-way Inc.
5/4/2015 ▪ Bridge Terminal Transport Inc.
7/29/2014 ▪ Simply Logistics, Inc.
7/29/2014 ▪ XPO Logistics Supply Chain, Inc.
1/6/2014 ▪ XPO Intermodal, Inc.
Echo Global Logistics, Inc. (NasdaqGS:ECHO) 4/21/2015 ▪ Command Transportation, LLC
2/5/2015 ▪ Xpress Solutions, Inc.
5/13/2014 ▪ One Stop Logistics, Inc.
2/26/2014 ▪ Comcar Logistics LLC
2/6/2014 ▪ Online Freight Services, Inc.
Rising Tide Development, LLC 1/12/2016 ▪ Self-Storage Center
10/2/2014 ▪ Self-Storage Property
5/7/2014 ▪ Self Storage Center
4/9/2014 ▪ Self Storage Property
US Foods, Inc. 3/6/2017 ▪ SRA Foods, Inc.
9/30/2016 ▪ Jeraci Food Distributors, Inc.
2/26/2016 ▪ Cara Donna Provision Co., Inc.
Financial Buyer Inv. Date Select Corporate Investments
500 Startups 5/16/2016 ▪ Cognitive Operational Systems, LLC11/5/2015 ▪ Moveha, LLC11/5/2015 ▪ Whiplash Merchandising LLC1/27/2015 ▪ KidzJet, L.L.C.
2/3/2014 ▪ myDoorman Inc.
Ridgemont Equity Partners 1/17/2017 ▪ Worldwide Express Operations LLC
9/7/2016 ▪ Nolan Transportation Group, Inc.7/1/2016 ▪ WhiteWater Midstream
10/20/2015 ▪ Unishippers Global Logistics, LLC
10/15/2014 ▪ Transportation Insight, LLC
KJM Capital LLC 12/22/2016 ▪ Blue Sky Logistics LLC
12/22/2016 ▪ Interide Transportation LLC12/6/2016 ▪ Sunco Carriers, Inc.
ABRY Partners, LLC 2/6/2017 ▪ Highwinds Network Group, Inc.2/6/2016 ▪ FLS Transportation Services, Inc.
9/15/2014 ▪ CitiXsys Americas Inc.

-20%
-15%
-10%
-5%
0%
5%
10%
15%
20%
Automotive Building Products Electronic Components Food & Beverage
Industrial Medical Wire & Cable S&P 500
Company Name SymbolMarket Cap
($ in Mil)Price ($)
Quarter
Change
YTD
Change
% of 52
Week High
Est.
Revenue
Growth
EBITDA
Margin
TEV/
Rev
TEV/
EBITDA
Price/
EPS
TEV/
NTM
Revenue
TEV/
NTM
EBITDA
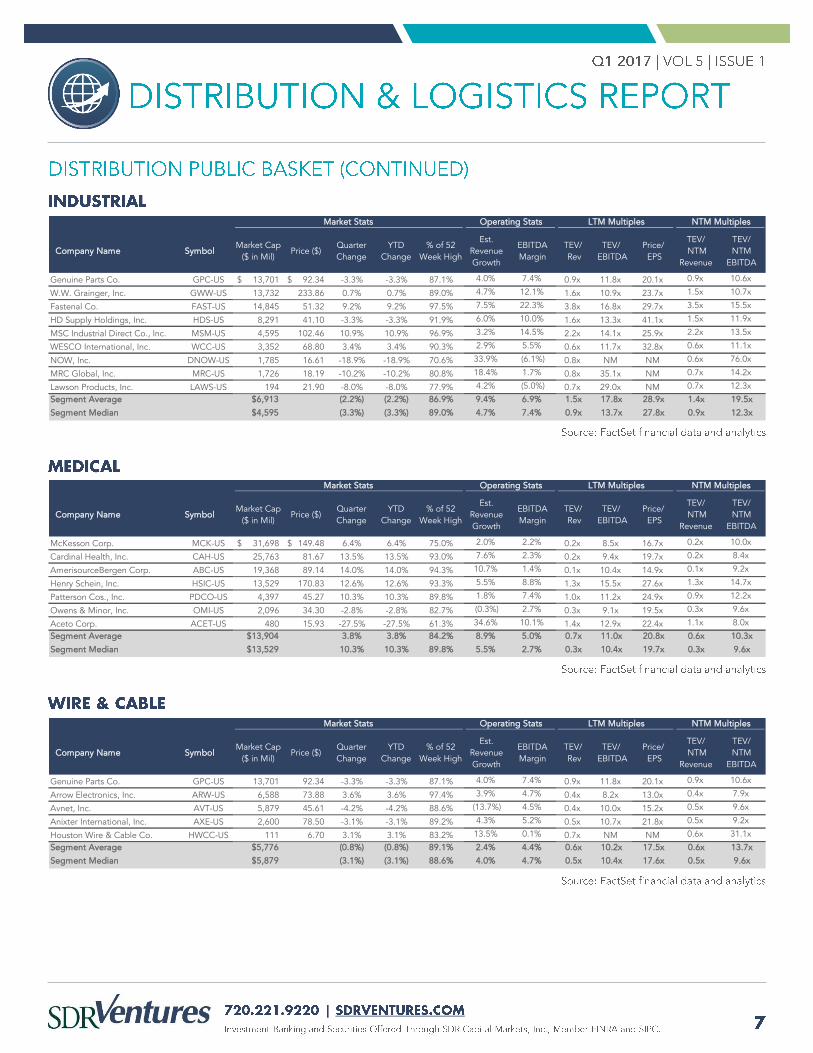
Genuine Parts Co. GPC-US 13,701$ 92.34$ -3.3% -3.3% 87.1% 4.0% 7.4% 0.9x 11.8x 20.1x 0.9x 10.6x
LKQ Corp. LKQ-US 9,123 29.60 -3.4% -3.4% 81.4% 10.4% 10.4% 1.4x 12.1x 19.7x 1.3x 10.7x
Dorman Products, Inc. DORM-US 2,817 81.51 11.6% 11.6% 99.4% 8.9% 22.7% 3.1x 14.2x 26.6x 2.9x 13.1x
Kaman Corp. KAMN-US 1,302 48.05 -1.8% -1.8% 90.0% 3.8% 8.7% 0.9x 11.0x 22.9x 0.9x 9.9x
Uni-Sélect, Inc. UNS-CA 1,113 26.35 18.8% 18.8% 96.0% 11.8% 8.2% 1.0x 11.4x 19.2x 0.9x 9.8x
Essendant, Inc. ESND-US 548 14.62 -30.0% -30.0% 41.8% (1.2%) 0.8% 0.2x 7.1x 8.5x 0.2x 7.4x
Lawson Products, Inc. LAWS-US 194 21.90 -8.0% -8.0% 77.9% 4.2% (5.0%) 0.7x 29.0x NM 0.7x 12.3x
Segment Average $4,114 (2.3%) (2.3%) 82.0% 6.0% 7.6% 1.2x 13.8x 19.5x 1.1x 10.6x
Segment Median $1,302 (3.3%) (3.3%) 87.1% 4.2% 8.2% 0.9x 11.8x 19.9x 0.9x 10.6x
Market Stats Operating Stats LTM Multiples NTM Multiples

Company Name SymbolMarket Cap
($ in Mil)Price ($)
Quarter
Change
YTD
Change
% of 52
Week High
Est.
Revenue
Growth
EBITDA
Margin
TEV/
Rev
TEV/
EBITDA
Price/
EPS
TEV/
NTM
Revenue
TEV/
NTM
EBITDA
Wolseley Plc WOS-GB 16,051$ 63.46$ 2.4% 2.4% 95.8% 9.2% 7.2% 0.9x 11.8x 25.5x 0.8x 10.7x
HD Supply Holdings, Inc. HDS-US 8,291 41.10 -3.3% -3.3% 91.9% 6.0% 10.0% 1.6x 13.3x 41.1x 1.5x 11.9x
Pool Corp. POOL-US 4,910 118.91 14.0% 14.0% 98.0% 7.7% 3.5% 2.1x 19.2x 34.3x 2.0x 18.6x
Beacon Roofing Supply, Inc. BECN-US 2,926 48.71 5.7% 5.7% 96.2% 6.9% 8.4% 1.0x 10.7x 28.7x 0.9x 10.1x
BMC Stock Holdings, Inc. BMCH-US 1,512 22.65 16.2% 16.2% 98.1% 7.7% 5.7% 0.6x 10.5x 49.2x 0.6x 7.9x
Boise Cascade Co. BCC-US 1,023 26.55 18.0% 18.0% 88.6% 11.9% 1.9% 0.3x 8.8x 27.1x 0.3x 7.1x
Huttig Building Products, Inc. HBP-US 214 8.24 24.7% 24.7% 91.4% NM 1.8% 0.4x 10.1x 12.9x NM NM
BlueLinx Holdings, Inc. BXC-US 78 8.68 16.2% 16.2% 89.5% NM 1.2% 0.2x 13.5x 4.9x NM NM
Segment Average $4,375 11.7% 11.7% 93.7% 8.2% 5.0% 0.9x 12.2x 27.9x 1.0x 11.1x
Segment Median $2,219 15.1% 15.1% 93.8% 7.7% 4.6% 0.7x 11.3x 27.9x 0.9x 10.4x
Market Stats Operating Stats LTM Multiples NTM Multiples
Company Name SymbolMarket Cap
($ in Mil)Price ($)
Quarter
Change
YTD
Change
% of 52
Week High
Est.
Revenue
Growth
EBITDA
Margin
TEV/
Rev
TEV/
EBITDA
Price/
EPS
TEV/
NTM
Revenue
TEV/
NTM
EBITDA
W.W. Grainger, Inc. GWW-US 13,732$ 233.86$ 0.7% 0.7% 89.0% 4.7% 12.1% 1.6x 10.9x 23.7x 1.5x 10.7x
Arrow Electronics, Inc. ARW-US 6,588 73.88 3.6% 3.6% 97.4% 3.9% 4.7% 0.4x 8.2x 13.0x 0.4x 7.9x
Avnet, Inc. AVT-US 5,879 45.61 -4.2% -4.2% 88.6% (13.7%) 4.5% 0.4x 10.0x 15.2x 0.5x 9.6x
Tech Data Corp. TECD-US 3,510 92.34 9.0% 9.0% 95.8% 30.8% 1.8% 0.1x 6.7x 16.8x 0.1x 3.7x
WESCO International, Inc. WCC-US 3,352 68.80 3.4% 3.4% 90.3% 2.9% 5.5% 0.6x 11.7x 32.8x 0.6x 11.1x
ScanSource, Inc. SCSC-US 987 39.10 -3.1% -3.1% 87.0% 6.0% 3.5% 0.3x 31.1x 15.5x 0.3x 8.5x
Richardson Electronics Ltd. RELL-US 63 5.91 -6.2% -6.2% 81.6% 0.4% (1.9%) 0.1x NM NM 0.1x NM
Segment Average $4,873 0.5% 0.5% 90.0% 5.0% 4.3% 0.5x 13.1x 19.5x 0.5x 8.6x
Segment Median $3,510 0.7% 0.7% 89.0% 3.9% 4.5% 0.4x 10.4x 16.1x 0.4x 9.0x
Market Stats Operating Stats LTM Multiples NTM Multiples
Company Name SymbolMarket Cap
($ in Mil)Price ($)
Quarter
Change
YTD
Change
% of 52
Week High
Est.
Revenue
Growth
EBITDA
Margin
TEV/
Rev
TEV/
EBITDA
Price/
EPS
TEV/
NTM
Revenue
TEV/
NTM
EBITDA
Sysco Corp. SYY-US 28,102$ 52.02$ -6.1% -6.1% 91.2% 5.7% 5.4% 0.7x 12.1x 28.3x 0.6x 11.0x
US Foods Holding Corp. USFD-US 6,162 27.78 1.1% NA 99.4% 3.4% 4.2% 0.4x 11.2x 27.0x 0.4x 8.8x
Performance Food Group Co. PFGC-US 2,427 23.45 -2.3% -2.3% 83.4% 5.8% 2.0% 0.2x 11.9x 32.6x 0.2x 9.2x
United Natural Foods, Inc. UNFI-US 2,159 42.68 -10.6% -10.6% 81.8% 9.0% 3.0% 0.3x 8.7x 16.9x 0.3x 8.1x
Core-Mark Holding Co., Inc. CORE-US 1,421 30.69 -28.7% -28.7% 61.4% 7.5% 1.1% 0.1x 12.9x 26.2x 0.1x 10.0x
SpartanNash Co. SPTN-US 1,319 35.15 -11.1% -11.1% 87.0% 8.2% 3.0% 0.2x 7.6x 23.3x 0.2x 6.7x
The Chefs' Warehouse, Inc. CHEF-US 364 13.85 -12.3% -12.3% 66.6% 6.9% 7.9% 0.6x 11.9x 115.4x 0.5x 10.3x
Segment Average $5,993 (10.0%) (11.8%) 81.5% 6.6% 3.8% 0.4x 10.9x 38.5x 0.3x 9.2x
Segment Median $2,159 (10.6%) (10.8%) 83.4% 6.9% 3.0% 0.3x 11.9x 27.0x 0.3x 9.2x
Market Stats Operating Stats LTM Multiples NTM Multiples
Company Name SymbolMarket Cap
($ in Mil)Price ($)
Quarter
Change
YTD
Change
% of 52
Week High
Est.
Revenue
Growth
EBITDA
Margin
TEV/
Rev
TEV/
EBITDA
Price/
EPS
TEV/
NTM
Revenue
TEV/
NTM
EBITDA
Genuine Parts Co. GPC-US 13,701$ 92.34$ -3.3% -3.3% 87.1% 4.0% 7.4% 0.9x 11.8x 20.1x 0.9x 10.6x
W.W. Grainger, Inc. GWW-US 13,732 233.86 0.7% 0.7% 89.0% 4.7% 12.1% 1.6x 10.9x 23.7x 1.5x 10.7x
Fastenal Co. FAST-US 14,845 51.32 9.2% 9.2% 97.5% 7.5% 22.3% 3.8x 16.8x 29.7x 3.5x 15.5x
HD Supply Holdings, Inc. HDS-US 8,291 41.10 -3.3% -3.3% 91.9% 6.0% 10.0% 1.6x 13.3x 41.1x 1.5x 11.9x
MSC Industrial Direct Co., Inc. MSM-US 4,595 102.46 10.9% 10.9% 96.9% 3.2% 14.5% 2.2x 14.1x 25.9x 2.2x 13.5x
WESCO International, Inc. WCC-US 3,352 68.80 3.4% 3.4% 90.3% 2.9% 5.5% 0.6x 11.7x 32.8x 0.6x 11.1x
NOW, Inc. DNOW-US 1,785 16.61 -18.9% -18.9% 70.6% 33.9% (6.1%) 0.8x NM NM 0.6x 76.0x
MRC Global, Inc. MRC-US 1,726 18.19 -10.2% -10.2% 80.8% 18.4% 1.7% 0.8x 35.1x NM 0.7x 14.2x
Lawson Products, Inc. LAWS-US 194 21.90 -8.0% -8.0% 77.9% 4.2% (5.0%) 0.7x 29.0x NM 0.7x 12.3x
Segment Average $6,913 (2.2%) (2.2%) 86.9% 9.4% 6.9% 1.5x 17.8x 28.9x 1.4x 19.5x
Segment Median $4,595 (3.3%) (3.3%) 89.0% 4.7% 7.4% 0.9x 13.7x 27.8x 0.9x 12.3x
Market Stats Operating Stats LTM Multiples NTM Multiples
Company Name SymbolMarket Cap
($ in Mil)Price ($)
Quarter
Change
YTD
Change
% of 52
Week High
Est.
Revenue
Growth
EBITDA
Margin
TEV/
Rev
TEV/
EBITDA
Price/
EPS
TEV/
NTM
Revenue
TEV/
NTM
EBITDA
McKesson Corp. MCK-US 31,698$ 149.48$ 6.4% 6.4% 75.0% 2.0% 2.2% 0.2x 8.5x 16.7x 0.2x 10.0x
Cardinal Health, Inc. CAH-US 25,763 81.67 13.5% 13.5% 93.0% 7.6% 2.3% 0.2x 9.4x 19.7x 0.2x 8.4x
AmerisourceBergen Corp. ABC-US 19,368 89.14 14.0% 14.0% 94.3% 10.7% 1.4% 0.1x 10.4x 14.9x 0.1x 9.2x
Henry Schein, Inc. HSIC-US 13,529 170.83 12.6% 12.6% 93.3% 5.5% 8.8% 1.3x 15.5x 27.6x 1.3x 14.7x
Patterson Cos., Inc. PDCO-US 4,397 45.27 10.3% 10.3% 89.8% 1.8% 7.4% 1.0x 11.2x 24.9x 0.9x 12.2x
Owens & Minor, Inc. OMI-US 2,096 34.30 -2.8% -2.8% 82.7% (0.3%) 2.7% 0.3x 9.1x 19.5x 0.3x 9.6x
Aceto Corp. ACET-US 480 15.93 -27.5% -27.5% 61.3% 34.6% 10.1% 1.4x 12.9x 22.4x 1.1x 8.0x
Segment Average $13,904 3.8% 3.8% 84.2% 8.9% 5.0% 0.7x 11.0x 20.8x 0.6x 10.3x
Segment Median $13,529 10.3% 10.3% 89.8% 5.5% 2.7% 0.3x 10.4x 19.7x 0.3x 9.6x
LTM Multiples NTM Multiples Market Stats Operating Stats
Company Name SymbolMarket Cap
($ in Mil)Price ($)
Quarter
Change
YTD
Change
% of 52
Week High
Est.
Revenue
Growth
EBITDA
Margin
TEV/
Rev
TEV/
EBITDA
Price/
EPS
TEV/
NTM
Revenue
TEV/
NTM
EBITDA
Genuine Parts Co. GPC-US 13,701 92.34 -3.3% -3.3% 87.1% 4.0% 7.4% 0.9x 11.8x 20.1x 0.9x 10.6x
Arrow Electronics, Inc. ARW-US 6,588 73.88 3.6% 3.6% 97.4% 3.9% 4.7% 0.4x 8.2x 13.0x 0.4x 7.9x
Avnet, Inc. AVT-US 5,879 45.61 -4.2% -4.2% 88.6% (13.7%) 4.5% 0.4x 10.0x 15.2x 0.5x 9.6x
Anixter International, Inc. AXE-US 2,600 78.50 -3.1% -3.1% 89.2% 4.3% 5.2% 0.5x 10.7x 21.8x 0.5x 9.2x
Houston Wire & Cable Co. HWCC-US 111 6.70 3.1% 3.1% 83.2% 13.5% 0.1% 0.7x NM NM 0.6x 31.1x
Segment Average $5,776 (0.8%) (0.8%) 89.1% 2.4% 4.4% 0.6x 10.2x 17.5x 0.6x 13.7x
Segment Median $5,879 (3.1%) (3.1%) 88.6% 4.0% 4.7% 0.5x 10.4x 17.6x 0.5x 9.6x
Market Stats Operating Stats LTM Multiples NTM Multiples
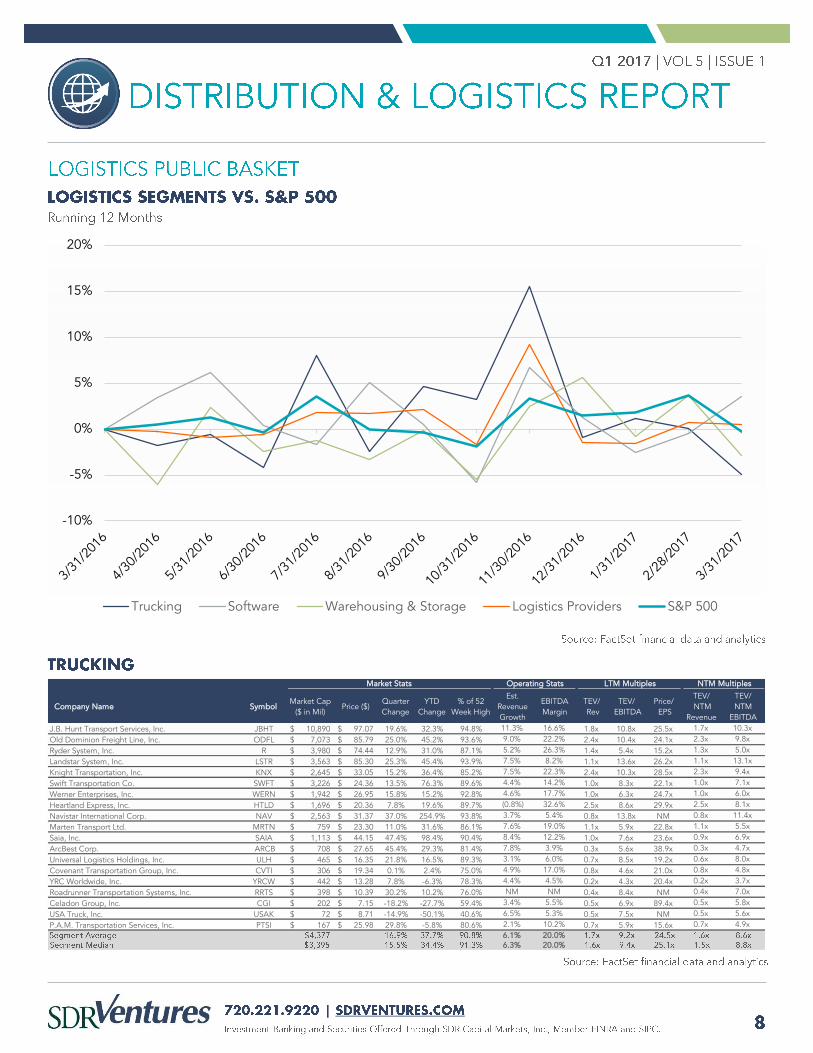
-10%
-5%
0%
5%
10%
15%
20%
Trucking Software Warehousing & Storage Logistics Providers S&P 500
Company Name SymbolMarket Cap
($ in Mil)Price ($)
Quarter
Change
YTD
Change
% of 52
Week High
Est.
Revenue
Growth
EBITDA
Margin
TEV/
Rev
TEV/
EBITDA
Price/
EPS
TEV/
NTM
Revenue
TEV/
NTM
EBITDA
J.B. Hunt Transport Services, Inc. JBHT 10,890$ 97.07$ 19.6% 32.3% 94.8% 11.3% 16.6% 1.8x 10.8x 25.5x 1.7x 10.3x
Old Dominion Freight Line, Inc. ODFL 7,073$ 85.79$ 25.0% 45.2% 93.6% 9.0% 22.2% 2.4x 10.4x 24.1x 2.3x 9.8x
Ryder System, Inc. R 3,980$ 74.44$ 12.9% 31.0% 87.1% 5.2% 26.3% 1.4x 5.4x 15.2x 1.3x 5.0x
Landstar System, Inc. LSTR 3,563$ 85.30$ 25.3% 45.4% 93.9% 7.5% 8.2% 1.1x 13.6x 26.2x 1.1x 13.1x
Knight Transportation, Inc. KNX 2,645$ 33.05$ 15.2% 36.4% 85.2% 7.5% 22.3% 2.4x 10.3x 28.5x 2.3x 9.4x
Swift Transportation Co. SWFT 3,226$ 24.36$ 13.5% 76.3% 89.6% 4.4% 14.2% 1.0x 8.3x 22.1x 1.0x 7.1x
Werner Enterprises, Inc. WERN 1,942$ 26.95$ 15.8% 15.2% 92.8% 4.6% 17.7% 1.0x 6.3x 24.7x 1.0x 6.0x
Heartland Express, Inc. HTLD 1,696$ 20.36$ 7.8% 19.6% 89.7% (0.8%) 32.6% 2.5x 8.6x 29.9x 2.5x 8.1x
Navistar International Corp. NAV 2,563$ 31.37$ 37.0% 254.9% 93.8% 3.7% 5.4% 0.8x 13.8x NM 0.8x 11.4x
Marten Transport Ltd. MRTN 759$ 23.30$ 11.0% 31.6% 86.1% 7.6% 19.0% 1.1x 5.9x 22.8x 1.1x 5.5x
Saia, Inc. SAIA 1,113$ 44.15$ 47.4% 98.4% 90.4% 8.4% 12.2% 1.0x 7.6x 23.6x 0.9x 6.9x
ArcBest Corp. ARCB 708$ 27.65$ 45.4% 29.3% 81.4% 7.8% 3.9% 0.3x 5.6x 38.9x 0.3x 4.7x
Universal Logistics Holdings, Inc. ULH 465$ 16.35$ 21.8% 16.5% 89.3% 3.1% 6.0% 0.7x 8.5x 19.2x 0.6x 8.0x
Covenant Transportation Group, Inc. CVTI 306$ 19.34$ 0.1% 2.4% 75.0% 4.9% 17.0% 0.8x 4.6x 21.0x 0.8x 4.8x
YRC Worldwide, Inc. YRCW 442$ 13.28$ 7.8% -6.3% 78.3% 4.4% 4.5% 0.2x 4.3x 20.4x 0.2x 3.7x
Roadrunner Transportation Systems, Inc. RRTS 398$ 10.39$ 30.2% 10.2% 76.0% NM NM 0.4x 8.4x NM 0.4x 7.0x
Celadon Group, Inc. CGI 202$ 7.15$ -18.2% -27.7% 59.4% 3.4% 5.5% 0.5x 6.9x 89.4x 0.5x 5.8x
USA Truck, Inc. USAK 72$ 8.71$ -14.9% -50.1% 40.6% 6.5% 5.3% 0.5x 7.5x NM 0.5x 5.6x
P.A.M. Transportation Services, Inc. PTSI 167$ 25.98$ 29.8% -5.8% 80.6% 2.1% 10.2% 0.7x 5.9x 15.6x 0.7x 4.9x
6.1% 20.0%6.3% 20.0%
Market Stats Operating Stats LTM Multiples NTM Multiples

Company Name SymbolMarket Cap
($ in Mil)Price ($)
Quarter
Change
YTD
Change
% of 52
Week High
Est.
Revenue
Growth
EBITDA
Margin
TEV/
Rev
TEV/
EBITDA
Price/
EPS
TEV/
NTM
Revenue
TEV/
NTM
EBITDA
Manhattan Associates, Inc. MANH 3,775$ 53.03$ -8.0% -19.9% 77.3% 5.4% 32.3% 6.0x 17.8x 30.8x 5.6x 15.5x
Aspen Technology, Inc. AZPN 4,223 54.68 16.9% 44.8% 98.7% 4.6% 48.8% 8.8x 18.7x 31.6x 8.7x 17.9x
The Descartes Systems Group, Inc. DSGX 1,619 21.40 -0.6% 6.6% 93.5% 13.5% 33.8% 7.7x 23.6x 69.0x 6.9x 19.7x
SPS Commerce, Inc. SPSC 1,191 69.89 -4.8% -0.5% 93.4% 18.9% 10.9% 5.5x 55.5x 211.8x 4.7x 32.5x
QAD, Inc. QADA 561 30.40 35.8% 48.1% 98.4% 4.8% 7.7% 1.6x 50.8x NM 1.6x 25.9x
American Software, Inc. AMSWA 277 10.33 -6.9% 1.5% 86.6% 6.2% 16.9% 2.1x 16.0x 39.7x 2.0x 13.4x
Amber Road, Inc. AMBR 244 9.08 -5.9% 78.4% 73.8% 15.5% (12.9%) 3.4x NM NM 3.0x NM
Park City Group, Inc. PCYG 246 12.70 7.6% 6.6% 82.7% NM 31.3% 14.5x 70.1x 119.0x NM NM
9.8% 21.1%6.2% 24.1%
Market Stats Operating Stats LTM Multiples NTM Multiples
Company Name SymbolMarket Cap
($ in Mil)Price ($)
Quarter
Change
YTD
Change
% of 52
Week High
Est.
Revenue
Growth
EBITDA
Margin
TEV/
Rev
TEV/
EBITDA
Price/
EPS
TEV/
NTM
Revenue
TEV/
NTM
EBITDA
Public Storage PSA 38,764$ 223.50$ 0.2% -9.8% 80.5% 7.3% NM 16.9x NM 32.8x 16.0x 22.2x
PACCAR, Inc. PCAR 22,399 63.90 8.7% 34.8% 93.3% (6.6%) 15.2% 1.6x 9.5x 43.2x 1.8x 14.3x
Extra Space Storage, Inc. EXR 9,716 77.24 -2.7% -12.4% 81.5% 14.0% NM 14.7x NM 26.5x 13.1x 19.8x
Westinghouse Air Brake Technologies Corp. WAB 7,395 83.02 1.7% 16.7% 93.1% 39.9% 11.0% 3.2x 16.5x 24.9x 2.2x 12.5x
CubeSmart CUBE 4,820 26.77 -1.8% -12.6% 79.9% 10.5% NM 12.8x NM 59.5x 11.7x 18.9x
Life Storage, Inc. SSS 3,956 85.26 -4.1% -20.5% 72.1% 20.0% NM 12.3x NM 43.5x 10.0x 16.6x
Dana, Inc. DAN 2,730 18.98 21.7% 37.5% 95.8% 9.1% 10.1% 0.6x 6.1x 4.4x 0.6x 5.6x
Mobile Mini, Inc. MINI 1,345 30.25 0.2% -2.8% 79.3% 3.9% 39.6% 4.5x 12.4x 28.5x 4.3x 11.5x
American Axle & Manufacturing Holdings, Inc. AXL 1,476 19.30 12.1% 1.9% 97.8% 3.9% 15.1% 0.6x 3.8x 6.3x 0.6x 4.0x
Navistar International Corp. NAV 2,563 31.37 37.0% 254.9% 93.8% 3.7% 5.4% 0.8x 13.8x NM 0.8x 11.4x
Wabash National Corp. WNC 981 15.82 11.1% 33.7% 97.1% (9.8%) 10.9% 0.6x 4.3x 8.7x 0.7x 6.3x
Meritor, Inc. MTOR 1,095 12.42 11.6% 48.7% 92.9% 3.5% 7.4% 0.6x 8.1x 2.0x 0.6x 6.6x
National Storage Affiliates Trust NSA 936 22.07 5.4% 28.8% 96.5% 42.6% NM 11.3x NM 71.2x 11.5x 19.5x
10.9% 14.3%7.3% 10.9%
Market Stats Operating Stats LTM Multiples NTM Multiples
Company Name SymbolMarket Cap
($ in Mil)Price ($)
Quarter
Change
YTD
Change
% of 52
Week High
Est.
Revenue
Growth
EBITDA
Margin
TEV/
Rev
TEV/
EBITDA
Price/
EPS
TEV/
NTM
Revenue
TEV/
NTM
EBITDA
United Parcel Service, Inc. UPS 79,028$ 114.64$ 4.8% 19.1% 95.2% 7.2% 0.0% 1.8x 15.2x 29.6x 1.8x 10.4x
FedEx Corp. FDX 49,624 186.20 6.6% 25.0% 92.4% 8.7% 12.4% 1.1x 9.2x 26.2x 1.0x 6.8x
C.H. Robinson Worldwide, Inc. CHRW 10,382 73.26 4.0% 18.1% 94.1% 8.6% 6.3% 0.9x 12.4x 20.4x 0.8x 12.4x
Expeditors International of Washington, Inc. EXPD 9,553 52.96 2.8% 17.4% 94.0% 7.2% 11.2% 1.4x 11.9x 22.4x 1.4x 11.7x
XPO Logistics, Inc. XPO 4,785 43.16 17.7% 58.4% 86.6% 4.5% 6.7% 0.7x 8.3x 81.4x 0.7x 7.5x
Forward Air Corp. FWRD 1,446 47.38 9.5% 10.2% 93.4% 7.8% 14.4% 1.5x 10.3x 52.6x 1.4x 9.5x
Hub Group, Inc. HUBG 1,452 43.75 7.3% 32.8% 94.8% 9.9% 3.4% 0.4x 9.1x 19.9x 0.4x 9.1x
Atlas Air Worldwide Holdings, Inc. AAWW 1,304 52.15 21.8% 26.1% 90.3% 12.2% 27.3% 1.6x 8.6x 31.6x 1.5x 6.6x
Air Transport Services Group, Inc. ATSG 951 15.96 11.2% 58.3% 92.3% 21.8% 24.4% 1.8x 6.9x 43.1x 1.6x 5.4x
Echo Global Logistics, Inc. ECHO 732 25.05 8.6% 22.9% 86.7% 13.4% 1.8% 0.5x 18.7x 501.0x 0.5x 11.1x
Park-Ohio Holdings Corp. PKOH 528 42.60 16.9% 15.8% 95.4% 9.4% 7.8% 0.7x 9.2x 16.5x 0.7x 7.4x
10.1% 10.5%8.7% 7.8%
Market Stats Operating Stats LTM Multiples NTM Multiples


Date Target Buyer(s) SegmentAmount
($ in Mil)TEV/ Rev
TEV/
EBITDA3/31/2017 Lightcap Industries, Inc. Simplex Construction Supplies, Inc.; Lightcap
Industries Inc (Private Group)
Industrial - - -
3/31/2017 Midland Paper Co., Inc. Cansel Survey Equipment, Inc. Industrial - - -
3/31/2017 McLendon Hardware, Inc. Central Network Retail Group LLC Industrial - - -
3/30/2017 Thorpe Distributing Co. Capitol Beverage Sales LP Food & Beverage - - -
3/28/2017 Caesar Systems LLC Palantir Economic Solutions Ltd Electronic Components - - -
3/28/2017 3R Distribution LLC Dibz International, Inc. Food & Beverage - - -
3/24/2017 Worldnet International Couriers, Inc. /3
Operations/
Worldnet International Couriers, Inc. Logistics Providers - - -
3/23/2017 Crane Worldwide Logistics LLC DAVACO, Inc. Logistics Providers - - -
3/16/2017 Western Co-op Transport Association CHS, Inc. Trucking - - -
3/15/2017 RKI Instruments, Inc. Riken Keiki Co., Ltd. Industrial 35.58 1.06x -
3/13/2017 Plumrose USA, Inc. JBS USA LLC Food & Beverage 230.00 - -
3/13/2017 Eagle Plywood & Lumber Rugby Holdings LLC Industrial 0.60 - -
3/13/2017 Pugh Lubricants LLC Apollo Oil LLC Industrial - - -
3/13/2017 Angelo's Supplies, Inc. SiteOne Landscape Supply, Inc. Industrial - - -
3/7/2017 American Red Ball International, Inc. Interstate Group Holdings, Inc. Logistics Providers - - -
3/7/2017 Dominion Terminal Associates Ashland Terminal, Inc.; Contura Energy, Inc.;
Dominion Terminal Associates (Private Group)
Industrial 20.45 - -
3/6/2017 Simplified Logistics LLC CI Capital Partners LLC Logistics Providers - - -
3/6/2017 SRA Foods, Inc. US Foods, Inc. Food & Beverage - - -
3/1/2017 Linson Holdings, Inc. Lund International Holding Co. Automotive - - -
3/1/2017 Diversified Distribution Systems LLC Bunzl Plc Industrial - - -
2/28/2017 Hayes Software Systems Transition Capital Partners Ltd. Software - - -
2/28/2017 Country Fresh, Inc. (Texas) Kainos Capital LLC Food & Beverage - - -
2/24/2017 Comfort Foods, Inc. Coffee Holding Co., Inc. Food & Beverage 2.30 - -
2/20/2017 Primet Fluid Power Co., Inc. The Hillman Co.; Ritter Technology LLC Industrial - - -
2/20/2017 Wilson Trucking Corp. Central Freight Lines, Inc.; Green Acquisition
Corp.
Trucking - - -
2/20/2017 Primet Fluid Power Co., Inc. The Hillman Co.; Ritter Technology LLC Industrial - - -
2/16/2017 Peninsula Packaging LLC Sonoco Products Co. Industrial 230.00 1.21x -
2/15/2017 Tire Trucks International, LLC Stellar Industries, Inc. Automotive - - -
2/14/2017 Carrier Enterprise Northeast LLC Watsco, Inc. Industrial 430.00 0.86x -
2/13/2017 Marine Trading Services, Inc. H.I.G. Capital LLC (Private Equity); Ship Supply
of Florida, Inc.
Medical - - -
2/10/2017 Palfleet Truck Equipment Co. Llc /4 Service
Bodies Bus/
The Reading Group LLC Trucking - - -
2/9/2017 Happy Hen Egg Farms, Inc. Cal-Maine Foods, Inc. Food & Beverage - - -
2/8/2017 Login Logistics LLC EPES Logistics Services, Inc. Logistics Providers - - -
2/6/2017 Highwinds Network Group, Inc. ABRY Partners, LLC Software - - -
2/2/2017 DNE World Fruit LLC Wonderful Citrus LLC Food & Beverage - - -
2/1/2017 Conversa Solutions LLC Vertex Wireless LLC Software - - -
2/1/2017 Zoomer, Inc. EatStreet, Inc.; Gener8tor Management LLC Food & Beverage - - -
2/1/2017 Erie Sport Store, Inc. /Team Division/ Herff Jones LLC; BSN Sports LLC Industrial - - -
2/1/2017 Triton Stone Group Brand Triton Stone Group New Orleans LLC Industrial 40.00 - -
2/1/2017 Rubber Supply Co., Inc. Singer Equities, Inc. Industrial - - -
1/31/2017 Tennessee Crating LLC Knoxville Box & Container, Inc. Logistics Providers - - -
1/31/2017 American Cargo Express, Inc. Oregon International Air Freight Co. Warehousing and Storage - - -
1/30/2017 Congruity LLC Procurri LLC Logistics Providers - - -
1/30/2017 ArrowStream, Inc. Diversis Capital LLC Software - - -
1/30/2017 Miller Industrial Fluids LLC Golden Gate Private Equity, Inc.; PetroChoice
Holdings LLC
Industrial - - -

Date Target Buyer(s) SegmentAmount
($ in Mil)TEV/ Rev
TEV/
EBITDA1/27/2017 Alcyon, Inc. Alutiiq LLC; Afognak Native Corp. Software - - -
1/27/2017 Tuco Industrial Products, Inc. Aggreko Plc Industrial - - -
1/25/2017 Biodynamics LLC GreenGro Technologies, Inc. Industrial - - -
1/24/2017 Hysitron, Inc. Bruker Corp. Software - - -
1/24/2017 Native Maine Produce & Specialty Foods
LLC
RLJ Equity Partners LLC; SJ Partners LLC;
Native Maine Produce & Specialty Foods LLC/
Private Group/
Food & Beverage - - -
1/23/2017 Click Distributing East, Inc. Craig Stein Beverage Food & Beverage - - -
1/23/2017 River City Distributing, Inc. Wisconsin Distributors, Inc. Food & Beverage - - -
1/20/2017 Lawrence Transportation Co. Rihm Family Cos., Inc. Logistics Providers - - -
1/19/2017 Kane Office Archives LLC Iron Mountain Information Management, Inc. Warehousing and Storage 0.42 - -
1/17/2017 Worldwide Express Operations LLC Ridgemont Equity Partners Industrial - - -
1/17/2017 Daymon Worldwide, Inc. Bain Capital Investors LLC; Yonghui
Superstores Co. Ltd.; Daymon Worldwide, Inc.
(Private Group)
Food & Beverage 413.00 - -
1/17/2017 Kasper Group LLC Sycamore Partners Management LP; Nine West
Holdings, Inc.
Industrial - - -
1/17/2017 Blaise of Color, Inc. FinishMaster, Inc. Industrial - - -
1/17/2017 Crown Auto Body Supply LLC FinishMaster, Inc. Automotive - - -
1/17/2017 Ross Organic Specialty Sales, Inc. Azelis Americas, Inc. Industrial - - -
1/13/2017 World Courier Group, Inc. TFI International, Inc. Warehousing and Storage - - -
1/10/2017 Denali Group, Inc. WNS (Holdings) Ltd. Logistics Providers 40.00 - -
1/10/2017 Global Freight Source, Inc. GlobalTranz Enterprises, Inc. Logistics Providers - - -
1/10/2017 Spectrum Corp. (Pennsylvania) Spectrum (United States) Building Products - - -
1/10/2017 Packaging Film Sales, Inc. Bunzl Plc Food & Beverage - - -
1/9/2017 J&N Auto Electric, Inc. Riverside Partners LLC (New York); Investcorp
Corporate Investment Group; Arrowhead
Engineered Products, Inc.
Electronic Components - - -
1/5/2017 1ticket.com, Inc. CVC Capital Partners Ltd.; New Amsterdam
Growth Capital LLC; DTI Management LLC
Software - - -
1/5/2017 C&S Carpet Distribution, Inc. Best Services Group, Inc. Trucking - - -
1/5/2017 Pathfinder Aviation, Inc. Dos Rios Management LLC; Pathfinder
Aviation, Inc. (Private Group)
Logistics Providers - - -
1/4/2017 Jackson-Mitchell, Inc. Emmi AG Food & Beverage 31.10 - -
1/4/2017 Worm's Way, Inc. Sun Capital Partners, Inc. Industrial - - -
1/3/2017 Flyte Tyme Worldwide Transportation The Carlyle Group LP (Corporate Private
Equity); Addison Lee Ltd.
Trucking 25.00 0.38x -
1/3/2017 Railex LLC /Refrigirated & Cold Storage
Assets/
Union Pacific Corp. Warehousing and Storage - - -
1/3/2017 American Building & Roofing, Inc. Beacon Roofing Supply, Inc. Industrial - - -