data & trends - fooddrinkeurope · employment leading employer in the eu 4.24 million total...
TRANSCRIPT
DATA & TRENDSEU FOOD AND DRINK INDUSTRY
2017
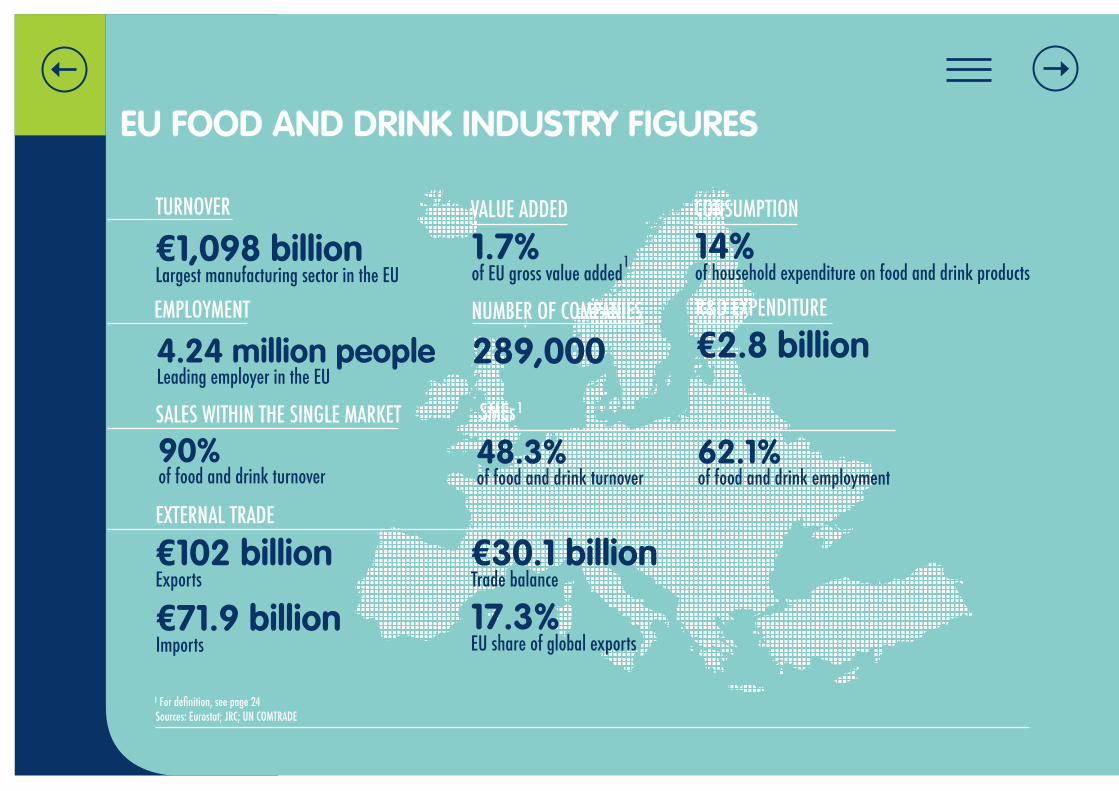
€1,098 billionLargest manufacturing sector in the EU
4.24 million peopleLeading employer in the EU
SALES WITHIN THE SINGLE MARKET
TURNOVER
EMPLOYMENT
90%of food and drink turnover
VALUE ADDED
1.7%of EU gross value added
NUMBER OF COMPANIES
289,000
SMEs
48.3%of food and drink turnover
62.1%of food and drink employment
CONSUMPTION
14%of household expenditure on food and drink products
R&D EXPENDITURE
€2.8 billion
EXTERNAL TRADE
€102 billionExports
€30.1 billionTrade balance
17.3%EU share of global exports
€71.9 billionImports
For definition, see page 241
1
Sources: Eurostat; JRC; UN COMTRADE
1
EU FOOD AND DRINK INDUSTRY FIGURES
CONTRIBUTION TO THE EU ECONOMY
EMPLOYMENT
VALUE ADDED
SECTORS AT EU LEVEL
THE NATIONAL PICTURE
SMALL AND MEDIUM-SIZED ENTERPRISES
FOOD SUPPLY CHAIN
R&D AND INNOVATION
CONSUMPTION
TRADE WITHIN THE SINGLE MARKET
EU27-UK TRADE
CONTENTSSINGLE MARKET
04
WORLD MARKETSTRADE FIGURES
TRADE FIGURES BY SECTOR
TRADE FIGURES BY PRODUCT
EU FOOD AND DRINK MARKET SHARE
SUSTAINABILITY OF THE FOOD AND DRINK INDUSTRY
INNOVATION AND CONSUMER TRENDS
GLOBAL TRENDS IN R&D
KEY FOOD AND DRINK COMPANIESRANKING OF AGRI-FOOD COMPANIES BY GLOBAL AGRI-FOOD SALES
GLOSSARY
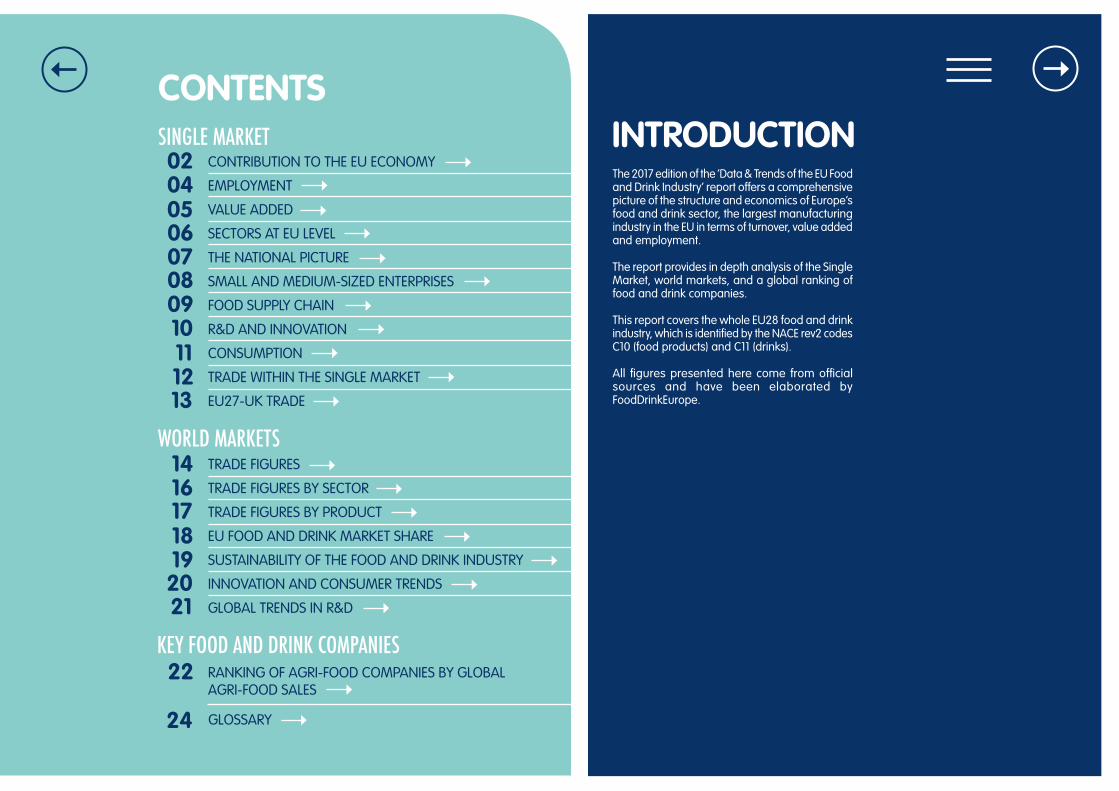
The 2017 edition of the ‘Data & Trends of the EU Food and Drink Industry’ report offers a comprehensive picture of the structure and economics of Europe’s food and drink sector, the largest manufacturing industry in the EU in terms of turnover, value added and employment.
The report provides in depth analysis of the Single Market, world markets, and a global ranking of food and drink companies.
This report covers the whole EU28 food and drink industry, which is identified by the NACE rev2 codes C10 (food products) and C11 (drinks).
All figures presented here come from official sources and have been elaborated by FoodDrinkEurope.
INTRODUCTION02
05
0706
08
1009
11
1312
1614
17
1918
20
22
24
21
SINGLE MARKET
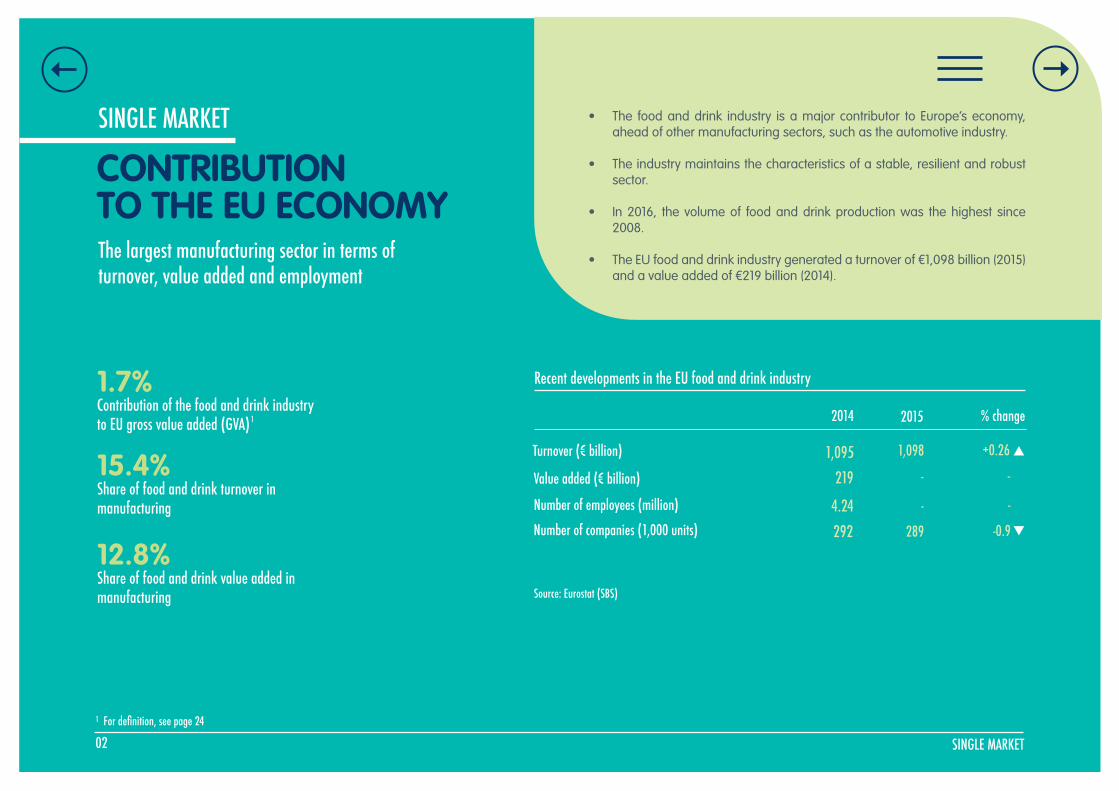
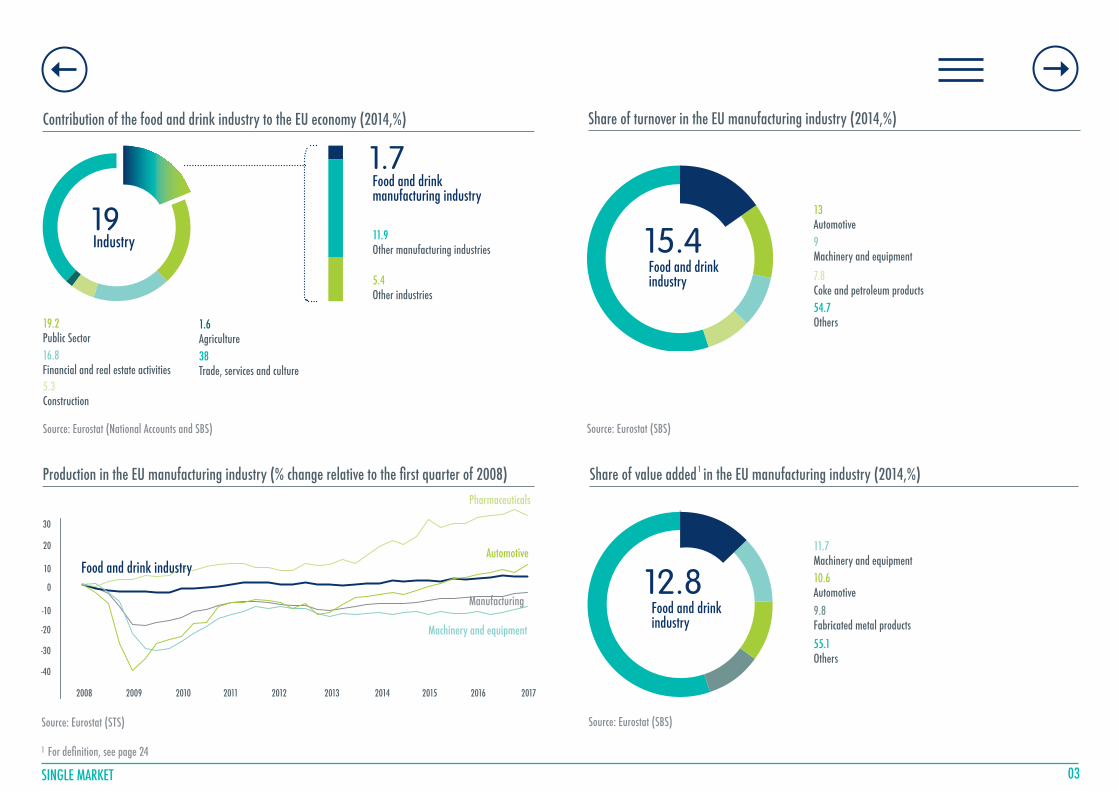
CONTRIBUTION TO THE EU ECONOMYThe largest manufacturing sector in terms of turnover, value added and employment
1.7%Contribution of the food and drink industry to EU gross value added (GVA)
15.4%Share of food and drink turnover in manufacturing
12.8%Share of food and drink value added in manufacturing
• The food and drink industry is a major contributor to Europe’s economy, ahead of other manufacturing sectors, such as the automotive industry.
• The industry maintains the characteristics of a stable, resilient and robust sector.
• In 2016, the volume of food and drink production was the highest since 2008.
• The EU food and drink industry generated a turnover of €1,098 billion (2015) and a value added of €219 billion (2014).
Recent developments in the EU food and drink industry
% change 2014
2924.24
2191,095
2015
289
-
-
1,098
-0.9
-
-
+0.26
Value added (€ billion)
Turnover (€ billion)
Number of employees (million)
Number of companies (1,000 units)
Source: Eurostat (SBS)
SINGLE MARKET02For definition, see page 241
1
SINGLE MARKET 03
Contribution of the food and drink industry to the EU economy (2014,%)
Source: Eurostat (National Accounts and SBS)
Share of turnover in the EU manufacturing industry (2014,%)
Source: Eurostat (SBS)
Production in the EU manufacturing industry (% change relative to the first quarter of 2008) Share of value added in the EU manufacturing industry (2014,%)
19.2Public Sector16.8Financial and real estate activities 5.3Construction
1.6Agriculture38Trade, services and culture
19Industry
1.7Food and drink manufacturing industry
11.9Other manufacturing industries
5.4Other industries
15.4Food and drinkindustry
13Automotive9Machinery and equipment
7.8Coke and petroleum products54.7Others
For definition, see page 241
1
Source: Eurostat (SBS)
11.7Machinery and equipment10.6Automotive9.8Fabricated metal products55.1Others
12.8Food and drinkindustry
30
20
10
0
-10
-20
-30
-40
2008 2009 2010 2011 2012 2013 2014 2015 2016 2017
Manufacturing
Food and drink industry
Pharmaceuticals
Machinery and equipment
Automotive
Source: Eurostat (STS)
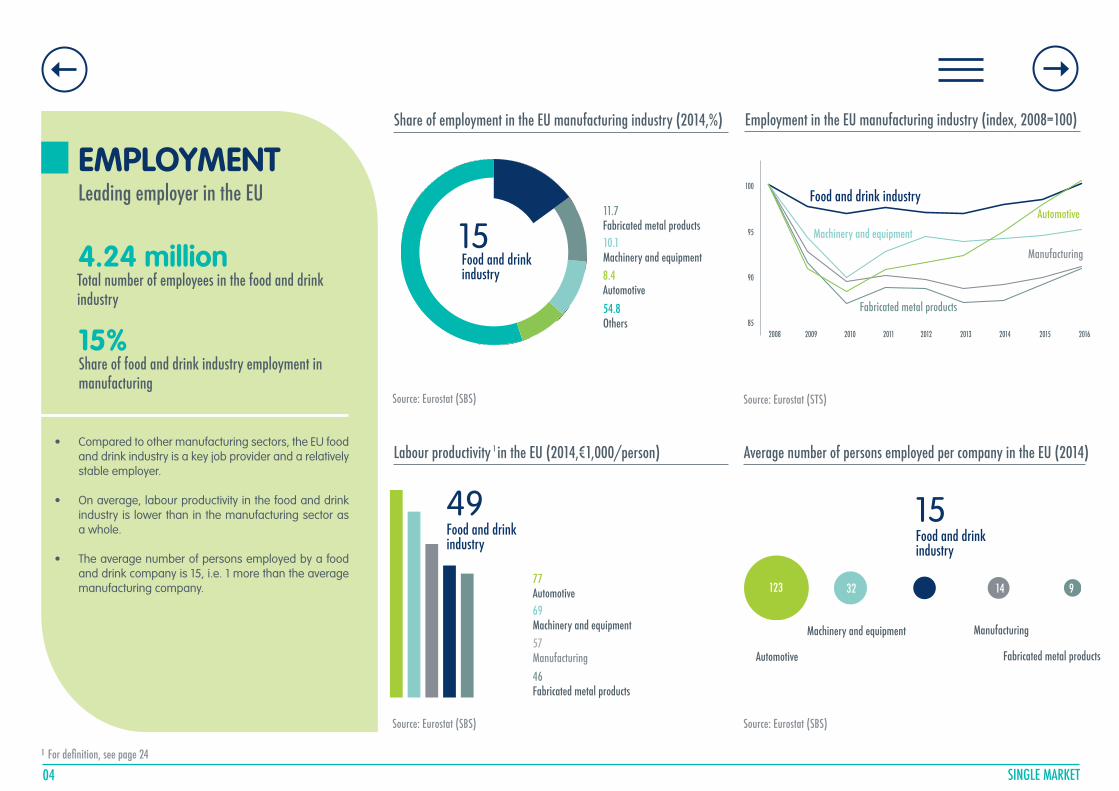
EMPLOYMENT Leading employer in the EU
4.24 millionTotal number of employees in the food and drink industry
15%Share of food and drink industry employment in manufacturing
• Compared to other manufacturing sectors, the EU food and drink industry is a key job provider and a relatively stable employer.
• On average, labour productivity in the food and drink industry is lower than in the manufacturing sector as a whole.
• The average number of persons employed by a food and drink company is 15, i.e. 1 more than the average manufacturing company.
Share of employment in the EU manufacturing industry (2014,%)
Source: Eurostat (SBS)
Employment in the EU manufacturing industry (index, 2008=100)
Labour productivity in the EU (2014,€1,000/person) Average number of persons employed per company in the EU (2014)
04 SINGLE MARKET
15Food and drinkindustry
11.7Fabricated metal products10.1Machinery and equipment8.4Automotive54.8Others
100
95
90
85 2008 2009 2010 2011 2012 2013 2014 2015 2016
Manufacturing
Food and drink industry
Fabricated metal products
Machinery and equipment
Automotive
Source: Eurostat (STS)
For definition, see page 241
1
Source: Eurostat (SBS)
49Food and drinkindustry
77Automotive69Machinery and equipment57Manufacturing46Fabricated metal products
Automotive
Machinery and equipment Manufacturing
Fabricated metal products
15Food and drinkindustry
Source: Eurostat (SBS)
123 32 14 9
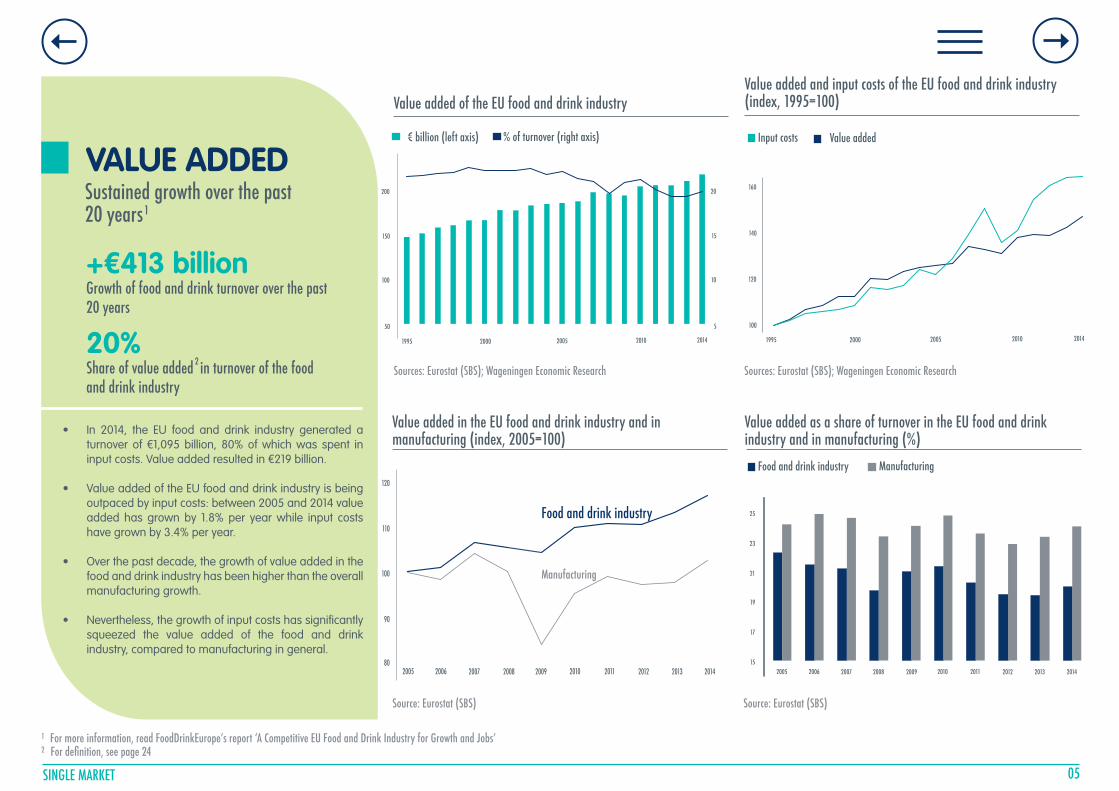
VALUE ADDED Sustained growth over the past 20 years
+€413 billionGrowth of food and drink turnover over the past 20 years
20%Share of value added in turnover of the food and drink industry
• In 2014, the EU food and drink industry generated a turnover of €1,095 billion, 80% of which was spent in input costs. Value added resulted in €219 billion.
• Value added of the EU food and drink industry is being outpaced by input costs: between 2005 and 2014 value added has grown by 1.8% per year while input costs have grown by 3.4% per year.
• Over the past decade, the growth of value added in the food and drink industry has been higher than the overall manufacturing growth.
• Nevertheless, the growth of input costs has significantly squeezed the value added of the food and drink industry, compared to manufacturing in general.
Sources: Eurostat (SBS); Wageningen Economic Research
Value added in the EU food and drink industry and in manufacturing (index, 2005=100)
Value added as a share of turnover in the EU food and drink industry and in manufacturing (%)
Value added of the EU food and drink industryValue added and input costs of the EU food and drink industry (index, 1995=100)
SINGLE MARKET 05
For more information, read FoodDrinkEurope’s report ‘A Competitive EU Food and Drink Industry for Growth and Jobs’1
For definition, see page 242
1
1995 2000 2005 2010
200
150
100
50
2014
20
15
10
5
% of turnover (right axis)€ billion (left axis)
160
140
120
100
1995 2000 2005 2010 2014
Value added Input costs
120
110
100
80
90
2005 2006 2007 2008 2009 2010 2011 2012 2013 2014
Food and drink industry
Manufacturing
Source: Eurostat (SBS)
2005 2006 2007 2008 2009 2010 2011 2012 2013 2014
25
23
21
19
17
15
Source: Eurostat (SBS)
ManufacturingFood and drink industry
2Sources: Eurostat (SBS); Wageningen Economic Research
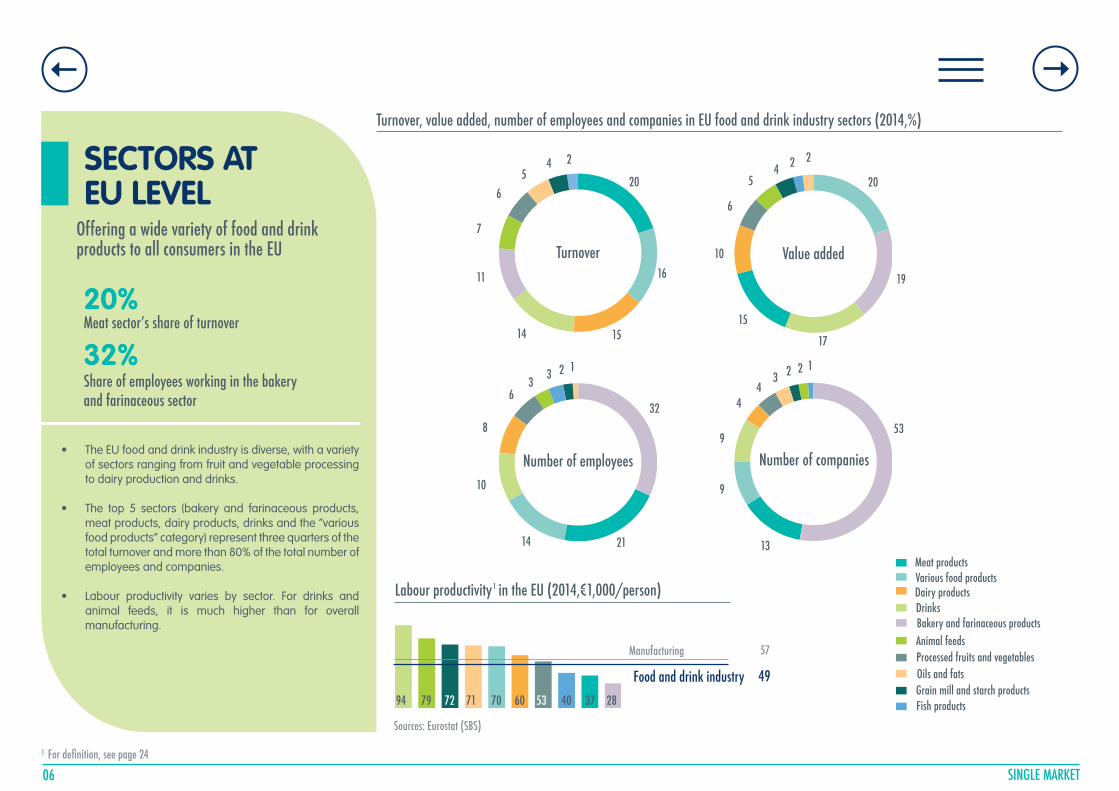
SECTORS ATEU LEVEL
Offering a wide variety of food and drink products to all consumers in the EU
20%Meat sector’s share of turnover
32%Share of employees working in the bakery and farinaceous sector
• The EU food and drink industry is diverse, with a variety of sectors ranging from fruit and vegetable processing to dairy production and drinks.
• The top 5 sectors (bakery and farinaceous products, meat products, dairy products, drinks and the “various food products” category) represent three quarters of the total turnover and more than 80% of the total number of employees and companies.
• Labour productivity varies by sector. For drinks and animal feeds, it is much higher than for overall manufacturing.
Turnover, value added, number of employees and companies in EU food and drink industry sectors (2014,%)
06 SINGLE MARKETFor definition, see page 241
Value added Turnover
1514
11
7
65 20
16
4 2
17
15
10
6
54
20
19
2 2
Number of employees Number of companies
2114
10
8
33
32
2 1
6
2
13
9
9
44
53
312
Sources: Eurostat (SBS)
Meat productsVarious food products
DrinksBakery and farinaceous productsAnimal feeds
Dairy products
Oils and fatsGrain mill and starch products
Processed fruits and vegetables
Fish products
Manufacturing
Food and drink industry
Labour productivity in the EU (2014,€1,000/person)1
94 79 72 71 70 60 53 40 37 28
57
49
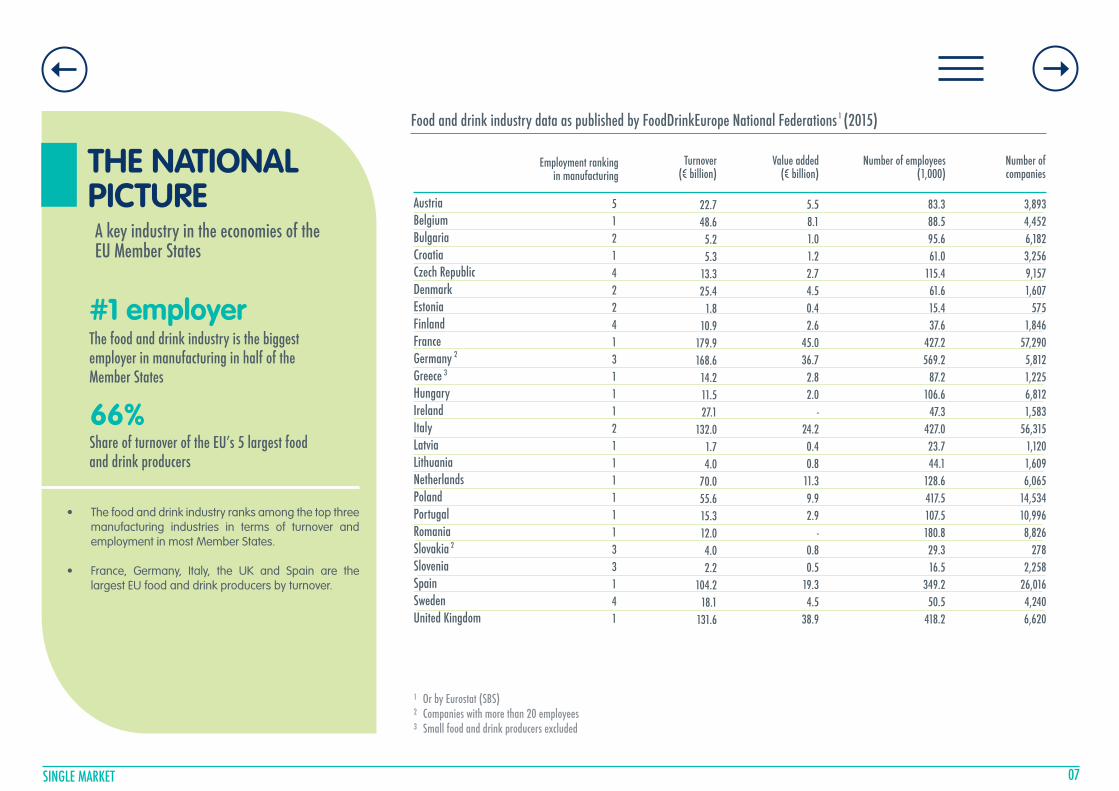
THE NATIONAL PICTUREA key industry in the economies of the EU Member States
#1 employerThe food and drink industry is the biggest employer in manufacturing in half of the Member States
66%Share of turnover of the EU’s 5 largest food and drink producers
• The food and drink industry ranks among the top three manufacturing industries in terms of turnover and employment in most Member States.
• France, Germany, Italy, the UK and Spain are the largest EU food and drink producers by turnover.
SINGLE MARKET 07
Food and drink industry data as published by FoodDrinkEurope National Federations (2015)
AustriaBelgiumBulgariaCroatiaCzech RepublicDenmarkEstoniaFinlandFranceGermanyGreeceHungaryIrelandItalyLatviaLithuaniaNetherlandsPolandPortugalRomaniaSlovakiaSloveniaSpainSwedenUnited Kingdom
Employment rankingin manufacturing
Value added (€ billion)
Turnover (€ billion)
Number of employees (1,000)
Number of companies
5121422413111211111133141
22.748.6
5.25.3
13.325.4
1.810.9
179.9168.614.211.527.1
132.01.74.0
70.055.615.312.04.02.2
104.218.1
131.6
5.58.11.01.22.74.50.42.6
45.036.7
2.82.0
-24.20.40.8
11.39.92.9
-0.80.5
19.34.5
38.9
83.388.595.661.0
115.461.615.437.6
427.2569.2
87.2106.6
47.3427.023.744.1
128.6417.5107.5180.829.316.5
349.250.5
418.2
3,8934,4526,1823,2569,1571,607
5751,846
57,2905,8121,2256,8121,583
56,3151,1201,6096,065
14,53410,9968,826
2782,258
26,0164,2406,620
Or by Eurostat (SBS)1
Companies with more than 20 employees2
Small food and drink producers excluded3
1
2
3
2
SMALL AND MEDIUM-SIZED ENTERPRISES
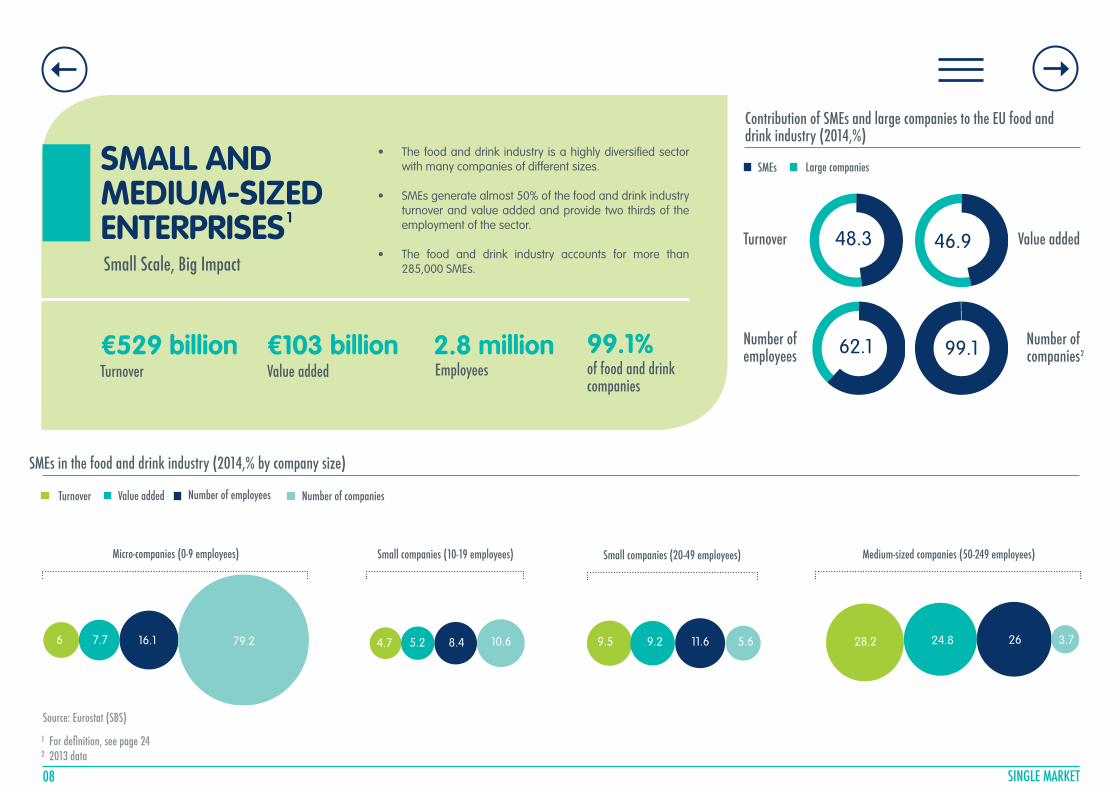
• The food and drink industry is a highly diversified sector with many companies of different sizes.
• SMEs generate almost 50% of the food and drink industry turnover and value added and provide two thirds of the employment of the sector.
• The food and drink industry accounts for more than 285,000 SMEs.
Contribution of SMEs and large companies to the EU food and drink industry (2014,%)
SMEs in the food and drink industry (2014,% by company size)
08 SINGLE MARKET
Source: Eurostat (SBS)
For definition, see page 241
Small Scale, Big Impact
€529 billionTurnover
€103 billionValue added
2.8 millionEmployees
99.1%of food and drink companies
Large companiesSMEs
48.3 46.9
62.1 99.1
Value added Turnover
Number of employees
Number of companies
Value addedTurnover Number of companiesNumber of employees
6
Micro-companies (0-9 employees) Small companies (10-19 employees) Small companies (20-49 employees) Medium-sized companies (50-249 employees)
7.7 16.1 79.2 4.7 5.2 8.4 10.6 9.5 9.2 11.6 5.6 28.2 24.8 3.726
2
1
2013 data2
SINGLE MARKET 092013 data except for the number of companies1
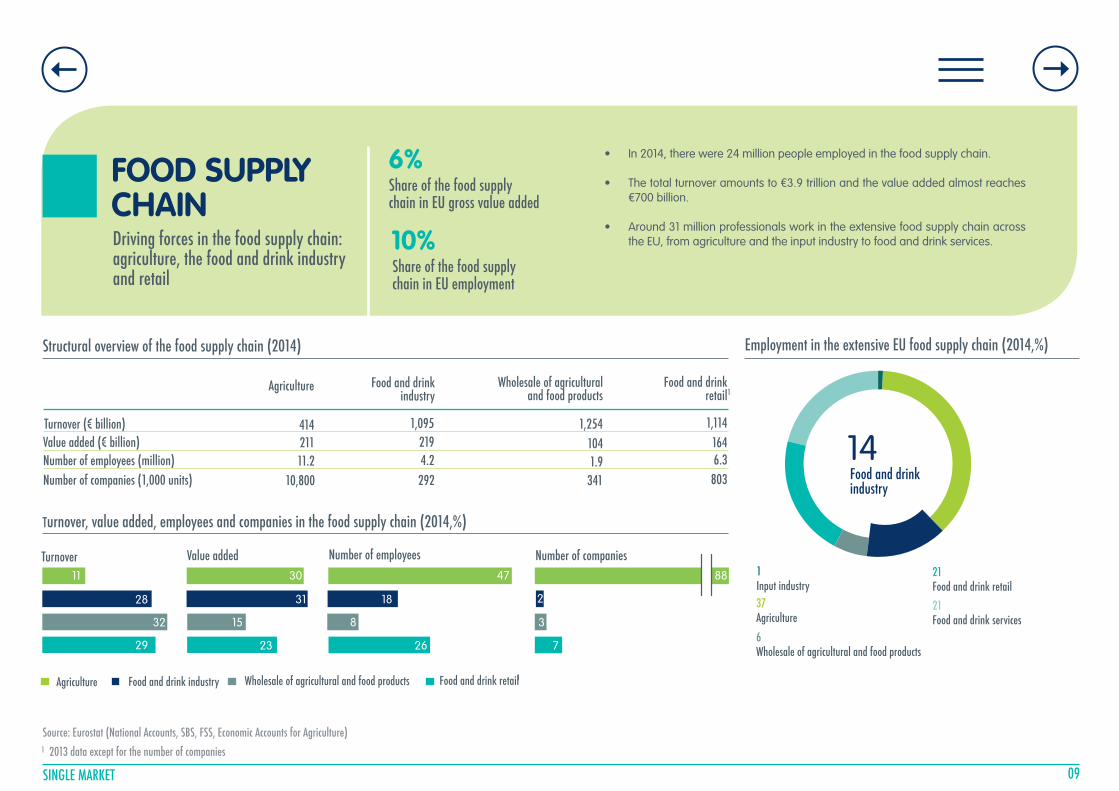
FOOD SUPPLY CHAIN
• In 2014, there were 24 million people employed in the food supply chain.
• The total turnover amounts to €3.9 trillion and the value added almost reaches €700 billion.
• Around 31 million professionals work in the extensive food supply chain across the EU, from agriculture and the input industry to food and drink services.Driving forces in the food supply chain:
agriculture, the food and drink industry and retail
6%Share of the food supply chain in EU gross value added
10%Share of the food supply chain in EU employment
Structural overview of the food supply chain (2014)
Value added (€ billion)Turnover (€ billion)
Number of employees (million)Number of companies (1,000 units)
Agriculture
10,80011.2211414
Food and drink industry
2924.2219
1,095
Wholesale of agricultural and food products
Food and drink retail
3411.9104
1,254
8036.3164
1,114
Employment in the extensive EU food supply chain (2014,%)
Source: Eurostat (National Accounts, SBS, FSS, Economic Accounts for Agriculture)
Turnover, value added, employees and companies in the food supply chain (2014,%)
Turnover Value added Number of employees Number of companies
Food and drink industryAgriculture Food and drink retailWholesale of agricultural and food products
11
28
32
29
30
31
15
23
47
18
8
26
88
3
2
7
1
1
14Food and drinkindustry
1Input industry37Agriculture
6Wholesale of agricultural and food products
21Food and drink retail21Food and drink services
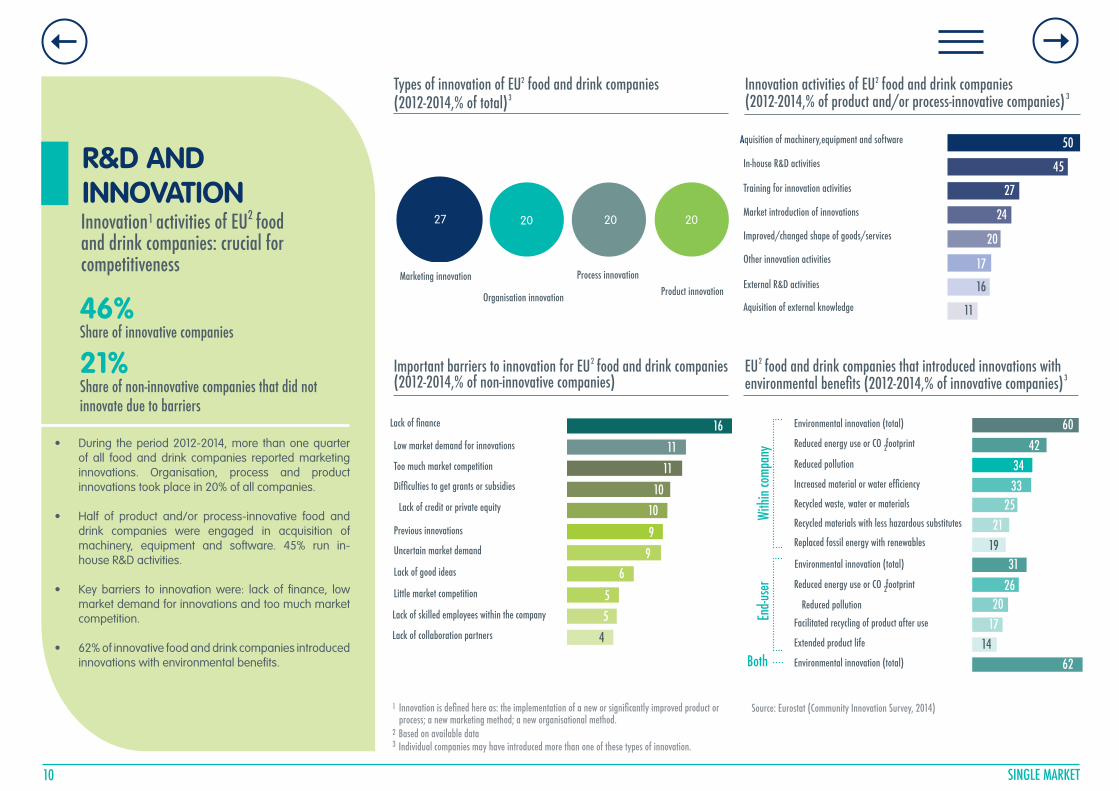
R&D AND INNOVATION Innovation activities of EU food and drink companies: crucial for competitiveness
46%Share of innovative companies
21%Share of non-innovative companies that did not innovate due to barriers
• During the period 2012-2014, more than one quarter of all food and drink companies reported marketing innovations. Organisation, process and product innovations took place in 20% of all companies.
• Half of product and/or process-innovative food and drink companies were engaged in acquisition of machinery, equipment and software. 45% run in-house R&D activities.
• Key barriers to innovation were: lack of finance, low market demand for innovations and too much market competition.
• 62% of innovative food and drink companies introduced innovations with environmental benefits.
Types of innovation of EU food and drink companies (2012-2014,% of total)
Innovation activities of EU food and drink companies (2012-2014,% of product and/or process-innovative companies)
Important barriers to innovation for EU food and drink companies(2012-2014,% of non-innovative companies)
EU food and drink companies that introduced innovations with environmental benefits (2012-2014,% of innovative companies)
10 SINGLE MARKET
Marketing innovation
Organisation innovation
Process innovationProduct innovation
Innovation is defined here as: the implementation of a new or significantly improved product or process; a new marketing method; a new organisational method.
1 Source: Eurostat (Community Innovation Survey, 2014)
Based on available data2
Individual companies may have introduced more than one of these types of innovation.3
Aquisition of machinery,equipment and software
In-house R&D activities
Training for innovation activities
Market introduction of innovations
Improved/changed shape of goods/services
Other innovation activities
External R&D activities
Aquisition of external knowledge
Lack of finance
Low market demand for innovations
Too much market competition
Difficulties to get grants or subsidies
Lack of credit or private equity
Previous innovations
Uncertain market demand
Lack of good ideas
Little market competition
Lack of skilled employees within the company
Lack of collaboration partners
Environmental innovation (total)
Reduced energy use or CO footprint
Reduced pollution
Increased material or water efficiency
Recycled waste, water or materials
Recycled materials with less hazardous substitutes
Replaced fossil energy with renewables
Environmental innovation (total)
Reduced pollution
Facilitated recycling of product after use
Extended product life
Environmental innovation (total)
Withi
n com
pany
End-u
ser
Both
2
3
2
2 2
1 2 27 2020 20
3
3
50
54
45
27
24
20
17
16
11
1611
1110
10
99
6
55
4
6042
3433
2521
3126
2017
62
19
14
2
Reduced energy use or CO footprint2
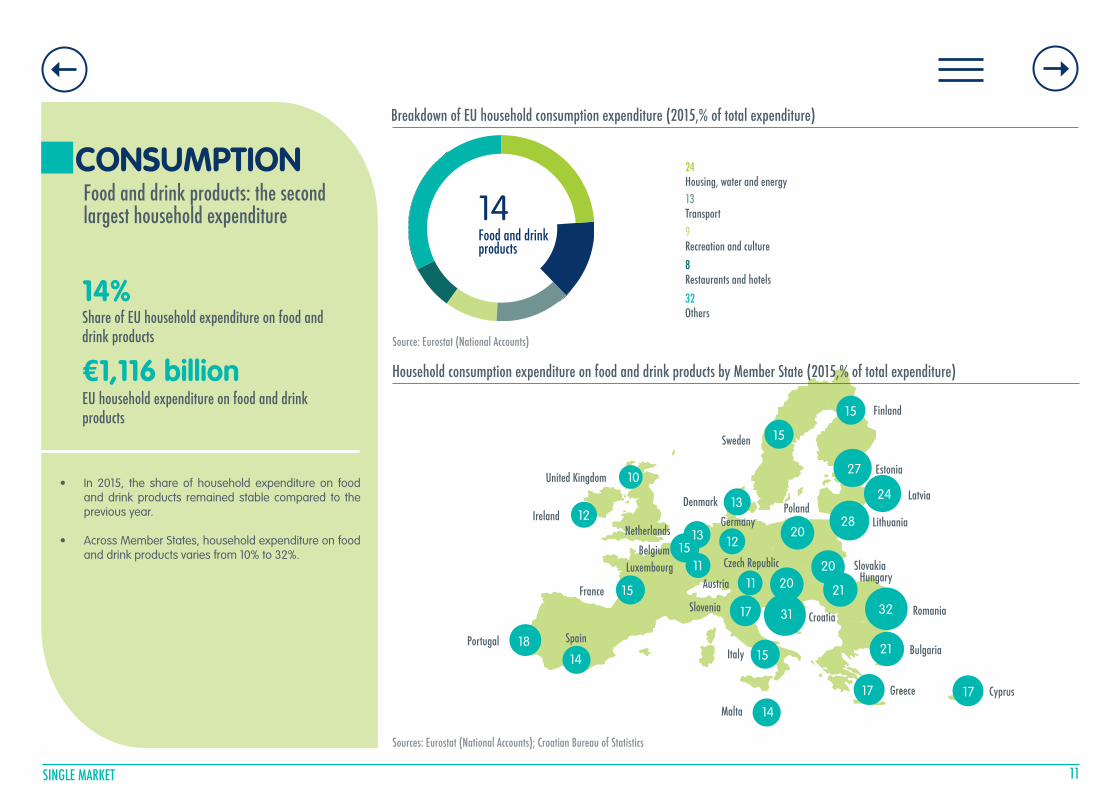
CONSUMPTION Food and drink products: the second largest household expenditure
14%Share of EU household expenditure on food and drink products
€1,116 billionEU household expenditure on food and drink products
• In 2015, the share of household expenditure on food and drink products remained stable compared to the previous year.
• Across Member States, household expenditure on food and drink products varies from 10% to 32%.
SINGLE MARKET 11
21
20
13
12
27
12
14
15
31
15
24
28
21
18
32
10Latvia
Romania
Estonia
Poland
Hungary
Bulgaria
SlovakiaCzech Republic
Portugal
Greece
Slovenia
Cyprus
Finland
Italy
France
Croatia
Belgium
Malta
Sweden
Spain
IrelandDenmark
NetherlandsGermany Lithuania
AustriaLuxembourg
United Kingdom
15
17 17
11
14
13
11
20
17
20
15
15
Household consumption expenditure on food and drink products by Member State (2015,% of total expenditure)
Sources: Eurostat (National Accounts); Croatian Bureau of Statistics
Breakdown of EU household consumption expenditure (2015,% of total expenditure)
Source: Eurostat (National Accounts)
24Housing, water and energy13Transport9Recreation and culture8Restaurants and hotels32Others
14Food and drinkproducts
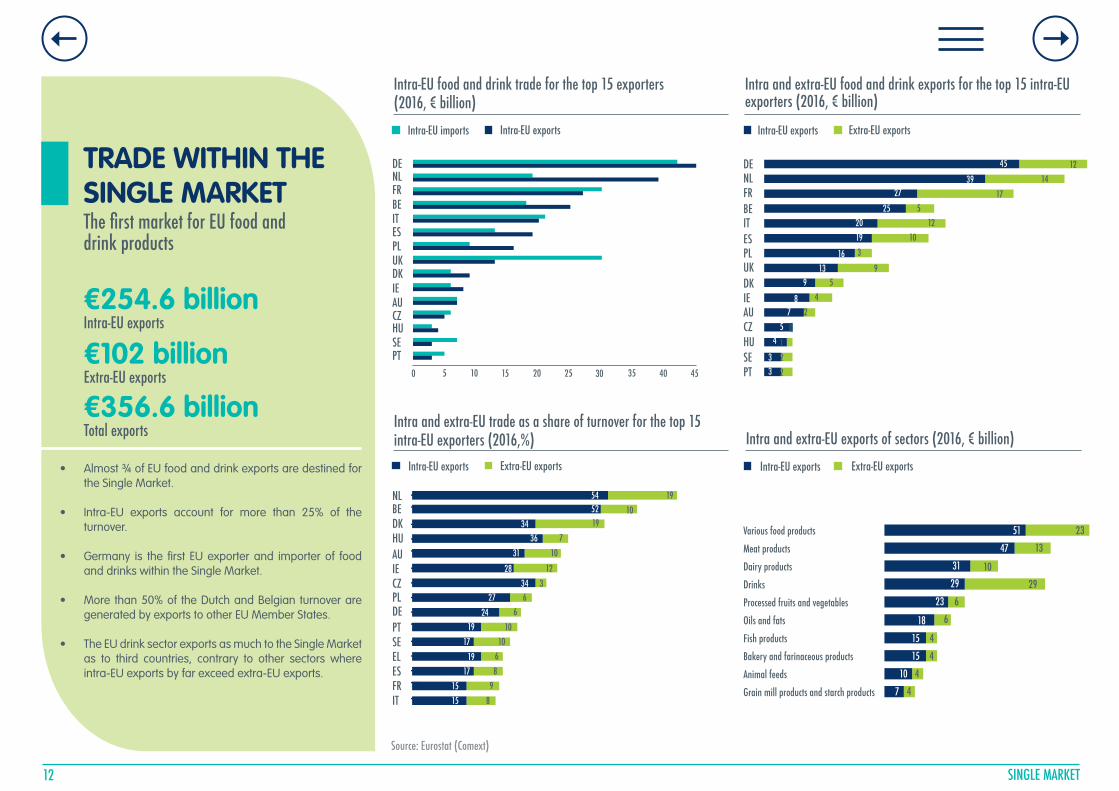
TRADE WITHIN THE SINGLE MARKETThe first market for EU food and drink products
€254.6 billionIntra-EU exports
€102 billionExtra-EU exports
• Almost ¾ of EU food and drink exports are destined for the Single Market.
• Intra-EU exports account for more than 25% of the turnover.
• Germany is the first EU exporter and importer of food and drinks within the Single Market.
• More than 50% of the Dutch and Belgian turnover are generated by exports to other EU Member States.
• The EU drink sector exports as much to the Single Market as to third countries, contrary to other sectors where intra-EU exports by far exceed extra-EU exports.
Intra-EU food and drink trade for the top 15 exporters (2016, € billion)
Intra and extra-EU food and drink exports for the top 15 intra-EU exporters (2016, € billion)
12 SINGLE MARKET
€356.6 billionTotal exports
DENLFRBEITESPLUKDKIEAUCZHUSEPT
Intra-EU exportsIntra-EU imports Extra-EU exportsIntra-EU exports
0 5 10 15 20 25 30 35 40 45
Intra and extra-EU trade as a share of turnover for the top 15 intra-EU exporters (2016,%)
Extra-EU exportsIntra-EU exports
Intra and extra-EU exports of sectors (2016, € billion)
Extra-EU exportsIntra-EU exports
NLBEDKHUAUIECZPLDEPTSEELESFRIT
Source: Eurostat (Comext)
Various food products
Meat products
Dairy products
Drinks
Processed fruits and vegetables
Oils and fats
Fish products
Bakery and farinaceous products
Animal feeds
Grain mill products and starch products
DENLFRBEITESPLUKDKIEAUCZHUSEPT
45 1239
27
252019
1613
9
87
54
33
14
175
1210
3
95
42
012
2
5452
3436
31
2834
27
2419
1719
171515
1910
197
10
123
66
1010
68
98
51
47
31
29
23
18
15
15
10
7
23
13
10
29
6
6
4
4
4
4
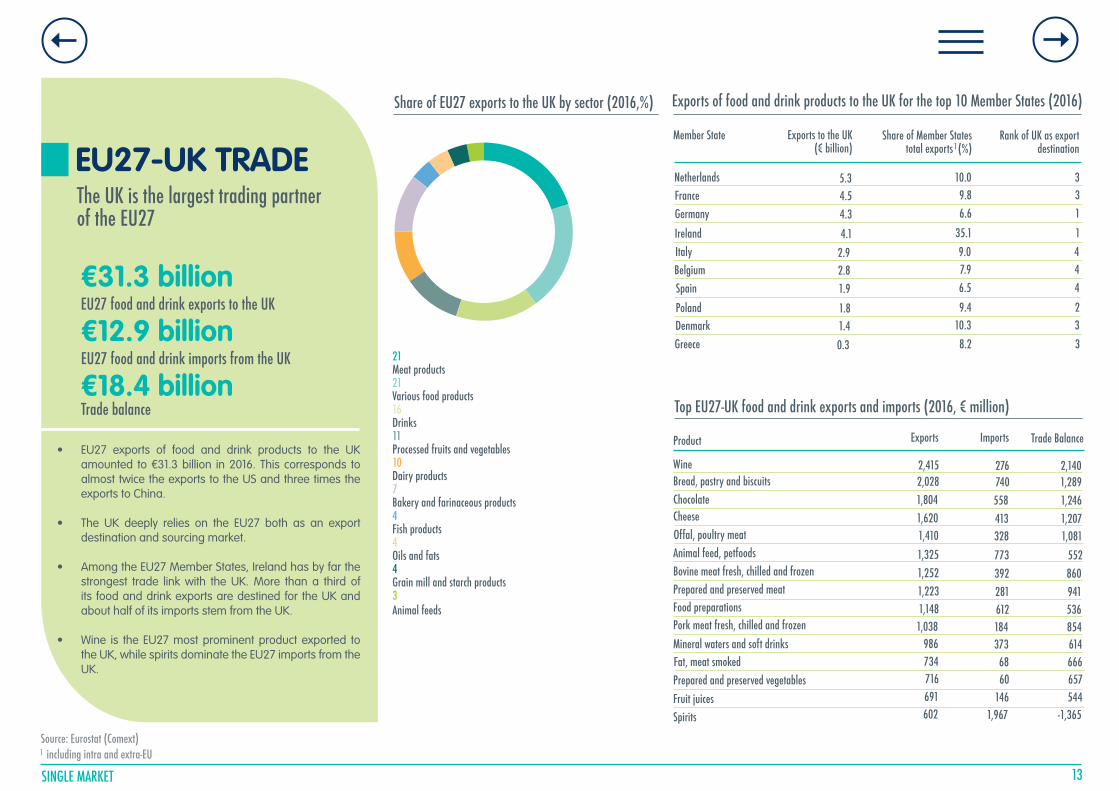
EU27-UK TRADEThe UK is the largest trading partner of the EU27
€31.3 billionEU27 food and drink exports to the UK
€12.9 billionEU27 food and drink imports from the UK
• EU27 exports of food and drink products to the UK amounted to €31.3 billion in 2016. This corresponds to almost twice the exports to the US and three times the exports to China.
• The UK deeply relies on the EU27 both as an export destination and sourcing market.
• Among the EU27 Member States, Ireland has by far the strongest trade link with the UK. More than a third of its food and drink exports are destined for the UK and about half of its imports stem from the UK.
• Wine is the EU27 most prominent product exported to the UK, while spirits dominate the EU27 imports from the UK.
SINGLE MARKET 13
Share of EU27 exports to the UK by sector (2016,%)
Top EU27-UK food and drink exports and imports (2016, € million)€18.4 billionTrade balance
Exports of food and drink products to the UK for the top 10 Member States (2016)
Source: Eurostat (Comext)
Exports to the UK (€ billion)
4.1
4.34.55.3
Share of Member States total exports (%)
Member State
1.8
1.92.82.9
1.4
FranceNetherlands
Germany
Ireland
BelgiumItaly
Spain
PolandDenmarkGreece 0.3
Rank of UK as export destination
35.1
6.69.8
10.0
9.4
6.57.99.0
10.38.2
1
133
2
444
33
1,6201,8042,0282,415
ExportsProduct
1,2231,2521,3251,410
1,148
Bread, pastry and biscuitsWine
ChocolateCheese
Animal feed, petfoodsOffal, poultry meat
Bovine meat fresh, chilled and frozen
1,038
Imports
21Meat products21Various food products16Drinks11Processed fruits and vegetables10Dairy products7Bakery and farinaceous products4Fish products4Oils and fats4Grain mill and starch products3Animal feeds
734986Mineral waters and soft drinks
Fat, meat smokedPrepared and preserved vegetables
SpiritsFruit juices
Trade Balance
716691602
Prepared and preserved meatFood preparationsPork meat fresh, chilled and frozen
413558740276
281392773328
612184
68373
60146
1,967
1,2071,2461,2892,140
941860552
1,081
536854
666614
657544
-1,365
including intra and extra-EU1
1
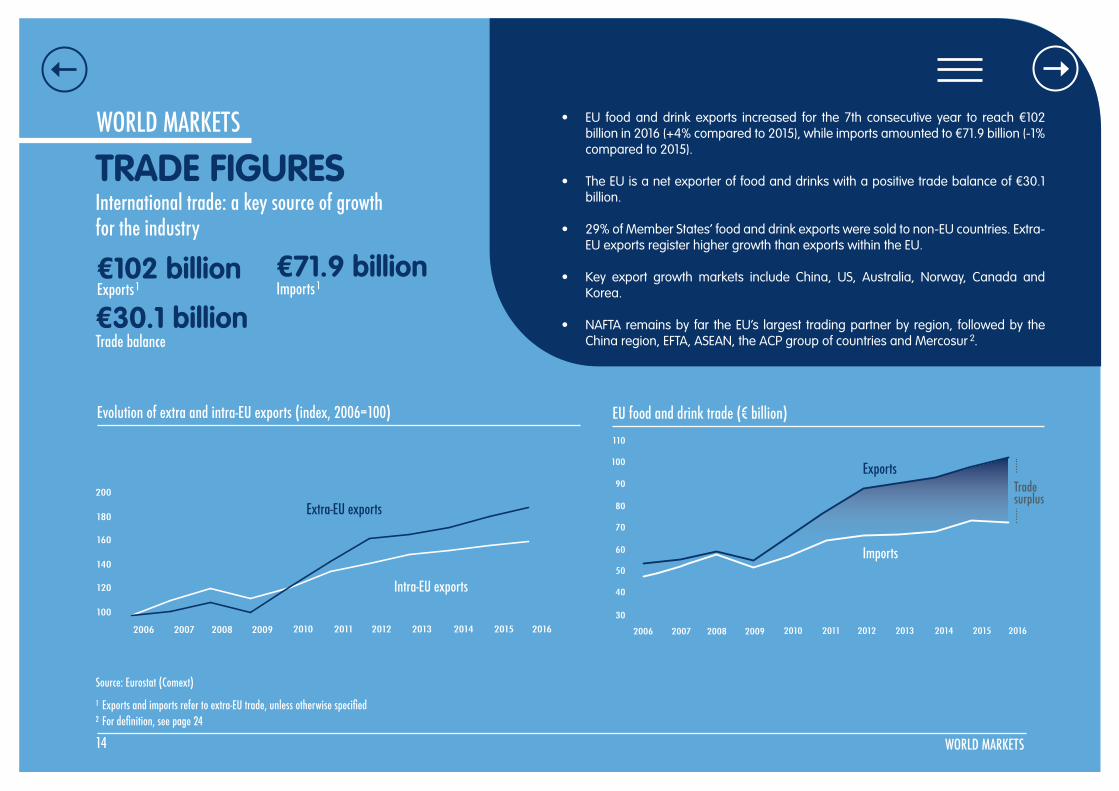
WORLD MARKETS
TRADE FIGURESInternational trade: a key source of growth for the industry
€102 billionExports
€71.9 billionImports
€30.1 billionTrade balance
• EU food and drink exports increased for the 7th consecutive year to reach €102 billion in 2016 (+4% compared to 2015), while imports amounted to €71.9 billion (-1% compared to 2015).
• The EU is a net exporter of food and drinks with a positive trade balance of €30.1 billion.
• 29% of Member States’ food and drink exports were sold to non-EU countries. Extra-EU exports register higher growth than exports within the EU.
• Key export growth markets include China, US, Australia, Norway, Canada and Korea.
• NAFTA remains by far the EU’s largest trading partner by region, followed by the China region, EFTA, ASEAN, the ACP group of countries and Mercosur .
WORLD MARKETS14For definition, see page 242Exports and imports refer to extra-EU trade, unless otherwise specified1
Evolution of extra and intra-EU exports (index, 2006=100)
200
180
160
140
120
100
2006 2007 2008 2009 2010 2011 2012 2013 2014 2015 2016
Extra-EU exports
Intra-EU exports
1 1
2
Source: Eurostat (Comext)
EU food and drink trade (€ billion)
2006 2007 2008 2009 2010 2011 2012 2013 2014 2015 2016
110
100
90
80
70
60
50
40
30
Exports
Imports
Trade surplus
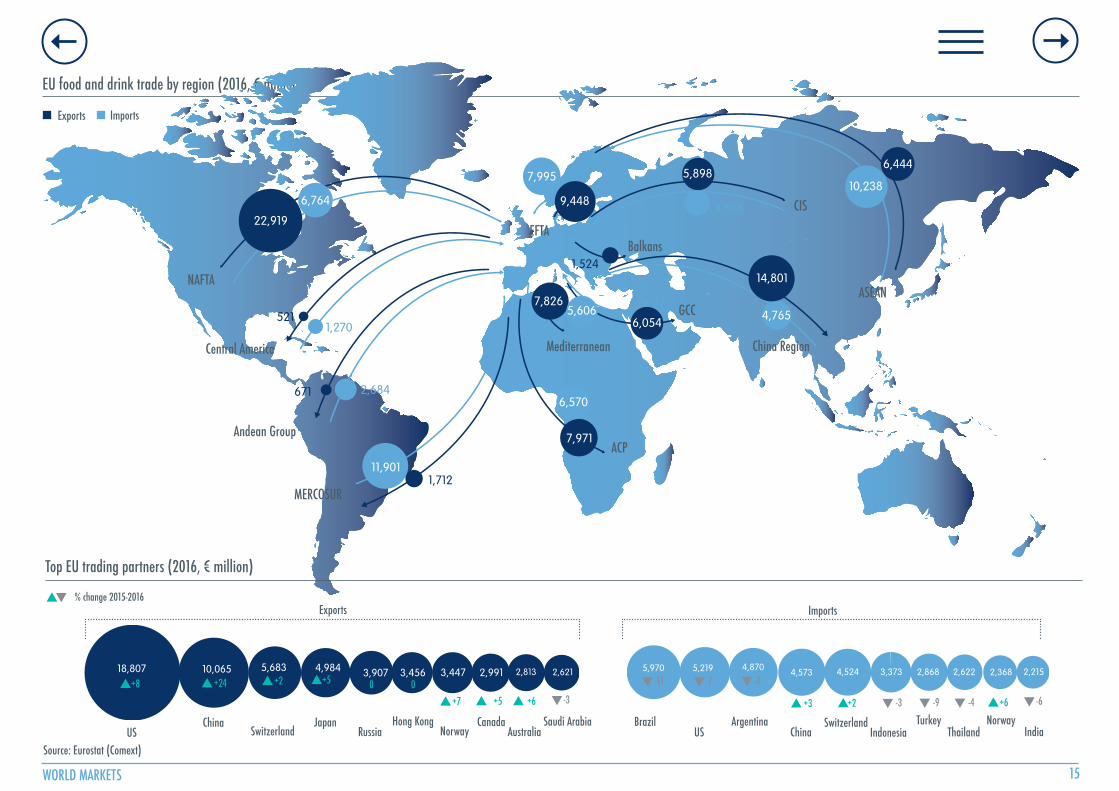
Top EU trading partners (2016, € million)
18,807
% change 2015-2016
Source: Eurostat (Comext)
10,065 5,683 4,984 3,907 3,456 3,447 2,991 2,813 2,621 5,970 5,219 4,870 4,573 4,524 3,373 2,868 2,622 2,368 2,215
Exports Imports
USChina
SwitzerlandJapan
RussiaHong Kong
NorwayCanada
AustraliaSaudi Arabia Brazil
USArgentina
ChinaSwitzerland
IndonesiaTurkey
ThailandNorway
India
+8 +24 +2 +5
+7 +5 +6 -3
-11 -7 -3
+3 +2 -3 -9 -4 -6+6
WORLD MARKETS 15
EU food and drink trade by region (2016, € million)
ImportsExports
NAFTA
EFTA
CIS3,608
1,524
370
ASEAN
ACP
Mediterranean
GCC 77
Andean Group
671 2,684
MERCOSUR 1,712
Central America
5211,270
22,919
6,764
11,901
7,971
6,570
7,826
Balkans
5,606 6,054
7,995
9,44810,238
6,444 5,898
China Region
4,765
14,801
0 0
TRADE FIGURES BY SECTOR
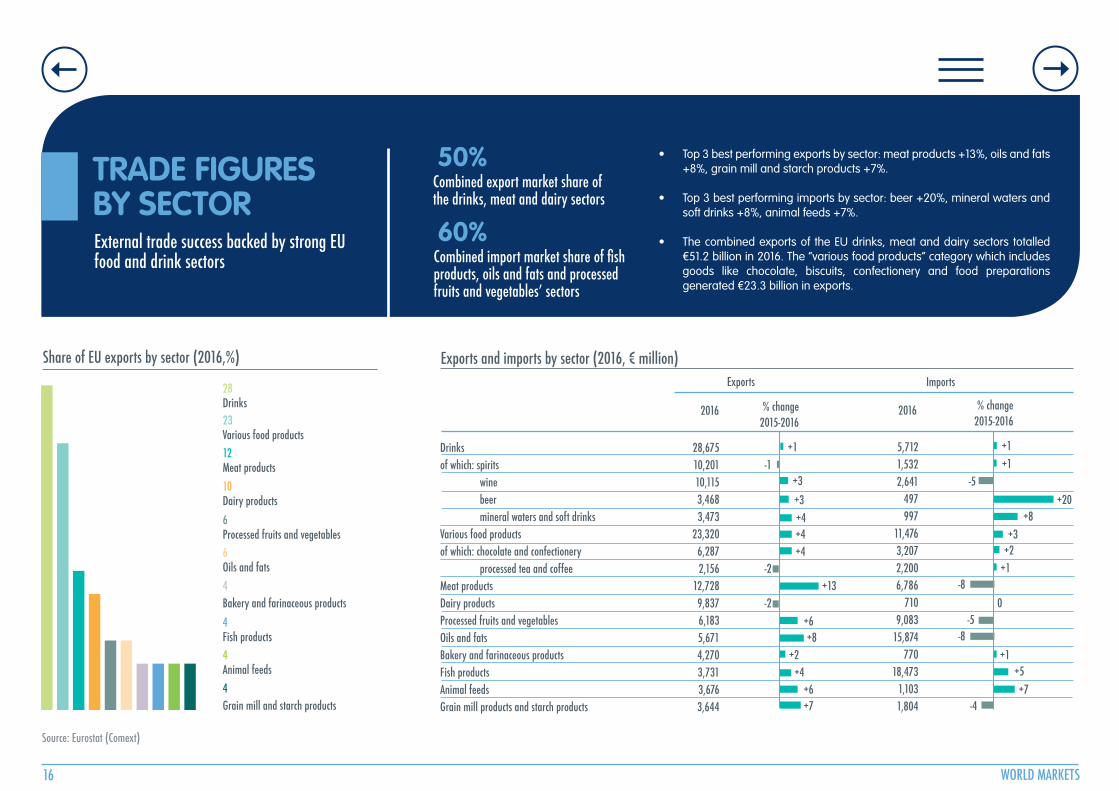
• Top 3 best performing exports by sector: meat products +13%, oils and fats +8%, grain mill and starch products +7%.
• Top 3 best performing imports by sector: beer +20%, mineral waters and soft drinks +8%, animal feeds +7%.
• The combined exports of the EU drinks, meat and dairy sectors totalled €51.2 billion in 2016. The “various food products” category which includes goods like chocolate, biscuits, confectionery and food preparations generated €23.3 billion in exports.
16 WORLD MARKETS
External trade success backed by strong EU food and drink sectors
50%Combined export market share of the drinks, meat and dairy sectors
60%Combined import market share of fish products, oils and fats and processed fruits and vegetables’ sectors
Exports and imports by sector (2016, € million)Exports Imports
2016
28,67510,20110,1153,4683,473
23,3206,2872,156
12,7289,8376,1835,6714,2703,7313,6763,644
5,7121,5322,641
497997
11,4763,2072,2006,786
7109,083
15,874770
18,4731,1031,804
2016 % change 2015-2016
% change 2015-2016
Drinksof which: spirits wine beer mineral waters and soft drinksVarious food productsof which: chocolate and confectionery processed tea and coffeeMeat productsDairy productsProcessed fruits and vegetablesOils and fatsBakery and farinaceous productsFish productsAnimal feedsGrain mill products and starch products
-1
-2
-2
Share of EU exports by sector (2016,%)
28Drinks23Various food products12Meat products10Dairy products6Processed fruits and vegetables6Oils and fats4Bakery and farinaceous products4Fish products4Animal feeds4Grain mill and starch products
Source: Eurostat (Comext)
+1
+3+3+4+4+4
+6+8
+2+4
+6+7
+13
+1+1
+20+8
+3+2
+1
0
+1+5+7
-5
-8
-5-8
-4
TRADE FIGURESBY PRODUCT Diversified products and markets
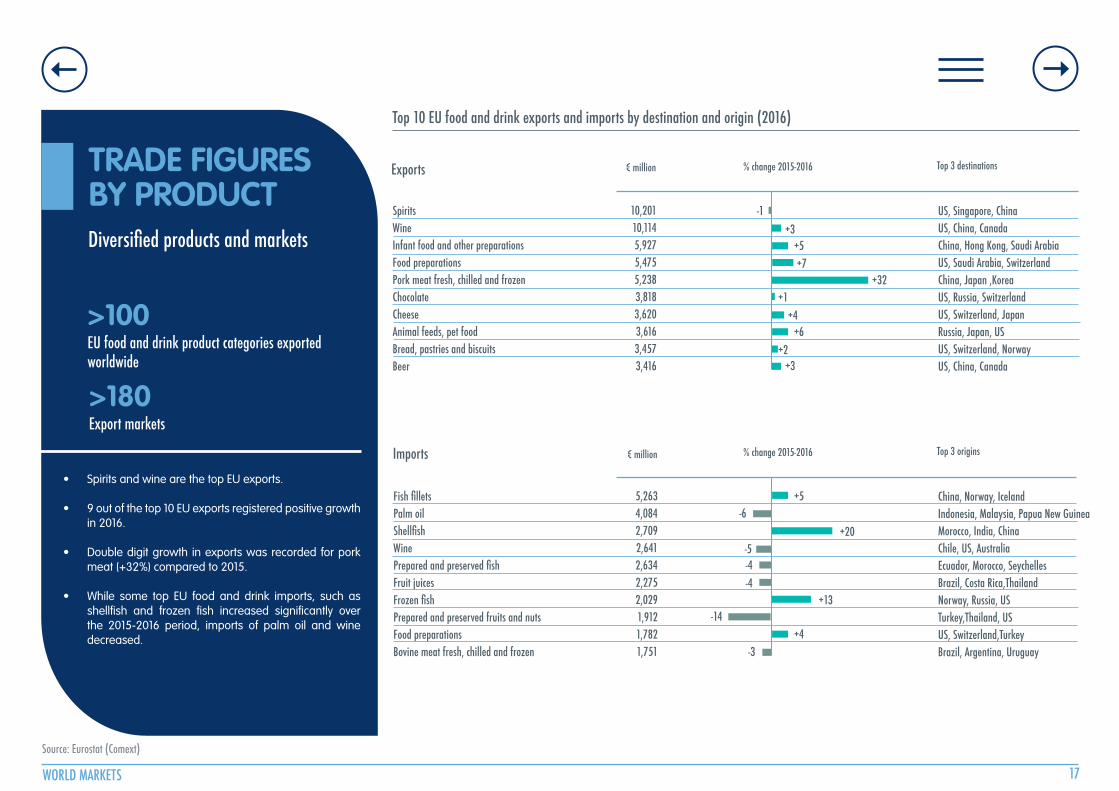
>100EU food and drink product categories exported worldwide
>180Export markets
• Spirits and wine are the top EU exports.
• 9 out of the top 10 EU exports registered positive growth in 2016.
• Double digit growth in exports was recorded for pork meat (+32%) compared to 2015.
• While some top EU food and drink imports, such as shellfish and frozen fish increased significantly over the 2015-2016 period, imports of palm oil and wine decreased.
WORLD MARKETS 17
Source: Eurostat (Comext)
Top 10 EU food and drink exports and imports by destination and origin (2016)
Exports
SpiritsWineInfant food and other preparations Food preparationsPork meat fresh, chilled and frozenChocolateCheeseAnimal feeds, pet foodBread, pastries and biscuitsBeer
10,20110,1145,9275,4755,2383,8183,6203,6163,4573,416
-1 US, Singapore, ChinaUS, China, CanadaChina, Hong Kong, Saudi ArabiaUS, Saudi Arabia, SwitzerlandChina, Japan ,KoreaUS, Russia, SwitzerlandUS, Switzerland, JapanRussia, Japan, USUS, Switzerland, NorwayUS, China, Canada
€ million % change 2015-2016 Top 3 destinations
Imports
Fish filletsPalm oilShellfishWinePrepared and preserved fishFruit juicesFrozen fishPrepared and preserved fruits and nutsFood preparationsBovine meat fresh, chilled and frozen
5,2634,0842,7092,6412,6342,2752,0291,9121,7821,751
China, Norway, IcelandIndonesia, Malaysia, Papua New GuineaMorocco, India, ChinaChile, US, AustraliaEcuador, Morocco, SeychellesBrazil, Costa Rica,ThailandNorway, Russia, USTurkey,Thailand, USUS, Switzerland,TurkeyBrazil, Argentina, Uruguay
€ million % change 2015-2016 Top 3 origins
+3+5+7
+1+4
+6+2
+3
+32
+5
+20
+13
+4
-6
-5-4-4
-14
-3
EU FOOD AND DRINK MARKET SHARE
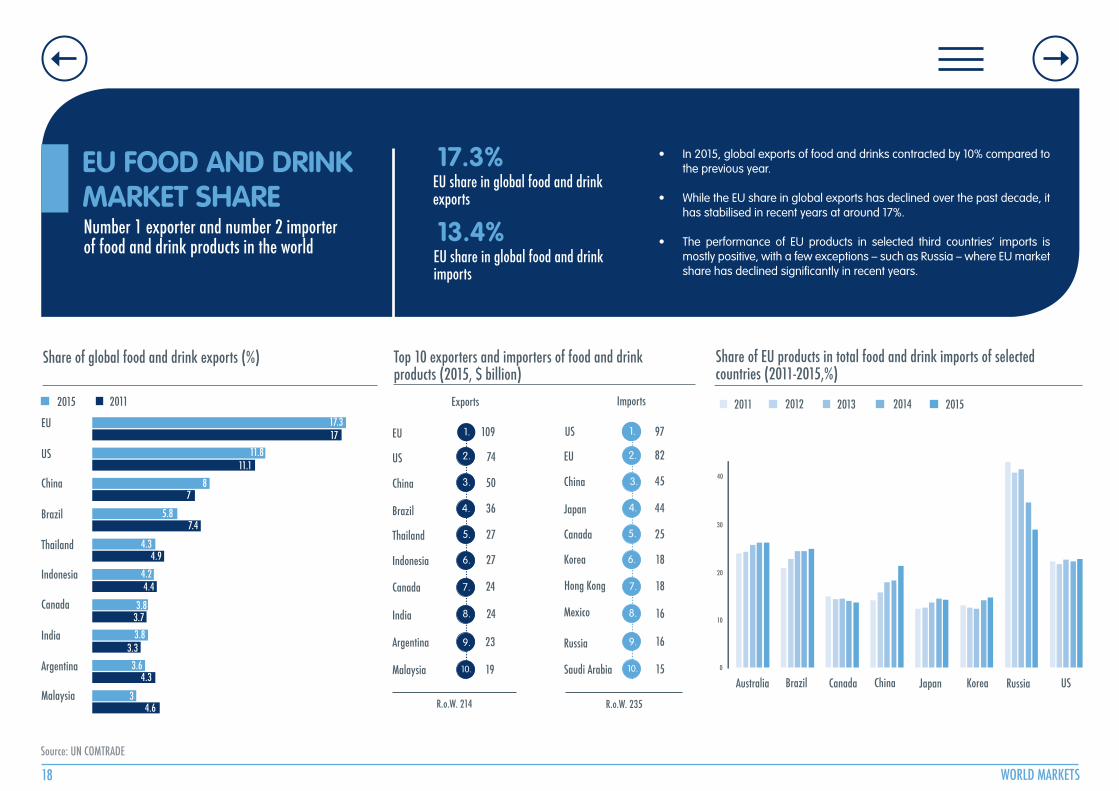
• In 2015, global exports of food and drinks contracted by 10% compared to the previous year.
• While the EU share in global exports has declined over the past decade, it has stabilised in recent years at around 17%.
• The performance of EU products in selected third countries’ imports is mostly positive, with a few exceptions – such as Russia – where EU market share has declined significantly in recent years.
18 WORLD MARKETS
Number 1 exporter and number 2 importer of food and drink products in the world
17.3%EU share in global food and drink exports
13.4%EU share in global food and drink imports
Share of global food and drink exports (%)
20112015
EU
US
China
Canada
Brazil
India
Thailand
Indonesia
Argentina
Malaysia
Source: UN COMTRADE
Top 10 exporters and importers of food and drink products (2015, $ billion)
US
China
Brazil
Malaysia
Canada
Indonesia
Thailand
India
Argentina
Exports
1.
2.
3.
4.
5.
6.
7.
8.
9.
10.
EU 109
74
50
36
27
27
24
24
23
19
EU
China
Japan
Saudi Arabia
Russia
Canada
Korea
Hong Kong
Mexico
US 97
82
45
44
25
18
18
16
16
15
R.o.W. 214 R.o.W. 235
Imports
40
30
20
10
0
Share of EU products in total food and drink imports of selected countries (2011-2015,%)
20122011 20142013 2015
BrazilAustralia Canada China KoreaJapan Russia US
17.317
11.811.1
87
5.87.4
4.34.9
4.24.4
3.83.7
3.83.3
3.64.3
34.6
1.
2.
3.
4.
5.
6.
7.
8.
9.
10.
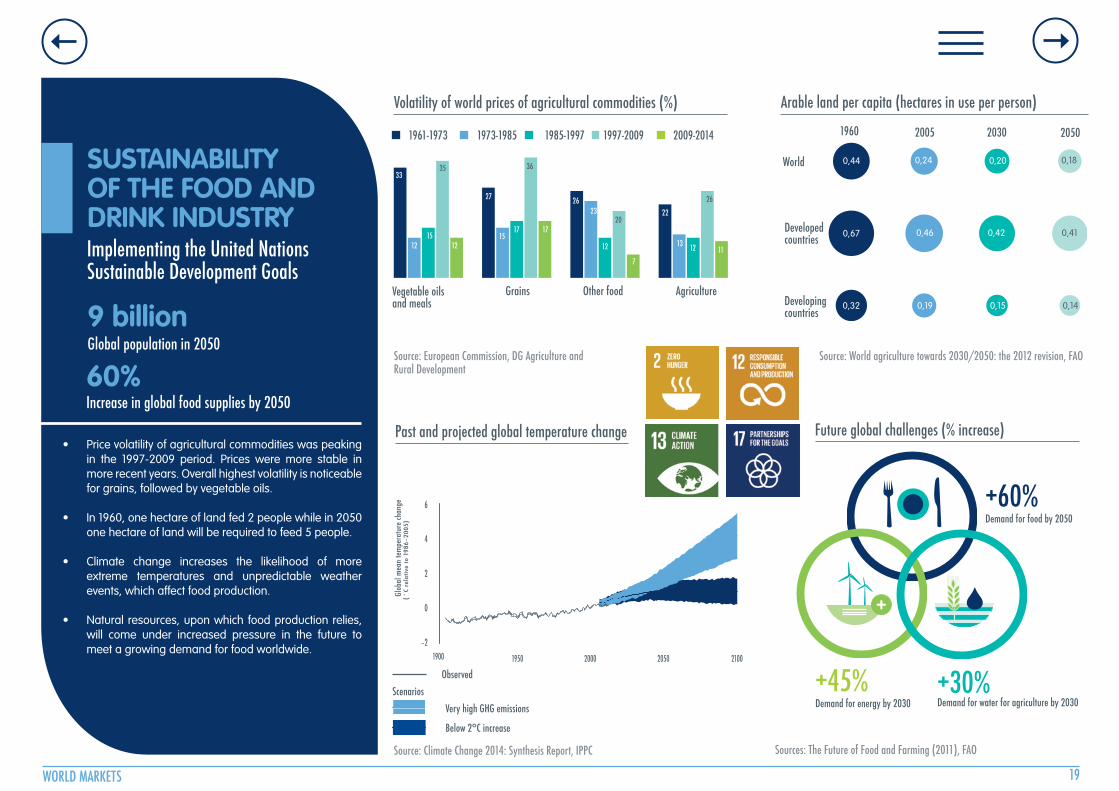
SUSTAINABILITY OF THE FOOD AND DRINK INDUSTRYImplementing the United Nations Sustainable Development Goals
9 billionGlobal population in 2050
60%Increase in global food supplies by 2050
• Price volatility of agricultural commodities was peaking in the 1997-2009 period. Prices were more stable in more recent years. Overall highest volatility is noticeable for grains, followed by vegetable oils.
• In 1960, one hectare of land fed 2 people while in 2050 one hectare of land will be required to feed 5 people.
• Climate change increases the likelihood of more extreme temperatures and unpredictable weather events, which affect food production.
• Natural resources, upon which food production relies, will come under increased pressure in the future to meet a growing demand for food worldwide.
WORLD MARKETS 19
Volatility of world prices of agricultural commodities (%) Arable land per capita (hectares in use per person)
Source: European Commission, DG Agriculture and Rural Development
World
Developed countries
Developing countries
0,44
1960 2005 2030 2050
Source: World agriculture towards 2030/2050: the 2012 revision, FAO
0,67
0,32
0,24
0,46
0,19
0,20
0,42
0,15
0,18
0,41
0,14
1900 1950 2000 2050 2100
6
4
2
0
–2
(˚
C re
lati
ve t
o 19
86–2
005)
Glob
al m
ean
tem
pera
ture
chan
ge
1961-1973
Vegetable oils and meals
1973-1985 1985-1997 1997-2009 2009-2014
Grains Other food Agriculture
33
1215
12
27
1517 17
2623
12
7
22
13 12 11
26
20
3635
Past and projected global temperature change Future global challenges (% increase)
ScenariosObserved
Very high GHG emissions
Below 2°C increase
Source: Climate Change 2014: Synthesis Report, IPPC
+
Sources: The Future of Food and Farming (2011), FAO
+60%Demand for food by 2050
+45%Demand for energy by 2030
+30%Demand for water for agriculture by 2030
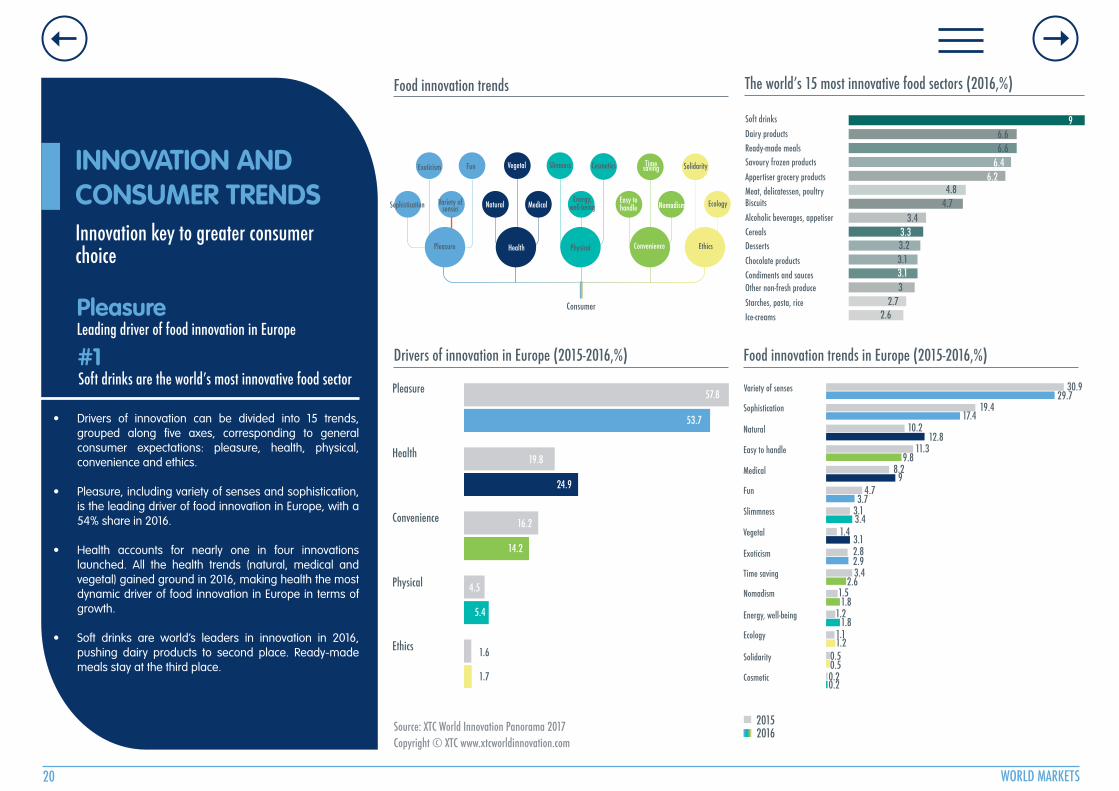
INNOVATION AND CONSUMER TRENDSInnovation key to greater consumer choice
PleasureLeading driver of food innovation in Europe
• Drivers of innovation can be divided into 15 trends, grouped along five axes, corresponding to general consumer expectations: pleasure, health, physical, convenience and ethics.
• Pleasure, including variety of senses and sophistication, is the leading driver of food innovation in Europe, with a 54% share in 2016.
• Health accounts for nearly one in four innovations launched. All the health trends (natural, medical and vegetal) gained ground in 2016, making health the most dynamic driver of food innovation in Europe in terms of growth.
• Soft drinks are world’s leaders in innovation in 2016, pushing dairy products to second place. Ready-made meals stay at the third place.
20 WORLD MARKETS
Food innovation trends
Exoticism
Sophistication
Fun Vegetal Slimness Cosmetics Time saving Solidarity
Variety of senses Natural Medical
Energy, well-being
Easy to handle Nomadism Ecology
Pleasure Physical Convenience Ethics
Consumer
Health
Source: XTC World Innovation Panorama 2017Copyright © XTC www.xtcworldinnovation.com
Ecology
Solidarity
Cosmetic
Drivers of innovation in Europe (2015-2016,%) Food innovation trends in Europe (2015-2016,%)
Health
Pleasure
Convenience
Ethics
Physical
57.8
53.7
19.8
24.9
16.2
14.2
4.5
5.4
1.6
1.7
20162015
29.7Variety of senses
Sophistication
Natural
Easy to handle
Medical
Fun
Slimmness
Vegetal
Exoticism
Time saving
Nomadism
Energy, well-being
30.9
19.417.4
10.212.8
11.39.8
8.29
4.73.7
3.13.4
1.43.12.82.93.4
2.61.51.8
1.21.8
1.11.2
0.50.50.20.2
The world’s 15 most innovative food sectors (2016,%)
Soft drinksDairy productsReady-made mealsSavoury frozen productsAppertiser grocery productsMeat, delicatessen, poultryBiscuitsAlcoholic beverages, appetiserCerealsDessertsChocolate productsCondiments and saucesOther non-fresh produceStarches, pasta, riceIce-creams
96.66.6
6.24.8
4.73.4
3.23.1
3
2.62.7
3.3
3.1
6.4
#1Soft drinks are the world’s most innovative food sector
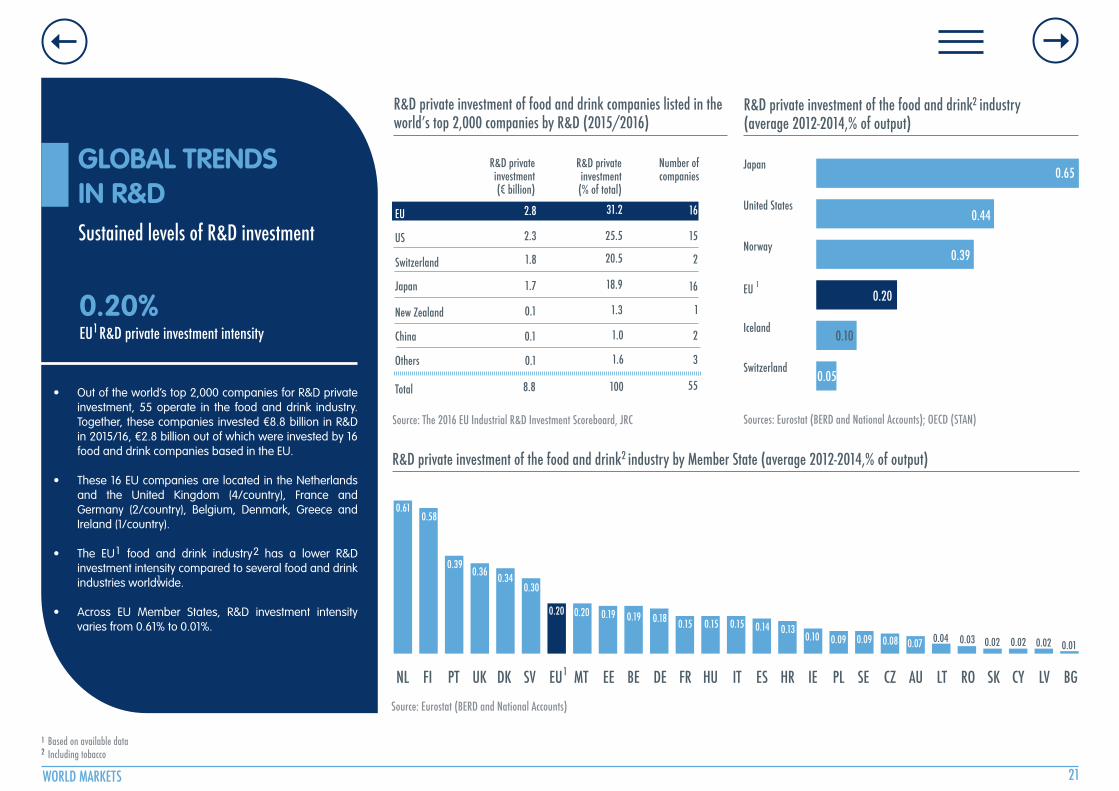
GLOBAL TRENDS IN R&DSustained levels of R&D investment
0.20%EU R&D private investment intensity
• Out of the world’s top 2,000 companies for R&D private investment, 55 operate in the food and drink industry. Together, these companies invested €8.8 billion in R&D in 2015/16, €2.8 billion out of which were invested by 16 food and drink companies based in the EU.
• These 16 EU companies are located in the Netherlands and the United Kingdom (4/country), France and Germany (2/country), Belgium, Denmark, Greece and Ireland (1/country).
• The EU food and drink industry has a lower R&D investment intensity compared to several food and drink industries worldwide.
• Across EU Member States, R&D investment intensity varies from 0.61% to 0.01%.
WORLD MARKETS 21
Source: Eurostat (BERD and National Accounts)
R&D private investment of food and drink companies listed in the world’s top 2,000 companies by R&D (2015/2016)
1
1
Based on available data1
Including tobacco2
R&D private investment of the food and drink industry by Member State (average 2012-2014,% of output)
Source: The 2016 EU Industrial R&D Investment Scoreboard, JRC
EU
R&D privateinvestment(€ billion)
US
Switzerland
Japan
New Zealand
China
R&D private investment (% of total)
Number ofcompanies
16
15
2
16
Total
31.2
25.5
20.5
18.9
100 55
1.3
2
0.1
2.8
2.3
1.8
1.7
1
1.0 0.1
8.8
R&D private investment of the food and drink industry(average 2012-2014,% of output)
United States
Japan
Norway
EU
Iceland
Switzerland
1
Sources: Eurostat (BERD and National Accounts); OECD (STAN)
Others 31.6 0.1
2
NL FI PT UK DK SV EU MT EE BE DE FR HU IT ES HR IE PL SE CZ AU LT RO SK CY LV BG
0.65
0.44
0.39
0.20
0.05
0.10
0.610.58
0.390.36 0.34
0.30
0.20 0.20 0.19 0.19 0.18 0.15 0.15 0.15 0.14 0.130.10 0.09 0.09 0.08 0.07 0.04 0.03 0.02 0.02 0.02 0.01
2
1
1 2
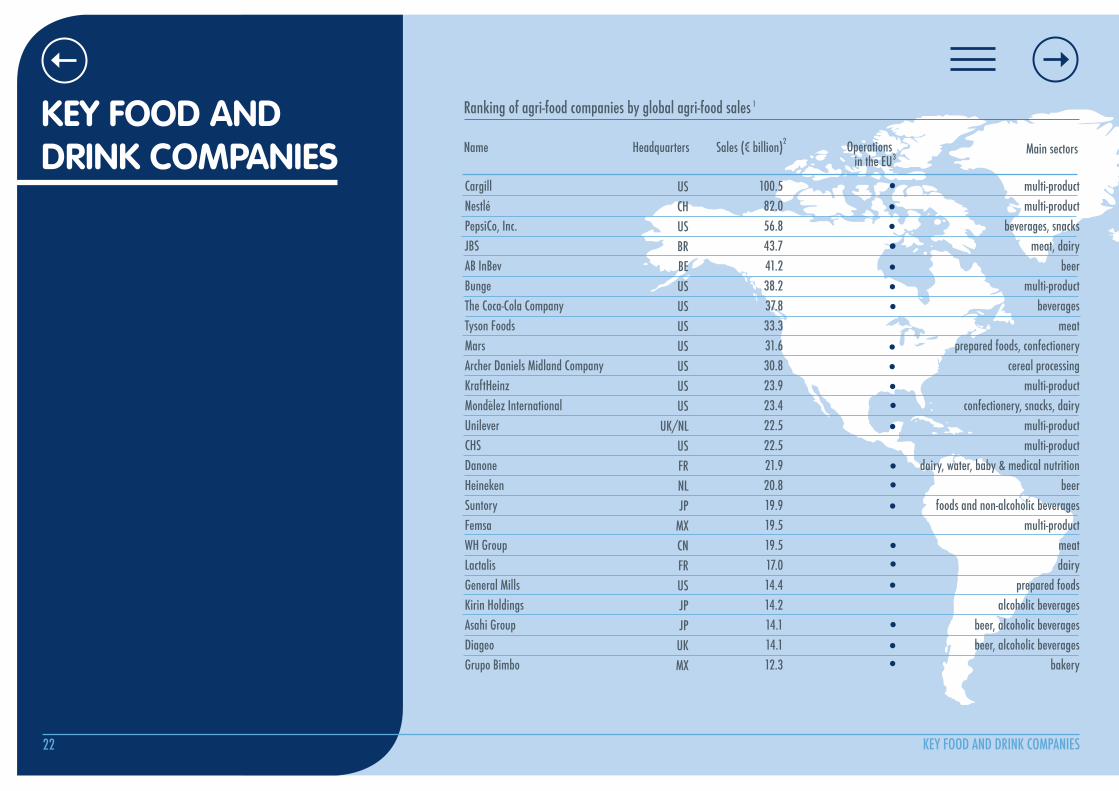
KEY FOOD AND DRINK COMPANIES
Ranking of agri-food companies by global agri-food sales
Name Headquarters Main sectors
CargillNestléPepsiCo, Inc.JBSAB InBevBungeThe Coca-Cola CompanyTyson FoodsMarsArcher Daniels Midland CompanyKraftHeinzMondelez InternationalUnileverCHSDanoneHeinekenSuntoryFemsaWH GroupLactalis General MillsKirin HoldingsAsahi GroupDiageoGrupo Bimbo
USCHUSBRBEUSUSUSUSUSUSUS
UK/NLUS FRNLJP
MXCNFRUSJPJPUKMX
100.582.056.843.741.238.237.833.331.630.823.923.422.522.521.920.819.919.519.517.014.414.214.114.112.3
multi-productmulti-product
beverages, snacksmeat, dairy
beermulti-product
beveragesmeat
prepared foods, confectionerycereal processing
multi-productconfectionery, snacks, dairy
multi-productmulti-product
dairy, water, baby & medical nutritionbeer
foods and non-alcoholic beveragesmulti-product
meatdairy
prepared foodsalcoholic beverages
beer, alcoholic beveragesbeer, alcoholic beverages
bakery
Sales (€ billion)
1
2
22 KEY FOOD AND DRINK COMPANIES
Operationsin the EU3
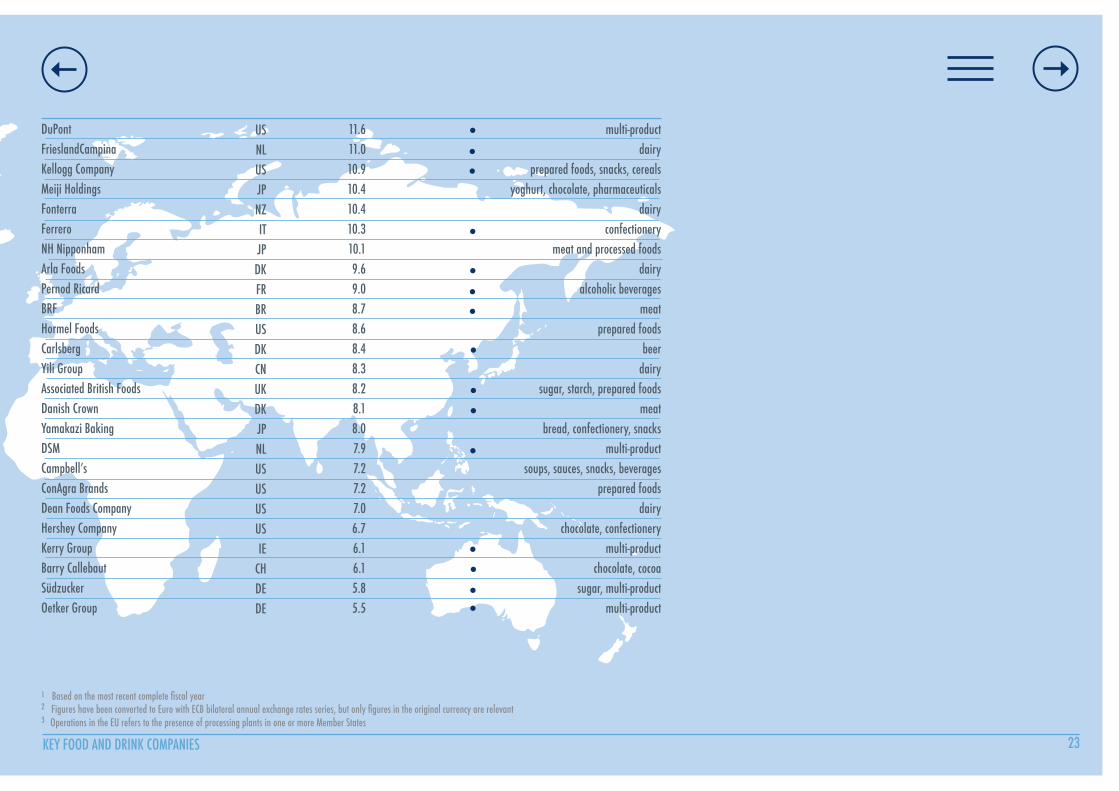
KEY FOOD AND DRINK COMPANIES 23
DuPontFrieslandCampinaKellogg CompanyMeiji HoldingsFonterraFerreroNH NipponhamArla FoodsPernod RicardBRFHormel FoodsCarlsbergYili GroupAssociated British FoodsDanish CrownYamakazi BakingDSMCampbell’sConAgra BrandsDean Foods CompanyHershey CompanyKerry GroupBarry CallebautSüdzuckerOetker Group
Based on the most recent complete fiscal year1
Figures have been converted to Euro with ECB bilateral annual exchange rates series, but only figures in the original currency are relevant2
Operations in the EU refers to the presence of processing plants in one or more Member States3
USNLUSJPNZITJPDKFRBRUSDKCNUK DKJP NLUSUSUSUSIE
CHDEDE
11.611.010.910.410.410.310.19.69.08.78.68.48.38.28.18.07.97.27.27.06.76.16.15.85.5
multi-productdairy
prepared foods, snacks, cerealsyoghurt, chocolate, pharmaceuticals
dairyconfectionery
meat and processed foodsdairy
alcoholic beveragesmeat
prepared foodsbeer
dairysugar, starch, prepared foods
meatbread, confectionery, snacks
multi-productsoups, sauces, snacks, beverages
prepared foodsdairy
chocolate, confectionerymulti-product
chocolate, cocoasugar, multi-product
multi-product
GLOSSARY
Abbreviation of world regions
ACPAfrica, Caribbean and Pacific group of countries
Andean GroupBolivia, Colombia, Ecuador, and Peru
ASEAN (Association of Southeast Asian Nations)Brunei, Cambodia, Indonesia, Laos, Malaysia, Myanmar, Philippines, Singapore, Thailand and Vietnam
BalkansAlbania, Bosnia-Herzegovina, Kosovo, Former Yugoslav Republic of Macedonia, Montenegro and Serbia
Central AmericaPanama, Guatemala, Costa Rica, El Salvador, Honduras and Nicaragua
China regionChina, Hong Kong, Macao and Taïwan
CIS (Commonwealth of Independent States)Armenia, Azerbaijan, Belarus, Kazakhstan, Kyrgyz Republic, Moldova, Russia, Tajikistan, Turkmenistan, Ukraine and Uzbekistan
EFTA (European Free Trade Area)Iceland, Liechtenstein, Norway and Switzerland
EUEU refers to EU28, unless otherwise specified
GCC (Gulf Cooperation Council)Bahrain, Kuwait, Oman, Qatar, Saudi Arabia and the United Arab Emirates
Gross value added (GVA)The gross value added is the value of goods and services produced by a sector minus the cost of the raw materials and other inputs used to produce them. GVA measures the contribution to the economy of each individual sector.
Labour productivityLabour productivity provides a measure of the efficiency of the workforce to produce goods and services. Labour productivity is calculated as the gross value added (GVA) divided by persons employed.
Small and medium-sized enterprises (SMEs) For Eurostat’s Structural Business Statistics database: micro = less than 10; small = 10 to 49; medium-sized = 50 to 249; large = more than 250 employees. The SBS size-class data are solely based on the definition relating to the number of employees and not to the turnover level.
Value added The value added at factor costs is the gross income from operating activities after adjusting for operating subsidies and indirect taxes.
24 GLOSSARY
Mediterranean regionAlgeria, Egypt, Israel, Jordan, Lebanon, Morocco, Tunisia, Syria, Occupied Palestinian Territory
MercosurArgentina, Brazil, Paraguay, Uruguay and Venezuela
NAFTA (North American Free Trade Agreement)Canada, Mexico and the US

Avenue des Nerviens 9-31Brussels 1040BelgiumTel.: +32 2 514 11 11
Published October 2017
@FoodDrinkEU
www.facebook.com/fooddrinkeurope
www.fooddrinkeurope.eu