data storage report - hydralabhydralab.eu/...02_diiv_data_storage_report...10_09.pdf · data...
TRANSCRIPT

Data Storage Report
Deciphering of Ice Induced Vibrations (DIIV)
HyIV-HSVA-02 Large Ice Model Basin, Hamburg Ship Model Basin
(HSVA)
Author: Torodd S. Nord Norwegian University of Sciences and Technology
(NTNU)

Status form Document information Project acronym HyIV-HSVA-02 Provider Hamburg Ship Model Basin Facility Large Ice Model Basin (LIMB) ARCTECLAB Title Deciphering of Ice Induced Vibrations (DIIV) 1st user group contact (name/email) Mauri Määttänen, [email protected] 2nd user group contact (name/email) Torodd Skjerve Nord, [email protected] 1st provider contact (name/email) Karl-Ulrich Evers, [email protected] 2nd provider contact (name/email) Peter Jochmann, [email protected] Start date experiment (dd-mm-yyyy) 08-08-2011 End date experiment (dd-mm-yyyy) 02-09-2011 Document history Date Status Author Reviewer Approver 13.09.2012 Final T.S. Nord
Mauri Määttänen
Document objective This document describes the data that was obtained during this project and how it was stored, so that others than the people immediately involved may use the data for their research. Acknowledgement The work described in this publication was supported by the European Community’s Seventh Framework Programme through the grant to the budget of the Integrating Activity HYDRALAB IV, Contract no. 261520.
Disclaimer This document reflects only the authors’ views and not those of the European Community. This work may rely on data from sources external to the HYDRALAB IV project Consortium. Members of the Consortium do not accept liability for loss or damage suffered by any third party as a result of errors or inaccuracies in such data. The information in this document is provided “as is” and no guarantee or warranty is given that the information is fit for any particular purpose. The user thereof uses the information at its sole risk and neither the European Community nor any member of the HYDRALAB IV Consortium is liable for any use that may be made of the information.
Contents
1 Objectives ......................................................................................................................... 4 2 Experimental setup ........................................................................................................... 5
2.1 General description .................................................................................................. 5 2.2 Definition of the coordinate system .......................................................................... 6 2.3 Relevant fixed parameters ....................................................................................... 7
3 Instrumentation and data acquisition ................................................................................ 7 3.1 Instruments ............................................................................................................... 7 3.2 Definition of time origin and instrument synchronization ......................................... 8 3.3 Measured parameters .............................................................................................. 9
4 Experimental procedure and test programme .................................................................. 9 5 Data post-processing ...................................................................................................... 12 6 Organization of data files ................................................................................................ 13 7 Remarks .......................................................................................................................... 13 A Appendices ................................................................ Fehler! Textmarke nicht definiert.
1 Objectives The physical background is not well understood for the origin of severe vibrations in offshore structures while moving ice is crushing. The objectives of the DIIV project were to excite ice-induced vibrations in a thoroughly instrumented model structure installed in the Large Ice Model Basin ARCTECLAB at HSVA. The model scale ratio target was 8 …10. The main interest is the net energy input from ice to structure during one vibration cycle. Continuous and violent natural frequency lock-in vibrations will develop if the input energy exceeds the energy consumed in various damping processes during a vibration cycle. The varied parameters were model ice thickness and strength, model structure natural modes and frequencies, and different ice crushing cylinder diameters and friction values. A novel approach was to furnish the test pile with an actuator that provided variable sinusoidal movement to the ice crushing cylinder. This technique that has been used earlier in vortex shedding vibration studies is expected to give more direct ice-structure interaction parameters data. The measurement results together with determined parameters in dynamic ice structure interaction process will be used to validate theoretical ice-structure dynamic interaction models, and thereafter for more reliable offshore structures design.
A test structure for ice-structure dynamic interaction research in scale-model tests shall be able to produce scaled but similar dynamic response to ice loads as a real full-scale structure in nature. Basically this would require the geometric similitude of the real structure. In nature winds or sea currents drive large ice fields to move while in laboratory ice is usually stationary, and the carriage pushes the structure in the ice tank. If the carriage pushes the ice and the structure is stationary there can be problems with ice sheet integrity and it will be more difficult to make changes to structural properties during testing. As the frequency lock-in vibration is the most severe dynamic loading the geometric similitude of the model structure is less important than the modal similitude. This means that natural modes of the full-scale and model-scale structures have similar shapes - especially modal amplitudes at ice action points - and have frequencies scaled according to laws of similitude. In addition to the traditional freely developing ice-induced vibrations the DIIV objectives included forced sinusoidal movement superposed to the constant ice velocity. This technique originates from vortex induced vibration testing where it has successfully predicted frequency lock-in vortex induced oscillation parameter ranges. By varying the ice velocity and forced movement frequency and amplitude allows to determine ice velocity ranges that are likely to induce frequency lock-in vibrations.

2 Experimental setup
2.1 General description The DIIV model structure, Fig. 2.1, was designed nominally to have about 1:8 … 1:10 scale ratio with modal similitude to a bottom founded generic offshore structure. The intended model ice thickness of 60 … 80 mm corresponds to 0.50 … 0.80 m thick level ice. With three different waterline cylinder diameters - 100, 220 and 400 mm - the model structure can cover a real structure diameter range from 0.8 to 4 m. The model structure support stiffness as well as tuning masses both close to waterline and at the top could be easily adjusted to alter both the natural frequencies and mode shapes. For the forced movement tests the same test pile was reconfigured. The vertical supports spacing was reduced to minimum for maximum stiffness, the upper flat spring steel was removed, a reinforcing truss was installed according to the Fig. 1.b, and the electrical actuator rod was attached directly to the pile at the height of removed upper flat spring steel. The actuator produced sinusoidal movement that caused opposite direction movement at the waterline as the main pile was rocking as a rigid body in reference to the lower attachment point ball end bearings.
Figure 2.1: a) Test structure normal set-up b) Forced movement set-up
(a) (b)
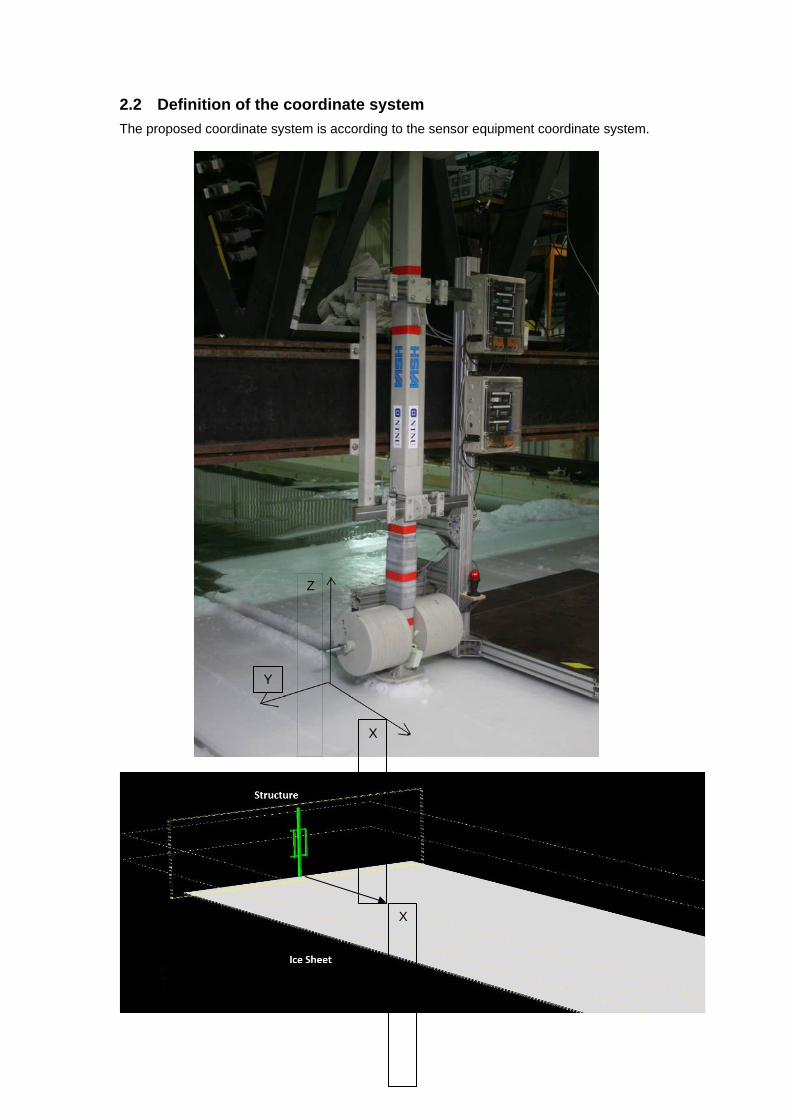
2.2 Definition of the coordinate system The proposed coordinate system is according to the sensor equipment coordinate system.
X
Y
Z
X

2.3 Relevant fixed parameters Nothing to report.
3 Instrumentation and data acquisition
3.1 Instruments - Strain gauges - LASER sensors for deflection - I-scan tactile sensors for local pressure - Accelerometers - Underwater video cameras - Video camcorder - S7 unit for main carriage speed
Figure 2. Position of instruments. Table 3.1. Instrument positions. Instrument Direction Location Reference Strain Gauge 700 x +700 Cylinder attachment
plate, Figure 2. Strain Gauge 600 x +600 Cylinder attachment
plate, Figure 2. Strain Gauge 500 y +500 Cylinder attachment
plate, Figure 2. Accelerometer x +79 Cylinder attachment
plate, Figure 2. Tactile sensor x At ice action level The laser equipment was installed on aluminium frames attached to the carriage. The distances from the connector plate on the lower flat spring steel down to the red laser dots were measured, as illustrated in Figure 3.
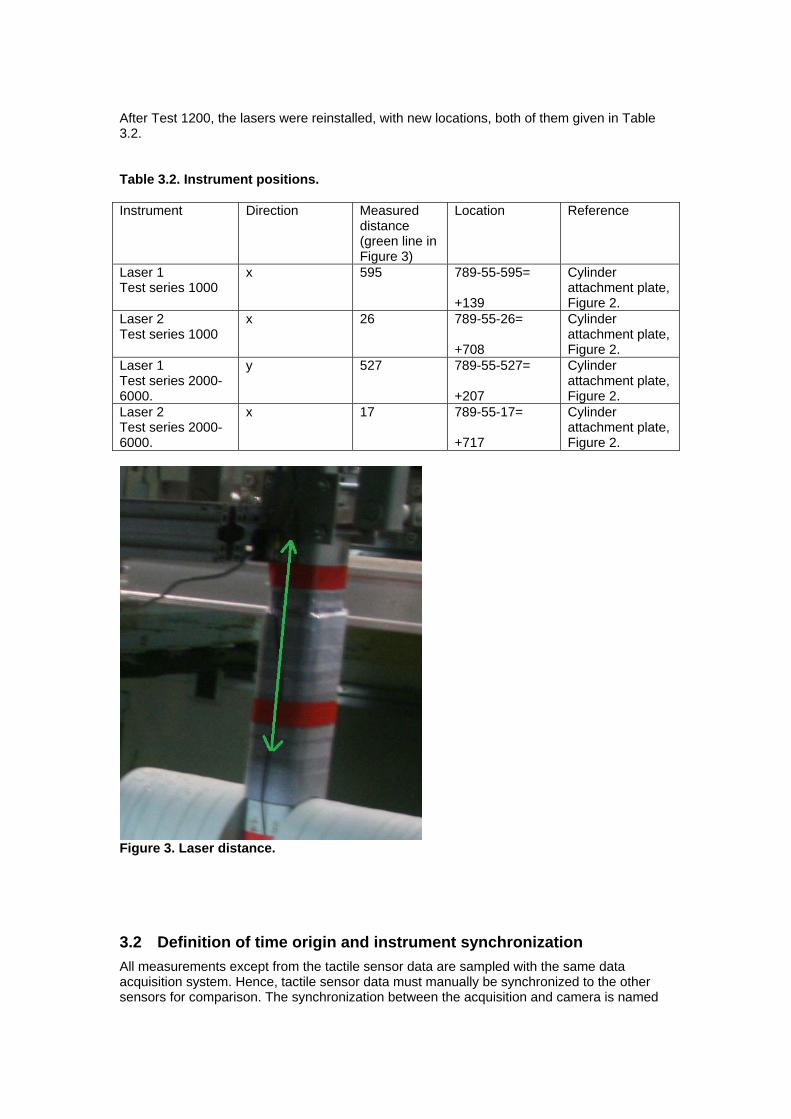
After Test 1200, the lasers were reinstalled, with new locations, both of them given in Table 3.2. Table 3.2. Instrument positions. Instrument Direction Measured
distance (green line in Figure 3)
Location Reference
Laser 1 Test series 1000
x 595 789-55-595= +139
Cylinder attachment plate, Figure 2.
Laser 2 Test series 1000
x 26 789-55-26= +708
Cylinder attachment plate, Figure 2.
Laser 1 Test series 2000- 6000.
y 527 789-55-527= +207
Cylinder attachment plate, Figure 2.
Laser 2 Test series 2000-6000.
x 17 789-55-17= +717
Cylinder attachment plate, Figure 2.
Figure 3. Laser distance.
3.2 Definition of time origin and instrument synchronization All measurements except from the tactile sensor data are sampled with the same data acquisition system. Hence, tactile sensor data must manually be synchronized to the other sensors for comparison. The synchronization between the acquisition and camera is named
sync in the .csv files from each test. More about file storage is written in chapter 6. All the data are collected with 100Hz sampling frequency.
3.2.1 Dynamic Calibration Tests All signals are measured with start and stop from the same time. Sampling frequency of 100Hz for all calibrations. The initial offset at resting position has to be subtracted manually.
3.2.2 Ice testing All signals measured with the same start and stop, except for the tactile sensor. Sampling frequency is 100Hz. Initial offset at rest position has to be subtracted manually.
3.3 Measured parameters The HSVA operators collected the following ice properties:
- ice thickness h - ice temperature T
- ice density ρice
- flexural strength σf
- uniaxial compressive strength σc - ice thin sections
Ice temperature and density measurements were performed by the NTNU members, but handed over to HSVA which collected all measurements together. A table including averaged ice properties is given in chapter 4.
4 Experimental procedure and test program The structure was fixed to the carriage while the carriage was forcing it through the ice-sheets. There were two campaigns included in the test program, the flexible structure setup and the forced vibrations setup. The data sampling starts before the structure hits the ice sheet, which is also the case for video recordings. 4 Ice sheets were tested with a flexible structure, and 2 ice sheets with forced vibration testing.
4.1 Flexible Structure setup The test setup was planned such that structural properties were gained from dynamic calibrations. A step relaxation method was chosen for this purpose, and detailed description of data processing is given in Nord and Määttänen (2012). In Table 4.1, the dynamic calibrations corresponding to the individual ice-test are given. It should be noted that dynamic calibration 3,4,5 are not completely consistent with the given test series, due to that 3 dynamic calibration files were accidentally deleted by the carriage operators. The consequence is that careful system identification is required to ensure reliable results. The ice tests were performed with different carriage velocity setups. These can be extracted from the column named vx in each test .csv- file. Ice-properties for each test-series are given in Table 4.2. These are collected at different spots in the basin and averaged. Sometimes there was one or two hours break due to change of structural configurations, and the operators decided to sample the properties according to these to provide the most accurate data as possible.

Table 4.1. Test overview.
Table 4.2. Average Ice properties.
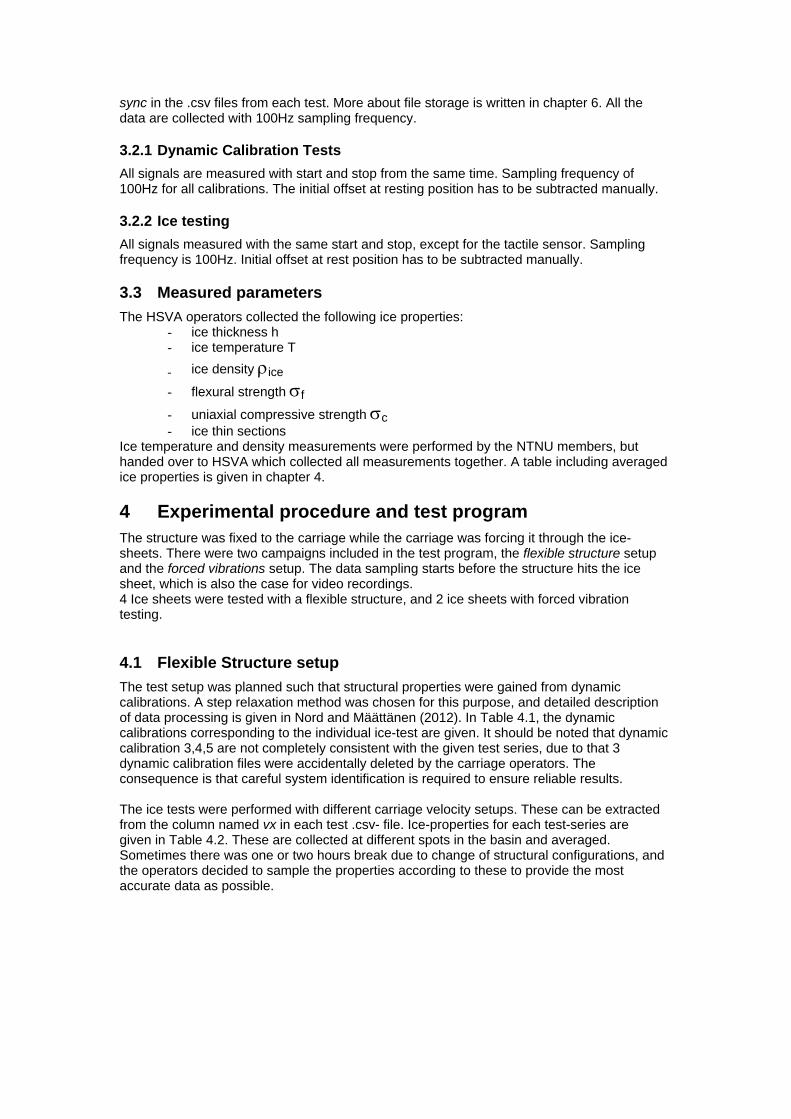
4.2 Forced vibrations setup The structural setup is shown in figure 4. Now the weights are removed, a frame mounted on the pile which is now forced with an actuator. In open water, the actuator were switched on with a certain stroke and frequency. Subsequent the carriage started to move into the ice sheet, still with the actuator active. Unfortunately the actuator could not stand the loads, which caused the actuator to slip. Because of this slip error, these data is tough to interpret. The average ice properties are given in Table 4.3. The forced vibration experiments were carried out as follows. First the structure was forced into a harmonic motion by the actuator. The amplitude and frequency of oscillations were determined based on the criterion that contact between the ice and structure is not lost (i.e. the relative velocity between the ice edge and structure at waterline is always smaller than zero). The aim was to test for different indentation velocities, amplitudes of forced oscillation and frequencies of forced oscillation. This was done in order to investigate the existence of a dimensionless variable to be used for quantification of the susceptibility range for frequency lock-in vibrations. Table 4.3. shows the different tests which were performed.
Dynamic calibration
Test Series
F1 [Hz]
F2 [Hz]
Link type
Mass [Kg] (B/T)
S [mm] (Vertical stiffener spacing)
D [mm] (Cylinder Diameter)
Date Cal
Date Test
1 - 2 1100/1200 10.41 12.99 5kN 240/240 300 220 12.Aug 16.Aug 3 1200/1200 10.31 12.9 10kN 240/240 300 220(100) 12.Aug (17.Aug)4 2000/2100 10.65 13.63 5kN 240/240 300 100(220) 18.Aug (19.Aug)5 2000/2100 10.50 13.43 10kN 240/240 300 100(220) 18.Aug (19.Aug)6 2200/2300 9.23 12.55 5kN 240/240 400 220 19.Aug 19.Aug 7 2200/2300 9.135 12.51 10kN 240/240 400 220 19.Aug 19.Aug 8 3000/3100 9.477 14.95 5kN 120/240 400 220 23.Aug 23.Aug 9 3000/3100 9.428 14.90 10kN 120/240 400 220 23.Aug 23.Aug 10 3200 7.767 13.97 10kN 120/240 500 220 23.Aug 23.Aug 11 3300/3400 10.16 15.34 10kN 120/120 500 220 23.Aug 23.Aug 12 3500/3600 10.06 15.19 10kN 120/120 500 400 23.Aug 23.Aug 13 4000-
4200 10.41 15.49 10kN 120/120 500 220 25.Aug 25.Aug
14 4300 12.16 16.17 10kN 120/120 400 220 25.Aug 25.Aug 15 5000 28 10kN 220 30.Aug 30.Aug 16 6000 28 10kN 01.Sep 01.Sep
Test Series
Ice thickness [mm]
Ice Temp. [oC]
Ice density [kg/m3 ]
Flexural strength [KPa]
Compressive strength [N/mm2]
Salinity [ppt]
Date Test
1100 72mm -1.5 843.8 126.5 0.492 3.3 16.Aug 1200 81mm -1.1 843.5 101.7 0.231 2.7 17.Aug 2000-2300 46.6mm -1.1 836.9 117.7 0.254 3.3 19.Aug 3100-3600 57.5mm -0.8 836.1 99.9 0.167 3.2 23.Aug 4100-4300 60.4mm -1.7 829.7 163.7 0.393 3.2 25.Aug

During the tests the displacement of the structure at waterline level and the loads from the ice were measured simultaneously. Measurement of the displacement was done by laser with a sampling frequency of 100 Hz. Measurement of the ice loads was done by tactile sensor also with a sampling frequency of 100 Hz. Unfortunately the synchronization in time between both measurement devices was lost during the time the tests were performed. The tactile sensor output is named with four digits as for example: 6214.fsx The first digit concerns the test series which can be either 5 or 6 (5000 and 6000 series. The second digit gives the range of velocities which were considered: 1 – V = 40 mm/s up to 100 mm/s with intervals of 10 mm/s 2 – V = 20 mm/s up to 50 mm/s with intervals of 10 mm/s 3 – V = 50 mm/s 4 – V = 70 mm/s The third digit gives the test number in the above velocity range and the fourth digit the amplitude of forced vibration: 1 – 11mm 2 – 22 mm 3 – 44 mm 4 – 66 mm File 6214.fsx therefore belongs to test day 6, the 6000 series, with a indentation velocity of 20 mm/s and an amplitude of oscillations of 66 mm. Numbering of the laser measurements which were done through the carriage computer is done as follows: HYD-IV_6041.csv The number 6041 shows the test series (first digit) followed by a zero or a one which stands for first attempt or second attempt during the day. Followed by an indicator for the velocity of indentation (third digit multiplied by 10 mm/s). The fourth digit is used to indicate if a test was repeated after failure where 0 stands for no repeat necessary and 1 for a repeat was executed. The obtained displacement and force signals are used to identify added mass and added damping properties of the ice interaction with a flexible structure. Table 4.3. Test matrix showing amplitude of vibration at ice action point, velocity of indentation and frequency of vibration for which the tests were carried out. Frequencies indicated with a * correspond to tests which were performed twice.
forcedA [mm]: 11 22 44 66
V [mm/s]: forcedf [Hz]: forcedf [Hz]: forcedf [Hz]: forcedf [Hz]:
10 0.145 20 0.289 0.145 0.072 0.048 30 0.434 0.217 0.109 0.072 40 0.579* 0.289* 0.145* 0.096* 50 0.723* 0.362* 0.181* 0.121* 60 0.868 0.434 0.217 0.145 70 1.013* 0.506* 0.253* 0.169 80 1.157 0.579 0.289 0.193 90 1.302 0.651 0.326 0.217 100 1.447 0.723 0.362 0.241
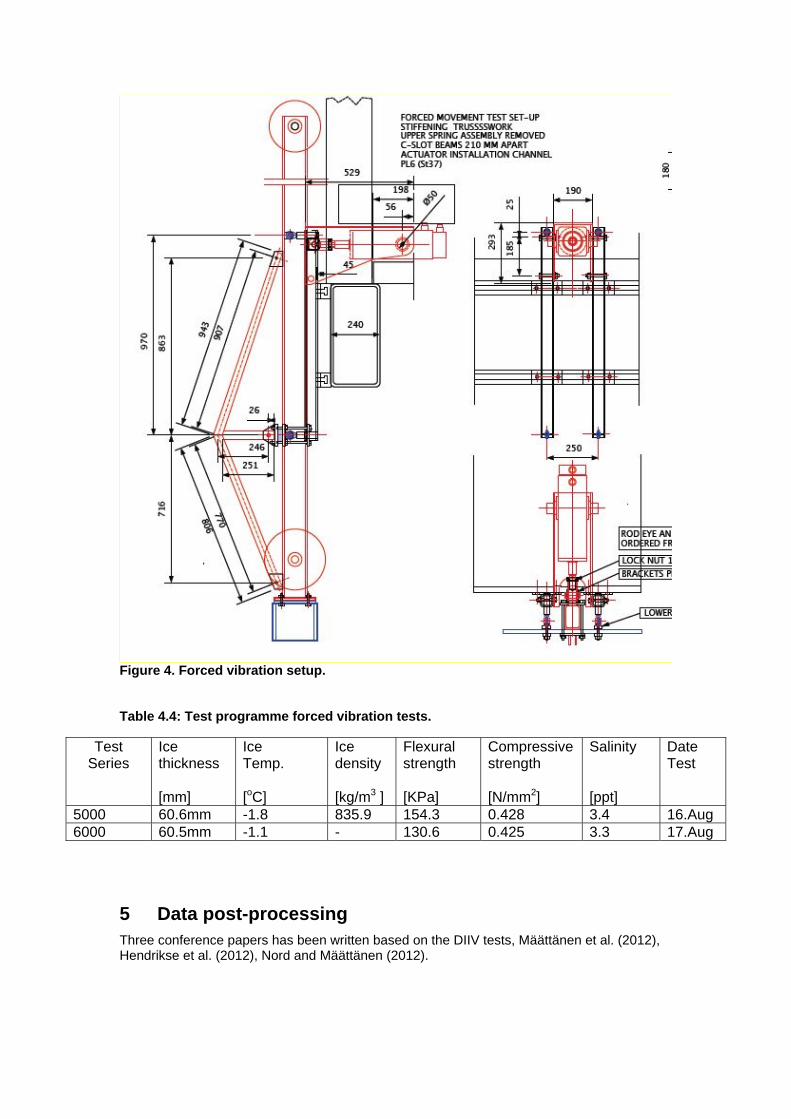
Figure 4. Forced vibration setup. Table 4.4: Test programme forced vibration tests.
5 Data post-processing Three conference papers has been written based on the DIIV tests, Määttänen et al. (2012), Hendrikse et al. (2012), Nord and Määttänen (2012).
Test Series
Ice thickness [mm]
Ice Temp. [oC]
Ice density [kg/m3 ]
Flexural strength [KPa]
Compressive strength [N/mm2]
Salinity [ppt]
Date Test
5000 60.6mm -1.8 835.9 154.3 0.428 3.4 16.Aug 6000 60.5mm -1.1 - 130.6 0.425 3.3 17.Aug

6 Organization of data files The collected data are given in .csv format, suitable for both Excel and Matlab. Each file has the name of each test series, e.g. HYD-IV_2100 is the data corresponding to test 2100. Similarly the dynamic calibrations are named: dynamic_calibration_002. All measured quantities are stored as vectors. Post-processing of tactile sensor data requires the I-SCAN software. Table 6.1. CSV file heading description. Zeit Time Direction Shear 500 Strain gauge shear X Bending 600 Strain gauge
bending Y
Bending 700 Strain gauge bending
X
Laser_01 Laser 1 X Laser_02 Laser 2 X Acc Accelerometer X Sync Video
Syncronization -
sx Carriage position X vx Carriage velocity X F Force X
7 Remarks - Daily reports are prepared - Publications M. Määttänen, S. Løset, A. Metrikine, K.-U. Evers, H. Hendrikse, C. Lønøy, I. Metrikin, T. Skjerve Nord and S. Sukhorukov. (2012). Novel ice induced vibration testing in a large-scale facility: Deciphering Ice Induced Vibrations, Part 1 Proceedings 21st IAHR International Symposium on Ice “Ice Research for a Sustainable Environment”, Dalian, China, June 11 to 15, 2012 T. Skjerve Nord and M. Määttänen (2012). Modal analysis in ice-structure interaction : Deciphering Ice Induced Vibrations, Part 2 Proceedings 21st IAHR International Symposium on Ice “Ice Research for a Sustainable Environment”, Dalian, China, June 11 to 15, 2012 H. Hendrikse, A. Metrikine and K.-U. Evers (2012). A method to measure the added mass and added damping in dynamic ice-structure interaction: Deciphering Ice Induced Vibrations, Part 3 Proceedings 21st IAHR International Symposium on Ice “Ice Research for a Sustainable Environment”, Dalian, China, June 11 to 15, 2012 Hendrikse, H., Metrikine, A. and Evers, K.-U., 2012. A method to measure the added mass and added damping in dynamic ice-structure interaction:, Proceedings 21st IAHR International Symposium on Ice “Ice Research for a Sustainable Environment”, Dalian, China, June 11 to 15, 2012
Määttänen, M., Løset, S., Metrikine, A., Evers, K.-U., Hendrikse, H., Lønøy, C., Metrikin, I., Nord, T.S. and Sukhorukov, S., 2012. Novel ice induced vibration testing in a large-scale facility, Proceedings 21st IAHR International Symposium on Ice “Ice Research for a Sustainable Environment”, Dalian, China, June 11 to 15, 2012 Nord, T.S., Lourens, E.-M., Øiseth, O. and Metrikine, A., 2014a. Model-based force identification in experimental ice-structure interaction by means of Kalman filtering, EURODYN, Porto, Portugal. Nord, T.S. and Määttänen, M., 2012. Modal analysis in ice structure interaction, 21st International Symposium on Ice, IAHR, Dalian, China. Nord, T.S., Määttänen, M. and Øiseth, O., 2013. Frequency domain force identification in ice-structure interaction, Port and Ocean Engineering under Arctic Conditions, Espoo, Finland.
Nord, T.S., Lourens, E., Metrikine, A. and Øiseth, O., 2014b. Model-based force and state estimation in experimental ice-induced vibrations by means of Kalman filtering. submitted to Cold Regions Science and Technology. Määttänen M., Hendrikse H. and Nord T. (2014) Deciphering of Ice Induced Vibrations, Proceedings of the HYDRALAB IV Joint User Meeting, Lisbon.