data preparation in energy-economy-agriculture models · petrochemical industry gas works 3.9 0.7...
TRANSCRIPT

Data Preparation in Energy-Economy-Agriculture Models
Ron SandsJoint Global Change Research Institute
Battelle – PNNL – University of Maryland
AIM Training Workshop 2006
Tsukuba, Japan18 October 2006
Data Preparation in Energy-Economy-Agriculture Models
Ron SandsJoint Global Change Research Institute
Battelle – PNNL – University of Maryland
AIM Training Workshop 2006
Tsukuba, Japan18 October 2006

2
Introduction (1)Introduction (1)
Top-down economic modeling for environmental policy analysis requires several types of data
Input-output tablesNational income accountsEnergy balancesEnergy technology characteristicsAgriculture and land use is increasingly important for questionsrelated to climate policy
Data collection effort depends on questions to be askedExpand detail in sectors of interest and collapse detail in other areasFor some questions, especially on a global scale, level of detail provided by GTAP may be sufficientFor single-country studies, especially those focused on specific energy sectors, you may want to collect and process local data

3
Introduction (2)Introduction (2)Importance of physical flows
EnergyDemand for secondary fuelsEfficiency of transformation from primary to secondary fuelsImplied demand for primary fuels and resulting emissions
Agricultural productsDemand for food in caloriesEfficiency of transformation from primary agriculture to animal productsImplied demand for land
Coverage of all major classes of greenhouse gas mitigation options
Energy efficiencyFuel switchingCO2 capture and storage (CCS)Non-CO2 greenhouse gasesLand management, biofuels, carbon emissions from land use change

4
Energy-Economy DataEnergy-Economy Data
Input-output tablesEach row is an input to productionEach column is a production activity or final demand activity (consumption, investment, international trade)Can be constructed in either quantity or value terms
National income accountsIncome must equal expenditure for various accounts: producers, consumers, investment, tradeCan be expressed in a matrix where row sums equal column sums
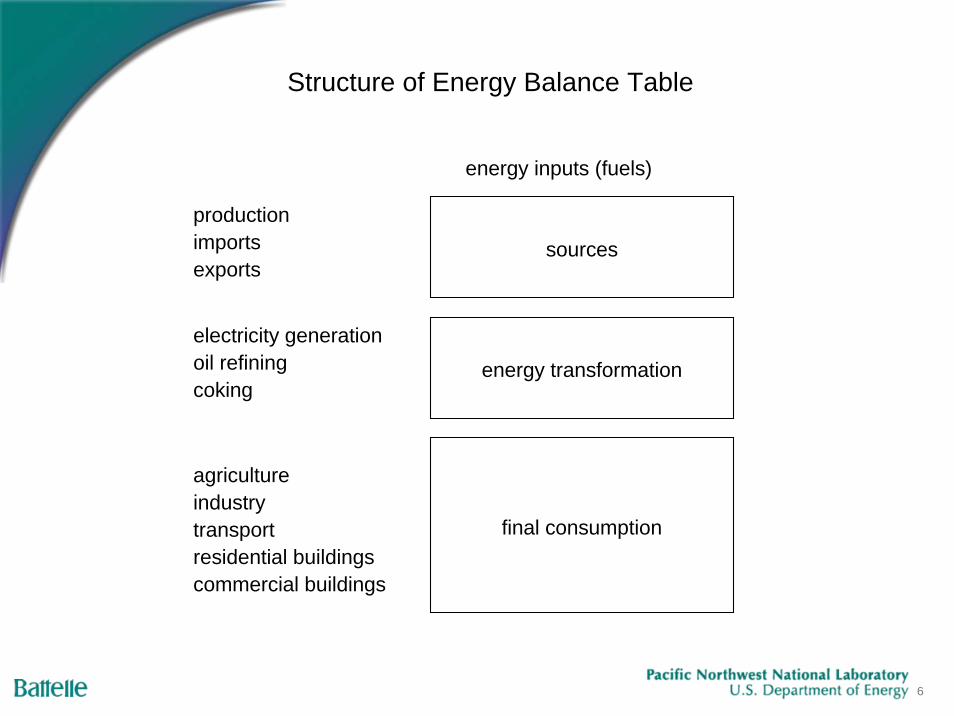
Energy balancesEssentially an input-output table for energyExpressed in energy quantities
Energy technology characteristicsEfficiency in physical termsLevelized cost to produce one unit of output (e.g., kWh)

5
Commodities CM
aker
s of
com
mod
ity j
Tota
l out
put o
f com
mod
ity i
I G X M
-------------------------Makers of commodities--------------------------------Final demand---------
----
----
----
----
----
----
----
----
---
----
----
----
----
----
----
----
----
---
Ammount of commodity i used by used by makers
of commodity j
<---
----
----
--
Value added
----
--
IBT
C
Value added sold directly to final demand
Mak
ers
of c
omm
odity
j
Commodity i
Total cost for makers of commodity j National Accounts
Tota
l out
put o
f com
mod
ity i
Tot.
val.
add.
I G X M
K
L
----
----
----
----
----
----
----
----
---
<---
----
Structure of Input-Output Table
6
energy inputs (fuels)
productionimportsexports
electricity generationoil refiningcoking
agricultureindustrytransportresidential buildingscommercial buildings
sources
energy transformation
final consumption
Structure of Energy Balance Table

7
singleParameter unit oil cycle NGCC PC IGCC nuclear hydro wind
Operating in model base year? yes yes no yes no yes yes no
Economic assumptionsfuel price $/GJ 4.19 2.26 2.26 0.97 0.97interest rate percent 10% 10% 10% 10% 10% 10% 10% 10%
Capital costpurchase cost of capital $/kW 500 500 800 1,150 1,401 1,000 1,000 1,200plant factor percent 20% 40% 75% 75% 75% 75% 75% 20%capital lifetime years 20 20 20 20 20 20 20 20interest plus depreciation percent 11.7% 11.7% 11.7% 11.7% 11.7% 11.7% 11.7% 11.7%levelized capital cost mills/kWh 33.5 16.8 14.3 20.6 25.0 17.9 17.9 80.5
Fuel costefficiency percent 32% 36% 50% 32% 41%fuel cost per kWh mills/kWh 47.6 22.9 16.4 10.8 8.6
Operations and maintenance cost mills/kWh 2.5 2.5 7.4 7.4 7.4 15.0 5.0 7.4
Levelized cost per kWh (total) mills/kWh 83.6 42.1 38.1 38.7 41.0 32.9 22.9 87.9
CCS operational in base year? no no nocapture efficiency percent 90% 90% 90%CO2 captured kg-CO2/kWh 0.328 0.728 0.711capital cost $/kg-CO2/h 921 521 305O & M cost mills/kg-CO2 5.20 5.56 2.65energy required kWh/kg-CO2 0.354 0.317 0.194
natural gas renewablescoal
Engineering cost assumptions for electricity generation technologies in SGM-USA (1990 US$)

8
NGCC
IGCC
NGCC captureand disposal
IGCC captureand disposal
0
20
40
60
80
100
120
140
160
0 50 100 150 200 250 300 350 400
carbon price (2000 US$ per tC)
leve
lized
cos
t (m
ills
per k
Wh)
Levelized Cost of Electricity as a Function of Carbon Price

9
Social Accounting Matrix (SAM)as an Organizing Tool
Social Accounting Matrix (SAM)as an Organizing Tool
Matrix structure to hold all benchmark (base-year) dataThree major components
National income accounts (condensed SAM)Use table (commodity x activity)Make table (activity x commodity)
Economic models usually have single-output production functionsMatrix algebra can be used to transform use and make tables so that each activity produces only one commodity

10
Condensed Social Accounting Matrix (1990 USA)
activities commodities primary factors enterprises households government capital rest of worldactivities GROSS_OUTPUT
9,790,599 9,790,599commodities INTERMEDIATE_INPUTS PCONS GCONS INVEST EXPORTS
4,269,660 3,760,223 847,785 960,864 543,179 10,381,711primary factors VALUE_ADDED
5,520,940 5,520,940enterprises OVA
1,823,076 1,823,076households LABOR DIVIDENDS GTR
3,248,246 1,068,577 808,000 5,124,823government IBT CIT PIT+SSTAX
449,618 140,500 1,143,300 1,733,418capital RE PSAV GSAV NET_BORROWING
613,999 221,300 77,633 47,933 960,865rest of world IMPORTS
591,112 591,112
9,790,600 10,381,711 5,520,940 1,823,076 5,124,823 1,733,418 960,864 591,112
Note: numbers in blue are derived directly from an input-output table

11
Use and Make TablesUse and Make Tables
An input-output table is constructed from a use (input) table and a make (output) table
Some statistical agencies provide the original use and make tablesSome agencies provide only the combined input-output table
Use tableLooks like an input-output tableBut there may be more than one production activity for some products (e.g., several ways to generate electricity)
Make tableEach row is a production activityEach column is a product or commodity

12
Gases fromNatural Coal Refined
Crude Oil Gas Coal Coke Transform.Petroleum Electricity HeatOil and Gas Extraction 160.7 21.4Coal Mining 713.6Coke Ovens 90.3 11.7Blast Furnaces 13.7Petroleum Refineries 164.5Petrochemical IndustryGas Works 3.9 0.7Public Electricity Plants 95.8Autoproducer Electricity Plants 1.7Heat Plants 28.1CHP Plants
Production by Fuel 160.7 25.3 713.6 91.0 25.4 164.5 97.6 28.1
1997 energy make table for China (mtoe)

13
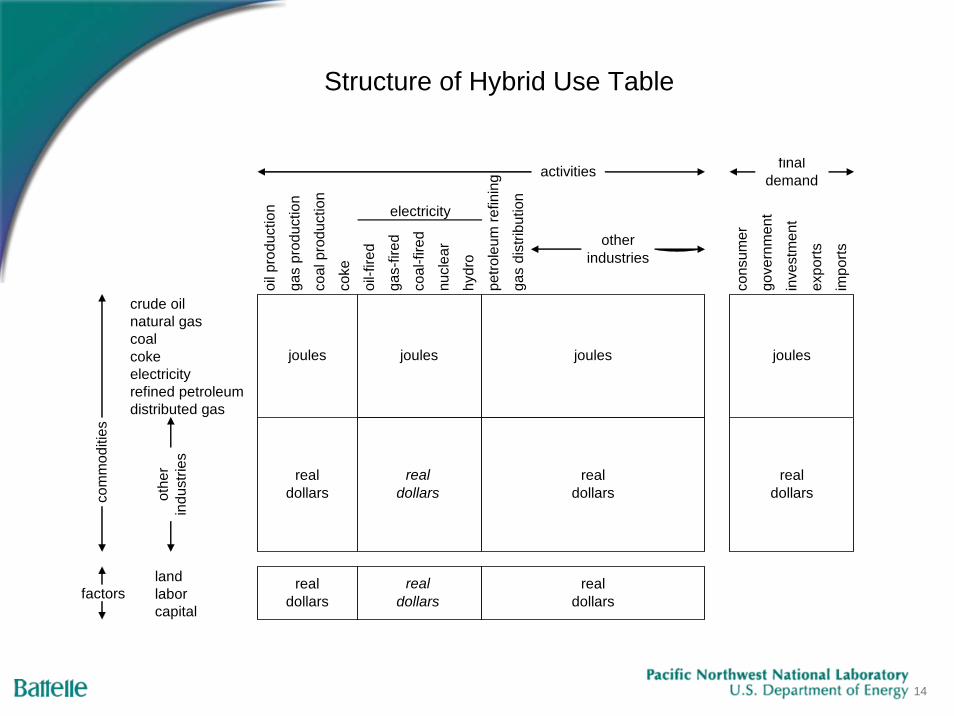
Hybrid Use TableHybrid Use Table
Combines economic input-output data, energy balances, and energy technology characteristics into one tableSequence of calculations (used in SGM model)
Aggregate economic use and make tables to desired level of detailConstruct energy use and make tables from energy balance tablesCheck that energy technology data is consistent with energy balancesReplace energy rows of economic use table with corresponding data from energy balances (hybrid use table)Re-balance hybrid table in value terms so that row sums match column sumsInsert energy technology data
14
crude oilnatural gascoalcokeelectricityrefined petroleumdistributed gas
landlaborcapital
electricity
factors
joules
realdollars
joules
realdollars
realdollars
realdollars
realdollars
realdollars
realdollars
joules joules
oil p
rodu
ctio
n
gas
prod
uctio
n
coal
pro
duct
ion
coke
activities
oil-f
ired
gas-
fired
coal
-fire
d
nucl
ear
hydr
o
com
mod
ities
cons
umer
gove
rnm
ent
inve
stm
ent
expo
rts
impo
rts
finaldemand
othe
rin
dust
ries
otherindustries
petro
leum
refin
ing
gas
dist
ribut
ion
Structure of Hybrid Use Table

15
crude steel
crude oilnatural gascoalcokeelectricitydistributed elec.refined petroleumdistributed gascrude steelshaped steel
othercommodities
landlaborcapital
electricity
factors
joules
realcurrency
joules
realcurrency
realcurrency
realcurrency
realcurrency
realcurrency
realcurrency
joules joules
oil p
rodu
ctio
n
gas
prod
uctio
n
coal
pro
duct
ion
coke
activities
oil-f
ired
gas-
fired
coal
-fire
d
nucl
ear
hydr
o
com
mod
ities
cons
umer
gove
rnm
ent
inve
stm
ent
expo
rts
impo
rts
finaldemand
petro
leum
refin
ing
gas
dist
ribut
ion
BOF
shap
ed s
teel
EAF
DR
P
tons tons tons
otheractivities
tons
elec
. dis
tribu
tion
Hybrid Use Table with Steel Technologies

16
Documentation for Second Generation Model
Documentation for Second Generation Model
http://www.epa.gov/air/sgm-sab.html
SGM documentation can be found at:
The Second Generation Model: Model Description and Theory, PNNL-15432 (PDF, 51 pp, 1566 KB)
The Second Generation Model: Data, Parameters, and Implementation, PNNL-15431 (PDF, 39 pp, 356 KB)
The Second Generation Model: Future Directions for Model Development, PNNL-15437 (PDF, 10 pp, 126 KB)

17
Agriculture-Forestry DataAgriculture-Forestry Data
Agriculture-Forestry DataFood balancesLand use dataForest production
Following slides provide a brief introduction to this data at a global levelUnited Nations Food and Agriculture Organization (FAO) is the primary source of dataTop-down general equilibrium models are being extended to include agriculture and forestry
18
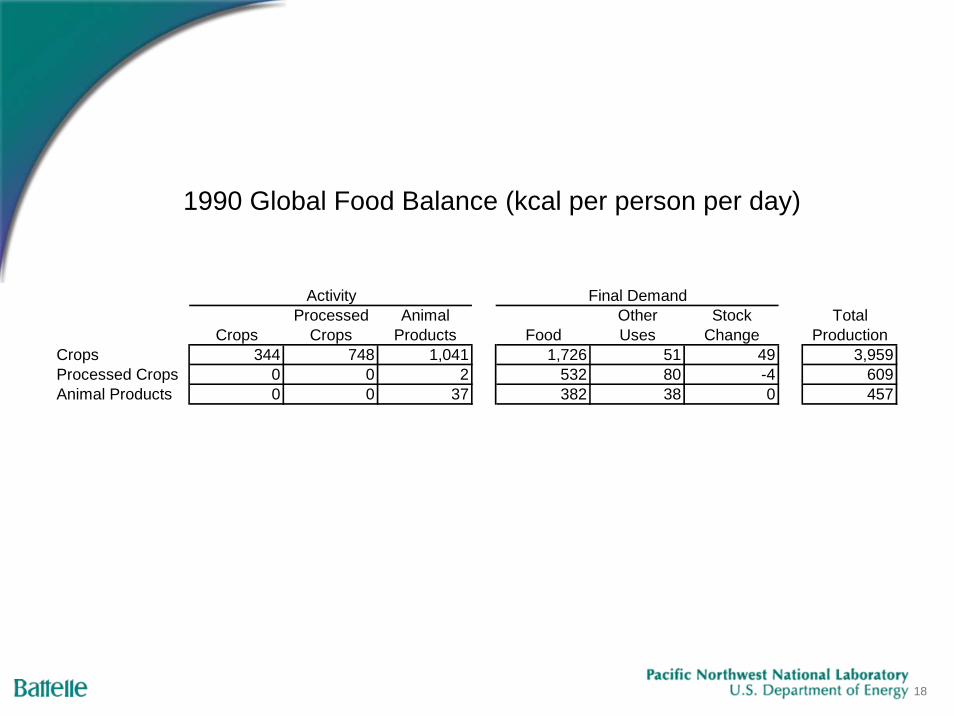
Processed Animal Other Stock TotalCrops Crops Products Food Uses Change Production
Crops 344 748 1,041 1,726 51 49 3,959Processed Crops 0 0 2 532 80 -4 609Animal Products 0 0 37 382 38 0 457
Final DemandActivity
1990 Global Food Balance (kcal per person per day)
19
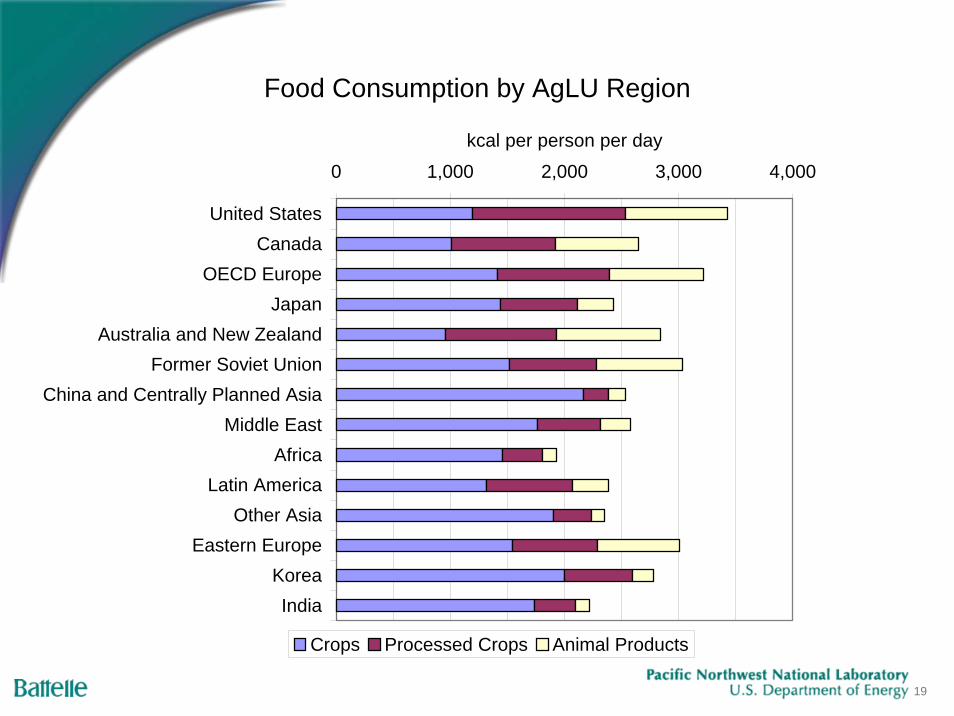
Food Consumption by AgLU Region
0 1,000 2,000 3,000 4,000
United StatesCanada
OECD EuropeJapan
Australia and New ZealandFormer Soviet Union
China and Centrally Planned AsiaMiddle East
AfricaLatin America
Other AsiaEastern Europe
KoreaIndia
kcal per person per day
Crops Processed Crops Animal Products

20
Land Use (without carbon policy)
Crop Land
Pasture
Managed Forest
Unmanaged
0
1
2
3
4
5
6
7
8
9
10
1990 2005 2020 2035 2050 2065 2080 2095
billio
n he
ctar
es

21
SummarySummary
Benchmark data sets for top-down general equilibrium models can be represented as social accounting matrices (SAMs)The SAM structure is flexible so that detail can be expanded in areas of interest and collapsed elsewhereBottom-up energy technology information can be placed in a SAM to represent interaction with the rest of the economyModelers are working to include agricultural and forestry production in general equilibrium models
Important for analysis of climate policyGHG emissions from agricultureCO2 sequestration in forests and soilsClimate impacts on agriculture and forest productionPotential for biofuels
GTAP effortEnergy Modeling Forum (EMF-22) land use subgroup