data on natural organic substances in dissolved, … and -clay, and bed-sediment phases in the...
TRANSCRIPT
Data on Natural Organic Substances in Dissolved, Colloidal, Suspended-Silt and -Clay, and Bed-Sediment Phases in the Mississippi River and some of its Tributaries, 1987-90
by J.A. Leenheer, T.I. Noyes, and P.A. Brown
U.S. GEOLOGICAL SURVEY
Water-Resources Investigations Report 93-4204
Denver, Colorado 1995
U.S. DEPARTMENT OF THE INTERIOR
BRUCE BABBITT, Secretary
U.S. GEOLOGICAL SURVEY
Gordon P. Eaton, Director
The use of trade, product, industry, or firm names is for descriptive purposes only and does not imply endorsement by the U.S. Government.
For additional information write to: Copies of this report can be purchased from:
Chief, Branch of Regional Research U.S. Geological SurveyU.S. Geological Survey Earth Science Information CenterBox 25046, MS 418 Open-File Reports SectionDenver Federal Center Box 25286, MS 517Denver, CO 80225 Denver Federal Center
Denver, CO 80225
CONTENTSPage
Abstract 1Introduction 1Acknowledgments 2Sampling cruise 1, July-August 1987 3
Objectives and approach 3Dissolved organic matter 3Organic matter in suspended-sediment fractions 10
Sampling cruise 2, November-December 1987 13Objectives and approach 13Dissolved organic matter 13Organic matter on suspended-sediment fractions 17
Sampling cruise 3, May-June 1988 22Objectives and approach 22Dissolved organic matter 23Organic matter in suspended-sediment fractions 29
Sampling cruise 4, March-April 1989 34Objectives and approach 34Dissolved organic matter 34Organic matter in suspended-sediment fractions 37
Sampling cruise 5, June 1989 44Objectives and approach 44Dissolved organic matter 44Organic matter in suspended-sediment fractions 48
Sampling cruise 6, February-March 1990 54Objectives and approach 54Dissolved organic carbon 54Organic matter in suspended-sediment fractions 55
Sampling cruise 7, May-June 1990 63Approach and objectives 63Dissolved organic carbon 63Organic matter in suspended and bed sediments 64
Conclusions 69- 70
FIGURES1. Sampling locations on the Mississippi River and some of its tributaries 42. 1H-nuclear magnetic resonance spectra of dissolved humic substances in samples
from (A) the Mississippi River near St. Francisville, La., and (B) Ohio River at Olmsted, 111., sampled July-August 1987 8
3. 13C-nuclear magnetic resonance spectrum of dissolved humic substances isolatedfrom the Mississippi River near St. Francisville, La., sampled July-August 1987 9
4. Infrared spectrum of dissolved humic substances isolated from the Mississippi Riverat St. Louis, Mo., sampled July-August 1987 10
CONTENTS Hi
FIGURES (Continued)
5. Solid-state 13C-nuclear magnetic resonance spectra of colloids isolated from the: (A) Arkansas River at Mile 55.9, (B) Mississippi River below Vicksburg, Miss., and (C) Mississippi River at St. Louis, Mo., sampled July-August 1987 12
6. Flow chart of procedures for water and suspended-sediment sampling,sampling cruise 2, November-December 1987 14
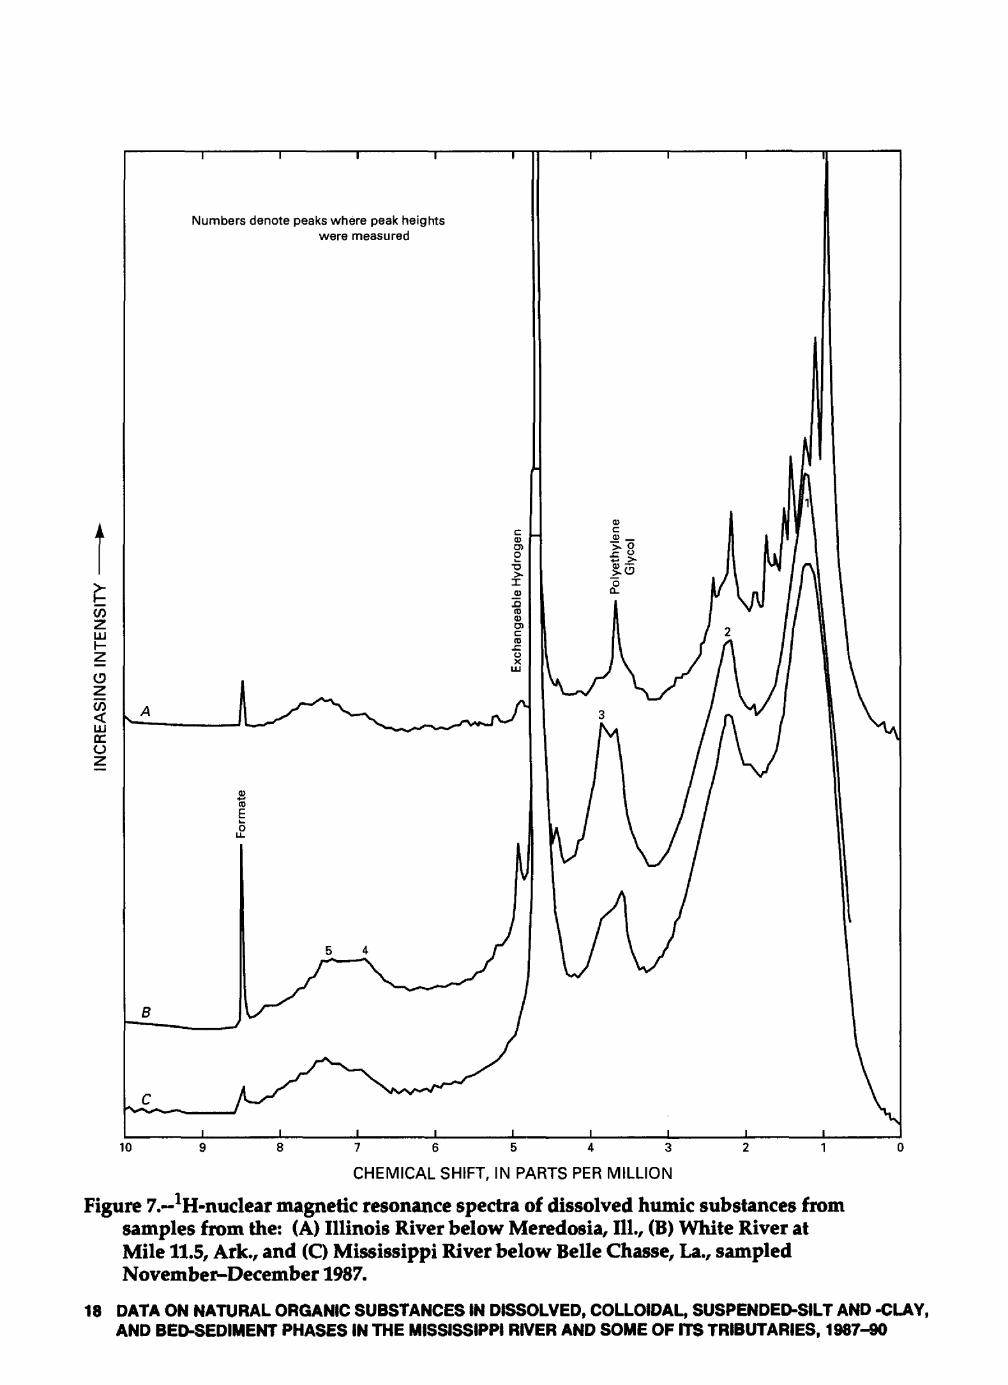
7. 1H-nuclear magnetic resonance spectra of dissolved humic substances from samples from the (A) Illinois River below Meredosia, 111., (B) White River at Mile 11.5, Ark., and (C) Mississippi River below Belle Chasse, La. 18
8. 1H-nuclear magnetic resonance spectra of (A) dissolved humic substances and (B) dissolved hydrophilic substances from the Mississippi River near St. Francisville, La., June 1988 26
9. Infrared spectra of (A) dissolved humic substances and (B) dissolvedhydrophilic substances from the Mississippi River near St. Francisville, La., and (C) infrared spectrum of organic colloids from the Mississippi River at Fulton, Term., June 1988 27
10. Scanning electron micrograph of organic colloids isolated from theMississippi River at Thebes, ID., May 1988 28
11-13. 1H-nuclear magnetic resonance spectra of dissolved humic substances from the:11. (A) Mississippi River at Thebes, 111., (B) Ohio River at Olmsted, 111.,and (C) Mississippi River below Hickman, Ky., sampled March 1989 3612. (A) White River at Mile 11.5, Ark., (B) Yazoo River below Steele Bayou,Miss., and (C) Mississippi River below Belle Chasse, La., sampledMarch-April 1989 3813. (A) Illinois River at Hardin, 111., (B) Arkansas River at Pendleton, Ark.,and (C) Mississippi River below Belle Chasse, La., sampled June 1989 46
14. H-nuclear magnetic resonance spectra of dissolved hydrophilic substances from the:(A) Illinois River at Hardin, 111., (B) Arkansas River at Pendleton, Ark.,and (C) Mississippi River below Belle Chasse, La., sampled June 1989 47
15. Infrared spectra of organic substances extracted from suspended silt and clay from the Mississippi River at Helena, Ark. Spectrum A is from methylisobutyl ketone extraction; spectrum B is from acid pyrophosphate extraction; spectrum C is from acid dimethylsulfoxide extraction; spectrum D is the organic residue after destroying the inorganic substances with a mixture of hydrochloric and hydrofluoric acids 53
16. 1H-nuclear magnetic resonance spectra of methylisobutyl ketone extracts ofsuspended silt and clay sampled from the: (A) Mississippi River near Cache, 111.,and from (B) Wabash River near New Haven, 111., sampled February-March 1990 62
17. Flow chart of procedures used to prepare sediment samples for solid-state13 C-nuclear magnetic resonance spectral analysis 66
18. Solid-state 13C-nuclear magnetic resonance spectra of (A) untreated and(B) treated for iron removal of suspended silt and clay sampled from the
Mississippi River at St. Louis, Mo., in June 1990 68
iv
TABLES
1. Dissolved organic-carbon concentrations and transport for sampling cruise 1, July-August 1987
2. Acidity, isotopic, molecular-weight, and yield data of dissolved humic substances in the Mississippi River, July-August, 1987
3. Elemental analyses of dissolved humic substances isolated from water samplescollected during sampling cruise 1, July-August 1987 7
4. Organic-carbon and nitrogen transport on the silt and clay and colloid fractionsfor sampling cruise 1, July-August 1987 11
5. Dissolved organic-carbon concentrations and transport for sampling cruise 2,November-December 1987 15
6. Acidity, molecular-weight, and yield data of dissolved humic substances in theMississippi River sampled November-December 1987 16
7. Elemental analyses of dissolved humic substances isolated from water samplescollected during sampling cruise 2, November-December 1987 17
8. Organic-carbon and nitrogen contents of silt and clay and colloid fractions ofsuspended sediment from sampling cruise 2, November-December 1987 19
9. Organic-carbon and nitrogen transport on the silt and clay and colloid fractionsfor sampling cruise 2, November-December 1987 20
10. Concentrations of particulate organic carbon for sampling cruise 2,November-December 1987 21
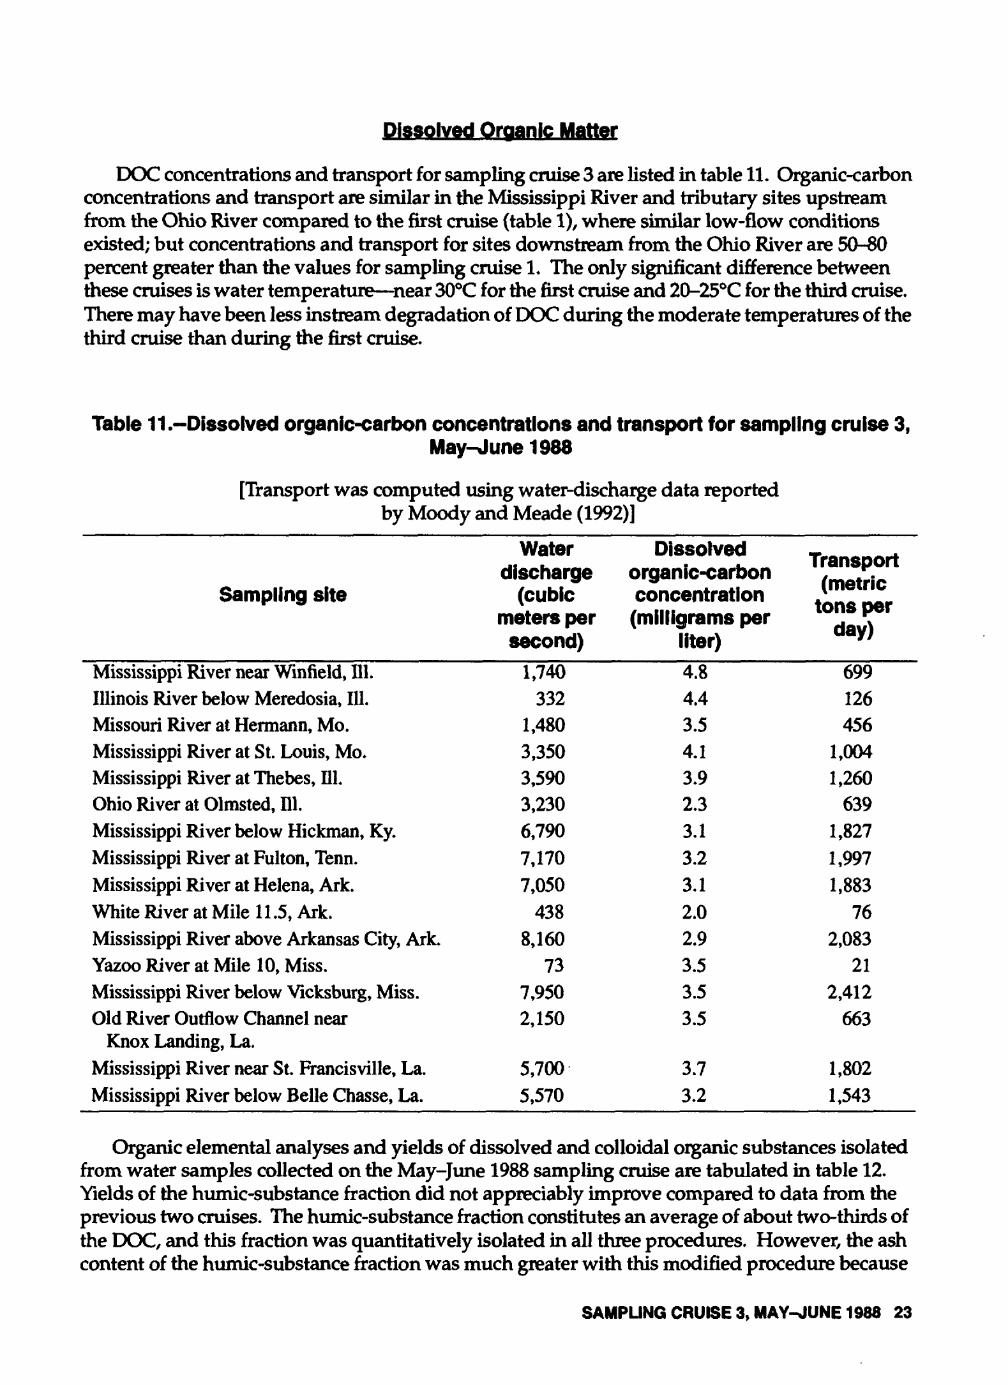
11. Dissolved organic-carbon concentrations and transport for sampling cruise 3,May-June 1988 23
12. Elemental analyses of dissolved and colloidal organic substances isolated fromwater samples collected during sampling cruise 3, May-June 1988 24
13. Relative percentages1 of silt and clay, mineral colloids, and organic colloids in theMississippi River and some of its tributaries for the May-June 1988 sampling cruise 29
14. Organic-carbon and nitrogen contents of silt and clay, mineral-colloid, and organic-colloid fractions of suspended sediment from sampling cruise 3, May-June 1988 -30
15. Organic-carbon and nitrogen transport on silt and clay, and colloid fractionsof suspended sediment from sampling cruise 3, May-June, 1988
16. Concentrations of colloidal organic carbon for sampling cruise 3, May-June 198817. Dissolved organic-carbon concentrations and transport for sampling cruise 4,
March-April 1989 - - 3518. Relative percentages of silt and clay, mineral colloids, and organic colloids in
the Mississippi River and some of its tributaries for the March-April 1988 sampling cruise 39
19. Organic-carbon content, nitrogen content, and atomic C:N ratio of silt and clay, and mineral-colloid fractions of suspended sediment from sampling cruise 4, March-April 1989 40
20. Organic-carbon and nitrogen transport of silt and clay, and colloid fractions ofsuspended sediment from sampling cruise 4, March-April 1989 42
21. Concentrations of colloidal organic carbon for sampling cruise 4,March-April 1989 43
22. Dissolved organic-carbon concentrations and transport for sampling cruise 5,June 1989 45
23. Relative percentages of silt and clay, mineral colloids, and organic colloids in theMississippi River and some of its tributaries for the June 1989 sampling cruise 48
CONTENTS v
TABLES (Continued)
24. Organic-carbon content, nitrogen content, and atomic C:N ratio of silt and clay, mineral-colloid, and organic-colloid fractions of suspended sediment from sampling cruise 5, June 1989. Fluorine content of silt and clay fraction also is included 50
25. Organic-carbon and nitrogen transport of silt and clay, and colloid fractions ofsuspended sediment from sampling cruise 5, June 1989 51
26. Concentrations of silt and clay, and colloidal organic carbon for sampling cruise 5,June 1989 52
27. Dissolved organic-carbon concentrations and transport for sampling cruise 6,February-March 1990 55
28. Recovery study of suspended-sediment fractions from the Ohio, Mississippi, andTennessee Rivers during sampling cruise 6, February-March 1990 56
29. Recovery percentages of silt and clay, mineral colloids, and organic colloids in the Cumberland, Ohio, Mississippi, Tennessee, and Wabash Rivers during sampling cruise 6, February-March 1990 58
30. Organic-carbon and nitrogen percentages of the suspended-silt and-clay fractionfrom sampling cruise 6, February-March 1990 59
31. Transport of silt and clay organic carbon and nitrogen and silt and clayorganic-carbon concentrations from sampling cruise 6, February-March, 1990 r60
32. Relations between methylisobutyl ketone (MIBK) extract yields and organic carbon and nitrogen on suspended silt and clay from sampling cruise 6, February-March 1990 60
33. Dissolved organic-carbon concentrations and transport for sampling cruise 7,May-June 1990 64
34. Composition, concentrations, and transport of carbon and nitrogen in thesuspended-silt and -clay fractions for sampling cruise 7, May-June 1990 65
35. Effect of selective mineral dissolution treatments on suspended silts and claysand bottom muds on organic matter recoveries and composition 67
vi
CONVERSION FACTORS AND RELATED INFORMATION
Multiply By To obtain
liter (L) 1.2642 gallon
micrometer (\im) 0.00003937 inch
metric ton per day 1.102 short ton
centimeter (cm) 0.3937 inch
cubic meter per second (m3/s) 35.31 cubic foot per second
microsiemen per centimeter at 1.000 micromho per centimeter
25 degrees Celsius (uS/cm) at 25 degrees Celsius
Degree Celsius may be converted to degree Fahrenheit by using the following equation:
°F = 9/5(°C)+32
The following terms also are used in this report:
milligrams per liter (mg/L)
millimoles per gram
dalton
parts per million (ppm)
CONTENTS vii
DATA ON NATURAL ORGANIC SUBSTANCES IN DISSOLVED,COLLOIDAL, SUSPENDED-SILT AND -CLAY, AND BED-SEDIMENT
PHASES IN THE MISSISSIPPI RIVER AND SOME OF ITSTRIBUTARIES, 1987-90
By J.A. Leenheer, T.I. Noyes, and P.A. Brown
ABSTRACT
The Mississippi River and some of its tributaries were sampled for natural organic substances dissolved in water and in suspended and bed sediments during seven sampling cruises from 1987-90. The sampling cruises were made during different seasons, in the free-flowing reaches of the river from St. Louis, Missouri, to New Orleans, Louisiana. The first three cruises were made during low-water conditions, and the last four cruises during high-water conditions. The purpose for sampling and characterizing natural organic substances in the various phases in the river was to provide an understanding of how these substances facilitate contaminant transport and transformations in the Mississippi River.
Significant conclusions of this study were: (1) Natural organic substances appear to stabilize certain colloids against aggregation; therefore, these colloids remain in suspension and can act as transport agents that are not affected by sedimentation. Bacteria were found to be a significant fraction of organic colloids. (2) A new class of organic contaminants (polyethylene glycols) derived from nonionic surfactant residues was discovered dissolved with natural organic substances in water. These polyethylene glycols have the potential to affect both organic and inorganic contaminant transport in water. (3) The entire dissolved organic-matter component under varying hydrologic and seasonal conditions was characterized. (4) A method wasdeveloped to characterize organic matter in sediment by solid-state, 13C-nuclear magnetic resonance spectrometry. (5) The organic matter in suspended sediments was characterized by a variety of spectral and nonspectral methods. The protein component (significant in trace-metal binding) and lipid component (significant in organic-contaminant binding) were found to be major constituents in natural organic matter in suspended sediment. (6) Pools are reservoirs acting as traps of sedimentary organic matter of allochthonous origin and export material of autochthonous origin that is rich in nitrogen. (7) A major portion of the mass of organic colloids in transport consisted of bacterial cells.
INTRODUCTION
Most contaminants in rivers have some degree of association with natural organic substances in the dissolved and particulate phases in the water (Leenheer, 1991,1994). These associations may either facilitate or retard contaminant transport in rivers, and may transform contaminants into different phases or different compounds, depending on the operative degradative processes.
The broad objectives of the Mississippi River project are to investigate the movement, mixing, and storage processes of sediment-associated pollutants (Moody and Meade, 1993). Some specific objectives are to:
1. Understand the compartmentalization of synthetic organic and inorganic agrochemicals between and water, sediment, and biotic phases.
ABSTRACT 1
2. Investigate the mixing, partitioning, and redistribution processes of the various pollutants downstream from major river confluences.
3. Understand the movement, storage, and remobilization of suspended sediment and asso ciated pollutants at seasonal or longer time scales.
4. Predict the location and travel time of water masses and the associated sediment and pollutants; and
5. Examine the geochemistry of the suspended silt, clay, colloidal material, and dissolved phases of river water.
This report summarizes the research on natural organic matter conducted from July 1987 to June 1990 on the Mississippi River and some of its tributaries. Water and sediment samples were collected during seven cruises. Two general objectives of all seven cruises was to quantify the organic substances in dissolved and suspended-sediment phases, and to characterize the organic matter in the various phases through spectrometric and elemental measurements. Each cruise had specific objectives that required slightly different approaches. In order to adequately describe these differences, this report is organized chronologically by cruise and includes a discussion of the objectives and approach, as well as the results, for each cruise.
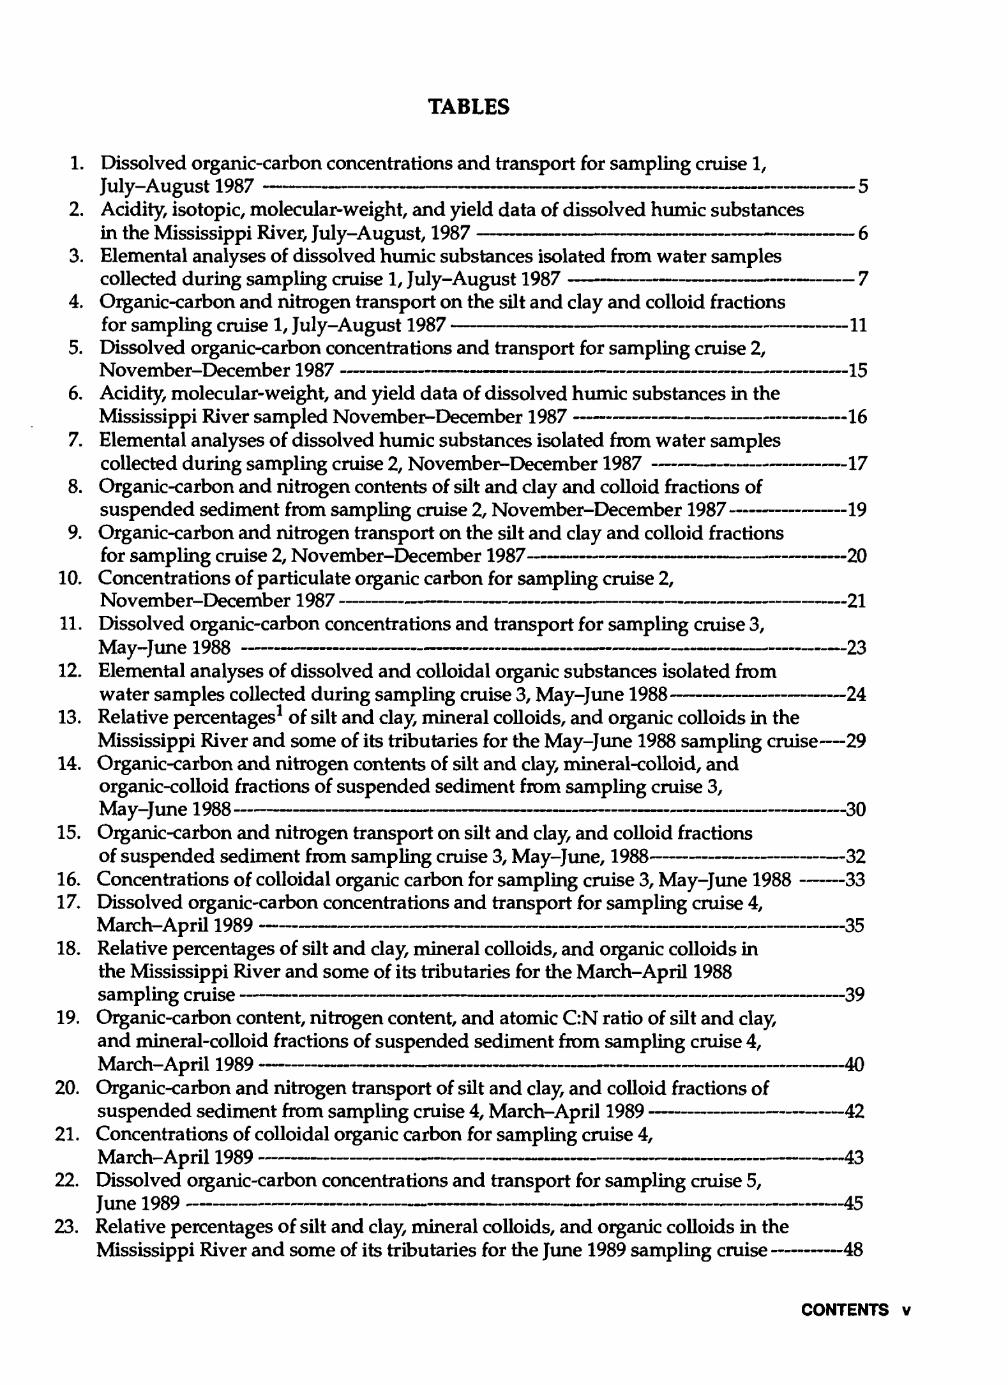
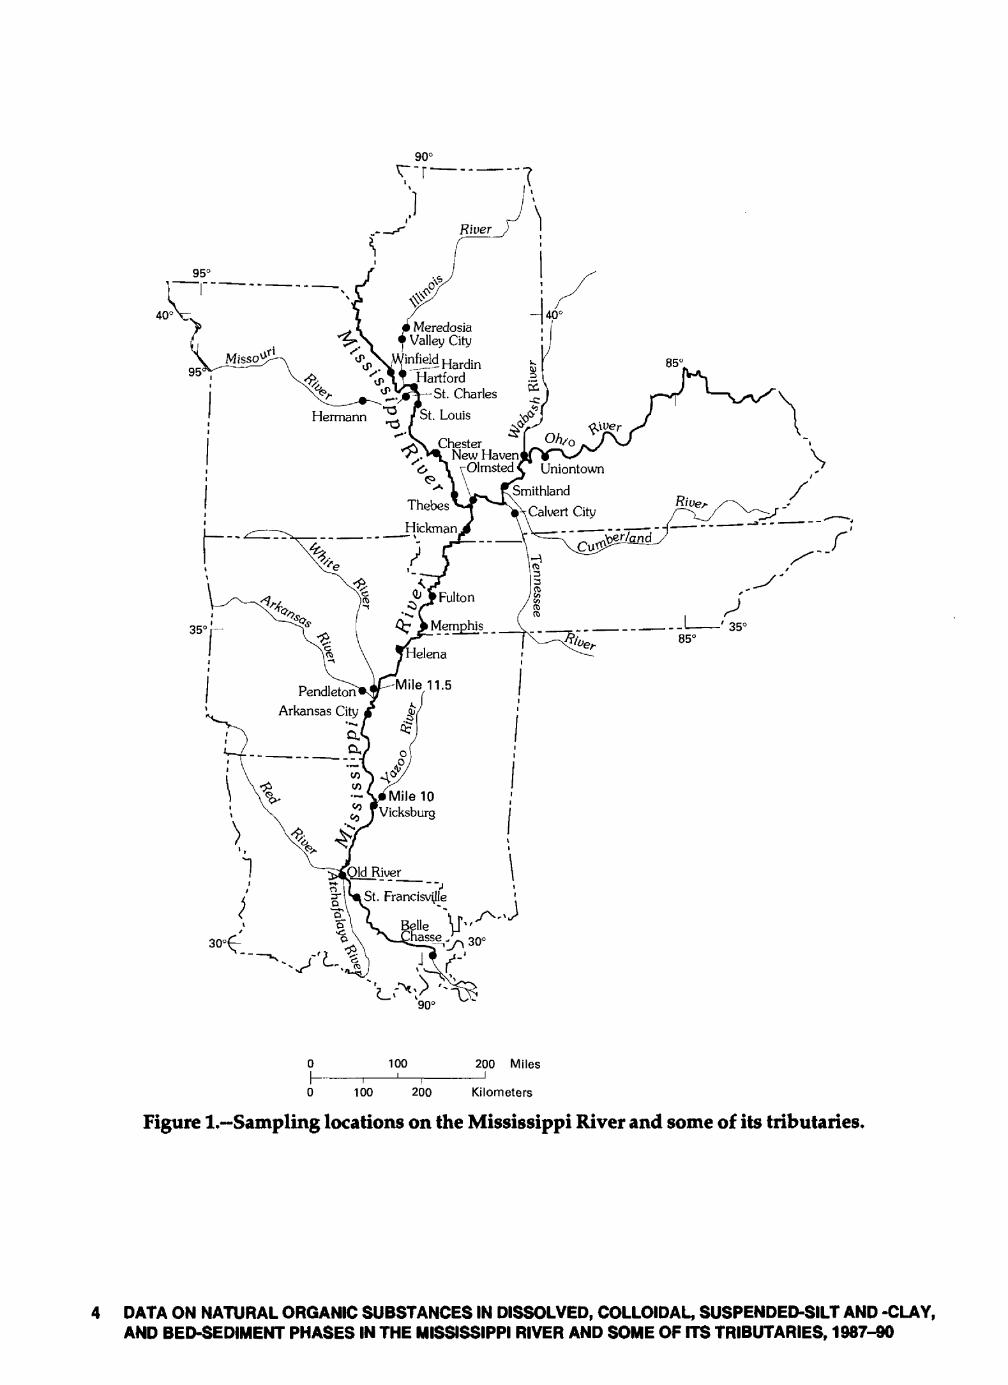
The location of the sampling sites on the lower Mississippi River and some of its tributaries is shown in figure 1. Integration of the research presented in this report with the research on metal and organic contaminants in the lower Mississippi River will provide an understanding of how natural organic substances affect contaminant transport and transformations.
Acknowledgments
The data presented in this report are the result of a group effort in sampling the Mississippi River and some if its tributaries, processing the samples to fractionate and isolate the various dissolved and sediment phases, and sharing data and assisting in data interpretation.
The authors wish to acknowledge the crew of the research vessel ACADIANA Lee Black, Wayne Simoneaux, Chuck Guidry, Steve Rabalais, Craig LeBoeuf, Ken Oliver, and Wilton Delaune who have accommodated our unusual requests and who have ensured the mainte nance of proper scientific operations.
We also wish to acknowledge the Mississippi River project chief, Robert Meade, who along with John Moody attempted to teach a boatload of chemists the fundamentals of surface-water hydrology.
We wish to acknowledge our colleagues who assisted in measuring river discharge, collecting and processing large volumes of water for water and sediment sampling, performing field and laboratory measurements, and performing miscellaneous boat operations. These people include Ellen Axtmann, Terry Brinton, Wes Campbell, Phyllis Campbell, Daphne Frilot, John Garbarino, Tom Kraemer, Tom Leiker, Debby Martin, Dick Martin, Brent McKee, Dale Peart, Willie Periera, Jim Ranville, Terry Rees, Colleen Rostad, Jim Seely, Herb Stevens, Bob Stallard, Dick Tagg, and Howard Taylor and Tim Willoughby.
Lastly, we wish to thank Luis Cifuentes of Texas A & M University for determining stable carbon isotope ratio determinations of dissolved humic substances. We also thank Jim Ranville for performing scanning electron microscopy of organic colloids and for reviewing this report.Robert L. Wershaw determined the 13C-NMR spectrum of dissolved humic substances.
2 DATA ON NATURAL ORGANIC SUBSTANCES IN DISSOLVED, COLLOIDAL, SUSPENDED-SILT AND -CLAY, AND BED-SEDIMENT PHASES IN THE MISSISSIPPI RIVER AND SOME OF ITS TRIBUTARIES, 1987-90
SAMPLING CRUISE 1, JULY-AUGUST 1987
The sampling of cruise 1 began on the Missouri River (fig. 1) at Hermann, Missouri, on July 20,1987, and ended on the Mississippi River below Belle Chasse, Louisiana, on August 9, 1987. Samples were collected in a Lagrangian scheme (Moody, 1993) that tried to follow the same mass of water downriver.
Objectives and Approach
The objectives of sampling cruise 1 were to: (1) Develop a sampling and fractionation proce dure for organic substances in the suspended and dissolved phases that also was compatible for trace-metal studies; (2) characterize dissolved organic substances by elemental, spectral, and titri- metric analyses; (3) characterize suspended-sediment fractions by carbon and nitrogen analyses; and (4) determine loads of organic carbon transported in the various phases.
The approach was to obtain 70-100 L of water by depth-integration at 5-40 locations across the river from the research vessel Acadiana, (owned and operated by the Louisiana Universities' Marine Consortium) transfer this depth-integrated composite sample to a mobile field laboratory, and fractionate the sediment by a combination of sieving to isolate sand, continuous-flow centrif- ugation to isolate silt and clay, tangential-flow ultrafiltration to isolate colloids, and resin adsorp tion to isolate the fulvic-acid fraction of dissolved organic carbon (Leenheer, Meade, and others, 1989). This approach was successfully followed except that the continuous-flow centrifuge broke down after the second sampling was completed at Mississippi River near Winfield, Mo., and grav itational settling in 46-L carboys for 8-12 hours was used to separate the silt and clay from the colloid fractions.
Dissolved Organic Matter
Dissolved organic carbon (DOC) concentrations were determined on the permeate from the ultrafilter by high-temperature oxidation of DOC to CO2 with a Beckman 915B1 total organic carbon analyzer (Van Hall and Stenger, 1967). The pore size of the cellulose filters used for ultra- filtration was 0.005 urn. DOC transport was computed using water-discharge measurements reported by Moody and Meade (1992). DOC concentrations and transport at 17 sampling sites are presented in table 1.
DOC concentrations were low in comparison to the National Stream Quality Accounting Network (NASQAN) average (6.0 mg/L in data averaged from 1972-1977) at Belle Chasse, La., (Leenheer, 1982). These low concentrations might result from low terrestrial carbon inputs to the river during this low-water cruise, from ultrafiltration that eliminates colloidal carbon from the data, and from instream biodegradation of DOC. Water temperatures were near 30°C during the entire cruise, and these warm temperatures likely accelerated the biodegradation of DOC.
Only the humic-substance component of dissolved organic matter was isolated from the river for characterization (Leenheer, Brown, and others, 1989). Various characterization data are listed in table 2.
SAMPLING CRUISE 1, JULY-AUGUST 1987 3
r-r -- --
MeredosiaValley City
infield HardjnHartford
St. Charles
St. Louis£
ChesterNew Haven
(, \ rOlmstedt" Uniontown
Smithland Calvert City
Memphis
elena
Mile 11.5Pendleton Arkansas City
4 Mile 10
Vicksburg
100 200 Miles
0 100 200 Kilometers
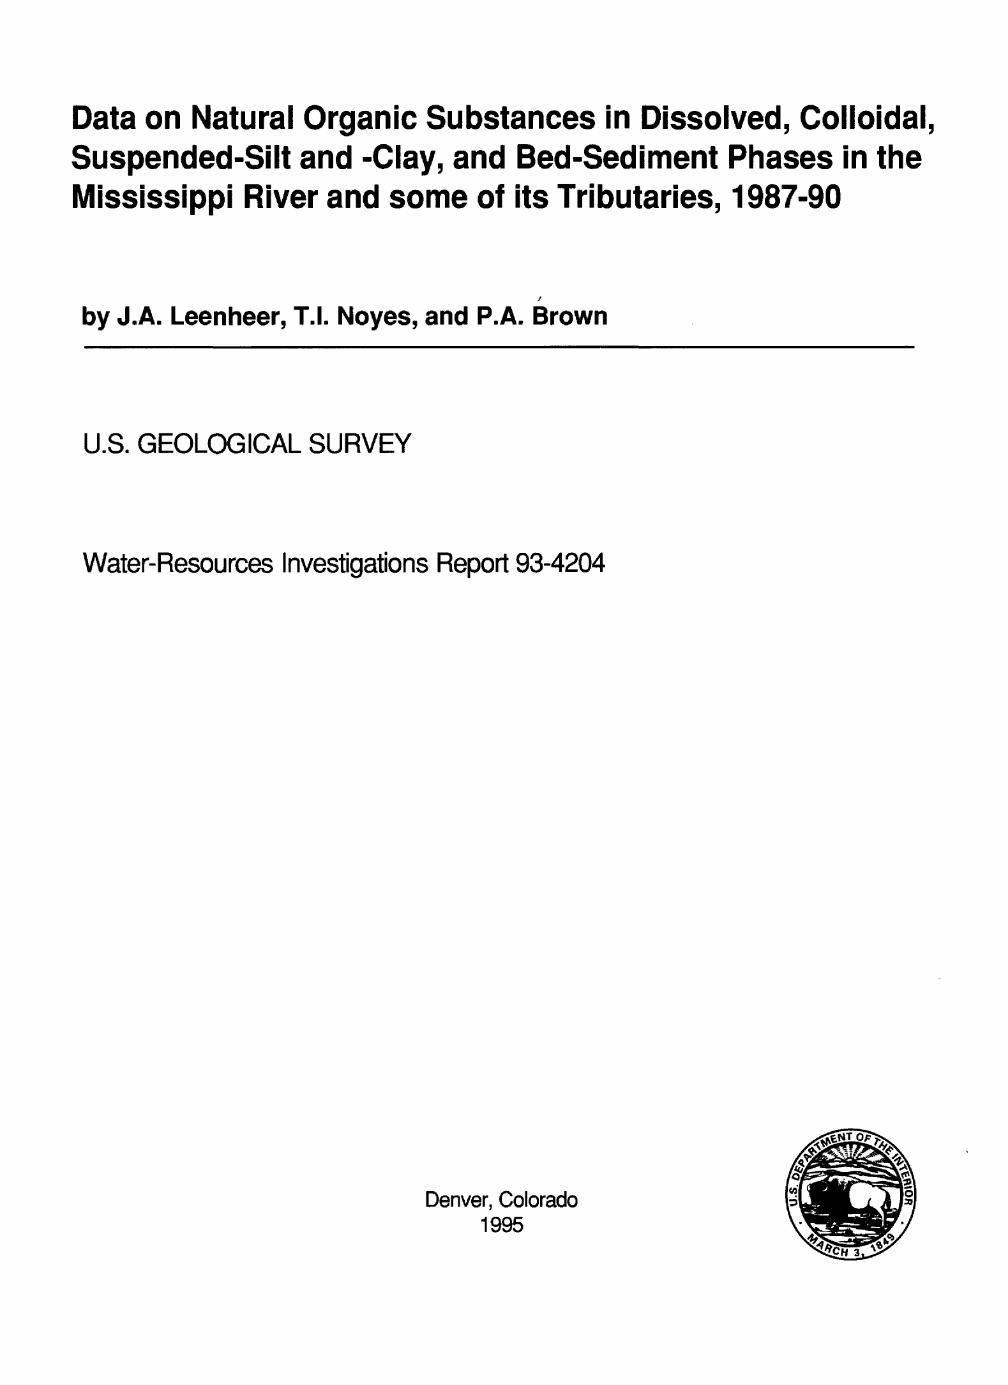
Figure l.-Sampling locations on the Mississippi River and some of its tributaries.
DATA ON NATURAL ORGANIC SUBSTANCES IN DISSOLVED, COLLOIDAL, SUSPENDED-SILT AND -CLAY, AND BED-SEDIMENT PHASES IN THE MISSISSIPPI RIVER AND SOME OF ITS TRIBUTARIES, 1987-90
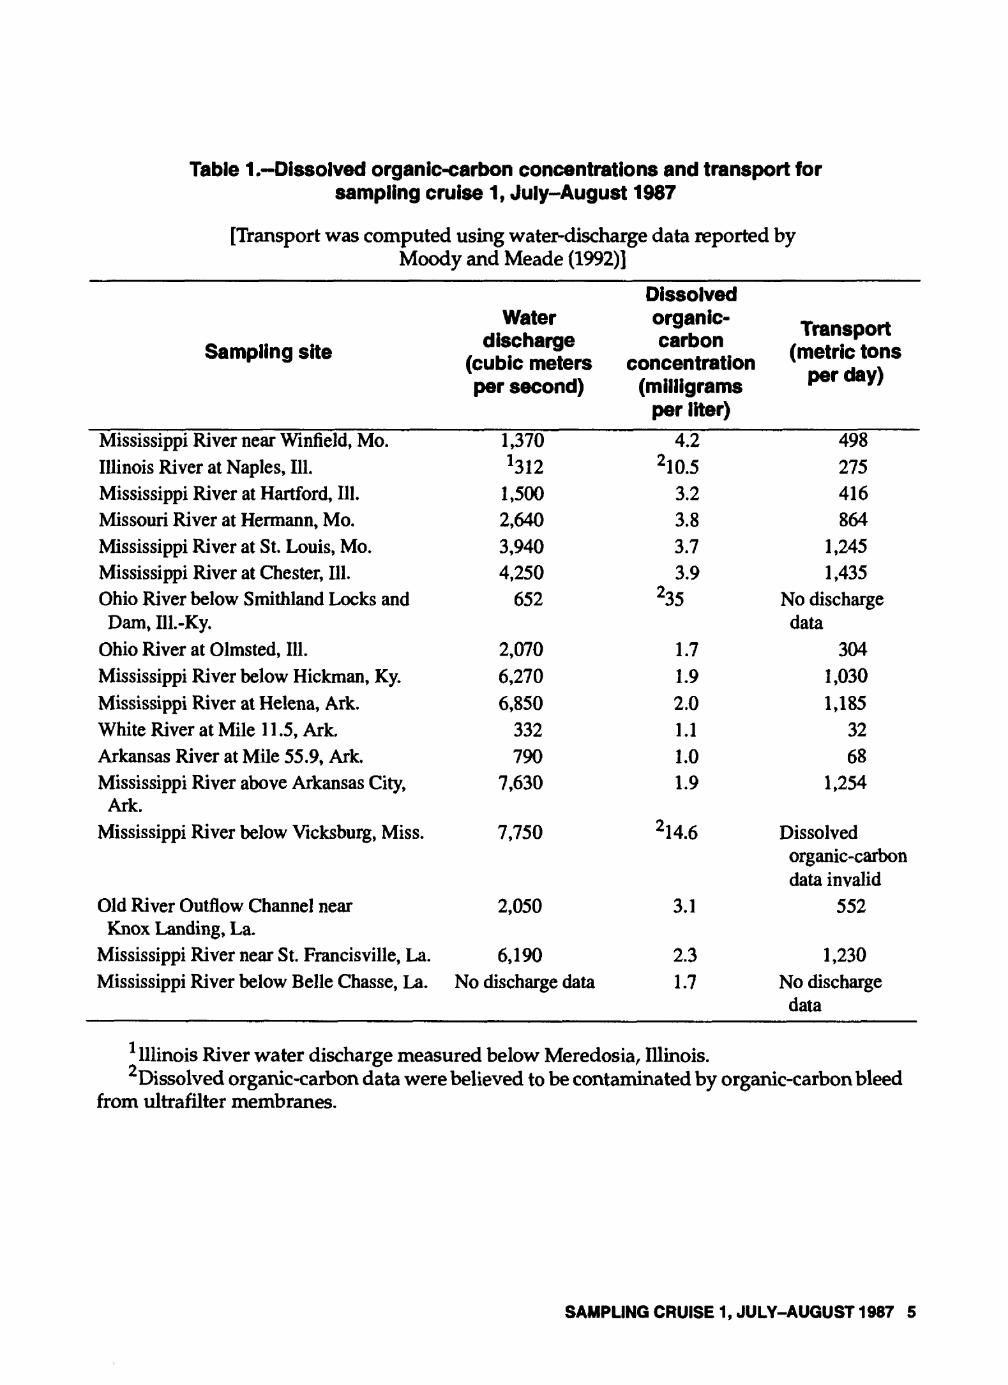
Table 1.-Dissolved organic-carbon concentrations and transport for sampling cruise 1, July-August 1987
[Transport was computed using water-discharge data reported by Moody and Meade (1992)]
Sampling site
Waterdischarge
(cubic metersper second)
Dissolved organic- carbon
concentration (milligrams
per liter)
Transport(metric tons
per day)
Mississippi River near Winfield, Mo. 1,370 4.2Illinois River at Naples, 111. *312 2 10.5Mississippi River at Hartford, 111. 1,500 3.2Missouri River at Hermann, Mo. 2,640 3.8Mississippi River at St. Louis, Mo. 3,940 3.7Mississippi River at Chester, 111. 4,250 3.9Ohio River below Smithland Locks and 652 235Dam, Ill.-Ky.
Ohio River at Olmsted, 111. 2,070 1.7Mississippi River below Hickman, Ky. 6,270 1.9Mississippi River at Helena, Ark. 6,850 2.0White River at Mile 11.5, Ark. 332 1.1Arkansas River at Mile 55.9, Ark. 790 1.0Mississippi River above Arkansas City, 7,630 1.9
Ark.Mississippi River below Vicksburg, Miss. 7,750 214.6
Old River Outflow Channel near 2,050 3.1 Knox Landing, La.
Mississippi River near St. Francisville, La. 6,190 2.3Mississippi River below Belle Chasse, La. No discharge data 1.7
498275416864
1,2451,435
No discharge data
3041,0301,185
3268
1,254
Dissolved organic-carbon data invalid
552
1,230No discharge data
1 Illinois River water discharge measured below Meredosia, Illinois. 2Dissolved organic-carbon data were believed to be contaminated by organic-carbon bleed
from ultrafilter membranes.
SAMPLING CRUISE 1, JULY-AUGUST 1987 5
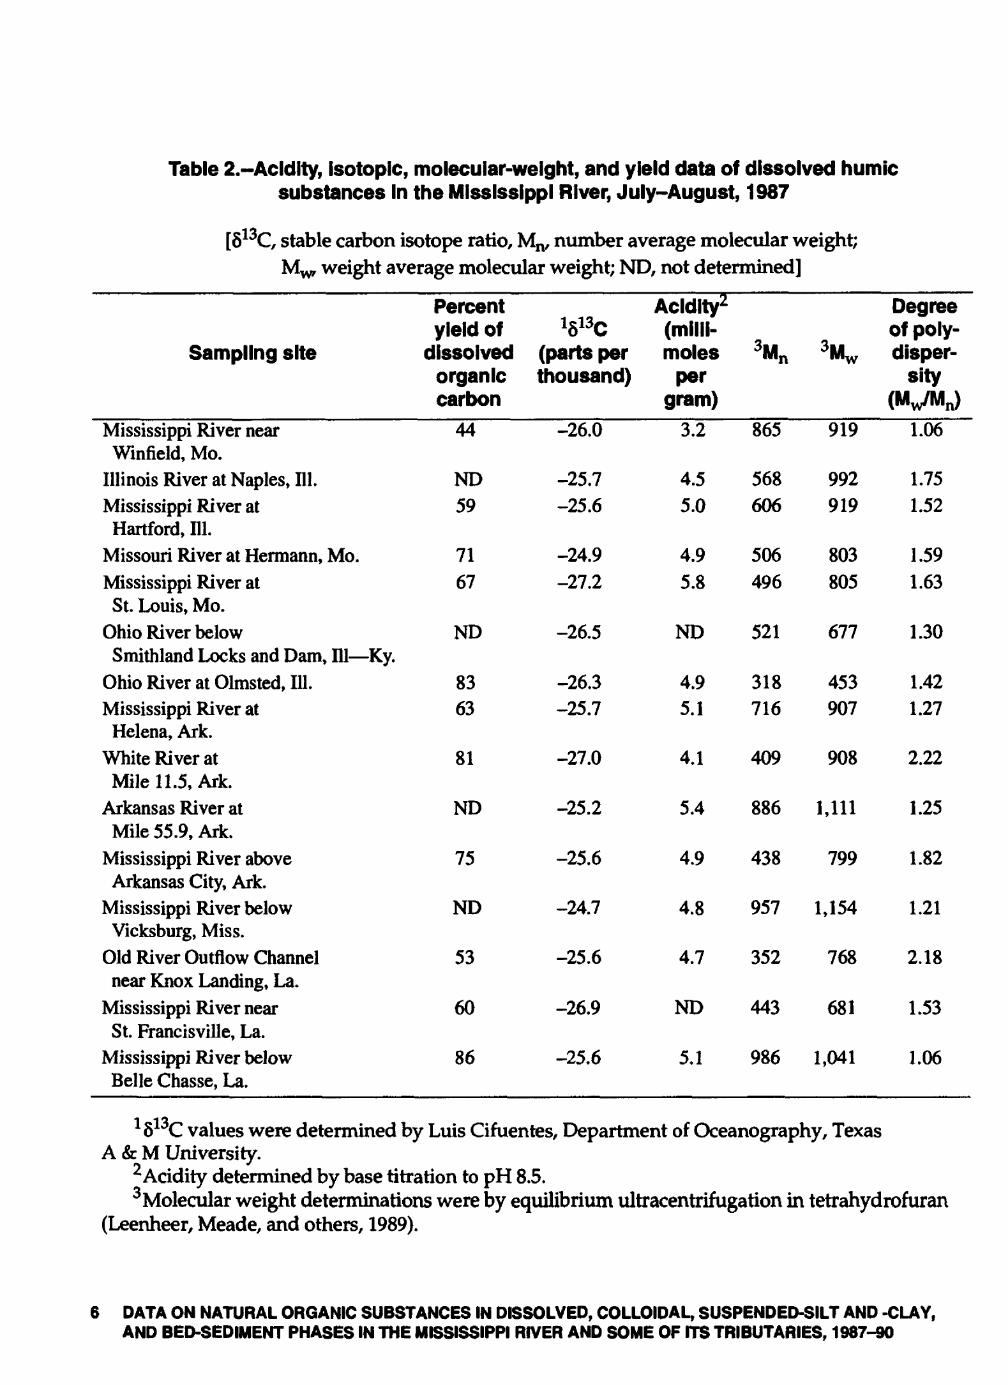
Table 2.-Acidity, isotopic, molecular-weight, and yield data off dissolved humic substances in the Mississippi River, July-August, 1987
[813C, stable carbon isotope ratio, Mn/ number average molecular weight; Mw weight average molecular weight; ND, not determined]
Sampling site
Mississippi River near Winfield, Mo.
Illinois River at Naples, 111.Mississippi River at
Hartford, El.Missouri River at Hermann, Mo.Mississippi River at
St. Louis, Mo.Ohio River below
Smithland Locks and Dam, El Ky.Ohio River at Olmsted, 111.Mississippi River at
Helena, Ark.White River atMile 11.5, Ark.
Arkansas River atMile 55.9, Ark.
Mississippi River above Arkansas City, Ark.
Mississippi River below Vicksburg, Miss.
Old River Outflow Channelnear Knox Landing, La.
Mississippi River near St. Francisville, La.
Mississippi River below Belle Chasse, La.
Percent yield off
dissolved organic carbon
44
ND59
7167
ND
8363
81
ND
75
ND
53
60
86
1»13C (parts per thousand)
-26.0
-25.7-25.6
-24.9-27.2
-26.5
-26.3-25.7
-27.0
-25.2
-25.6
-24.7
-25.6
-26.9
-25.6
Acidity2 (milii- moles
per gram)
3.2
4.55.0
4.95.8
ND
4.95.1
4.1
5.4
4.9
4.8
4.7
ND
5.1
3Ml¥in
865
568606
506496
521
318716
409
886
438
957
352
443
986
Mw
919
992919
803805
677
453907
908
1,111
799
1,154
768
681
1,041
Degree off poly- disper-
sity (IMWIn)
1.06
1.751.52
1.591.63
1.30
1.421.27
2.22
1.25
1.82
1.21
2.18
1.53
1.06
a 813C values were determined by Luis Cifuentes, Department of Oceanography, Texas A & M University.
2 Acidity determined by base titration to pH 8.5.3 Molecular weight determinations were by equilibrium ultracentrifugation in tetrahydrofuran
(Leenheer, Meade, and others, 1989).
6 DATA ON NATURAL ORGANIC SUBSTANCES IN DISSOLVED, COLLOIDAL, SUSPENDED-SILT AND -CLAY, AND BED-SEDIMENT PHASES IN THE MISSISSIPPI RIVER AND SOME OF ITS TRIBUTARIES, 1987-90
An average of two-thirds of the DOC was isolated and characterized as humic substances. The relatively low molecular weights and moderately high acidity values typify these dissolved humic substances as predominantly fulvic acids. No discernible trends are apparent in the acidity or molecular weight data to indicate source or instream degradation processes. The isotopic(813C) data indicated slightly heavier values than normally are observed for dissolved humic substances in temperate river waters (Malcolm, 1990). Input of humic substances from sewage, known to give heavy 813C values, is a possible cause for these sightly heavy values. In freshwater environments, allochthonous sources of humic substances cannot readily be distinguished from autochthonous sources by 813C values because the source term signatures are too similar (Mook and Tan, 1991).
Elemental analyses of dissolved humic substances at selected sites are shown in table 3. No significant trends in elemental composition were apparent between sampling sites. The isolated humic substances were exceptionally well separated from inorganic constituents, as shown by the low ash contents. The elemental composition of the Mississippi River isolates differed from humic substances isolated from the black water of the Suwannee River (Averett and others, 1989) in having greater carbon, hydrogen, and nitrogen contents and lower oxygen content. The greater hydrogen and nitrogen contents are especially significant on an atomic basis of comparison. The hydrogen content denotes that humic substances from the Mississippi River have a greater aliphatic character, and the nitrogen content indicates autochthonous sources are more significant in the Mississippi River than in the Suwannee River.
Spectral characterizations of dissolved humic substances were performed with H-nuclear magnetic resonance (NMR) spectrometry, 13C-NMR spectrometry, and infrared spectrometry (IR).Two types of spectral patterns were obtained for the 1H-NMR spectra as shown in figure 2. Most of the spectra were similar to the Mississippi River near St. Francisville, La., sample (fig. 2, spec trum A), however, samples from the Ohio River at Olmsted, 111., Mississippi River at Helena, Ark.,
Table 3.-Elemental analyses of dissolved humic substances isolated from water samples collected during sampling cruise 1, July-August 1987
[<, less than]
Sampling site Percent Percent Percent Percent Percent carbon hydrogen oxygen nitrogen ash
Mississippi River near Winfield, Mo.Missouri River at Hermann, Mo.Ohio River at Olmsted, 111.Mississippi River at Helena, Ark.Arkansas River at Mile 55.9, Ark.Mississippi River near
St. Francisville, La.Mississippi River below
Belle Chasse, La.
55.3454.8656.6057.8655.9254.76
55.94
5.075.055.484.605.075.44
4.92
35.1136.4033.2733.0434.9236.44
34.86
2.702.522.462.432.372.24
2.43
0.74.84
<.l<.l<.l
.86
<.l
SAMPLING CRUISE 1, JULY-AUGUST 1987 7
and the White River gave H-NMR spectra similar to spectrum B in figure 2. Spectral intensities at points 2 (methylene protons adjacent to a carboxyl group), 3 (protons associated with carbohy drates), and 4 (aromatic ring protons adjacent to phenolic groups) are diminished in spectrum B compared to spectrum A. The three samples similar to spectrum B also gave lower molecular weights, lower DOC values, and greater carbon and hydrogen contents than the remainder of the samples. All of these data indicate that these three samples are the result of a greater degree of degradation (humification) than the remainder of the samples.
CO
CDzCO<LLJ CC OZ
Numbers denote peaks where peak height: were measured
10
CHEMICAL SHIFT, IN PARTS PER MILLION
Figure 2.~1H-nuclear magnetic resonance spectra of dissolved humic substances in samples from the (A) Mississippi River near St. Francisville, La., and (B) Ohio River at Olmsted, 111., sampled July-August 1987.
DATA ON NATURAL ORGANIC SUBSTANCES IN DISSOLVED, COLLOIDAL, SUSPENDED-SILT AND -CLAY, AND BED-SEDIMENT PHASES IN THE MISSISSIPPI RIVER AND SOME OF ITS TRIBUTARIES, 1987-90
The sharp peak at 3.6 ppm was found to be related to polyethylene glycol contaminants from nonionic surfactants (Leenheer and others, 1991). Polyethylene glycols cannot be analyzed by conventional solvent extraction, gas chromatographic, or mass spectrometric analyses. These contaminants were found in nearly all the samples from the first two sampling cruises, and they probably represent the most abundant organic contaminant found in the river during sampling cruise 1.
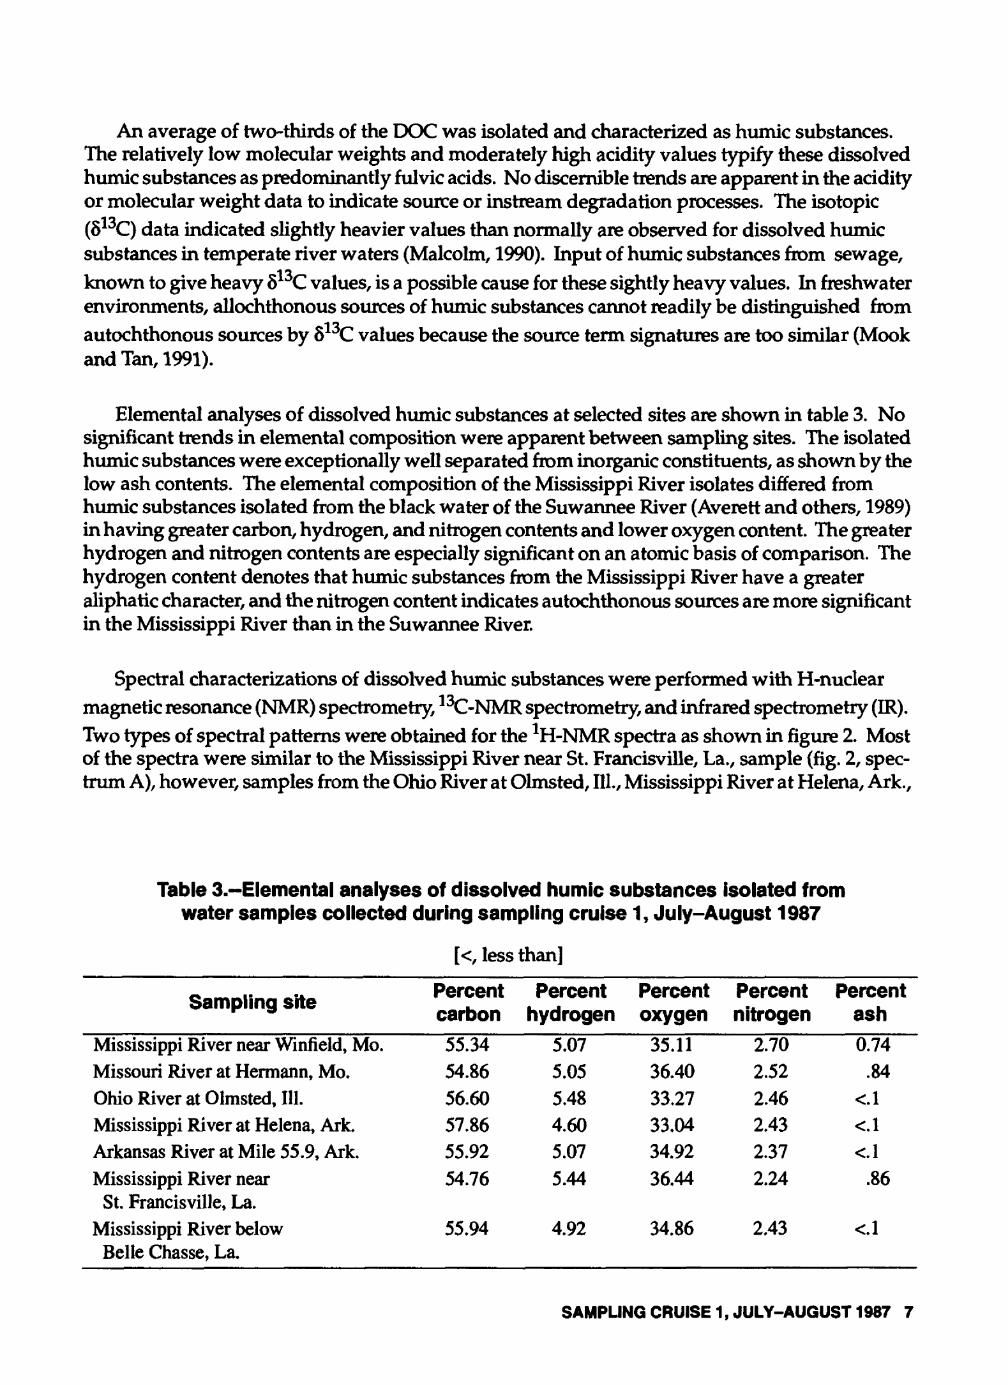
A 13C-NMR spectrum acquired under quantitative conditions for dissolved humic substances isolated from a sample from the Mississippi River near St. Francisville, La., is shown in figure 3. The spectrum is typical of an aquatic fulvic-atid sample with the exception that in spectral regions near 115 ppm and from 140 to 160 ppm, both of which are indicative of phenolic substituents, are depleted relative to these spectral regions for fulvic acid isolated from the Suwannee River(Thorn, 1989). A second 13C-NMR spectrum for humic substances isolated from a sample from the Mississippi River at St. Louis, Mo., gave nearly identical results.
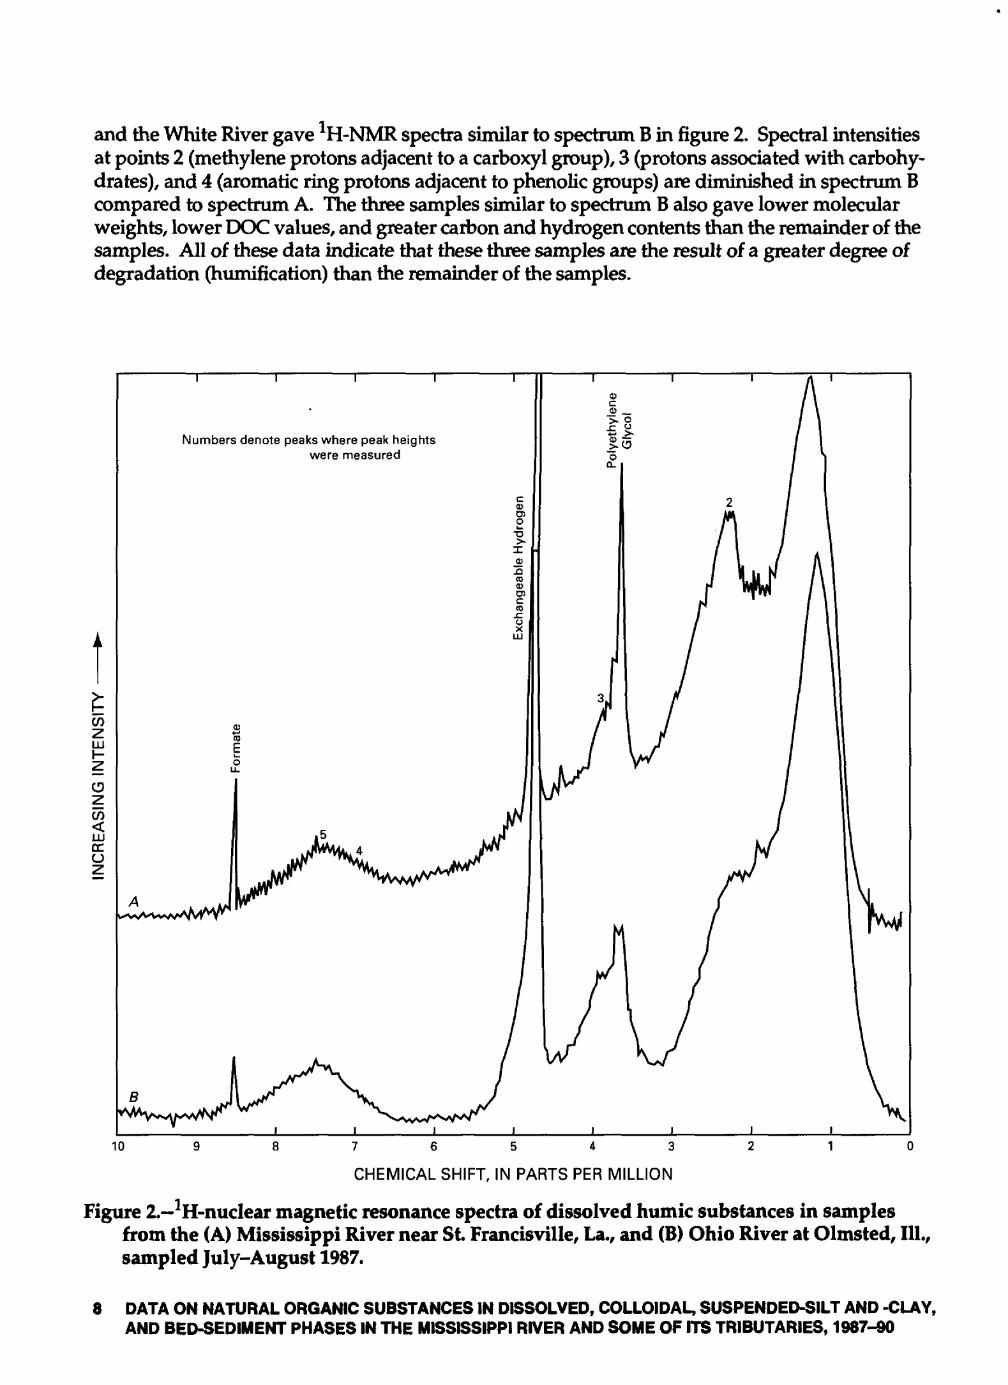
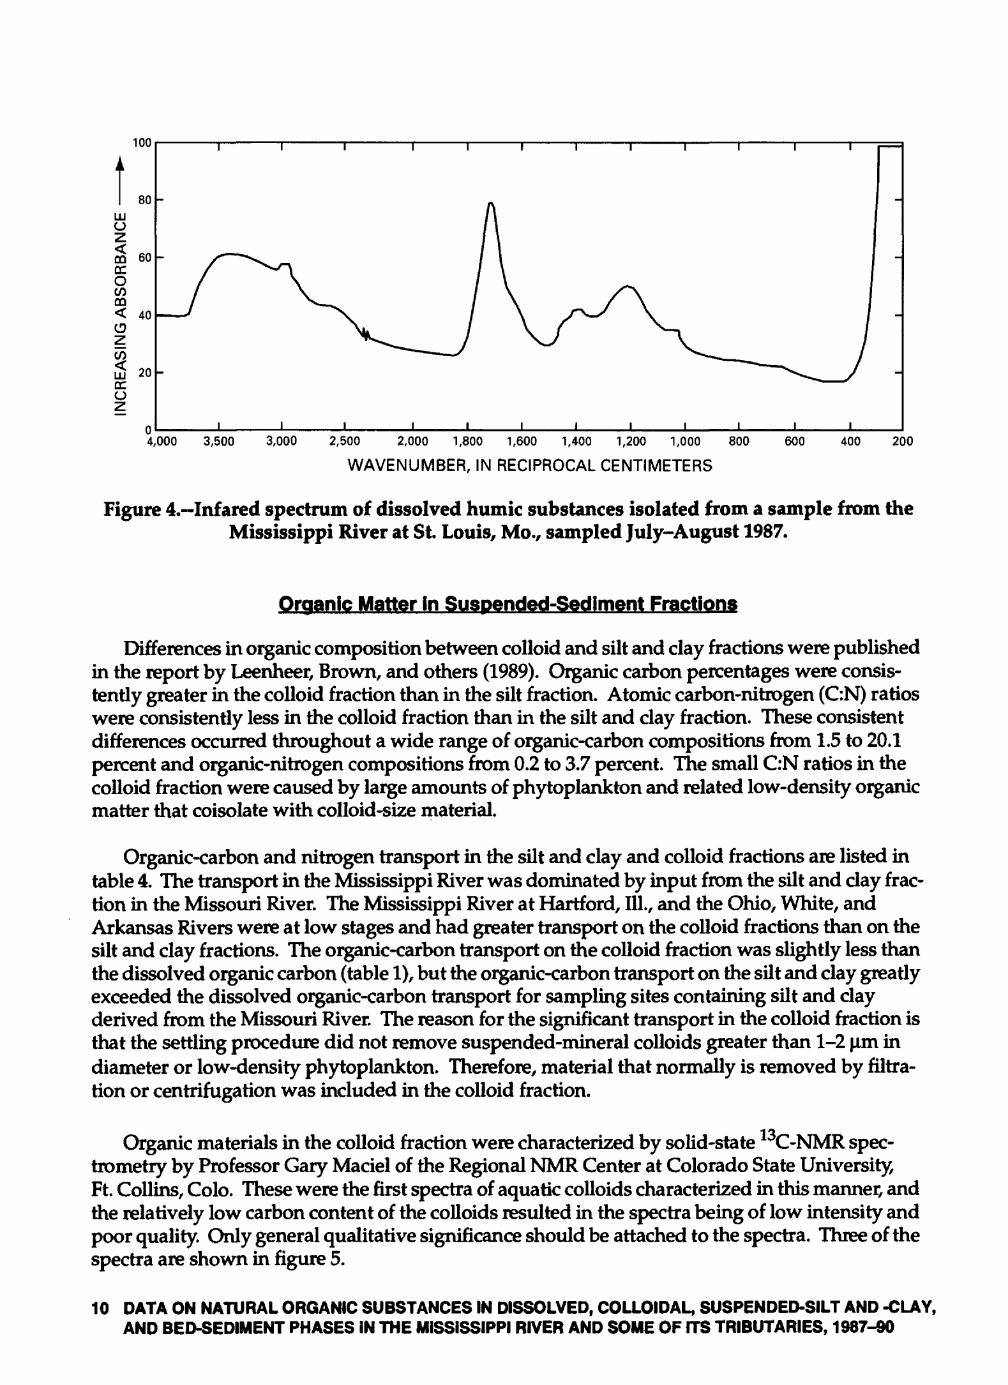
An infrared spectrum of dissolved humic substances isolated from a sample from the Missis sippi River at St. Louis is shown in figure 4. The spectrum is dominated by hydroxyl (3,600-2,500 cm"1) and carboxyl (1,720 cm"1) group absorbances. Infrared spectra were run on all of the humic-substance isolates, but no trends or information of particular geochemical significance were found.
LLJ CC CJ
300 250 200 -50150 100 50 0
CHEMICAL SHIFT, IN PARTS PER MILLION
Figure 3. 13C-nuclear magnetic resonance spectrum of dissolved humic substances isolated from the Mississippi River near St. Francisville, La., sampled July-August 1987.
-100
SAMPUNG CRUISE 1, JULY-AUGUST 1987 9
100
80LLJ U
m so cc O C/300< 40 (3Z
2i 20ccU
4,000 3,500 3,000 2,500 2,000 1,800 1,600 1,400 1,200 1,000 800 600 400 200
WAVENUMBER, IN RECIPROCAL CENTIMETERS
Figure 4. Infared spectrum of dissolved humic substances isolated from a sample from the Mississippi River at St Louis, Mo., sampled July-August 1987.
Organic Matter in Suspended-Sediment Fractions
Differences in organic composition between colloid and silt and clay fractions were published in the report by Leenheer, Brown, and others (1989). Organic carbon percentages were consis tently greater in the colloid fraction than in the silt fraction. Atomic carbon-nitrogen (ON) ratios were consistently less in the colloid fraction than in the silt and clay fraction. These consistent differences occurred throughout a wide range of organic-carbon compositions from 1.5 to 20.1 percent and organic-nitrogen compositions from 0.2 to 3.7 percent. The small ON ratios in the colloid fraction were caused by large amounts of phytoplankton and related low-density organic matter that coisolate with colloid-size material.
Organic-carbon and nitrogen transport in the silt and clay and colloid fractions are listed in table 4. The transport in the Mississippi River was dominated by input from the silt and clay frac tion in the Missouri River. The Mississippi River at Hartford, 111., and the Ohio, White, and Arkansas Rivers were at low stages and had greater transport on the colloid fractions than on the silt and clay fractions. The organic-carbon transport on the colloid fraction was slightly less than the dissolved organic carbon (table 1), but the organic-carbon transport on the silt and clay greatly exceeded the dissolved organic-carbon transport for sampling sites containing silt and day derived from the Missouri River. The reason for the significant transport in the colloid fraction is that the settling procedure did not remove suspended-mineral colloids greater than 1-2 um in diameter or low-density phytoplankton. Therefore, material that normally is removed by filtra tion or centrifugation was included in the colloid fraction.
Organic materials in the colloid fraction were characterized by solid-state C-NMR spec- trometry by Professor Gary Maciel of the Regional NMR Center at Colorado State University, Ft. Collins, Colo. These were the first spectra of aquatic colloids characterized in this manner, and the relatively low carbon content of the colloids resulted in the spectra being of low intensity and poor quality. Only general qualitative significance should be attached to the spectra. Three of the spectra are shown in figure 5.
10 DATA ON NATURAL ORGANIC SUBSTANCES IN DISSOLVED, COLLOIDAL, SUSPENDED-SILT AND -CLAY, AND BED-SEDIMENT PHASES IN THE MISSISSIPPI RIVER AND SOME OF ITS TRIBUTARIES, 1987-90
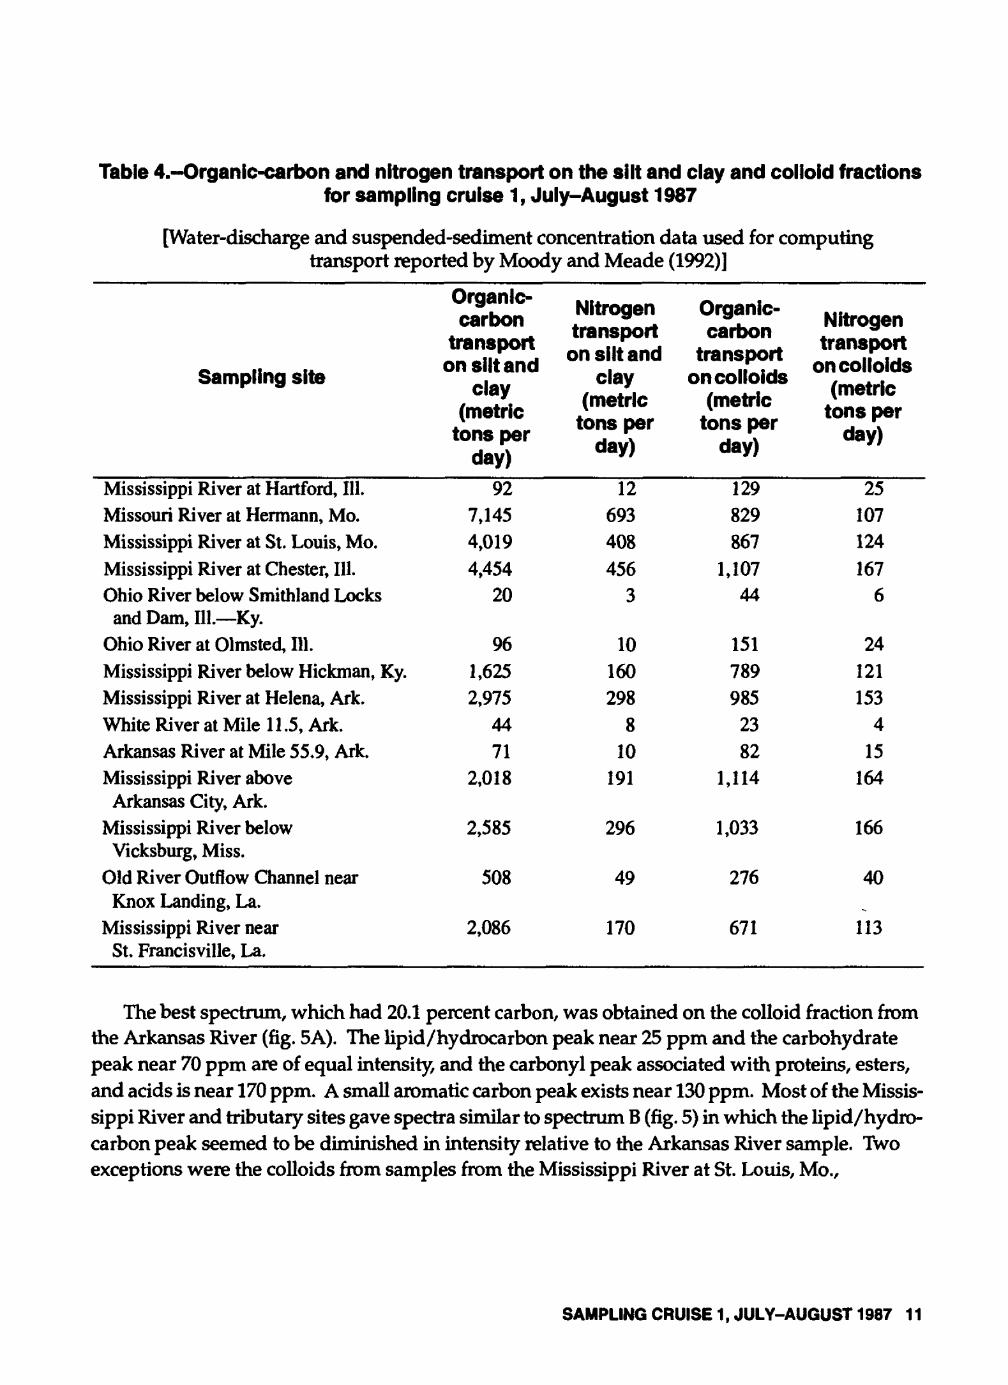
Table 4.-Organic-carbon and nitrogen transport on the silt and clay and colloid fractionsfor sampling cruise 1, July-August 1987
[Water-discharge and suspended-sediment concentration data used for computing transport reported by Moody and Meade (1992)]
Sampling site
Mississippi River at Hartford, 111.Missouri River at Hermann, Mo.Mississippi River at St. Louis, Mo.Mississippi River at Chester, 111.Ohio River below Smithland Locks
and Dam, 111. Ky.Ohio River at Olmsted, 111.Mississippi River below Hickman, Ky.Mississippi River at Helena, Ark.White River at Mile 11.5, Ark.Arkansas River at Mile 55.9, Ark.Mississippi River aboveArkansas City, Ark.
Mississippi River belowVicksburg, Miss.
Old River Outflow Channel nearKnox Landing, La.
Mississippi River nearSt. Francisville, La.
Organic- carbon
transport on silt and
clay (metric
tons per day)
927,1454,0194,454
20
961,6252,975
4471
2,018
2,585
508
2,086
Nitrogen transport on silt and
clay (metric
tons per day)
12693408456
3
10160298
810
191
296
49
170
Organic- carbon
transport on colloids
(metric tons per
day)
129829867
1,10744
151789985
2382
1,114
1,033
276
671
Nitrogen transport
on colloids (metric
tons per day)
25107124167
6
24121153
415
164
166
40_
113
The best spectrum, which had 20.1 percent carbon, was obtained on the colloid fraction from the Arkansas River (fig. 5 A). The lipid/hydrocarbon peak near 25 ppm and the carbohydrate peak near 70 ppm are of equal intensity, and the carbonyl peak associated with proteins, esters, and acids is near 170 ppm. A small aromatic carbon peak exists near 130 ppm. Most of the Missis sippi River and tributary sites gave spectra similar to spectrum B (fig. 5) in which the lipid/hydro- carbon peak seemed to be diminished in intensity relative to the Arkansas River sample. Two exceptions were the colloids from samples from the Mississippi River at St. Louis, Mo.,
SAMPLING CRUISE 1, JULY-AUGUST 1987 11
(spectrum C, fig. 5) and from the Mississippi River at Chester, 111., immediately downriver. The lipid/hydrocarbon peak is enriched in these colloid fractions and might represent hydrocarboncontamination from the St. Louis area. The 13C-NMR spectra of the colloid fraction (fig. 5) is markedly different than the dissolved mimic-substance fraction (fig. 3) in which the carbonyl and aromatic carbon are greater and the carbohydrate carbon is much less. The enhanced lipid/ hydrocarbon component on the colloid fraction relative to the dissolved humic-substance fraction should make the colloids better carriers of nonionic, nonpolar, organic contaminants.
LLI
LLIoc o
350 300 250 200 150 100 50 0 -50
CHEMICAL SHIFT, IN PARTS PER MILLION
-100 -150 -200 -250
Figure 5.~Solid-state 13C-nuclear magnetic resonance spectra of colloids isolated from the: (A) Arkansas River at Mile 55.9, (B) Mississippi River below Vicksburg, Miss., and (C) Mississippi River at St. Louis, Mo., sampled July-August 1987.
12 DATA ON NATURAL ORGANIC SUBSTANCES IN DISSOLVED, COLLOIDAL, SUSPENDED-SILT AND -CLAY, AND BED-SEDIMENT PHASES IN THE MISSISSIPPI RIVER AND SOME OF ITS TRIBUTARIES, 1987-90
SAMPLING CRUISE 2, NOVEMBER-DECEMBER 1987
The sampling of cruise 2 began on the Illinois River below Meredosia, Illinois, on November 29,1989, and ended on the Mississippi River below Belle Chasse, Louisiana, on December 20,1987. Sampling site changes from the first cruise were: (1) Sites on the Mississippi River at Hartford, Illinois, the Ohio River below Smithland Lock and Dam, and the Arkansas River at Mile 55.9 were eliminated. (2) The site on the Mississippi River at Chester, Illinois, was changed to Mississippi River at Thebes, Illinois, the site on the Missouri River was changed from Hermann, Missouri, to St. Charles, Missouri, and the site on the Illinois River at Naples, Illinois, was changed to below Meredosia, Illinois. (3) New sites were added on the Mississippi River at Fulton, Tennessee, and the Yazoo River at Mile 10, Mississippi.
Objectives and Approach
The major objective of sampling cruise 2 was to repeat the research investigations of the first cruise during the late fall, when water temperatures that affect the biological production and degradation processes are much lower. The nature of dissolved and suspended organic matter in the Mississippi River should be altered compared to the summer conditions of the first trip. Secondary objectives were to move the sample processing and sediment fractionation procedures to a laboratory mounted on the stern of the boat and to evaluate continuous-flow centrifugation and gravitational settling as a means of separating the silt and colloid fractions.
A flow chart of procedures for water and suspended-sediment fractionation of the depth- integrated composite sample is shown in figure 6 (Leenheer, Meade, and others, 1989). A Sharpies Model AS-12 continuous-flow supercentrifuge was borrowed from the Great Lakes Research Institute of the University of Wisconsin and was installed on the Acadiana at Alton, 111. For the gravitational settling procedure, the silt and clay in the composite B fraction (fig. 6) was settled in a carboy suspended in a custom-made gimbal on the boat. The gimbal minimized the rocking motion of the boat; an air-filled plenum on which the carboy was placed also minimized vibra tions from the boat.
Dissolved Organic Matter
DOC concentrations and transport are listed in table 5. DOC transport for sampling site on the Mississippi River downriver from Helena, Arkansas, are approximately double the transport measured for the first sampling cruise (table 1). This transport increase is due to the combined effect of a discharge increase (38-percent average increase for Mississippi River sites upstream from the Old River Outflow) and a 24-percent DOC increase (all sites averaged on the Mississippi River) over equivalent data for sampling cruise 1. The Ohio River had a DOC transport increase of 3.8 times the DOC transport for the first sampling cruise, and DOC transport in the Mississippi River downriver from the Ohio River is proportionately increased. Water temperatures were much cooler for the second cruise near 5°C for sites near St. Louis and increasing to 10°C for sites near New Orleans. The most likely explanation for the greater DOC concentrations in the Lower Mississippi River during sampling cruise 2 is that there is less biodegradation when water temperatures are cooler in late fall. During both sampling cruises, DOC concentrations generally decreased in the downstream direction; this observation supports the biodegradation hypothesis.
SAMPLING CRUISE 2, NOVEMBER-DECEMBER 1987 13
70 to 100 liters of sample in two composites
Composite A Composite B
Pass through 63-micrometer-pore-size nickel-wire sieve
Sand Sand Measure volume in 2-liter glass graduated cylinders
Apportion measured volumes into 20-liter churn splittersH h
Split portion of each composite into 8-liter churn splitters
Recombine sample split
Pass through continuous-flow centrifuge
Recombine sample split
Settle silt in 46-liter carboy for 6-12 hours
ISilt on FEP
Teflon centri fuge bowl linear
IRinse off linear,
centrifuge, freezedry, dry silt
IPass:through
tangential-flowultrafilter
Pass:throughtangential-flow
ultrafilter
Silt suspensionin 500-1,000 milli-
liters H 2O
Laboratory centri- fugation
Retentate colloid suspensionin 600-1,000 milliliters
H2O
Laboratory centrifugation
Moist colloid
Freeze dryI
Dry colloid
H 2O
Recombine permeate composites
IAcidify to
pH 2 with HCI
Pass through 10-liter column Amberlite XAD-8
I
Retentate colloid suspension in
600-1,000 milli liters H 2O
Laboratory centrifugation
H 2O
H 20
Discard
Moist colloid
Freeze dry
Dry colloidElute column with 75 percent CH3CN
and 25 percent H 2O
Laboratory evaporation of solvents, freeze dry
I Dissolved organic matter
Figure 6. Flow chart of procedures for water and suspended-sediment sampling, sampling cruise 2, November-December 1987.
14 DATA ON NATURAL ORGANIC SUBSTANCES IN DISSOLVED, COLLOIDAL, SUSPENDED-SILT AND -CLAY, AND BED-SEDIMENT PHASES IN THE MISSISSIPPI RIVER AND SOME OF ITS TRIBUTARIES, 1987-90
Table 5.~Dissolved organic-carbon concentrations and transport for sampling cruise 2,November-December 1987
[Transport was computed using water-discharge data reported by Moody and Meade (1992)]
Sampling site
Mississippi River near Winfield, Mo.Illinois River below Meredosia, 111.Missouri River at St. Charles, Mo.Mississippi River at St. Louis, Mo. Mississippi River at Thebes, 111.Ohio River at Olmsted, 111.Mississippi River at Helena, Ark.White River at Mile 11.5, Ark.Mississippi River above Arkansas City, Ark.Yazoo River at Mile 10, Miss.Mississippi River below Vicksburg, Miss. Old River Outflow Channel near Knox Landing, La.Mississippi River near St. Francisville, La.Mississippi River below Belle Chasse, La.
Water discharge
(cubic meters per
second)
2,040262
2,8105,440 5,1904,2008,770
5199,920
17710,410 1,8308,1809,560
Dissolved organic- carbon
concentration (milligrams per liter)
3.84.33.43.9 5.83.23.13.24.42.72.4 2.52.72.7
Transport (metric tons per
day)
67097
8221,833 2,5981,1602,349
1433,683
412,159
3591,9081,982
Acidity, molecular-weight, and yield data of dissolved humic substances in the Mississippi River sampled during sampling cruise 2 are shown in table 6. Dissolved humic substances constituted an average of 63 percent of the DOC for all the sites. This average was very similar to the data from sampling cruise 1 (table 2).
Elemental analyses of dissolved humic substances isolated from samples obtained during sampling cruise 2 are shown in table 7. The only significant difference from humic-substance samples obtained during the first cruise (table 3) is the lower nitrogen content of the samples obtained from the river during the late fall season. The lower nitrogen content is hypothesized to result from greater allochthonous (terrestrial) inputs to stream humic substances during the fall when instream (autochthonous) productivity is decreased relative to the summer. Elemental analyses during both sampling cruises indicated the samples from the Mississippi River near Winfield, Mo., gave the greatest nitrogen content. The Winfield samples represent water discharged from the Upper Mississippi River where instream productivity should be the greatest because of the extensive series of pools above the locks and dams in this reach of the river.
SAMPUNG CRUISE 2, NOVEMBER-DECEMBER 1987 15
Table 6.-Acidity, molecular-weight, and yield data of dissolved humic substances in the Mississippi River sampled November-December 1987
[Mn, number average molecular weight; Mw weight average molecular weight;ND, not determined]
Sampling site
Mississippi River near Winfield, Mo.Illinois River below Meredosia, 111.Missouri River at St. Charles, Mo.Mississippi River at St. Louis, Mo.Mississippi River at Thebes, 111.Ohio River at Olmsted, 111.Mississippi River below
Hickman, Ky.Mississippi River at Fulton, Tenn.Mississippi River at Helena, Ark.White River at Mile 11.5, Ark.Mississippi River above
Arkansas City, Ark.Yazoo River at Mile 10, Miss.Mississippi River below
Vicksburg, Miss.Old River Outflow Channelnear Knox Landing, La.
Mississippi River nearSt. Francisville, La.
Mississippi River belowBelle Chasse, La.
Percent yield of
dissolved organic carbon
635962573844
ND
ND476350
9184
82
71
68
Acidity1 (milli- moles
per gram)
5.45.75.2ND5.34.85.9
4.75.54.85.2
4.55.0
4.4
4.7
4.2
2Mn
823596580ND262876378
404439734721
909586
679
361
664
Mw
1,0661,003
713ND593
1,003528
948829
1,1421,091
1,126992
951
455
856
Degree of poly-
dispersity (Wkv/Mn)
1.301.681.23ND
2.261.141.40
2.341.891.561.51
1.231.69
1.40
1.26
1.29
1 Acidity determined by base titration to pH 8.5.2Molecular-weight determinations were by equilibrium ultracentrifugation in
tetrahydrofuran (Leenheer, Meade, and others, 1989).
16 DATA ON NATURAL ORGANIC SUBSTANCES IN DISSOLVED, COLLOIDAL, SUSPENDED-SILT AND -CLAY, AND BED-SEDIMENT PHASES IN THE MISSISSIPPI RIVER AND SOME OF ITS TRIBUTARIES, 1987-90
Table /.-Elemental analyses of dissolved humic substances isolated from water samples collected during sampling cruise 2, November-December 1987
[<, less than]
Q .. Percent Percent Percent Percent Percent sampling sue carbon hydrogen oxygen nitrogen ash
Mississippi River near Winfield, Mo.Missouri River at St. Charles, Mo.Ohio River at Olmsted, 111.White River at Mile 11.5, Ark.Mississippi River below
Belle Chasse, La.
55.0356.4455.8655.4850.97
5.045.225.124.905.00
36.1835.0734.8635.8733.17
2.272.072.051.811.83
0.17.14
<.l<.l7.33
Proton NMR spectra of dissolved humic substances isolated from water at three sites during the late fall cruise are shown in figure 7. Humic substances isolated from the Illinois River (fig. 6, spectrum A) appear to be extensively contaminated with petroleum hydrocarbons as indicated by sharp peaks at 0.9,1.1,1.4,1.8, and 2.2 ppm. Lesser amounts of these contaminants were found in the Mississippi River near Winfield, Mo. Perhaps the cool water temperatures (4-6°C), which retard hydrocarbon volatilization losses, low suspended-sediment concentrations (Illinois River, 79 mg/L; Mississippi River near Winfield, Mo., 31 mg/L), which limit hydrocarbon sorption losses, and decreased biologic activity in cold water may lead to a buildup of hydrocarboncontaminants in the dissolved phase at certain times of the year. Most of the 1H-NMR spectra also contained indications of polyethylene glycol contaminants (Leenheer and others, 1991).
Humic substances isolated during the late fall cruise (fig. 7, spectra B and C) differed from humic substances isolated during the summer cruise (fig. 2) in having higher peak height ratios of peaks 2,3, and 4 to peak 1. Because these peaks represent the structural moieties that are the most likely to be biodegraded or sorbed onto sediment constituents, it is not surprising that these peaks are greater during the fall cruise than during the summer cruise. The dissolved humic substances isolated from the White River had the greatest increase in peaks 2,3, and 4 (fig. 7, spec trum B). Humic substances from the White River site also had the lowest nitrogen content (table 7), so spectrum B represents the allochthonous "end member" for dissolved humic- substances studies for the fall 1987 sampling cruise.
Organic Matter on Suspended-Sediment Fractions
Recoveries of silt and clay and colloids comparing the gravitational settling and continuous- flow centrifugation methods are presented in the report by Leenheer, Meade, and others (1989). The centrifuge recovered material about one order of magnitude (down to 0.3 um in diameter) smaller than did the gravitational settling technique, and there was an average 20-percent shift of colloids into the silt and clay fraction with centrifugation, based on the percentage of colloids recovered after centrifugation.
SAMPLING CRUISE 2, NOVEMBER-DECEMBER 1987 17
£CO
LU
zCD
c?5LUrr o
Numbers denote peaks where peak heights were measured
10
CHEMICAL SHIFT, IN PARTS PER MILLION
Figure 7. 1H-nuclear magnetic resonance spectra of dissolved humic substances from samples from the: (A) Illinois River below Meredosia, 111., (B) White River at Mile 11.5, Ark., and (C) Mississippi River below Belle Chasse, La., sampled November-December 1987.
18 DATA ON NATURAL ORGANIC SUBSTANCES IN DISSOLVED, COLLOIDAL, SUSPENDED-SILT AND -CLAY, AND BED-SEDIMENT PHASES IN THE MISSISSIPPI RIVER AND SOME OF ITS TRIBUTARIES, 1987-90
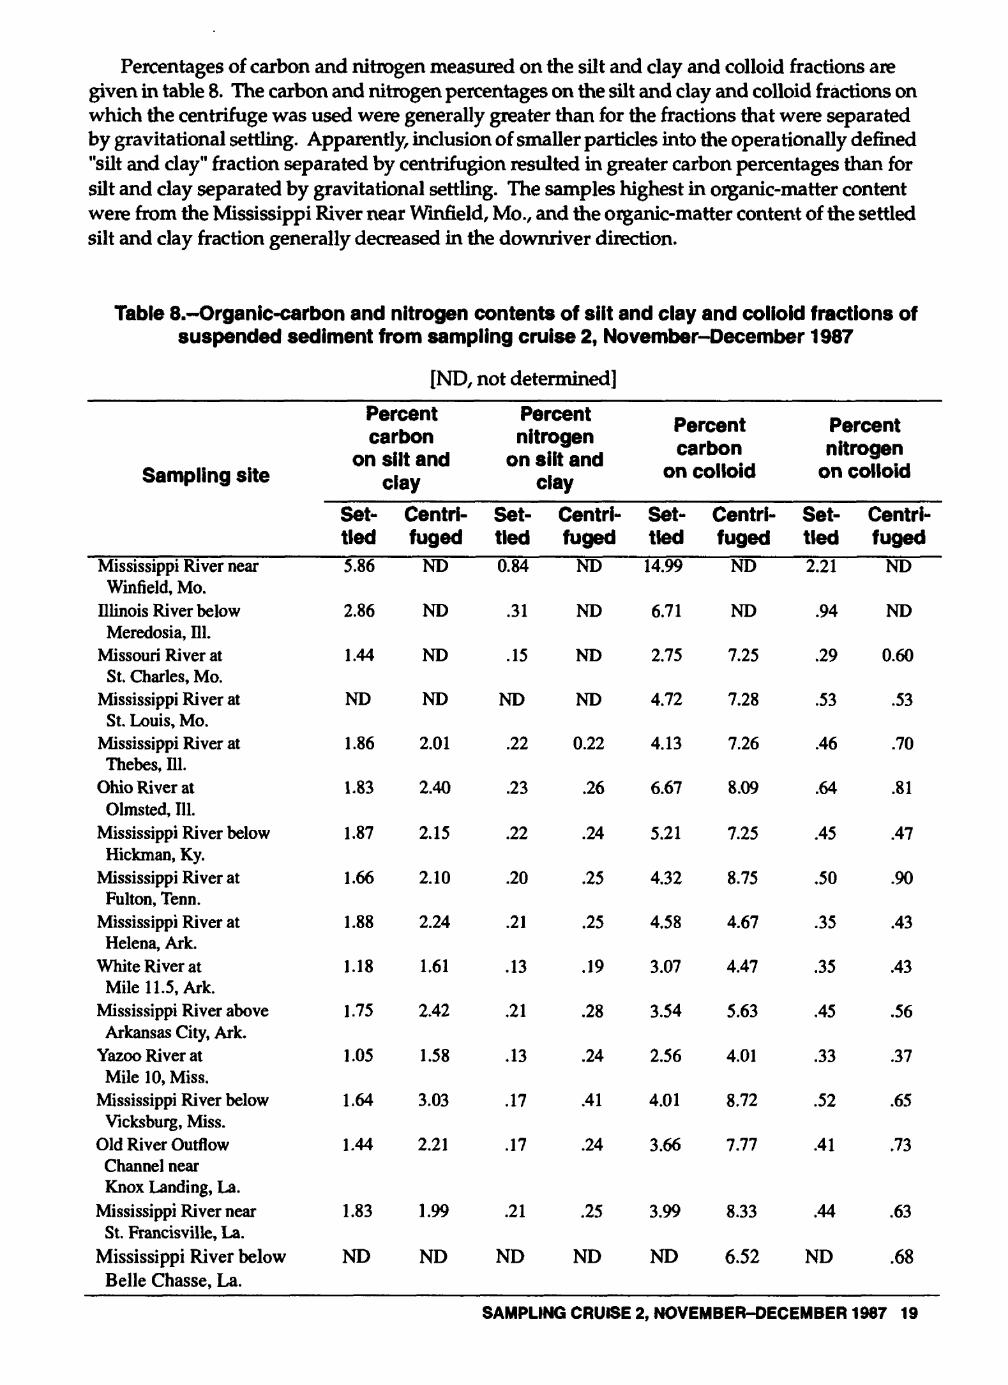
Percentages of carbon and nitrogen measured on the silt and clay and colloid fractions are given in table 8. The carbon and nitrogen percentages on the silt and clay and colloid fractions on which the centrifuge was used were generally greater than for the fractions that were separated by gravitational settling. Apparently, inclusion of smaller particles into the operationally defined "silt and day" fraction separated by centrifugion resulted in greater carbon percentages than for silt and clay separated by gravitational settling. The samples highest in organic-matter content were from the Mississippi River near Winfield, Mo., and the organic-matter content of the settled silt and clay fraction generally decreased in the downriver direction.
Table 8.-Organic-carbon and nitrogen contents of silt and clay and colloid fractions of suspended sediment from sampling cruise 2, November-December 1987
[ND, not determined]
Sampling site
Mississippi River nearWinfield, Mo.
Illinois River belowMeredosia, 111.
Missouri River atSt. Charles, Mo.
Mississippi River atSt. Louis, Mo.
Mississippi River atThebes, 111.
Ohio River atOlmsted, 111.
Mississippi River belowHickman, Ky.
Mississippi River atFulton, Tenn.
Mississippi River atHelena, Ark.
White River atMile 11. 5, Ark.
Mississippi River aboveArkansas City, Ark.
Yazoo River atMile 10, Miss.
Mississippi River belowVicksburg, Miss.
Old River OutflowChannel nearKnox Landing, La.
Mississippi River nearSt. Francisville, La.
Mississippi River belowBelle Chasse, La.
Percent carbon
on silt and clay
Set tled5.86
2.86
1.44
ND
1.86
1.83
1.87
1.66
1.88
1.18
1.75
1.05
1.64
1.44
1.83
ND
Centri- fuged
ND
ND
ND
ND
2.01
2.40
2.15
2.10
2.24
1.61
2.42
1.58
3.03
2.21
1.99
ND
Percent nitrogen
on silt and clay
Set tled0.84
.31
.15
ND
.22
.23
.22
.20
.21
.13
.21
.13
.17
.17
.21
ND
Centri- fuged
ND
ND
ND
ND
0.22
.26
.24
.25
.25
.19
.28
.24
.41
.24
.25
ND
Percent carbon
on colloid
Set tled
14.99
6.71
2.75
4.72
4.13
6.67
5.21
4.32
4.58
3.07
3.54
2.56
4.01
3.66
3.99
ND
Centri- fuged
ND
ND
7.25
7.28
7.26
8.09
7.25
8.75
4.67
4.47
5.63
4.01
8.72
7.77
8.33
6.52
Percent nitrogen
on colloid
Set tled2.21
.94
.29
.53
.46
.64
.45
.50
.35
.35
.45
.33
.52
.41
.44
ND
Centri- fuged
ND
ND
0.60
.53
.70
.81
.47
.90
.43
.43
.56
.37
.65
.73
.63
.68
SAMPLING CRUISE 2, NOVEMBER-DECEMBER 1987 19
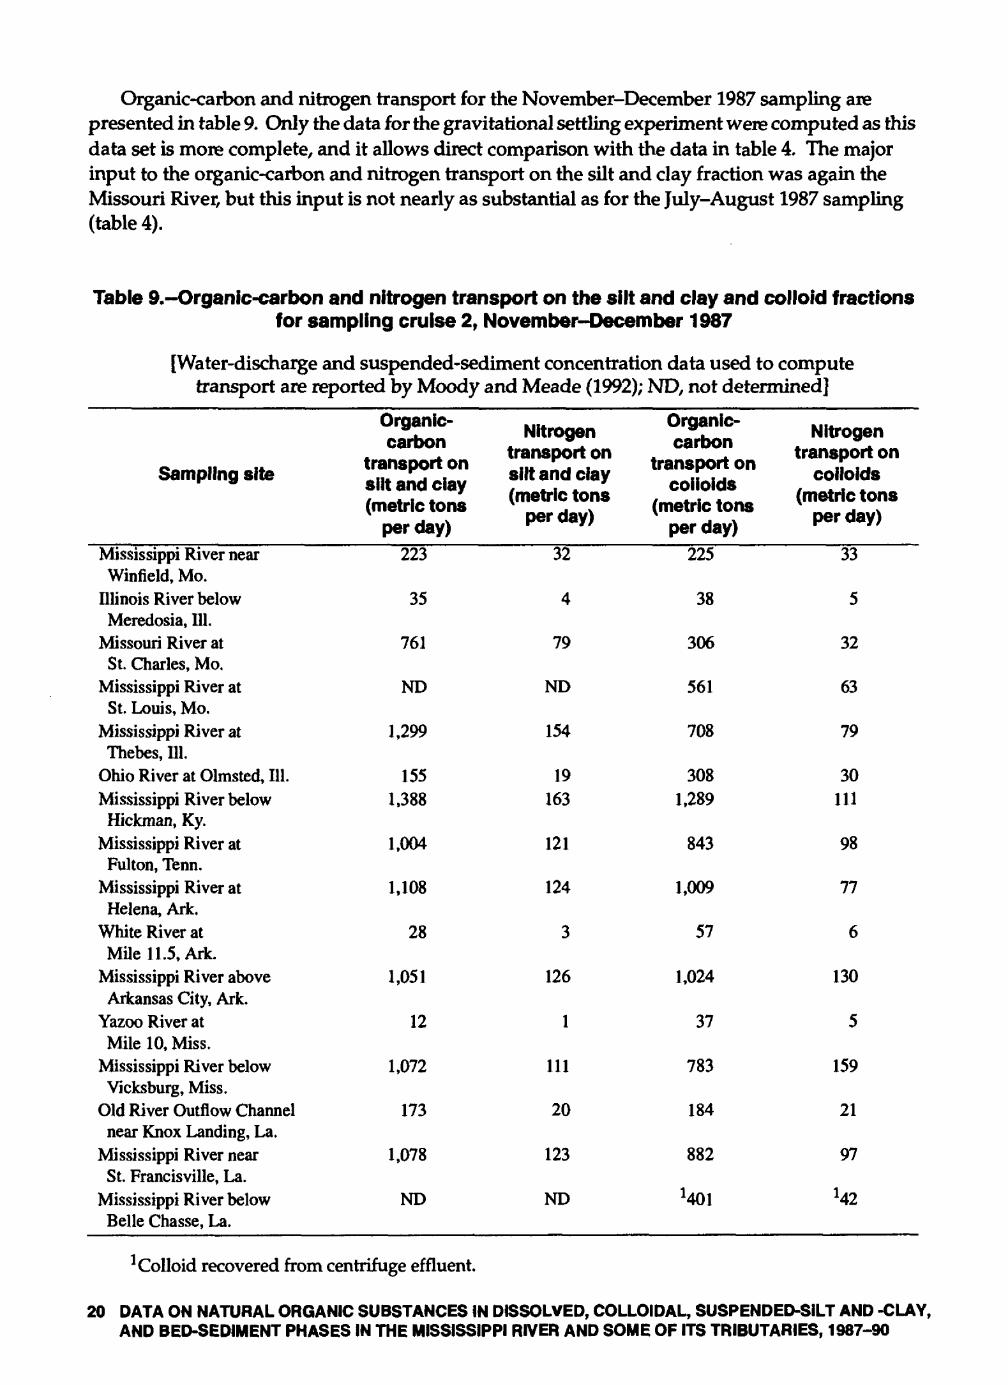
Organic-carbon and nitrogen transport for the November-December 1987 sampling are presented in table 9. Only the data for the gravitational settling experiment were computed as this data set is more complete, and it allows direct comparison with the data in table 4. The major input to the organic-carbon and nitrogen transport on the silt and clay fraction was again the Missouri River, but this input is not nearly as substantial as for the July-August 1987 sampling (table 4).
Table 9.-Organic-carbon and nitrogen transport on the silt and clay and colloid fractions for sampling cruise 2, November-December 1987
[Water-discharge and suspended-sediment concentration data used to compute transport are reported by Moody and Meade (1992); ND, not determined]
Sampling site
Mississippi River nearWinfield, Mo.
Illinois River belowMeredosia, 111.
Missouri River atSt. Charles, Mo.
Mississippi River atSt. Louis, Mo.
Mississippi River atThebes, 111.
Ohio River at Olmsted, 111.Mississippi River belowHickman, Ky.
Mississippi River atFulton, Tenn.
Mississippi River atHelena, Ark.
White River atMile 11.5, Ark.
Mississippi River aboveArkansas City, Ark.
Yazoo River atMile 10, Miss.
Mississippi River belowVicksburg, Miss.
Old River Outflow Channelnear Knox Landing, La.
Mississippi River nearSt. Francisville, La.
Mississippi River belowBelle Chasse, La.
Organic- carbon
transport on silt and clay (metric tons
per day)223
35
761
ND
1,299
1551,388
1,004
1,108
28
1,051
12
1,072
173
1,078
ND
Nitrogen transport on silt and clay (metric tons
per day)
32
4
79
ND
154
19163
121
124
3
126
1
111
20
123
ND
Organic- carbon
transport on colloids
(metric tons per day)
225
38
306
561
708
3081,289
843
1,009
57
1,024
37
783
184
882
'401
Nitrogen transport on
colloids (metric tons
per day)
33
5
32
63
79
30111
98
77
6
130
5
159
21
97
'42
Colloid recovered from centrifuge effluent.
20 DATA ON NATURAL ORGANIC SUBSTANCES IN DISSOLVED, COLLOIDAL, SUSPENDED-SILT AND -CLAY, AND BED-SEDIMENT PHASES IN THE MISSISSIPPI RIVER AND SOME OF ITS TRIBUTARIES, 1987-90
Organic-carbon and nitrogen transport on the colloid fraction (table 9) exceeded the silt and clay transport for the tributary rivers (Missouri River excepted) and the Mississippi River near Winfield, Mo., and the colloid carbon and nitrogen transport were within a factor of 2 of the silt and clay carbon and nitrogen transport for the Mississippi River sites. These data show the importance of colloids as a transport medium for contaminants that are associated with natural organic substances in water.
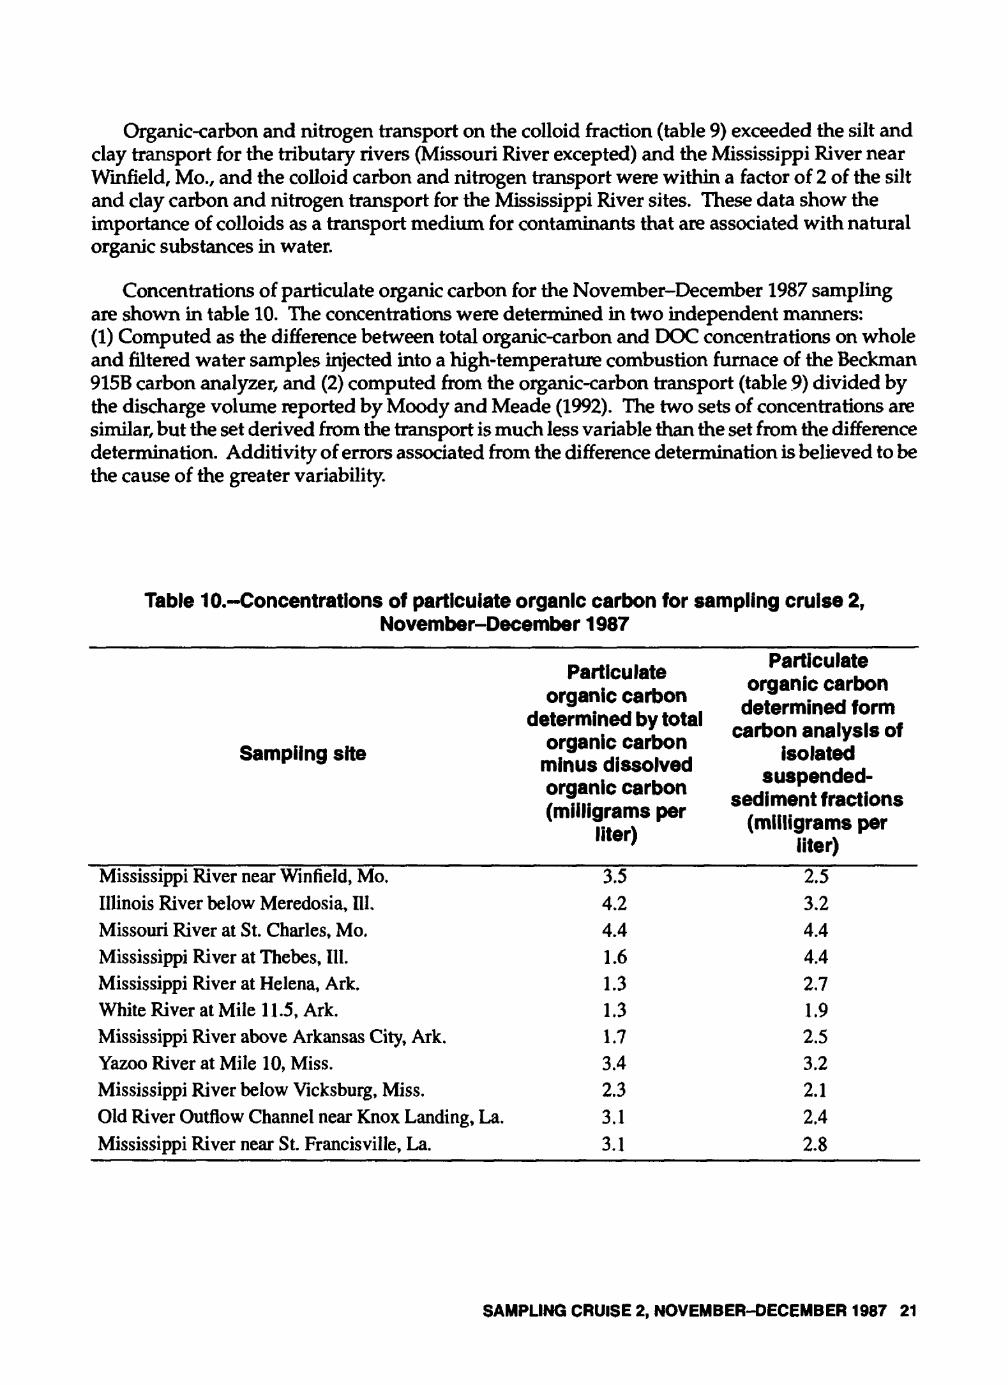
Concentrations of particulate organic carbon for the November-December 1987 sampling are shown in table 10. The concentrations were determined in two independent manners: (1) Computed as the difference between total organic-carbon and DOC concentrations on whole and filtered water samples injected into a high-temperature combustion furnace of the Beckman 915B carbon analyzer, and (2) computed from the organic-carbon transport (table 9) divided by the discharge volume reported by Moody and Meade (1992). The two sets of concentrations are similar, but the set derived from the transport is much less variable than the set from the difference determination. Additivity of errors associated from the difference determination is believed to be the cause of the greater variability.
Table 10.-Concentrations of particulate organic carbon for sampling cruise 2,November-December 1987
Sampling site
Particulateorganic carbon
determined by totalorganic carbon
minus dissolvedorganic carbon(milligrams per
liter)
Particulateorganic carbon
determined formcarbon analysis of
isolated suspended-
sediment fractions (milligrams per
liter)Mississippi River near Winfield, Mo.Illinois River below Meredosia, 111.Missouri River at St. Charles, Mo.Mississippi River at Thebes, 111.Mississippi River at Helena, Ark.White River at Mile 11.5, Ark.Mississippi River above Arkansas City, Ark.Yazoo River at Mile 10, Miss.Mississippi River below Vicksburg, Miss.Old River Outflow Channel near Knox Landing, La.Mississippi River near St. Francisville, La.
3.54.24.41.61.31.31.73.42.33.13.1
2.53.24.44.42.71.92.53.22.12.42.8
SAMPLING CRUISE 2, NOVEMBER-DECEMBER 1987 21
SAMPLING CRUISE 3, MAY-JUNE 1988
The sampling of cruise 3 began on the Illinois River below Meredosia, Illinois, on May 16,1988, and ended on the Mississippi River below Belle Chasse, Louisiana, on June 7,1988. The one sampling site change from cruise 2 was that the Missouri River was sampled at Hermann, Missouri instead of St. Charles, Missouri.
Objectives and Approach
The major objective of sampling cruise 3 was to repeat the research investigations of the first two cruises during a high-flow period during the spring; unfortunately, flow was at record low levels during this cruise. Another objective was to obtain a more complete characterization of the dissolved and colloidal fractions that were not recovered for analysis during the previous two cruises. The hydrophilic fraction (dissolved organic matter that does not adsorb on Amberlite XAD-8 resins) was studied, and an organic colloid fraction that was not recovered by laboratory supercentrifugation was also characterized.
The approach to isolating and characterizing the dissolved organic-matter fractions was modified significantly. The large 10-L column of Amberlite XAD-8 resin was removed from the boat, and 20-L samples of ultrafilter permeates were collected in cubitainers, preserved with chlo roform, and shipped back to the laboratory. In the laboratory, the samples were acidified to pH 4 with HC1 and vacuum evaporated to 500 mL to 1L (the point of salt saturation), the pH adjusted to 2 with HC1, and the sample concentrates passed through a 500-mL column of Amberlite XAD-8. Dissolved organic matter that adsorbed on the resin was eluted with 75 percent acetoni- trile and 25 percent water acidified to pH 2. This modification of the procedure increased the recovery of dissolved organic matter that adsorbed on the resin. The procedure used in the first two sampling cruises recovered solutes whose column capacity factor (k1) was 10 or greater (Leenheer, 1981); the modified procedure recovered solutes of k' equal to 1 or greater.
Hydrophilic organic solutes that did not adsorb on the resins were collected in the eluent from the XAD-8 column, the eluent was vacuum evaporated to the point of salt crystallization, then glacial acetic acid was added to double the volume of the concentrate. Successive additions of acetic acid and separation of inorganic salts by centrifugation served to separate hydrophilic organic solutes from water and inorganic salts. After no more inorganic salts could be separated, the residue was dissolved in water and passed through a cation-exchange column in the hydrogen form to convert hydrophilic organic salts to acids.
Organic colloids that were not recoverable by centrifugation of the colloid fraction were recov ered by placing the supernatant from the centrifugation in a 10,000-dalton pore-size dialysis bag, removing the salts by dialysis against distilled water, and freeze-drying the colloids remaining inside the dialysis bag.
A Sharpies Model AS-12 continuous-flow centrifuge was acquired by the project for use during this and subsequent sampling cruises. It was decided to use centrifugation to separate the silt and clay and colloid fractions rather than gravitational settling because centrifugation was much more time efficient with regard to the amount of water processed and the amount of silt and clay recovered. A pumped composite sample (see Moody and Meade, 1993) consisting of 300 to 700 liters was collected in addition to the depth-integrated composite sample.
22 DATA ON NATURAL ORGANIC SUBSTANCES IN DISSOLVED, COLLOIDAL, SUSPENDED-SILT AND -CLAY, AND BED-SEDIMENT PHASES IN THE MISSISSIPPI RIVER AND SOME OF ITS TRIBUTARIES, 1987-90
Dissolved Organic Matter
DOC concentrations and transport for sampling cruise 3 are listed in table 11. Organic-carbon concentrations and transport are similar in the Mississippi River and tributary sites upstream from the Ohio River compared to the first cruise (table 1), where similar low-flow conditions existed; but concentrations and transport for sites downstream from the Ohio River are 50-80 percent greater than the values for sampling cruise 1. The only significant difference between these cruises is water temperature near 30°C for the first cruise and 20-25°C for the third cruise. There may have been less instream degradation of DOC during the moderate temperatures of the third cruise than during the first cruise.
Table 11.-Dissolved organic-carbon concentrations and transport for sampling cruise 3,May-June 1988
[Transport was computed using water-discharge data reported by Moody and Meade (1992)]
Sampling site
Mississippi River near Winfield, 111. Illinois River below Meredosia, 111.Missouri River at Hermann, Mo.Mississippi River at St. Louis, Mo.Mississippi River at Thebes, 111.Ohio River at Olmsted, 111.Mississippi River below Hickman, Ky.Mississippi River at Fulton, Tenn.Mississippi River at Helena, Ark.White River at Mile 11.5, Ark.Mississippi River above Arkansas City, Ark.Yazoo River at Mile 10, Miss.Mississippi River below Vicksburg, Miss.Old River Outflow Channel near
Knox Landing, La.Mississippi River near St. Francisville, La.Mississippi River below Belle Chasse, La.
Water discharge
(cubic meters per second)
1,740 332
1,4803,3503,5903,2306,7907,1707,050
4388,160
737,9502,150
5,7005,570
Dissolved organic-carbon concentration (milligrams per
liter)4.8 4.43.54.13.92.33.13.23.12.02.93.53.53.5
3.73.2
Transport (metric
tons per day)
699 126456
1,0041,260
6391,8271,9971,883
762,083
212,412
663
1,8021,543
Organic elemental analyses and yields of dissolved and colloidal organic substances isolated from water samples collected on the May-June 1988 sampling cruise are tabulated in table 12. Yields of the humic-substance fraction did not appreciably improve compared to data from the previous two cruises. The humic-substance fraction constitutes an average of about two-thirds of the DOC, and this fraction was quantitatively isolated in all three procedures. However, the ash content of the humic-substance fraction was much greater with this modified procedure because
SAMPLING CRUISE 3, MAY-JUNE 1988 23
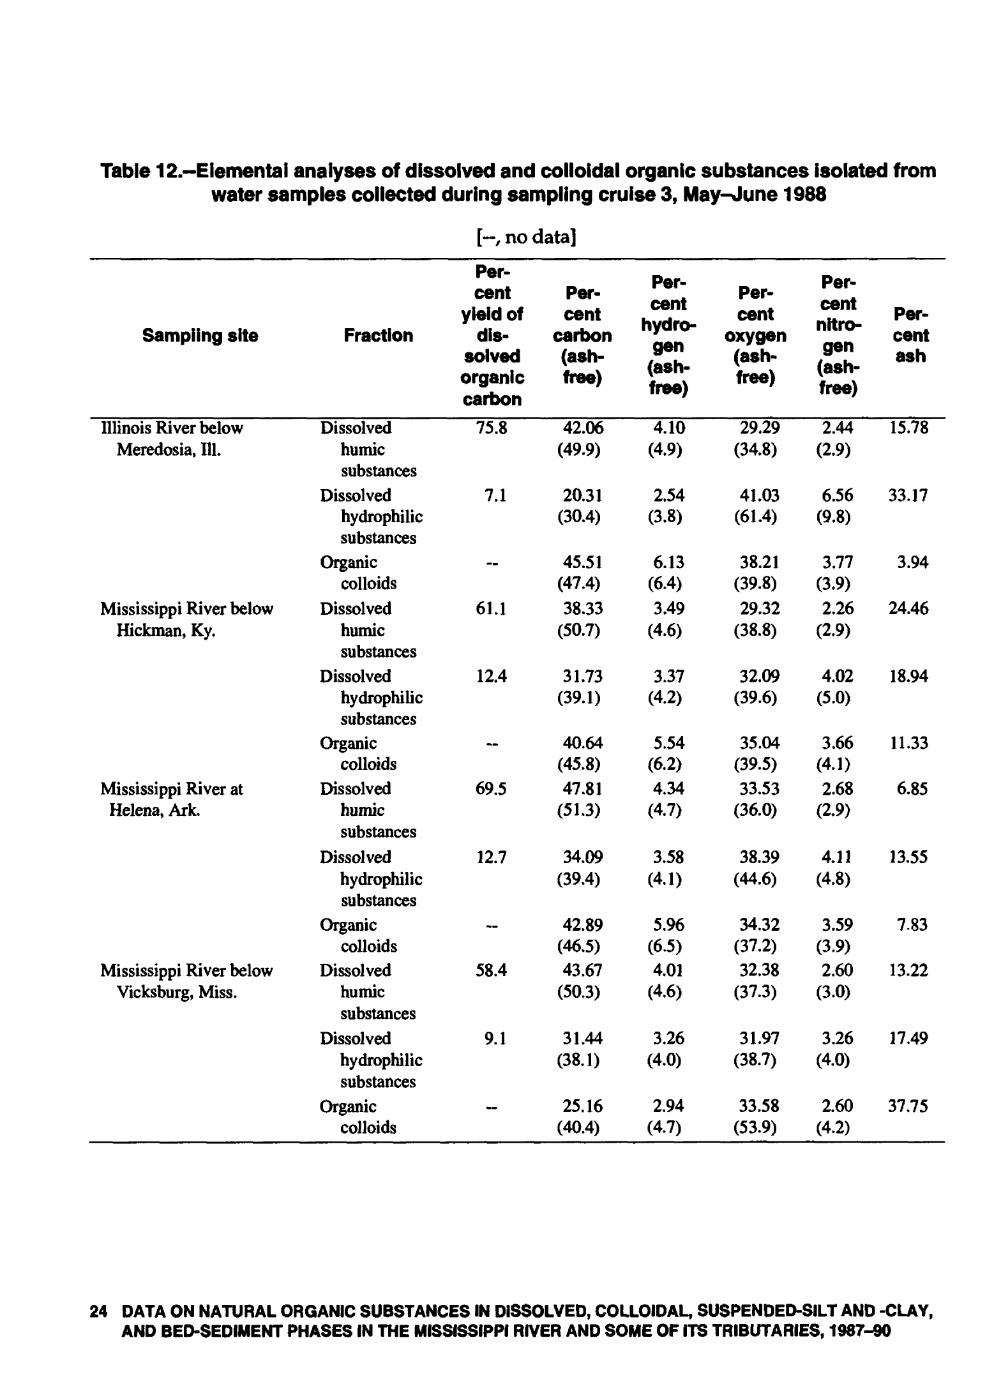
Table 12.-Elemental analyses of dissolved and colloidal organic substances isolated from water samples collected during sampling cruise 3, May-June 1988
[ , no data]
Sampling site
Illinois River belowMeredosia, 111.
Mississippi River belowHickman, Ky.
Mississippi River atHelena, Ark.
Mississippi River belowVicksburg, Miss.
Fraction
Dissolvedhumicsubstances
Dissolvedhydrophilicsubstances
Organiccolloids
Dissolvedhumicsubstances
Dissolvedhydrophilicsubstances
Organiccolloids
Dissolvedhumicsubstances
Dissolvedhydrophilicsubstances
Organiccolloids
Dissolvedhumicsubstances
Dissolvedhydrophilicsubstances
Organiccolloids
Per cent
yield of dis
solved organic carbon
75.8
7.1
61.1
12.4
69.5
12.7
58.4
9.1
Per cent
carbon (ash- free)
42.06(49.9)
20.31(30.4)
45.51(47.4)38.33
(50.7)
31.73(39.1)
40.64(45.8)47.81
(51.3)
34.09(39.4)
42.89(46.5)43.67
(50.3)
31.44(38.1)
25.16(40.4)
Per cent
hydro gen (ash- free)
4.10(4.9)
2.54(3.8)
6.13(6.4)3.49
(4.6)
3.37(4.2)
5.54(6.2)4.34
(4.7)
3.58(4.1)
5.96(6.5)4.01
(4.6)
3.26(4.0)
2.94(4.7)
Per cent
oxygen (ash- free)
29.29(34.8)
41.03(61.4)
38.21(39.8)29.32
(38.8)
32.09(39.6)
35.04(39.5)33.53
(36.0)
38.39(44.6)
34.32(37.2)32.38
(37.3)
31.97(38.7)
33.58(53.9)
Per cent nitro gen
(ash- free)
2.44(2.9)
6.56(9.8)
3.77(3.9)2.26
(2.9)
4.02(5.0)
3.66(4.1)2.68
(2.9)
4.11(4.8)
3.59(3.9)2.60
(3.0)
3.26(4.0)
2.60(4.2)
Per cent ash
15.78
33.17
3.94
24.46
18.94
11.33
6.85
13.55
7.83
13.22
17.49
37.75
24 DATA ON NATURAL ORGANIC SUBSTANCES IN DISSOLVED, COLLOIDAL, SUSPENDED-SILT AND -CLAY, AND BED-SEDIMENT PHASES IN THE MISSISSIPPI RIVER AND SOME OF ITS TRIBUTARIES, 1987-90
of incomplete removal of dissolved inorganic salts. This high ash content obviated the molecular weight and acidity determinations. The humic-substance fraction (ash-free data) has small shifts toward lower carbon, greater oxygen, and greater nitrogen percentages than for humic isolates from the previous two cruises. These elemental shifts indicate the modified procedure added small quantities of more hydrophilic substances to the dissolved humic-substance fraction.
The hydrophilic-substance fraction yields average only 10.3 percent, but it is likely the proce dural yields are only 50 percent because of losses during precipitation, centrifugation, washing, drying, and weighing steps in the procedure. Therefore, the actual percentage of this fraction probably is closer to 20 percent or greater. The hydrophilic-substance fraction has lower carbon and hydrogen percentages and greater oxygen and nitrogen percentages than the dissolved humic-substance fraction. The ratio of carbon to oxygen is similar to carbohydrate substances. The high percentage of nitrogen suggests amino and amide substituents in the mixture. Nitrate ion also was not completely separated by the desalting process.
The organic-colloid fraction has a unique elemental signature compared to the dissolved- substance fraction. The high hydrogen percentage is unusual for a degraded fraction; therefore, the colloidal organic material may not be appreciably degraded.
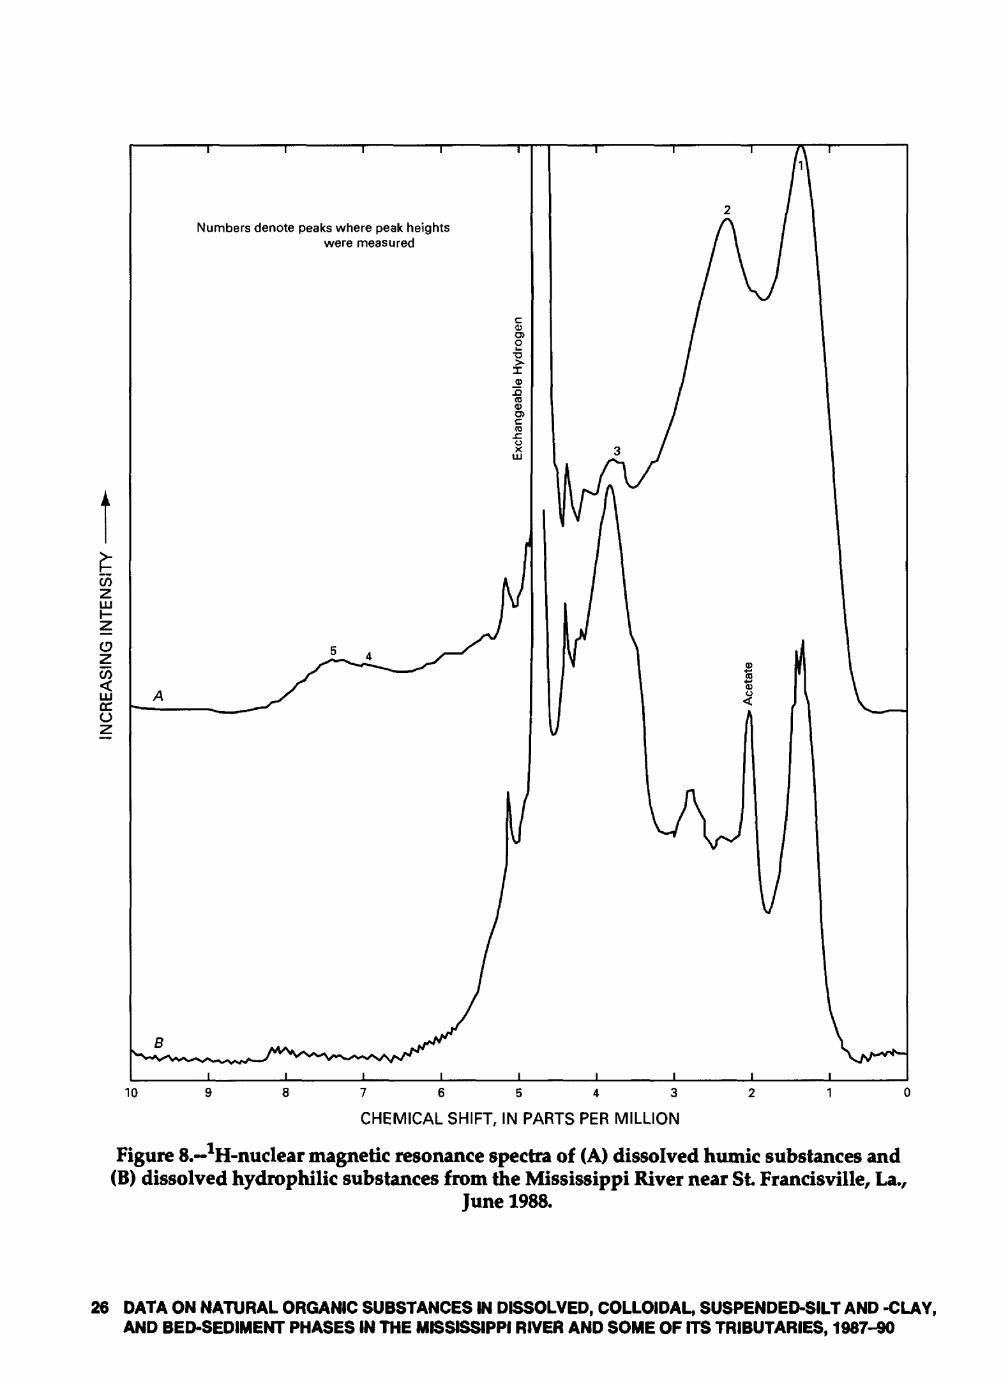
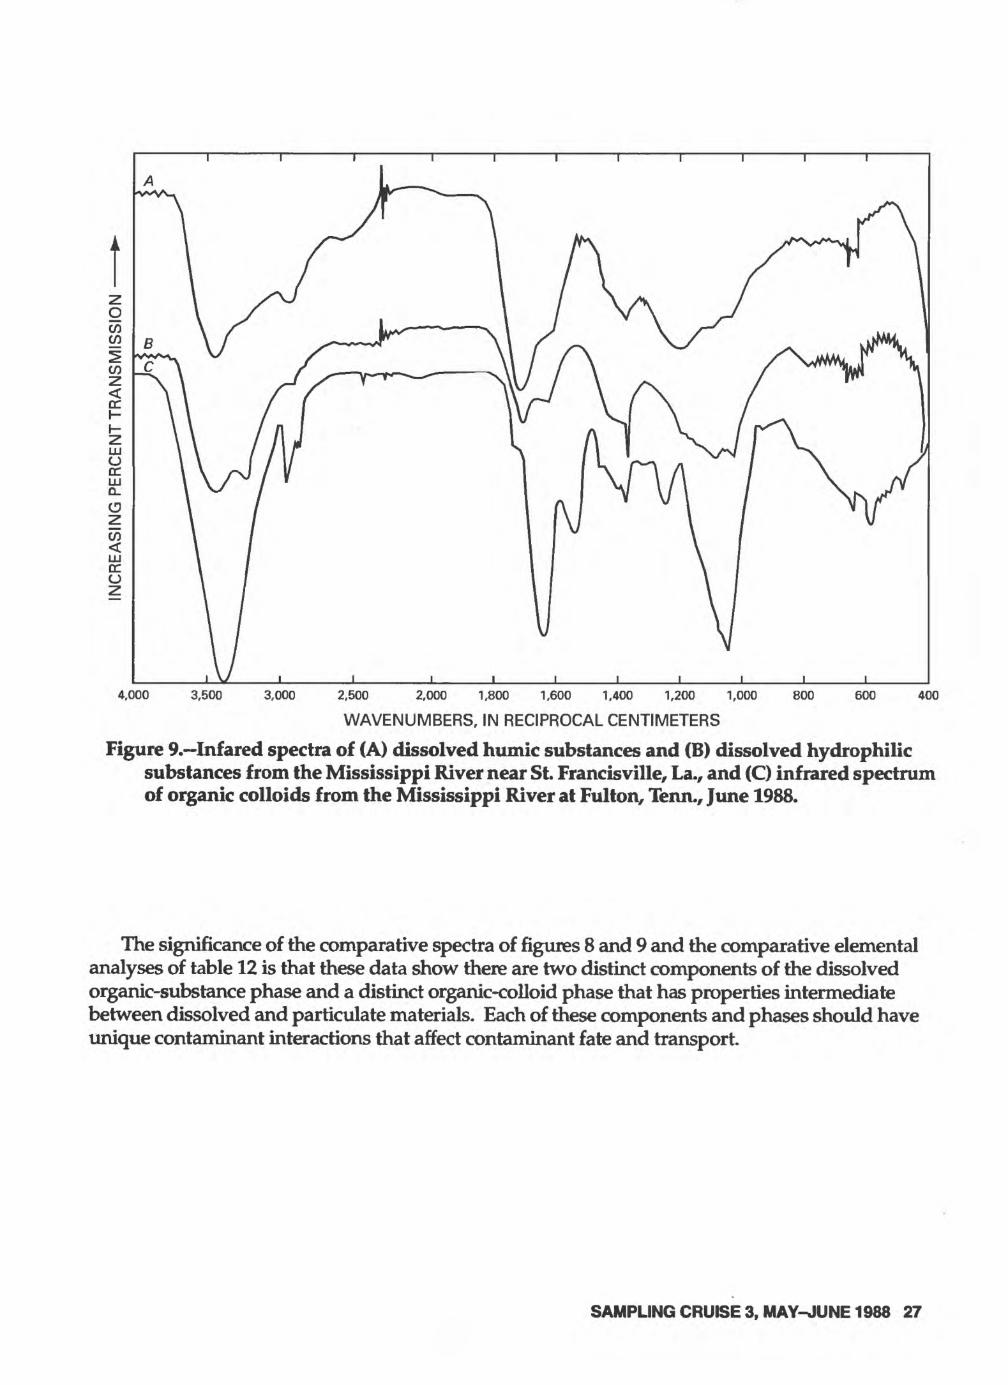
Spectrometric characterizations of the dissolved and organic colloid fractions isolated fromthe Mississippi River during sampling cruise 3 are shown in figure 8 (1H-NMR) and figure 9 (IR). Dissolved hydrophilic substances are very different from dissolved humic substances, as shown in figure 8 and 9. Dissolved hydrophilic substances are predominantly carbohydrates (peak 3 in spectrum B, fig. 8). In the IR spectrum of the dissolved hydrophilic-substance fraction (spectrum B, fig. 9), the presence of a carboxylic acid peak near 1,720 cm"1, and the shape of the carbohydrate peak near 1,100 cm'1 indicate that the hemiacetal linkage in carbohydrates has been partiallyoxidized to acid carboxyl groups. The small peak at 2.8 ppm in the 1H-NMR spectrum and the peak at 1,650 in the IR spectrum are probable indicators of amide structures in the dissolved hydrophilic-substance fraction.
The dissolved humic-substance fraction is similar to humic-substance fractions isolated from the Mississippi River during the previous two sampling cruises. The alteration of the isolation procedure in which the column capacity factor (k1) of recovered solutes was lowered by a factor of 10 caused a small increase in peaks 2 and 3 (fig. 8, spectrum A) that is related to more hydro philic structures, but the changes in overall character of the spectrum were relatively minor. The character of the fulvic acid, determined by calculating the peak height ratio of peaks 2,3,4, and 5 to peak 1 (spectrum A, fig. 8) is more similar to the fulvic acids characterized for sampling cruise 2 than sampling cruise 1. The high water temperatures of cruise 1 may have resulted in exception ally degraded humic substances with unique 1H-NHR spectral features.
The infrared spectra of organic-colloid fraction indicate a material composed of undegraded carbohydrates (peaks at 3,400 and 1,040 cm"1), hydrocarbons (peak at 2,930 cm"1), and proteins(peaks at 1,650 and 1,550 cm"1) (fig. 9). Chemically, the colloid can be described as a glycolipopro- tein. A scanning electron micrograph of the organic-colloid fraction (fig. 10) shows that the mate rial consists predominantly of bacteria cells. Therefore, the interpretation of the spectral data of the colloid as being an undegraded glycolipoprotein is correct, as bacteria are glycolipoproteins.
SAMPLING CRUISE 3, MAY-JUNE 1988 25
W)zLU
zCrt<LUcc u
Numbers denote peaks where peak height were measured
76543
CHEMICAL SHIFT, IN PARTS PER MILLION
Figure 8. ^-nuclear magnetic resonance spectra of (A) dissolved humic substances and (B) dissolved hydrophilic substances from the Mississippi River near St. Francisville, La.,
June 1988.
26 DATA ON NATURAL ORGANIC SUBSTANCES IN DISSOLVED, COLLOIDAL, SUSPENDED-SILT AND -CLAY, AND BED-SEDIMENT PHASES IN THE MISSISSIPPI RIVER AND SOME OF ITS TRIBUTARIES, 1987-90
800 600 4004,000 3,500 3,000 2,500 2,000 1,800 1,600 1,400 1,200 1,000
WAVENUMBERS, IN RECIPROCAL CENTIMETERS
Figure 9. Infared spectra of (A) dissolved humic substances and (8) dissolved hydrophilic substances from the Mississippi River near St. Francisville, La., and (C) infrared spectrum of organic colloids from the Mississippi River at Fulton, Tenn., June 1988.
The significance of the comparative spectra of figures 8 and 9 and the comparative elemental analyses of table 12 is that these data show there are two distinct components of the dissolved organic-substance phase and a distinct organic-colloid phase that has properties intermediate between dissolved and particulate materials. Each of these components and phases should have unique contaminant interactions that affect contaminant fate and transport.
SAMPLING CRUISE 3, MAY-JUNE 1988 27
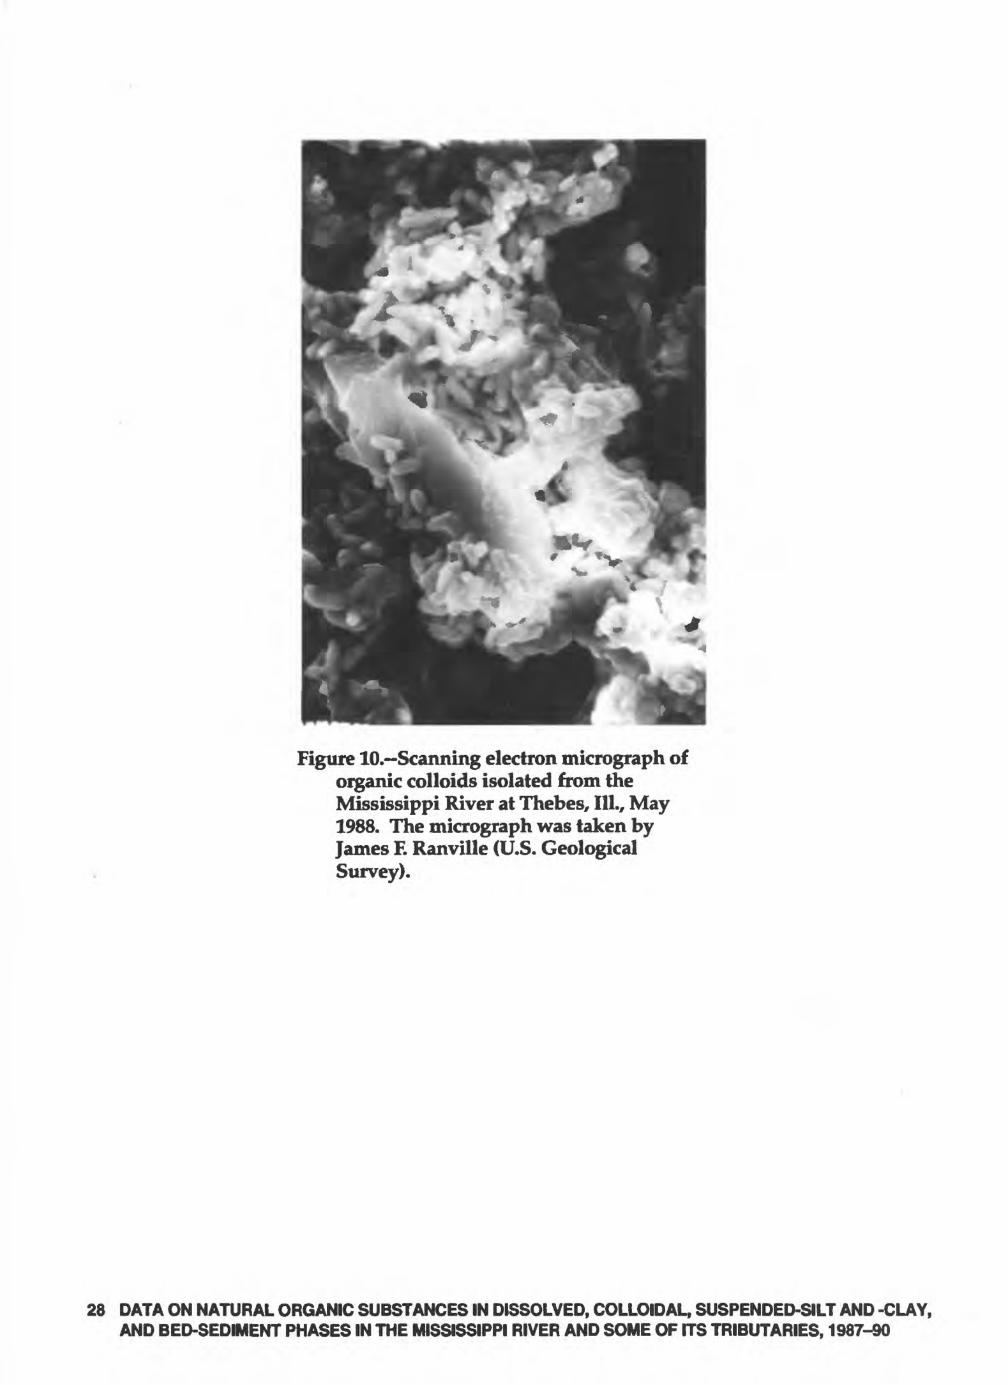
Figure 10.~Scanning electron micrograph of organic colloids isolated from the Mississippi River at Thebes, 111., May 1988. The micrograph was taken by James F. Ranville (U.S. Geological Survey).
28 DATA ON NATURAL ORGANIC SUBSTANCES IN DISSOLVED, COLLOIDAL, SUSPENDED-SILT AND -CLAY, AND BED-SEDIMENT PHASES IN THE MISSISSIPPI RIVER AND SOME OF ITS TRIBUTARIES, 1987-90
Organic Matter In Suspended-Sediment Fractions
The relative percentages of silt and clay, mineral colloids, and organic colloids in water samples collected during the May-June 1988 sampling cruise are given in table 13. As mentioned previously, use of the centrifuge rather than gravitational settling shifted the relative percentage of silt to 90 percent or greater for most samples. The Yazoo River, in which most of the colloids are disaggregated, contained a lower percentage of silt and clay, and the Mississippi River below Belle Chasse, La., contained a lower percentage of silt and clay because of sedimentation loss of the silt and clay fraction, which occurred during this low-flow period. The mineral-colloid fraction ranged between 1.6 to 9.2 percent of the total suspended-sediment weight, and the organic-colloid fraction ranged from 0.3 to 3.6 percent.
Table 13.-Relative percentages1 of silt and clay, mineral colloids,and organic colloids in the Mississippi River and some of its tributaries
for the May-June 1988 sampling cruise
[ND, not determined]
Sampling site
Mississippi River near Winfield, Mo.Illinois River below Meredosia, 111.Missouri River at Hermann, Mo.Mississippi River at St. Louis, Mo.Mississippi River at Thebes, 111.Ohio River at Olmsted, 111.Mississippi River below Hickman, Ky.Mississippi River at Fulton, Tenn.Mississippi River at Helena, Ark.White River at Mile 11.5, Ark.Mississippi River above Arkansas City, Ark.Yazoo River at Mile 10, Miss.Mississippi River below Vicksburg, Miss.Old River Outflow Channel near
Knox Landing, La.Mississippi River near St. Francisville, La.Mississippi River below Belle Chasse, La.
Percent siltand clay
(centrifuged)
91.397.396.495.094.793.096.397.395.391.294.387.294.094.0
95.981.6
Percent mineralcolloids
(ultrafiltered and
centrifuged)ND2.13.33.53.44.62.91.64.07.74.29.24.14.1
2.916.6
Percentorganiccolloids
(ultrafilteredand dialyzed)
ND0.5
.31.51.92.4
.81.1
.71.11.53.61.91.9
1.21.7
1 See table 29 for method of determining relative percentages.
SAMPLING CRUISE 3, MAY-JUNE 1988 29
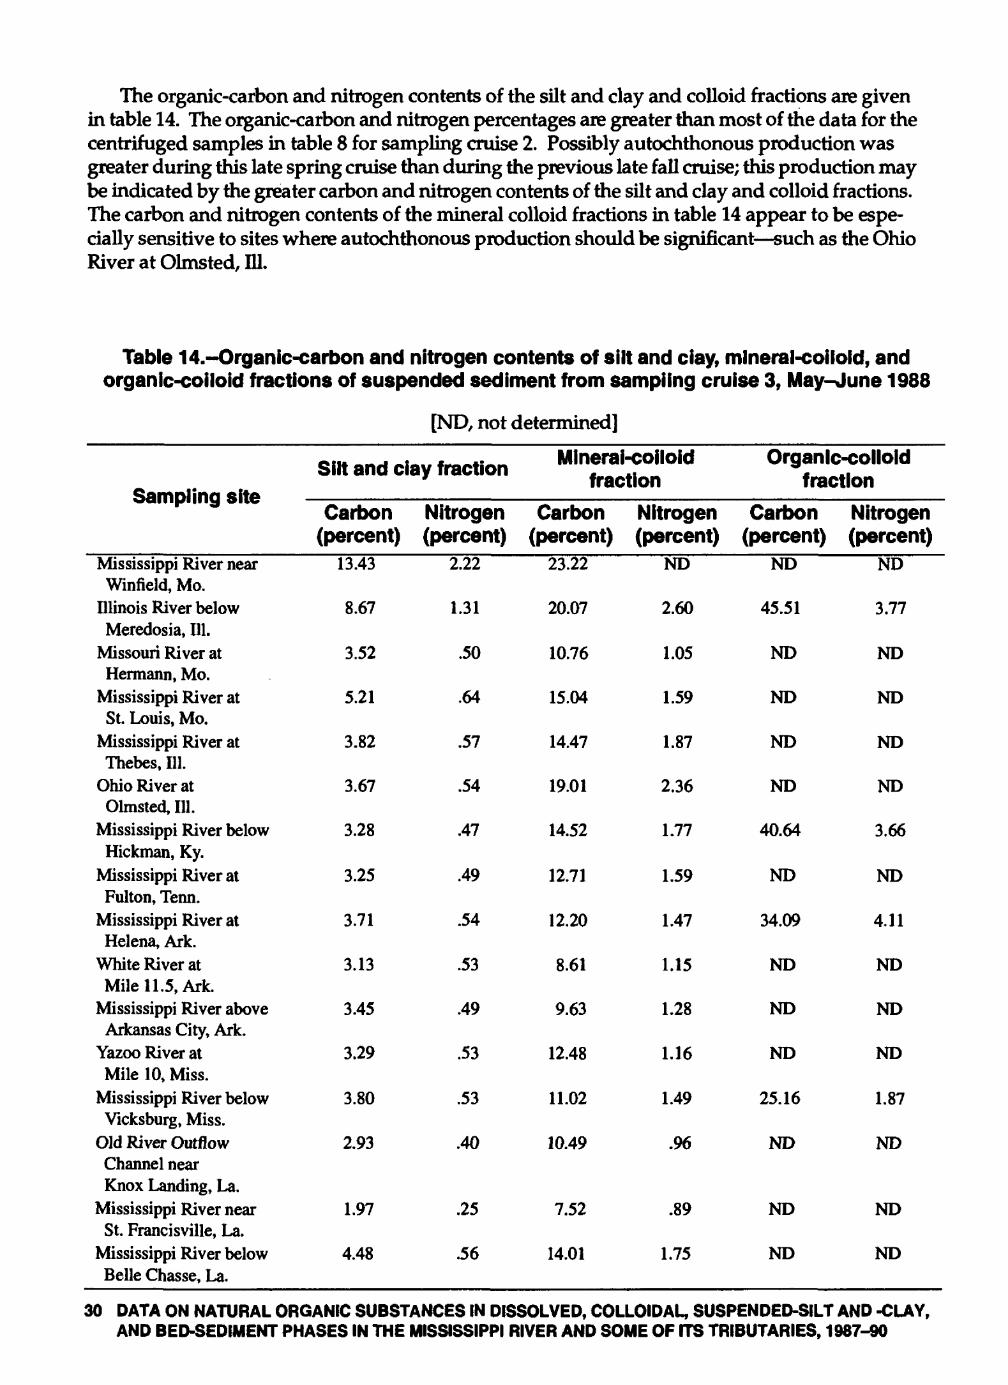
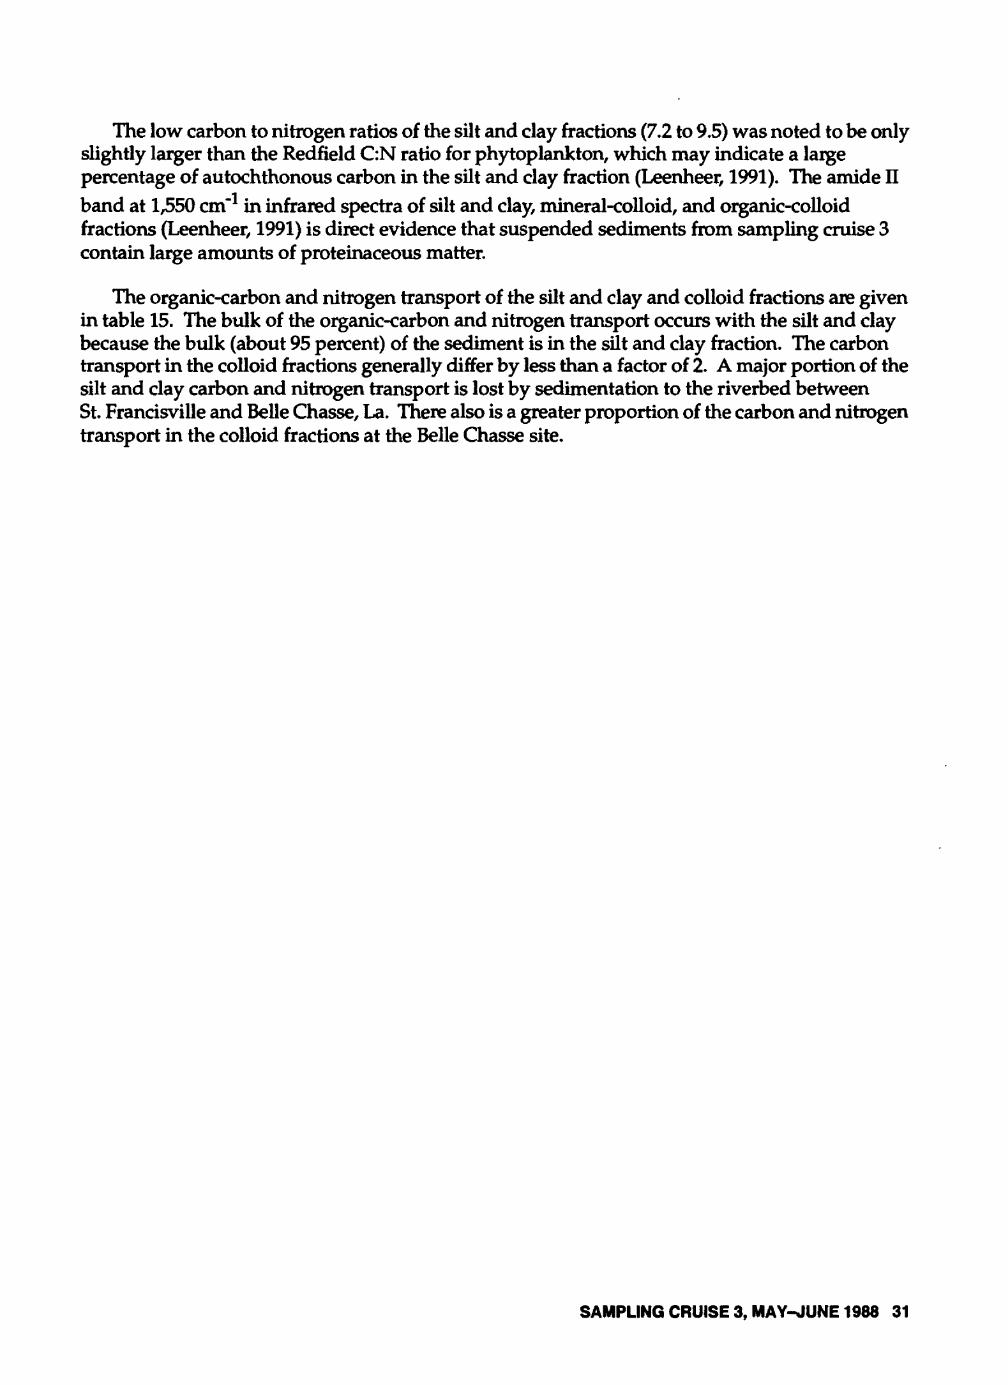
The organic-carbon and nitrogen contents of the silt and clay and colloid fractions are given in table 14. The organic-carbon and nitrogen percentages are greater than most of the data for the centrifuged samples in table 8 for sampling cruise 2. Possibly autochthonous production was greater during this late spring cruise than during the previous late fall cruise; this production may be indicated by the greater carbon and nitrogen contents of the silt and clay and colloid fractions. The carbon and nitrogen contents of the mineral colloid fractions in table 14 appear to be espe cially sensitive to sites where autochthonous production should be significant such as the Ohio River at Olmsted, m.
Table 14.-Organic-carbon and nitrogen contents off silt and clay, mineral-colloid, and organic-colloid fractions of suspended sediment from sampling cruise 3, May-June 1988
[ND, not determined]
Sampling site
Mississippi River near Winfield, Mo.
Illinois River belowMeredosia, 01.
Missouri River atHermann, Mo.
Mississippi River at St. Louis, Mo.
Mississippi River at Thebes, 111.
Ohio River atOlmsted, 111.
Mississippi River below Hickman, Ky.
Mississippi River at Fulton, Tenn.
Mississippi River at Helena, Ark.
White River atMile 11.5, Ark.
Mississippi River above Arkansas City, Ark.
Yazoo River atMile 10, Miss.
Mississippi River below Vicksburg, Miss.
Old River OutflowChannel nearKnox Landing, La.
Mississippi River near St. Francisville, La.
Mississippi River below Belle Chasse, La.
Silt and clay fraction
Carbon (percent)
13.43
8.67
3.52
5.21
3.82
3.67
3.28
3.25
3.71
3.13
3.45
3.29
3.80
2.93
1.97
4.48
Nitrogen (percent)
2.22
1.31
.50
.64
.57
.54
.47
.49
.54
.53
.49
.53
.53
.40
.25
.56
Mineral-colloid fraction
Carbon (percent)
23.22
20.07
10.76
15.04
14.47
19.01
14.52
12.71
12.20
8.61
9.63
12.48
11.02
10.49
7.52
14.01
Nitrogen (percent)
ND
2.60
1.05
1.59
1.87
2.36
1.77
1.59
1.47
1.15
1.28
1.16
1.49
.96
.89
1.75
Organic-colloid fraction
Carbon (percent)
ND
45.51
ND
ND
ND
ND
40.64
ND
34.09
ND
ND
ND
25.16
ND
ND
ND
Nitrogen (percent)
ND
3.77
ND
ND
ND
ND
3.66
ND
4.11
ND
ND
ND
1.87
ND
ND
ND
30 DATA ON NATURAL ORGANIC SUBSTANCES IN DISSOLVED, COLLOIDAL, SUSPENDED-SILT AND -CLAY, AND BED-SEDIMENT PHASES IN THE MISSISSIPPI RIVER AND SOME OF ITS TRIBUTARIES, 1987-90
The low carbon to nitrogen ratios of the silt and clay fractions (7.2 to 9.5) was noted to be only slightly larger than the Redfield ON ratio for phytoplankton, which may indicate a large percentage of autochthonous carbon in the silt and clay fraction (Leenheer, 1991). The amide IIband at 1,550 cm"1 in infrared spectra of silt and clay, mineral-colloid, and organic-colloid fractions (Leenheer, 1991) is direct evidence that suspended sediments from sampling cruise 3 contain large amounts of proteinaceous matter.
The organic-carbon and nitrogen transport of the silt and clay and colloid fractions are given in table 15. The bulk of the organic-carbon and nitrogen transport occurs with the silt and clay because the bulk (about 95 percent) of the sediment is in the sUt and clay fraction. The carbon transport in the colloid fractions generally differ by less than a factor of 2. A major portion of the silt and clay carbon and nitrogen transport is lost by sedimentation to the riverbed between St. Francisville and Belle Chasse, La. There also is a greater proportion of the carbon and nitrogen transport in the colloid fractions at the Belle Chasse site.
SAMPLING CRUISE 3, MAY-JUNE 1988 31
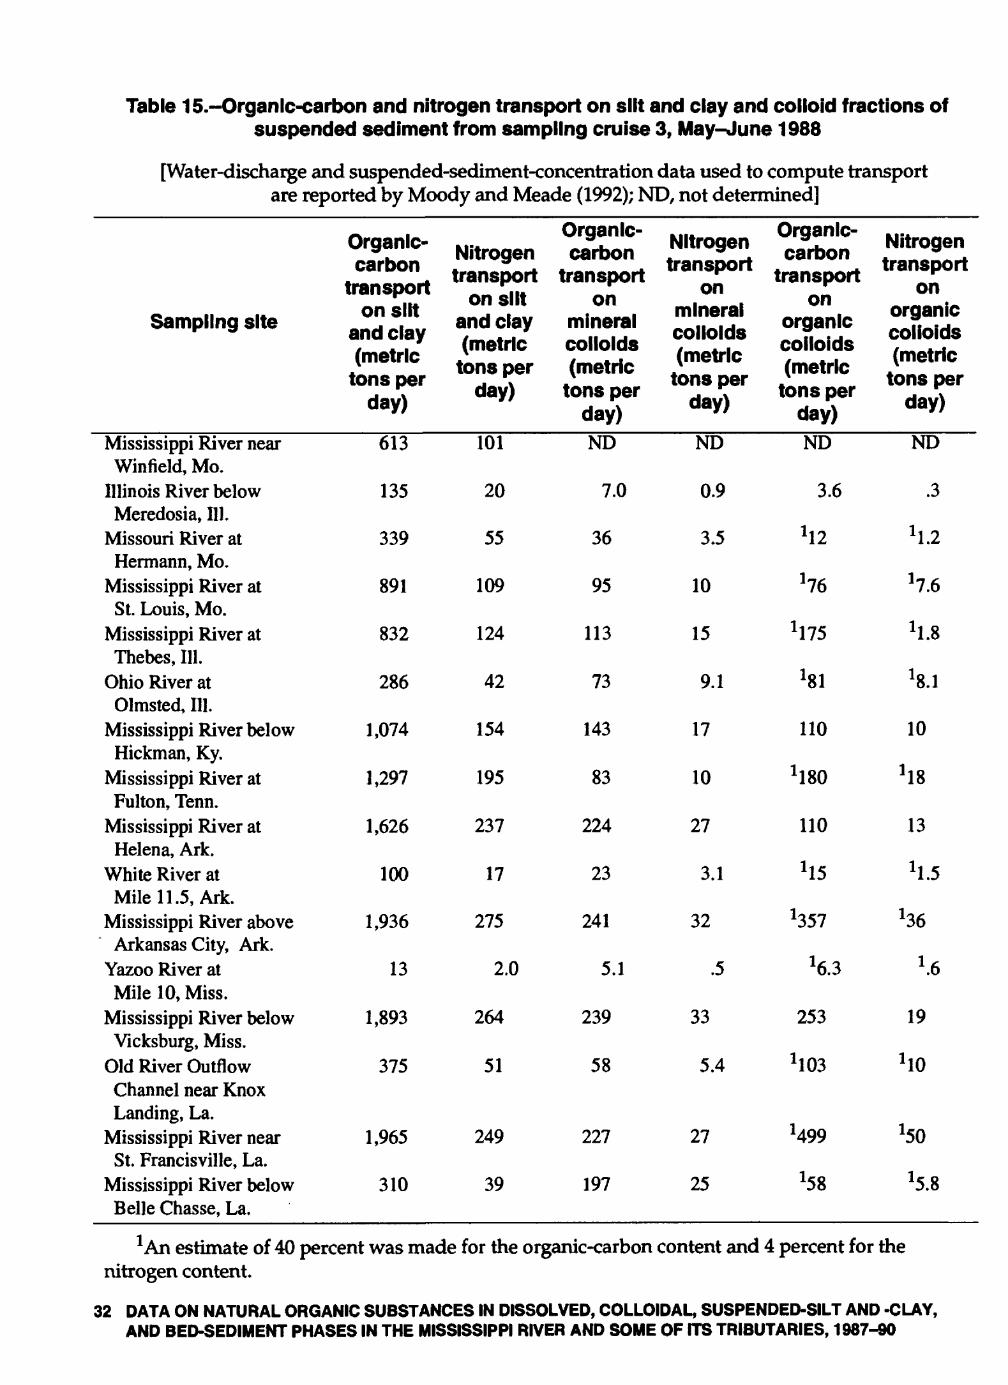
Table 15.-Organic-carbon and nitrogen transport on silt and clay and colloid fractions of suspended sediment from sampling cruise 3, May-June 1988
[Water-discharge and suspended-sediment-concentration data used to compute transport are reported by Moody and Meade (1992); ND, not determined]
Sampling site
Mississippi River nearWinfield, Mo.
Illinois River belowMeredosia, 111.
Missouri River atHermann, Mo.
Mississippi River atSt. Louis, Mo.
Mississippi River atThebes, 111.
Ohio River atOlmsted, 111.
Mississippi River belowHickman, Ky.
Mississippi River atFulton, Tenn.
Mississippi River atHelena, Ark.
White River atMile 11. 5, Ark.
Mississippi River aboveArkansas City, Ark.
Yazoo River atMile 10, Miss.
Mississippi River belowVicksburg, Miss.
Old River OutflowChannel near KnoxLanding, La.
Mississippi River nearSt. Francisville, La.
Mississippi River belowBelle Chasse, La.
Organic- carbon
transport on silt
and clay (metric
tons per day)
613
135
339
891
832
286
1,074
1,297
1,626
100
1,936
13
1,893
375
1,965
310
Nitrogen transport
on silt and clay (metric
tons per day)
101
20
55
109
124
42
154
195
237
17
275
2.0
264
51
249
39
Organic- carbon
transport on
mineral colloids (metric
tons per day)ND
7.0
36
95
113
73
143
83
224
23
241
5.1
239
58
227
197
Nitrogen transport
on mineral colloids (metric
tons per day)
ND
0.9
3.5
10
15
9.1
17
10
27
3.1
32
.5
33
5.4
27
25
Organic- carbon
transport on
organic colloids (metric
tons per day)ND
3.6
*12
i
76
1 175
'81
110
hso
110
hs
357
'6.3
253
hos
1499
'58
Nitrogen transport
on organic colloids (metric
tons per day)
ND
.3
1 1.2
1-7 f./.o
1 1.8
'8.1
10
h8
13
h.5
36
1 .6
19
ho
'50
'5.8
1 An estimate of 40 percent was made for the organic-carbon content and 4 percent for the nitrogen content.
32 DATA ON NATURAL ORGANIC SUBSTANCES IN DISSOLVED, COLLOIDAL, SUSPENDED-SILT AND -CLAY, AND BED-SEDIMENT PHASES IN THE MISSISSIPPI RIVER AND SOME OF ITS TRIBUTARIES, 1987-90
Concentrations of colloidal organic carbon determined by two independent methods for sampling cruise 3 are given in table 16. The difference determination of the left column is erratic because the variance of the organic-carbon determination (+0.1 mg/L) is large relative to the magnitude of the data values. There is not a large degree of variability for colloid organic-carbon concentrations at various sampling sites.
Table 16.-Concentrations of colloidal organic carbon for sampling cruise 3,May-June 1988
[ND, not determined]
Sampling site
Colloidal organiccarbon determined bytotal organic carbon of
centrifuge effluentminus dissolved
organic carbon ofultrafilter permeate
(milligrams per liter)
Colloidal organiccarbon determined
from carbon analysisof isolated colloid
fractions (milligrams per liter)
Mississippi River near Winfield, Mo.Illinois River below Meredosia, 111.Missouri River at Hermann, Mo.Mississippi River St. Louis, Mo.Mississippi River at Thebes, 111.Ohio River at Olmsted, 111.Mississippi River below Hickman, Ky.Mississippi River at Fulton, Tenn.Mississippi River at Helena, Ark.White River at Mile 11.5, Ark.Mississippi River above
Arkansas City, Ark.Yazoo River at Mile 10, Miss.Mississippi River below Vicksburg, Miss.Old River Outflow Channelnear Knox Landing, La.
Mississippi River nearSt. Francisville, La.
Mississippi River below Belle Chasse, La.
1.01.0.2.4.5.5ND.3.5.2.4
.40.00.0
0.0
.6
ND0.4
.4
.7
.9
.6
.4
.4
.51.0
.9
1.9.7.8
1.5
.5
SAMPLING CRUISE 3, MAY-JUNE 1988 33
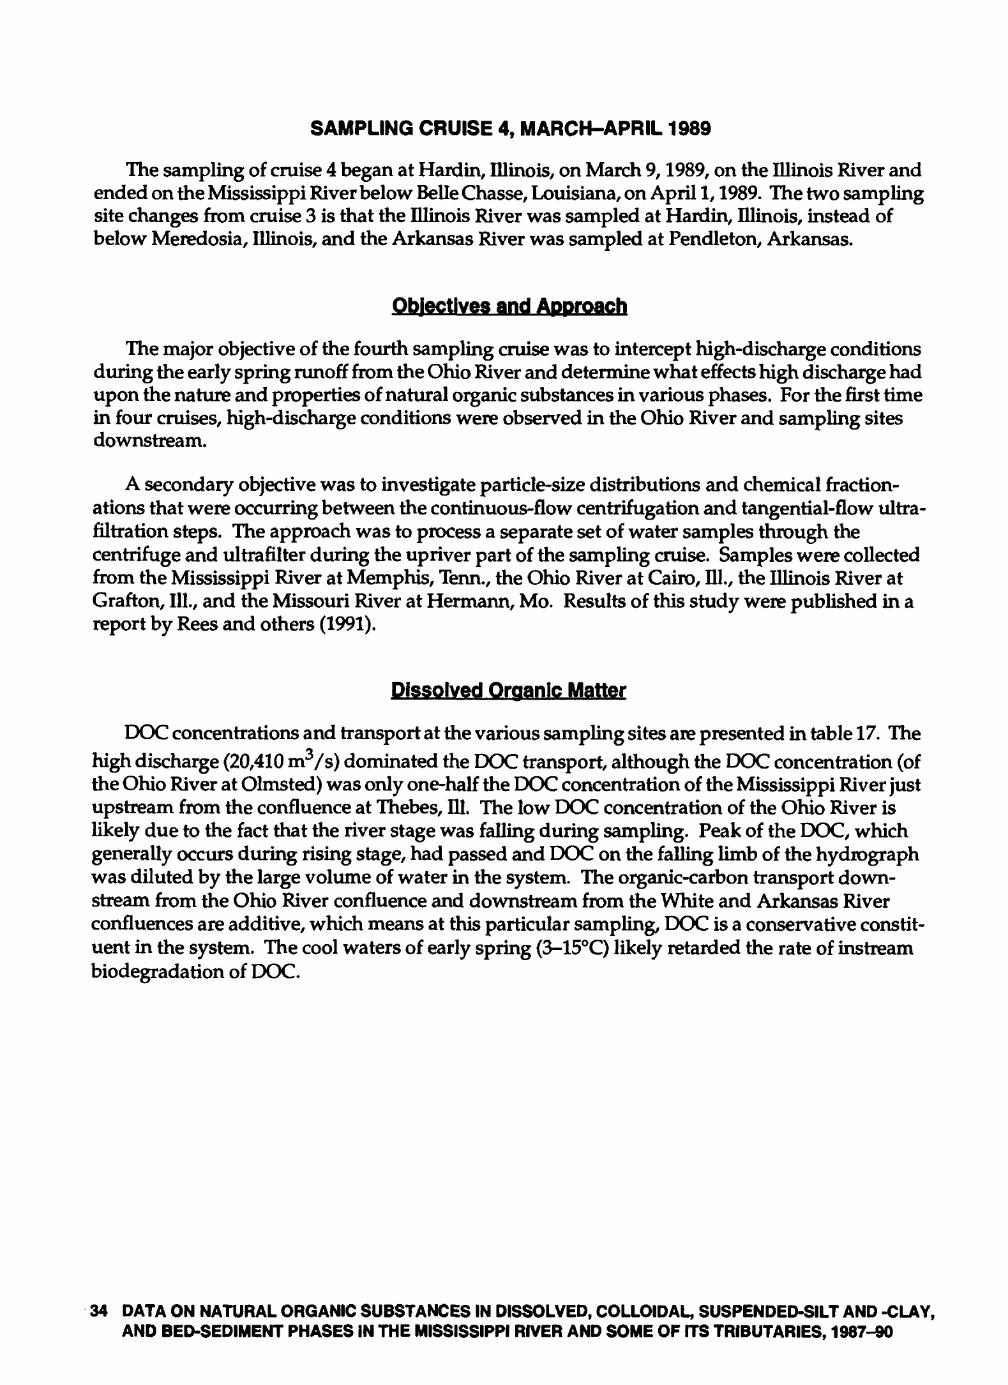
SAMPLING CRUISE 4, MARCH-APRIL 1989
The sampling of cruise 4 began at Hardin, Illinois, on March 9, 1989, on the Illinois River and ended on the Mississippi River below Belle Chasse, Louisiana, on April 1,1989. The two sampling site changes from cruise 3 is that the Illinois River was sampled at Hardin, Illinois, instead of below Meredosia, Illinois, and the Arkansas River was sampled at Pendleton, Arkansas.
Objectives and Approach
The major objective of the fourth sampling cruise was to intercept high-discharge conditions during the early spring runoff from the Ohio River and determine what effects high discharge had upon the nature and properties of natural organic substances in various phases. For the first time in four cruises, high-discharge conditions were observed in the Ohio River and sampling sites downstream.
A secondary objective was to investigate particle-size distributions and chemical fraction- ations that were occurring between the continuous-flow centrifugation and tangential-flow ultra- filtration steps. The approach was to process a separate set of water samples through the centrifuge and ultrafilter during the upriver part of the sampling cruise. Samples were collected from the Mississippi River at Memphis, Term., the Ohio River at Cairo, HI., the Illinois River at Grafton, 111., and the Missouri River at Hermann, Mo. Results of this study were published in a report by Rees and others (1991).
Dissolved Organic Matter
DOC concentrations and transport at the various sampling sites are presented in table 17. Thehigh discharge (20,410 m3/s) dominated the DOC transport, although the DOC concentration (of the Ohio River at Olmsted) was only one-half the DOC concentration of the Mississippi River just upstream from the confluence at Thebes, HI. The low DOC concentration of the Ohio River is likely due to the fact that the river stage was falling during sampling. Peak of the DOC, which generally occurs during rising stage, had passed and DOC on the falling limb of the hydiograph was diluted by the large volume of water in the system. The organic-carbon transport down stream from the Ohio River confluence and downstream from the White and Arkansas River confluences are additive, which means at this particular sampling, DOC is a conservative constit uent in the system. The cool waters of early spring (3-15°C) likely retarded the rate of instream biodegradation of DOC.
34 DATA ON NATURAL ORGANIC SUBSTANCES IN DISSOLVED, COLLOIDAL, SUSPENDED-SILT AND -CLAY, AND BED-SEDIMENT PHASES IN THE MISSISSIPPI RIVER AND SOME OF ITS TRIBUTARIES, 1987-90
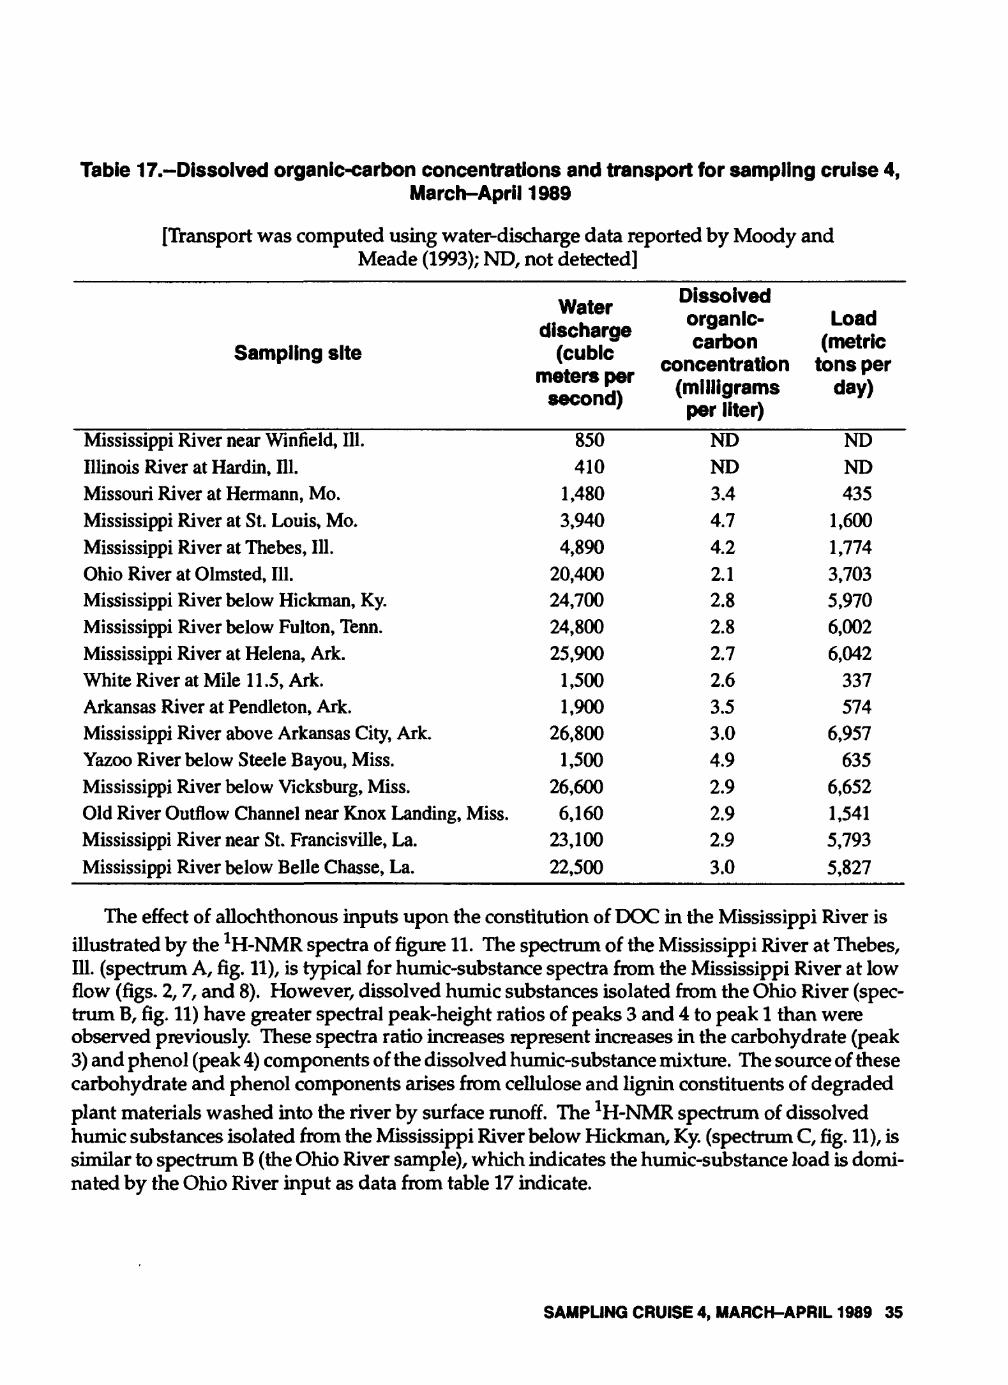
Table 1/.-Dissolved organic-carbon concentrations and transport for sampling cruise 4,March-April 1989
[Transport was computed using water-discharge data reported by MoodyMeade (1993); ND, not detected]
and
Sampling site
Mississippi River near Winfield, 111.Illinois River at Hardin, 111.Missouri River at Hermann, Mo.Mississippi River at St. Louis, Mo.Mississippi River at Thebes, 111.Ohio River at Olmsted, 111.Mississippi River below Hickman, Ky.Mississippi River below Fulton, Tenn.Mississippi River at Helena, Ark.White River at Mile 11.5, Ark.Arkansas River at Pendleton, Ark.Mississippi River above Arkansas City, Ark.Yazoo River below Steele Bayou, Miss.Mississippi River below Vicksburg, Miss. Old River Outflow Channel near Knox Landing, Miss.Mississippi River near St. Francisville, La.Mississippi River below Belle Chasse, La.
Water discharge
(cubic meters per second)
850410
1,4803,9404,890
20,40024,70024,80025,900
1,5001,900
26,8001,500
26,600 6,160
23,10022,500
Dissolved organic- carbon
concentration (milligrams per liter)
NDND3.44.74.22.12.82.82.72.63.53.04.92.9 2.92.93.0
Load (metric
tons per day)
NDND435
1,6001,7743,7035,9706,0026,042
337574
6,957635
6,652 1,5415,7935,827
The effect of allochthonous inputs upon the constitution of DOC in the Mississippi River isillustrated by the 1H-NMR spectra of figure 11. The spectrum of the Mississippi River at Thebes, HI. (spectrum A, fig. 11), is typical for humic-substance spectra from the Mississippi River at low flow (figs. 2,7, and 8). However, dissolved humic substances isolated from the Ohio River (spec trum B, fig. 11) have greater spectral peak-height ratios of peaks 3 and 4 to peak 1 than were observed previously. These spectra ratio increases represent increases in the carbohydrate (peak 3) and phenol (peak 4) components of the dissolved humic-substance mixture. The source of these carbohydrate and phenol components arises from cellulose and lignin constituents of degradedplant materials washed into the river by surface runoff. The 1H-NMR spectrum of dissolved humic substances isolated from the Mississippi River below Hickman, Ky. (spectrum C, fig. 11), is similar to spectrum B (the Ohio River sample), which indicates the humic-substance load is domi nated by the Ohio River input as data from table 17 indicate.
SAMPLING CRUISE 4, MARCH-APRIL 1989 35
en
2 C/3 <LU DC O
Numbers denote peaks where peak heights were measured
76543
CHEMICAL SHIFT, IN PARTS PER MILLION
Figure 11. 1H-nuclear magnetic resonance spectra of dissolved humic substances from the: (A) Mississippi River at Thebes, 111., (B) Ohio River at Olmsted, 111., and (C) Mississippi River below Hickman, Ky., sampled March 1989.
36 DATA ON NATURAL ORGANIC SUBSTANCES IN DISSOLVED, COLLOIDAL, SUSPENDED-SILT AND -CLAY, AND BED-SEDIMENT PHASES IN THE MISSISSIPPI RIVER AND SOME OF ITS TRIBUTARIES, 1987-90
Additional allochthonous inputs of dissolved humic substances occurred downstream from the Ohio River confluence on this fourth sampling cruise. High discharges from the White, Arkansas, and Yazoo Rivers added additional humic substances derived from allochthonoussources. The 1H-NMR spectra of dissolved humic substances isolated from the White River, the Yazoo River, and the Mississippi River below Belle Chasse, La., are shown in figure 12. The greatest spectral ratios of peaks 2,3,4, and 5 to peak 1 for dissolved humic substances character ized from the Mississippi River and its tributaries were observed for the White River and Yazoo River samples. The sample from the Mississippi River at Belle Chasse, La., (spectrum C, fig. 12) had greater spectral ratios of peaks 2,3,4, and 5 to peak 1 than the sample from the Mississippi River below Hickman, Ky. (spectrum C, fig. 11). These increases in spectral ratios clearly indicated increasing inputs of humic substances from allochthonous sources as sampling proceeded down stream in the Mississippi River.
Dissolved hydrophilic organic substances were also isolated and characterized during sampling cruise 4. No significant differences were observed for either the proportion (yield) ornature (1H-NMR spectra) of these dissolved hydrophilic substances isolated during sampling cruise 4 from those isolated and characterized during sampling cruise 3.
Organic Matter in Suspended-Sediment Fractions
The relative percentages of silt and clay, mineral colloids, and organic colloids in the Missis sippi River for the March-April 1989 sampling cruise are given in table 18. Because of the coarse silt and clay fraction lost from the centrifuge during the shutdown procedure, suspended-sedi ment weights for the silt and clay fraction from the pumped composite sample rather than the depth-integrated composite sample were used for the calculations in table 18. Because of the smaller volume processed, the depth-integrated composite sample had a larger loss of the coarse silt fraction than the pumped composite sample, and the silt and clay percentages were 1-2 percent lower for the depth-integrated composite fraction.
The relative size distribution of silt and clay and colloid fractions was similar to data from sampling cruise 3 (table 13), with two exceptions: (1) The organic-colloid percentage from the Mississippi River near Winfield, 111., was exceptionally high compared to other sites. These data indicate a large bacteria population in the river at this point. (2) The mineral-colloid percentages were high for the White and Yazoo Rivers. High discharge and low specific conductance (White River, 150 nS/cm at 25°C; Yazoo River, 80 nS/cm at 25°C) may have disaggregated clay-mineral aggregates that normally isolate in the silt and clay fraction (Rees and others, 1991), so that they are recovered in the mineral-colloid fraction. Most silt and clay in Mississippi River samples was found to be aggregated colloidal material (Rees and others, 1991).
Organic-carbon, nitrogen, and fluorine contents of the silt and clay and mineral-colloid frac tions from the March-April 1989 sampling cruise are shown in table 19. Fluorine determinations were run on the silt and clay fraction because infrared analyses of this fraction suggested the pres ence of Teflon in the silt and clay fraction; the Teflon contamination may have occurred because of wear of a Teflon bushing and nozzle in the continuous-flow centrifuge. Fluorine was detected, but levels were low enough so that effects on carbon contents were minor, as carbon is only 31 percent of the fluorine content in Teflon.
SAMPLING CRUISE 4, MARCH-APRIL 1989 37
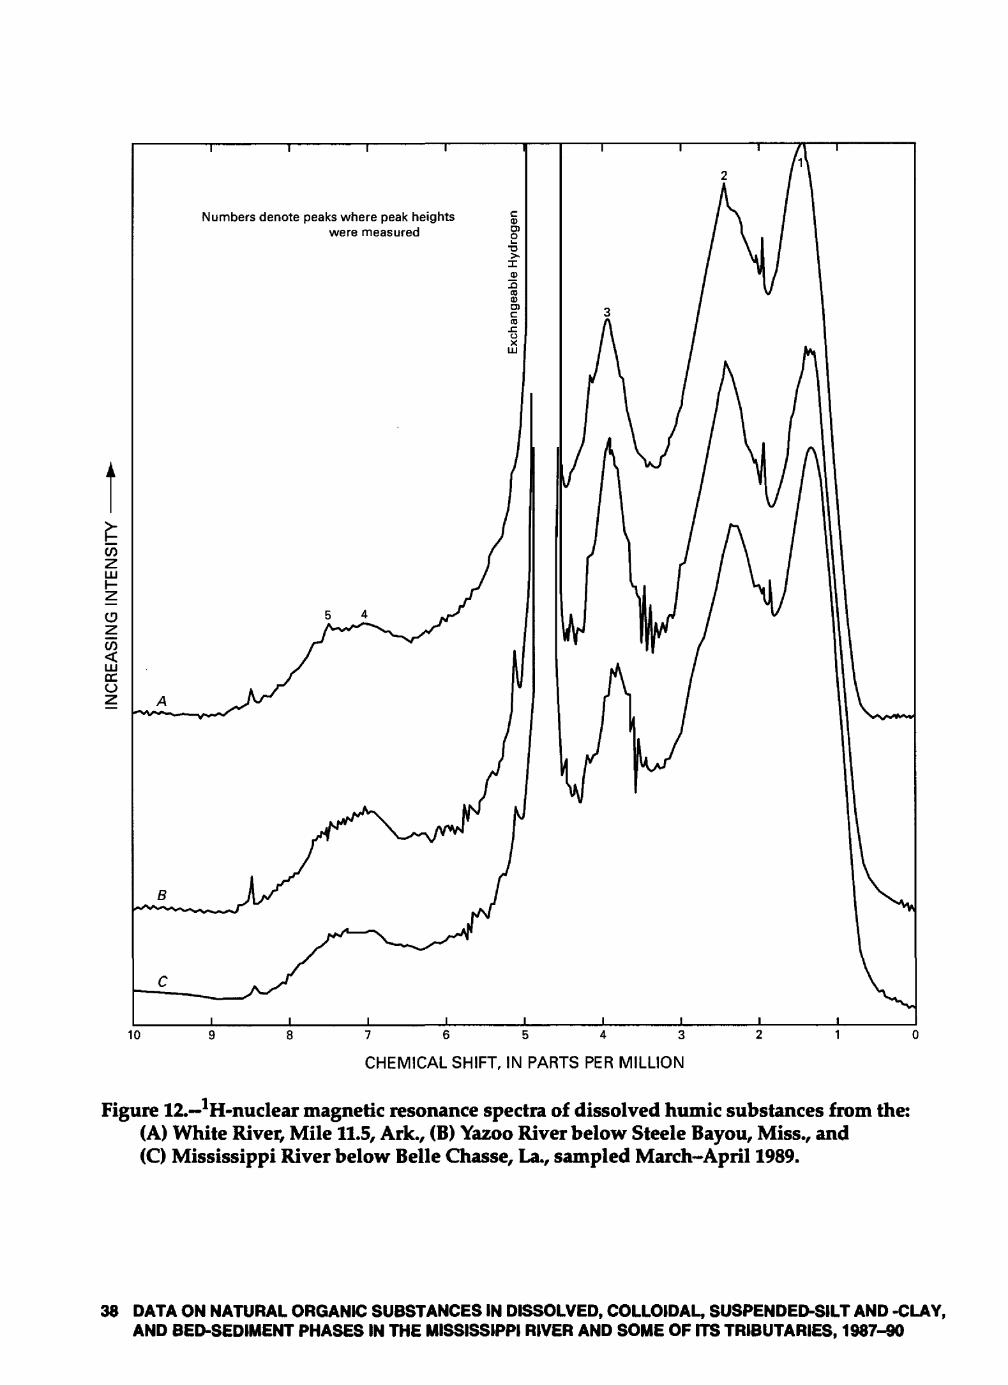
g I? °^ o>«
m O i is
INC
RE
AS
ING
IN
TE
NS
ITY
r
20
1^
M O
m ^ il Is
ig m O
3D O ii o SI
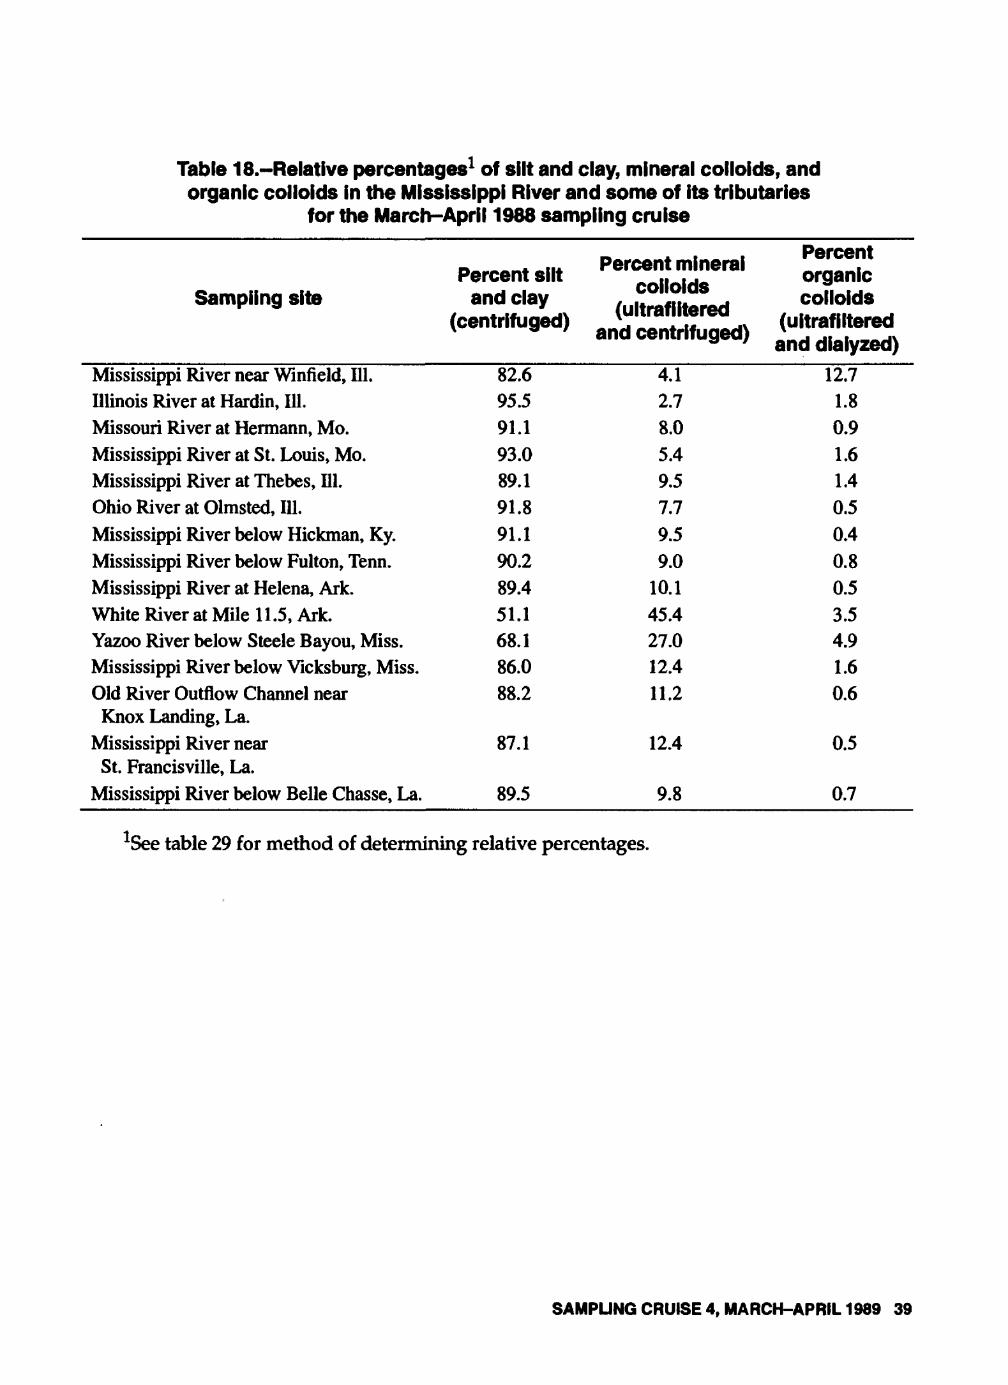
Table 18.-Relative percentages1 of silt and clay, mineral colloids, andorganic colloids in the Mississippi River and some of its tributaries
for the March-April 1988 sampling cruise
Percent silt Sampling site and clay
(centrifuged)
Mississippi River near Winfield, 111.Illinois River at Hardin, 111.Missouri River at Hermann, Mo.Mississippi River at St. Louis, Mo.Mississippi River at Thebes, 111.Ohio River at Olmsted, 111.Mississippi River below Hickman, Ky.Mississippi River below Fulton, Tenn.Mississippi River at Helena, Ark.White River at Mile 11.5, Ark.Yazoo River below Steele Bayou, Miss.Mississippi River below Vicksburg, Miss.Old River Outflow Channel near
Knox Landing, La.Mississippi River near
St. Francisville, La.Mississippi River below Belle Chasse, La.
82.695.591.193.089.191.891.190.289.451.168.186.088.2
87.1
89.5
Percent mineral colloids
(ultrafiitered and centrifuged)
4.12.78.05.49.57.79.59.0
10.145.427.012.411.2
12.4
9.8
Percent organic colloids
(uitrafiltered and diaiyzed)
12.71.80.91.61.40.50.40.80.53.54.91.60.6
0.5
0.7
1See table 29 for method of determining relative percentages.
SAMPLING CRUISE 4, MARCH-APRIL 1989 39
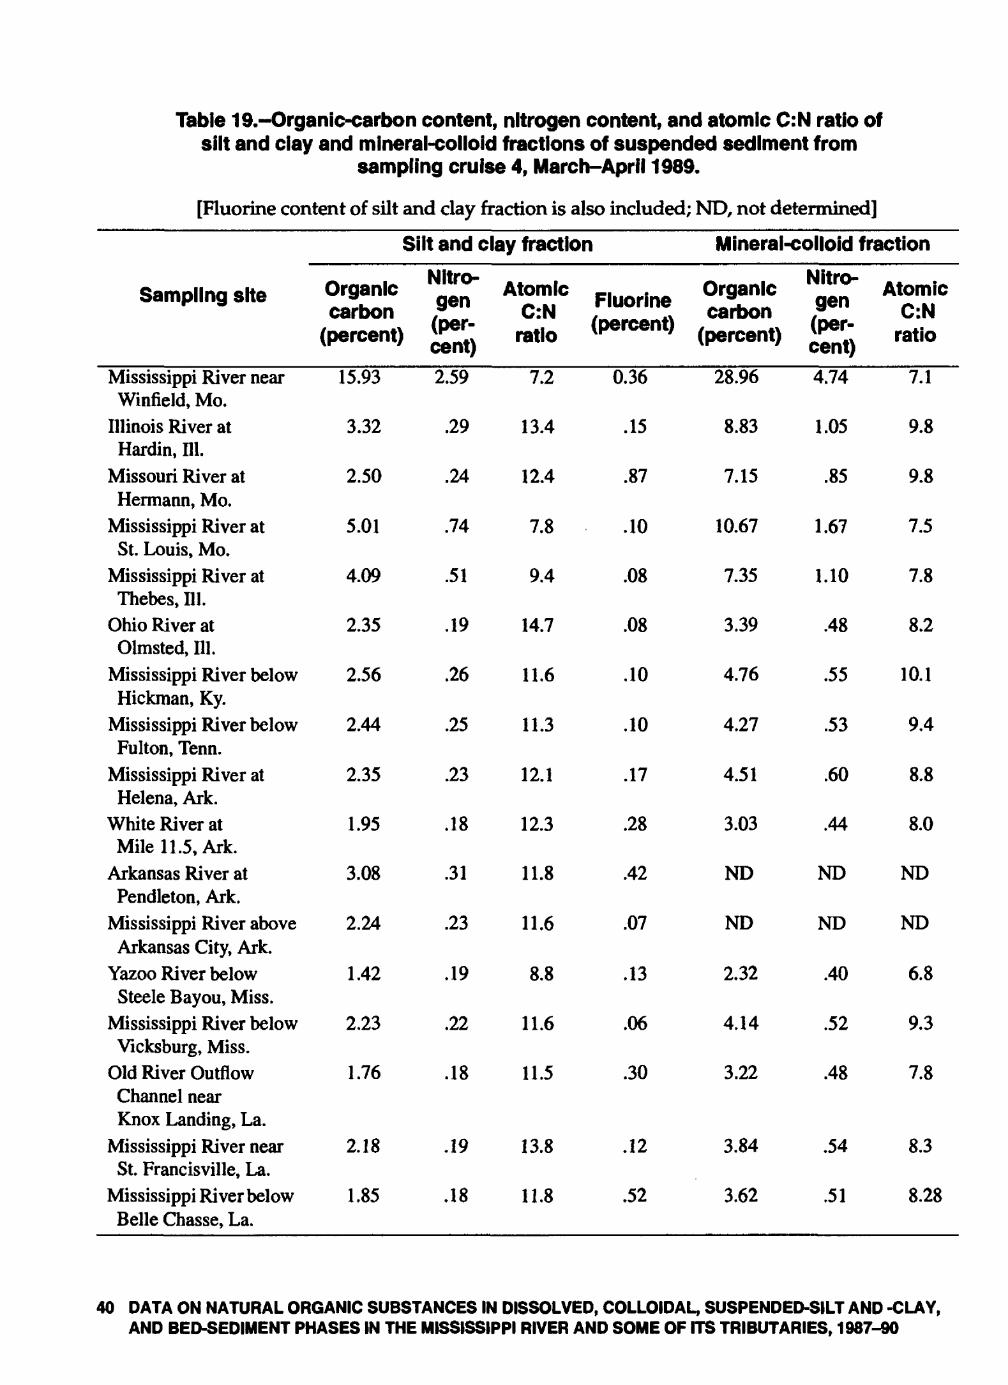
Table 19.-Organic-carbon content, nitrogen content, and atomic C:N ratio ofsilt and clay and mineral-colloid fractions of suspended sediment from
sampling cruise 4, March-April 1989.
[Fluorine coment or silt imd clay rraction is a][so includec
Silt and clay fraction
Sampling site
Mississippi River near Winfield, Mo.
Illinois River atHardin, 111.
Missouri River atHermann, Mo.
Mississippi River at St. Louis, Mo.
Mississippi River at Thebes, 111.
Ohio River atOlmsted, 111.
Mississippi River below Hickman, Ky.
Mississippi River below Fulton, Tenn.
Mississippi River at Helena, Ark.
White River atMile 11. 5, Ark.
Arkansas River atPendleton, Ark.
Mississippi River above Arkansas City, Ark.
Yazoo River belowSteele Bayou, Miss.
Mississippi River below Vicksburg, Miss.
Old River OutflowChannel nearKnox Landing, La.
Mississippi River near St. Francisville, La.
Mississippi River below Belle Chasse, La.
Organic carbon
(percent)
15.93
3.32
2.50
5.01
4.09
2.35
2.56
2.44
2.35
1.95
3.08
2.24
1.42
2.23
1.76
2.18
1.85
Nitro gen (per cent)2.59
.29
.24
.74
.51
.19
.26
.25
.23
.18
.31
.23
.19
.22
.18
.19
.18
Atomic C:N
ratio
7.2
13.4
12.4
7.8
9.4
14.7
11.6
11.3
12.1
12.3
11.8
11.6
8.8
11.6
11.5
13.8
11.8
Fluorine (percent)
0.36
.15
.87
.10
.08
.08
.10
.10
.17
.28
.42
.07
.13
.06
.30
.12
.52
I; ND, not d<2terminedJ1
Mineral-colloid fraction
Organic carbon
(percent)
28.96
8.83
7.15
10.67
7.35
3.39
4.76
4.27
4.51
3.03
ND
ND
2.32
4.14
3.22
3.84
3.62
Nitro gen (per cent)4.74
1.05
.85
1.67
1.10
.48
.55
.53
.60
.44
ND
ND
.40
.52
.48
.54
.51
Atomic C:N
ratio
7.1
9.8
9.8
7.5
7.8
8.2
10.1
9.4
8.8
8.0
ND
ND
6.8
9.3
7.8
8.3
8.28
40 DATA ON NATURAL ORGANIC SUBSTANCES IN DISSOLVED, COLLOIDAL, SUSPENDED-SILT AND -CLAY, AND BED-SEDIMENT PHASES IN THE MISSISSIPPI RIVER AND SOME OF ITS TRIBUTARIES, 1987-90
The contrast between allochthonous inputs and autochthonous inputs to carbon and nitrogen in the silt and clay and colloid fractions is especially apparent among the different sampling sites. Sites where autochthonous inputs dominate (Mississippi River near Winfield, at St. Louis, and at Thebes) are characterized by high contents of carbon and nitrogen on the suspended-sediment fractions and by low C:N ratios (table 19). The tributaries and other sites have low carbon and nitrogen contents and high C:N ratios except for the low C:N ratio of the Yazoo River sample. The high discharges on the Ohio, White, Arkansas, and Yazoo Rivers resulted in the organic fraction of suspended sediment in the Lower Mississippi River being derived from allochthonous inputs. In contrast, autochthonous inputs from the Upper Mississippi River dominated the suspended- sediment characteristics downstream to the confluence with the Ohio River.
Organic-carbon and nitrogen transport of the various suspended-sediment fractions for sampling cruise 4 are presented in table 20. The transport is dominated by sediment inputs from the Ohio River. The organic fraction that appears to be the most conservative with discharge is the mineral-colloid fraction. Even inputs of tributaries whose discharge is small compared to the discharge of the Mississippi River, such as the White and Yazoo Rivers, can be detected by increases in the mineral-colloid fraction. The Upper Mississippi River has the greatest relative amount of transport in the organic-colloid fraction, whereas the Lower Mississippi and Ohio Rivers have most of the transport in the silt and clay and mineral-colloid fractions.
The colloid transport is converted into organic-carbon concentrations in table 21. Colloidal organic-carbon concentrations were slightly greater for the early spring period of sampling cruise 4 than for the late spring period of sampling cruise 3 (table 16). The greater total suspended- sediment concentration during the fourth cruise also likely increased the colloidal organic-carbon concentrations. The difference method (left column, table 21) appears to underdetermine the colloidal organic-carbon concentration compared to concentrations determined from carbon anal ysis of the isolated colloids (right column, table 21), although there is a high degree of analytical variance in the difference method. Colloidal organics may not be efficiently determined by the persulfate oxidation method in freshwater systems, as was found previously for marine systems (Sugimura and Suzuki, 1988).
SAMPLING CRUISE 4, MARCH-APRIL 1989 41
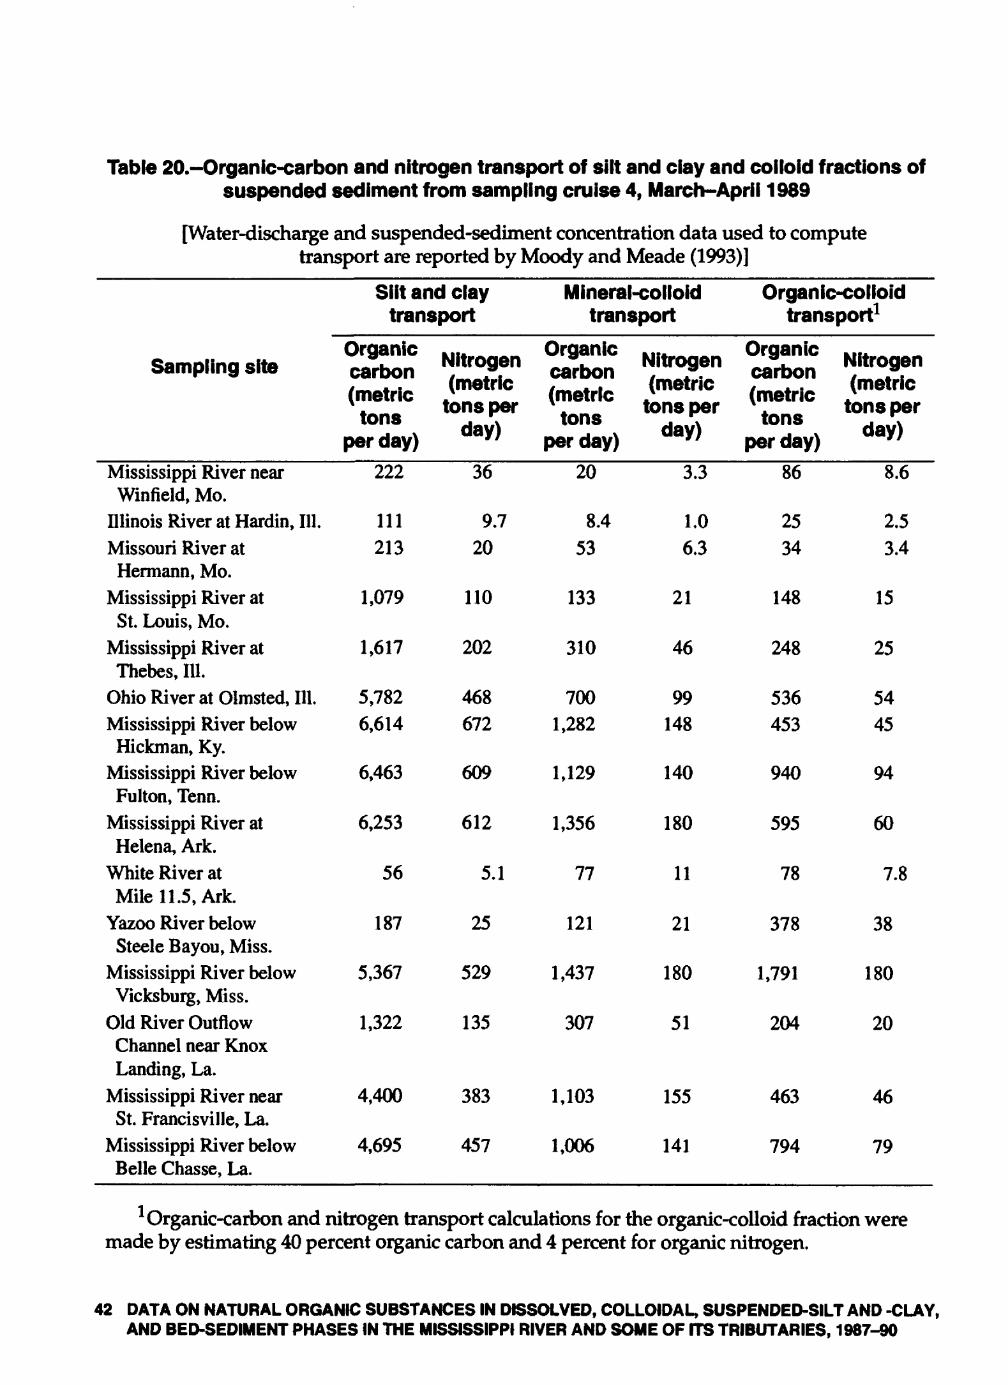
Table 20.-Organic-carbon and nitrogen transport of silt and clay and colloid fractions of suspended sediment from sampling cruise 4, March-April 1989
[Water-discharge and suspended-sediment concentration data used to compute transport are reported by Moody and Meade (1993)]
Silt and claytransport
Sampling site
Mississippi River nearWinfield, Mo.
Illinois River at Hardin, 111.Missouri River at
Hermann, Mo.Mississippi River at
St. Louis, Mo.Mississippi River atThebes, 111.
Ohio River at Olmsted, 111.Mississippi River below
Hickman, Ky.Mississippi River belowFulton, Tenn.
Mississippi River atHelena, Ark.
White River atMile 11. 5, Ark.
Yazoo River belowSteele Bayou, Miss.
Mississippi River belowVicksburg, Miss.
Old River OutflowChannel near KnoxLanding, La.
Mississippi River nearSt. Francisville, La.
Mississippi River belowBelle Chasse, La.
Organic carbon (metric tons
per day)222
111213
1,079
1,617
5,7826,614
6,463
6,253
56
187
5,367
1,322
4,400
4,695
Nitrogen (metric
tons per day)
36
9.720
110
202
468672
609
612
5.1
25
529
135
383
457
Mineral-colloidtransport
Organic carbon (metric tons
per day)20
8.453
133
310
7001,282
1,129
1,356
77
121
1,437
307
1,103
1,006
Nitrogen (metric tons per
day)
3.3
1.06.3
21
46
99148
140
180
11
21
180
51
155
141
Organic-colloidtransport1
Organic carbon (metric tons
per day)86
2534
148
248
536453
940
595
78
378
1,791
204
463
794
Nitrogen (metric
tons per day)
8.6
2.53.4
15
25
5445
94
60
7.8
38
180
20
46
79
1 Organic-carbon and nitrogen transport calculations for the organic-colloid fraction were made by estimating 40 percent organic carbon and 4 percent for organic nitrogen.
42 DATA ON NATURAL ORGANIC SUBSTANCES IN DISSOLVED, COLLOIDAL, SUSPENDED-SILT AND -CLAY, AND BED-SEDIMENT PHASES IN THE MISSISSIPPI RIVER AND SOME OF ITS TRIBUTARIES, 1987-90
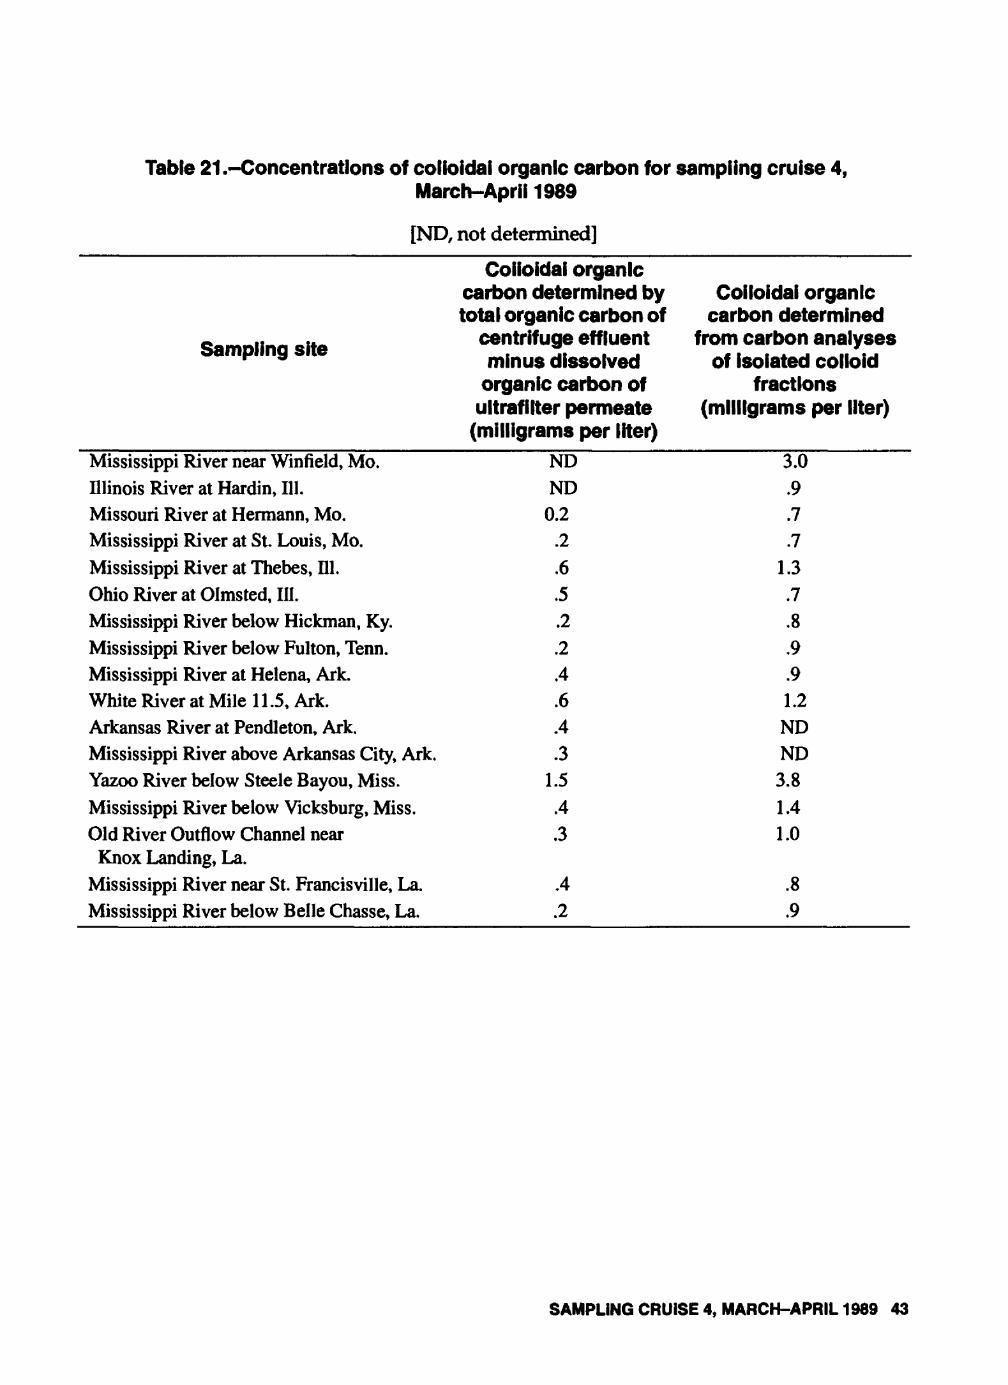
Table 21 .-Concentrations of colloidal organic carbon for sampling cruise 4,March-April 1989
[ND, not determined]
Colloidal organiccarbon determined by Colloidal organic total organic carbon of carbon determined
« _ ,. ... centrifuge effluent from carbon analyses Sampling site m|nu8 d|88O|ved of |so|ated co||oid
organic carbon of fractions ultrafllter permeate (milligrams per liter)
(milligrams per liter)Mississippi River near Winfield, Mo.Illinois River at Hardin, 111.Missouri River at Hermann, Mo.Mississippi River at St. Louis, Mo.Mississippi River at Thebes, 111.Ohio River at Olmsted, 111.Mississippi River below Hickman, Ky.Mississippi River below Fulton, Tenn.Mississippi River at Helena, Ark.White River at Mile 11.5, Ark.Arkansas River at Pendleton, Ark.Mississippi River above Arkansas City, Ark.Yazoo River below Steele Bayou, Miss.Mississippi River below Vicksburg, Miss.Old River Outflow Channel near
Knox Landing, La.Mississippi River near St. Francisville, La.Mississippi River below Belle Chasse, La.
NDND
0.2.2.6.5.2.2.4.6.4.3
1.5.4.3
.4.2
3.0.9.7.7
1.3.7.8.9.91.2NDND3.81.41.0
.8
.9
SAMPLING CRUISE 4, MARCH-APRIL 1989 43
SAMPLING CRUISE 5, JUNE 1989
The sampling of cruise 5 began on the Illinois River at Hardin, Illinois, on June 4,1989, and ended on the Mississippi River below Belle Chasse, Louisiana, on June 28,1989. No significant changes in sampling sites were made from cruise 4.
Objectives and Approach
An objective in the scheduling of this cruise was to determine herbicide transport in the lower Mississippi River after the spring application of herbicides. In this objective, only partial success was achieved because only the lower part of the river system was affected by rising stage resulting from runoff from agricultural lands.
Another objective was to finish the characterization work on dissolved organic substances. Sufficient data on dissolved organic substances were collected throughout the five cruises to predict its properties based upon the season and flow regimes of the rivers at various sampling sites. A continuing objective during each cruise was to quantify the carbon and nitrogen transport in the various phases at the various sites. This work was repeated during sampling cruise 5.
Initial work was begun on development of methodology for spectrometric characterization of organic substances in suspended sediments and bottom sediments. Bottom sediments were collected with a pipe dredge in relatively quiescent sections of the river where fine material accu mulated. These bottom samples were subjected to a series of chemical and physical separation procedures to separate the organic material for spectrometric characterization. Suspended-silt and -clay samples also were collected from the Illinois River at Hardin, HI., the Missouri River at Hermann, Mo., and the Mississippi River at Helena, Ark., for the initial evaluations of organic extraction methodologies for sediment characterization.
Dissolved Organic Matter
DOC concentrations and transport at the various sampling points for the June 1989 sampling cruise are presented in table 22. The DOC concentrations and transport inputs to the Lower Mississippi River system are unique in that a greater proportion of the DOC transport, as measured at Vicksburg, comes from both the Upper Mississippi River, as measured near Winfield, Mo., and from the Arkansas River. Each of these rivers contributes about 18 percent of the DOC transport, whereas the transport contributions were significantly less on the previous sampling cruises. The DOC concentration measured in the Upper Mississippi River near Winfield, Mo., was the highest measured for any sample collected up to this point. These significant DOC concentra tions may be related to the fact that samples were collected as the river stage was rising. Although the stage rise was fairly small, elevated DOC concentration is related to initial increases in stream discharge (McDowell and Likens, 1988). The DOC transport is about additive at the Upper Mississippi River-Illinois River-Missouri River confluence, at the Upper Mississippi River-Ohio River confluence, and at the Arkansas River-Lower Mississippi River confluence.
44 DATA ON NATURAL ORGANIC SUBSTANCES IN DISSOLVED, COLLOIDAL, SUSPENDED-SILT AND -CLAY, AND BED-SEDIMENT PHASES IN THE MISSISSIPPI RIVER AND SOME OF ITS TRIBUTARIES, 1987-90
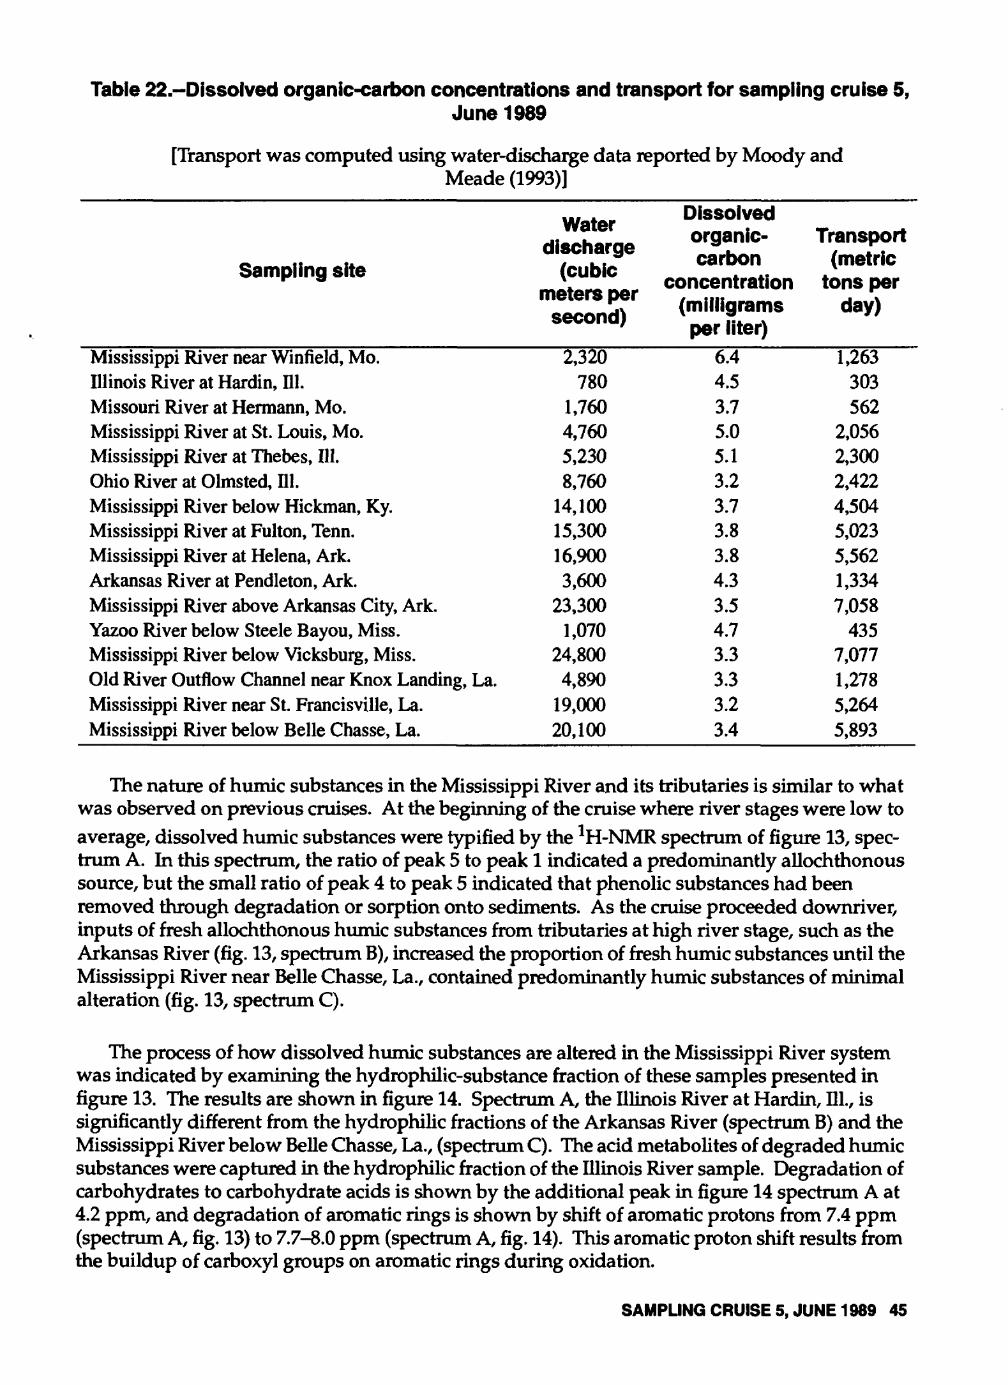
Table 22.-Dissolved organic-carbon concentrations and transport for sampling cruise 5,June 1989
[Transport was computed using water-discharge data reported by Moody andMeade (1993)]
Sampling site
Mississippi River near Winfield, Mo.Illinois River at Hardin, 111.Missouri River at Hermann, Mo.Mississippi River at St. Louis, Mo.Mississippi River at Thebes, 111.Ohio River at Olmsted, 111.Mississippi River below Hickman, Ky.Mississippi River at Fulton, Tenn.Mississippi River at Helena, Ark.Arkansas River at Pendleton, Ark.Mississippi River above Arkansas City, Ark.Yazoo River below Steele Bayou, Miss.Mississippi River below Vicksburg, Miss.Old River Outflow Channel near Knox Landing, La.Mississippi River near St. Francisville, La.Mississippi River below Belle Chasse, La.
WaterWTCfLtfff
discharge (cubic
meters per second)
2,320780
1,7604,7605,2308,760
14,10015,30016,9003,600
23,3001,070
24,8004,890
19,00020,100
Dissolvedorganic- carbon
concentration(milligrams per liter)
6.44.53.75.05.13.23.73.83.84.33.54.73.33.33.23.4
Transport (metric
tons perday)
1,263303562
2,0562,3002,4224,5045,0235,5621,3347,058
4357,0771,2785,2645,893
The nature of humic substances in the Mississippi River and its tributaries is similar to what was observed on previous cruises. At the beginning of the cruise where river stages were low toaverage, dissolved humic substances were typified by the 1H-NMR spectrum of figure 13, spec trum A. In this spectrum, the ratio of peak 5 to peak 1 indicated a predominantly allochthonous source, but the small ratio of peak 4 to peak 5 indicated that phenolic substances had been removed through degradation or sorption onto sediments. As the cruise proceeded downriver, inputs of fresh allochthonous humic substances from tributaries at high river stage, such as the Arkansas River (fig. 13, spectrum B), increased the proportion of fresh humic substances until the Mississippi River near Belle Chasse, La., contained predominantly humic substances of minimal alteration (fig. 13, spectrum C).
The process of how dissolved humic substances are altered in the Mississippi River system was indicated by examining the hydrophilic-substance fraction of these samples presented in figure 13. The results are shown in figure 14. Spectrum A, the Illinois River at Hardin, HI., is significantly different from the hydrophilic fractions of the Arkansas River (spectrum B) and the Mississippi River below Belle Chasse, La., (spectrum C). The acid metabolites of degraded humic substances were captured in the hydrophilic fraction of the Illinois River sample. Degradation of carbohydrates to carbohydrate acids is shown by the additional peak in figure 14 spectrum A at 4.2 ppm, and degradation of aromatic rings is shown by shift of aromatic protons from 7.4 ppm (spectrum A, fig. 13) to 7.7-8.0 ppm (spectrum A, fig. 14). This aromatic proton shift results from the buildup of carboxyl groups on aromatic rings during oxidation.
SAMPLING CRUISE 5, JUNE 1989 45
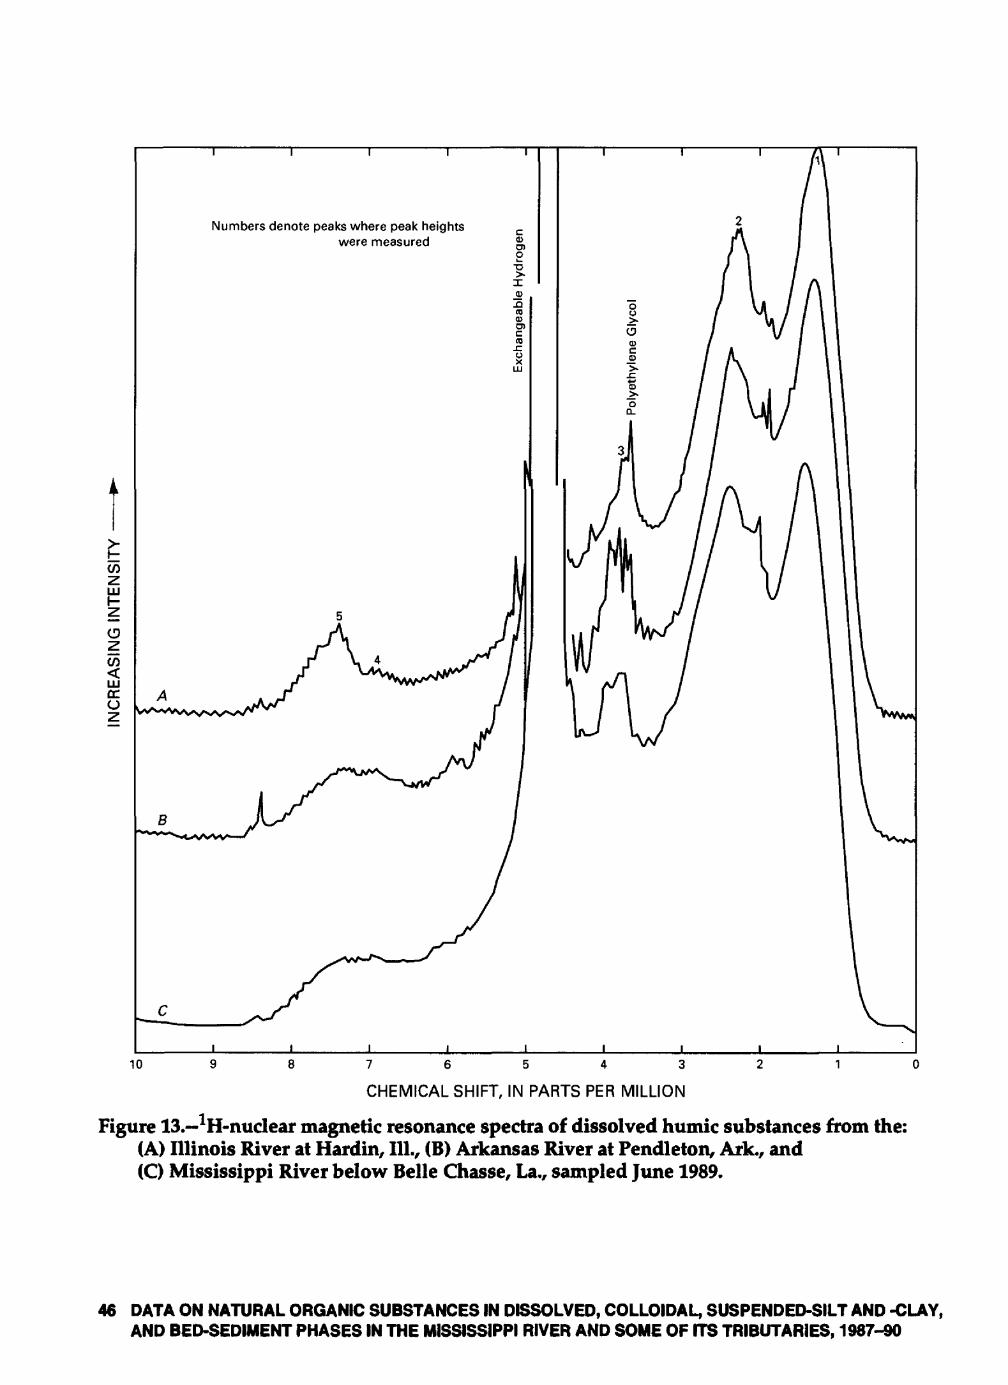
en
en <LLJ CCo
Numbers denote peaks where peak heights were measured
10
CHEMICAL SHIFT, IN PARTS PER MILLION
Figure 13.-1H-nuclear magnetic resonance spectra of dissolved humic substances from the: (A) Illinois River at Hardin, 111., (B) Arkansas River at Pendleton, Ark., and (C) Mississippi River below Belle Chasse, La., sampled June 1989.
46 DATA ON NATURAL ORGANIC SUBSTANCES IN DISSOLVED, COLLOIDAL, SUSPENDED-SILT AND -CLAY, AND BED-SEDIMENT PHASES IN THE MISSISSIPPI RIVER AND SOME OF ITS TRIBUTARIES, 1987-90
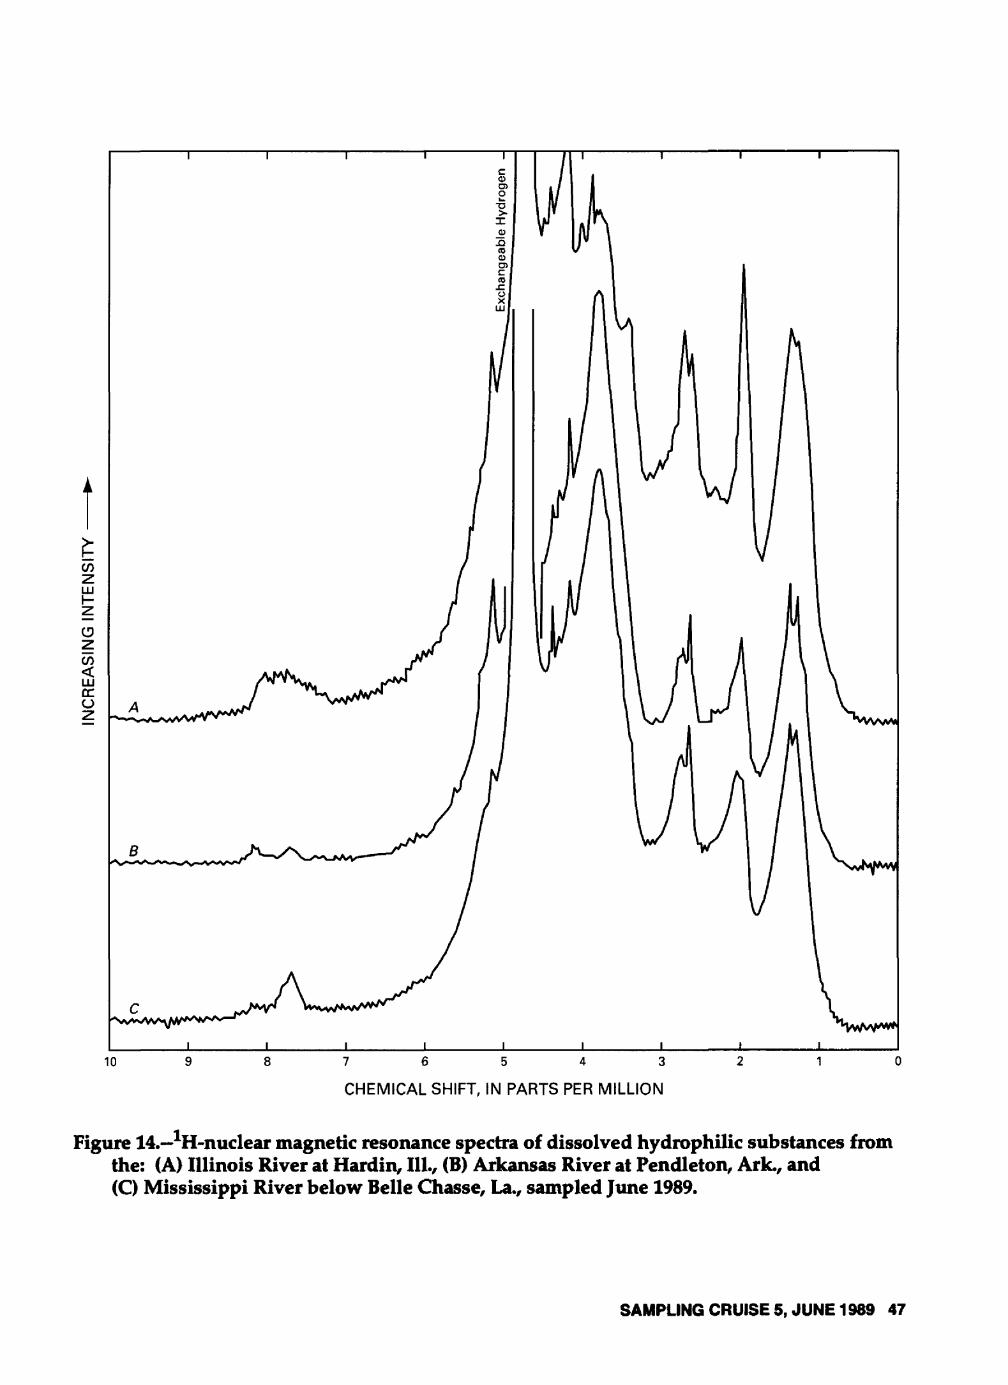
(0 o o
o 30 i in
<n
»-H
§
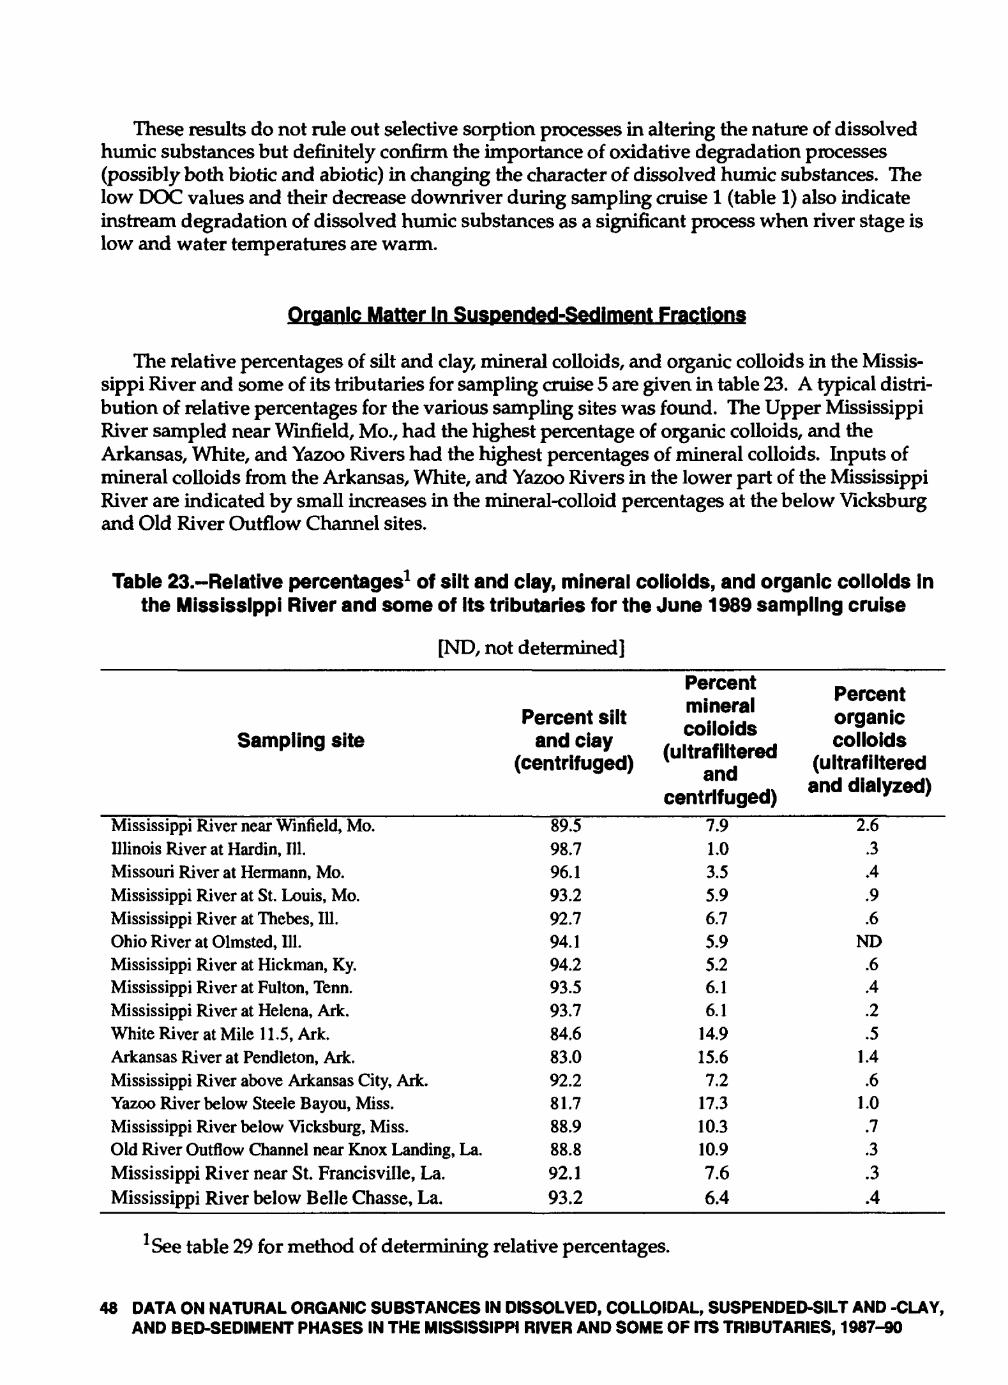
These results do not rule out selective sorption processes in altering the nature of dissolved humic substances but definitely confirm the importance of oxidative degradation processes (possibly both biotic and abiotic) in changing the character of dissolved humic substances. The low DOC values and their decrease downriver during sampling cruise 1 (table 1) also indicate instream degradation of dissolved humic substances as a significant process when river stage is low and water temperatures are warm.
Organic Matter In Suspended-Sediment Fractions
The relative percentages of silt and clay, mineral colloids, and organic colloids in the Missis sippi River and some of its tributaries for sampling cruise 5 are given in table 23. A typical distri bution of relative percentages for the various sampling sites was found. The Upper Mississippi River sampled near Winfield, Mo., had the highest percentage of organic colloids, and the Arkansas, White, and Yazoo Rivers had the highest percentages of mineral colloids. Inputs of mineral colloids from the Arkansas, White, and Yazoo Rivers in the lower part of the Mississippi River are indicated by small increases in the mineral-colloid percentages at the below Vicksburg and Old River Outflow Channel sites.
Table 23.-Relative percentages1 of silt and clay, mineral colloids, and organic colloids in the Mississippi River and some of its tributaries for the June 1989 sampling cruise
[ND, not determined]
Sampling site
Mississippi River near Winfield, Mo.Illinois River at Hardin, 111.Missouri River at Hermann, Mo.Mississippi River at St. Louis, Mo.Mississippi River at Thebes, 111.Ohio River at Olmsted, 111.Mississippi River at Hickman, Ky.Mississippi River at Fulton, Tenn.Mississippi River at Helena, Ark.White River at Mile 11.5, Ark.Arkansas River at Pendleton, Ark.Mississippi River above Arkansas City, Ark.Yazoo River below Steele Bayou, Miss.Mississippi River below Vicksburg, Miss.Old River Outflow Channel near Knox Landing, La.Mississippi River near St. Francisville, La.Mississippi River below Belle Chasse, La.
Percent siitand clay
(centrifuged)
89.598.796.193.292.794.194.293.593.784.683.092.281.788.988.892.193.2
Percentmineralcoiioids
(ultrafiltered and
centrifuged)7.91.03.55.96.75.95.26.16.1
14.915.67.2
17.310.310.97.66.4
Percentorganiccolloids
(ultrafilteredand diaiyzed)
2.6.3.4.9.6
ND.6.4.2.5
1.4.6
1.0.7.3.3.4
1 See table 29 for method of determining relative percentages.
48 DATA ON NATURAL ORGANIC SUBSTANCES IN DISSOLVED, COLLOIDAL, SUSPENDED-SILT AND -CLAY, AND BED-SEDIMENT PHASES IN THE MISSISSIPPI RIVER AND SOME OF ITS TRIBUTARIES, 1987-90
The elemental composition of the various suspended-sediment fractions is given in table 24. Fluorine percentages in the silt and clay fraction were lower than for the previous sampling cruise because a Teflon drag bushing in the continuous-flow centrifuge, which probably was the source of much of the fluorine content, was replaced by a treated wood bushing.
Typical increases in organic-carbon content of suspended sediment fractions were observed in proceeding from the silt and clay fraction (about 2-4 percent) to the mineral-colloid fraction (about 4-11 percent) to the organic-colloid fraction (about 25-40 percent). The atomic C:N ratio was somewhat elevated for most sites sampled on sampling cruise 5 compared to previous cruises; this elevated ratio indicates sediment contained a significant proportion of allochthonous material, which is consistent with the moderate to high stages of the river during cruise 5.
The organic-carbon and nitrogen transport for the various sediment-size fractions are presented in table 25. The transport of organic carbon in the mineral-colloid fraction are remark ably additive compared to the silt and clay transport when proceeding downriver. Especially remarkable is the additivity of the mineral-colloid transport at St. Louis for inputs from the Illinois River, the Upper Mississippi River, and the Missouri River. The organic carbon in the silt and clay fraction at these sampling points is not at all additive. Furthermore, the total masses of the mineral colloids are not additive; only the organic-carbon component is additive.
To gain further insight into the independent variations in the organic-carbon component of the silt and mineral-colloid fractions, the transport was converted into organic-carbon concentrations in table 26. The maximum variation between colloidal organic carbon concentrations was a factor of 3.2, whereas there was more than an order of magnitude variation between silt and clay organic carbon concentrations. The variations in colloidal organic-carbon concentrations in table 26 tend to parallel the variations in dissolved organic-carbon concentrations in table 22; the colloidal organic-carbon concentrations were 16-40 percent of the dissolved organic-carbon concentra tions. The independent variations in the silt and clay and colloidal organic-carbon concentrations were among the most significant findings of this study, and the various mechanisms responsible for colloidal organic carbon acting as a conservative, dissolved constituent in water merits addi tional research.
Results of the work involving infrared spectral characterization of organic substances extracted from suspended silt and clay collected from the Mississippi River at Helena, Ark., are shown in figure 15. The initial extraction of sediment was by methylisobutyl ketone (MIBK) under both acid and alkaline conditions (Rice and MacCarthy, 1989). The MIBK extract after drying is shown in spectrum A. This extract appears to consist of aliphatic hydrocarbons, aliphatic alcohols, and aliphatic ester lipids. The next extraction in the sequence was by acid pyro- phosphate designed to extract adsorbed fulvic acid from soils and sediments (Gregor and Powell, 1986). The spectrum of this extract (spectrum B, fig. 15) has a peak pattern typical for fulvic acid. The next extract was by a mixture (95 percent dimethyl sulfoxide, 4 percent water, and 1 percent HC1) recommended by Hayes (1985) for extraction of soil humic substances. This extract, after removal of the dimethylsulfoxide by dialysis and the silica by hydrofluoric acid (HF), gave the spectrum shown in spectrum C (fig. 15). This spectrum indicated a protein-rich substance that also contained lipids and humic substances.
SAMPLING CRUISE 5, JUNE 1989 49
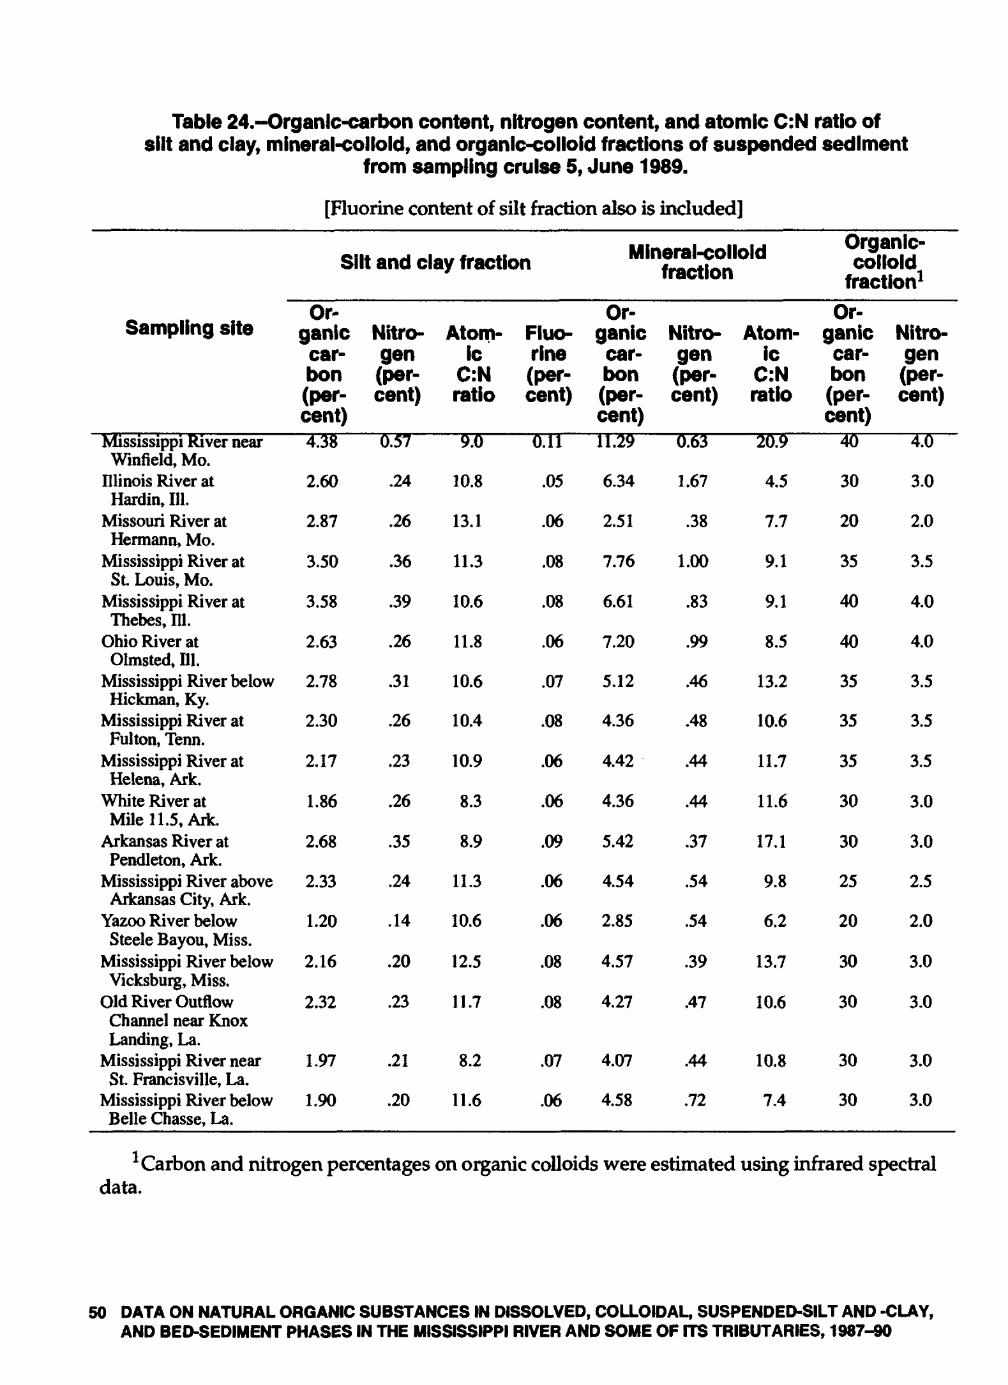
Table 24.-Organlc-carbon content, nitrogen content, and atomic C:N ratio of silt and clay, mineral-colloid, and organic-colloid fractions of suspended sediment
from sampling cruise 5, June 1989.
[Fluorine content of silt fraction also is included]
Silt and clay fraction
Sampling site
Mississippi River nearWinfield, Mo.
Illinois River atHardin, 111.
Missouri River atHermann, Mo.
Mississippi River atSt. Louis, Mo.
Mississippi River atThebes, 111.
Ohio River atOlmsted, 111.
Mississippi River belowHickman, Ky.
Mississippi River atFulton, Tenn.
Mississippi River atHelena, Ark.
White River atMile 11. 5, Ark.
Arkansas River atPendleton, Ark.
Mississippi River aboveArkansas City, Ark.
Yazoo River belowSteele Bayou, Miss.
Mississippi River belowVicksburg, Miss.
Old River OutflowChannel near KnoxLanding, La.
Mississippi River nearSt. Francisville, La.
Mississippi River belowBelle Chasse, La.
Organiccarbon(percent)4.38
2.60
2.87
3.50
3.58
2.63
2.78
2.30
2.17
1.86
2.68
2.33
1.20
2.16
2.32
1.97
1.90
Nitrogen(percent)
0.57
.24
.26
.36
.39
.26
.31
.26
.23
.26
.35
.24
.14
.20
.23
.21
.20
Atomic
C:Nratio
9.0
10.8
13.1
11.3
10.6
11.8
10.6
10.4
10.9
8.3
8.9
11.3
10.6
12.5
11.7
8.2
11.6
Fluorine(percent)
0.11
.05
.06
.08
.08
.06
.07
.08
.06
.06
.09
.06
.06
.08
.08
.07
.06
Mineral-colloid fraction
Organiccarbon(percent)11.29
6.34
2.51
7.76
6.61
7.20
5.12
4.36
4.42
4.36
5.42
4.54
2.85
4.57
4.27
4.07
4.58
Nitrogen(percent)
0.63
1.67
.38
1.00
.83
.99
.46
.48
.44
.44
.37
.54
.54
.39
.47
.44
.72
Atomic
C:Nratio
20.9
4.5
7.7
9.1
9.1
8.5
13.2
10.6
11.7
11.6
17.1
9.8
6.2
13.7
10.6
10.8
7.4
Organic- colloid
fraction1Or
ganiccarbon(percent)
40
30
20
35
40
40
35
35
35
30
30
25
20
30
30
30
30
Nitrogen(percent)
4.0
3.0
2.0
3.5
4.0
4.0
3.5
3.5
3.5
3.0
3.0
2.5
2.0
3.0
3.0
3.0
3.0
1 Carbon and nitrogen percentages on organic colloids were estimated using infrared spectral data.
50 DATA ON NATURAL ORGANIC SUBSTANCES IN DISSOLVED, COLLOIDAL, SUSPENDED-SILT AND -CLAY, AND BED-SEDIMENT PHASES IN THE MISSISSIPPI RIVER AND SOME OF ITS TRIBUTARIES, 1987-90
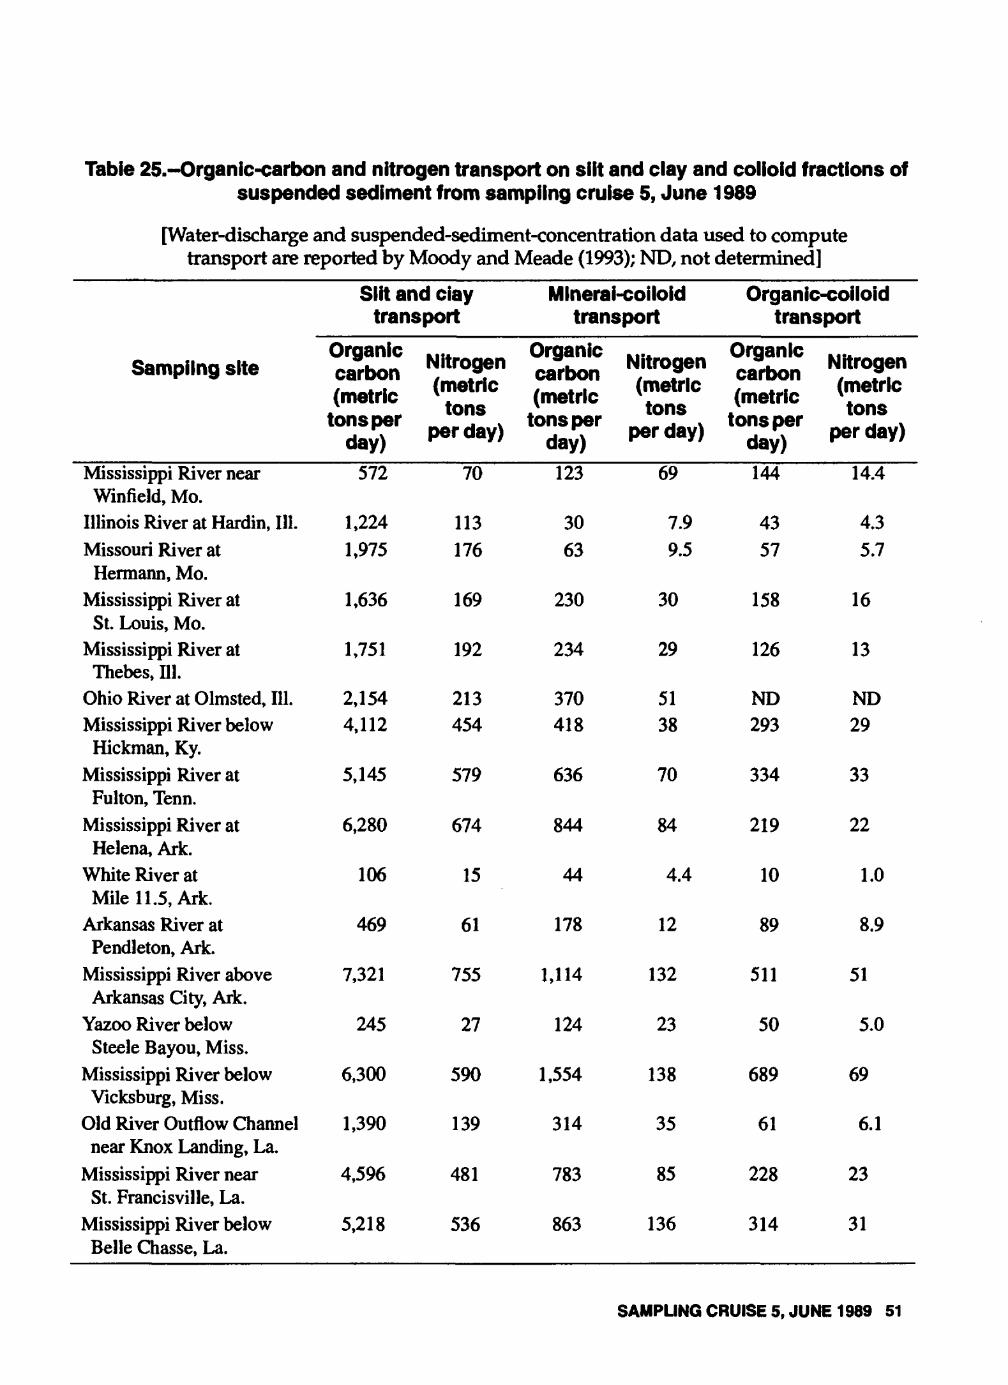
Table 25.-Organic-carbon and nitrogen transport on silt and clay and colloid fractions of suspended sediment from sampling cruise 5, June 1989
[Water-discharge and suspended-sediment-concentration data used to compute transport are reported by Moody and Meade (1993); ND, not determined]
Silt and clay transport
Sampling site
Mississippi River near Winfield, Mo.
Illinois River at Hardin, 111.Missouri River at
Hermann, Mo.Mississippi River at
St. Louis, Mo.Mississippi River at Thebes, 111.
Ohio River at Olmsted, 111.Mississippi River below
Hickman, Ky.Mississippi River at
Fulton, Tenn.Mississippi River at
Helena, Ark.White River at
Mile 11. 5, Ark.Arkansas River at
Pendleton, Ark.Mississippi River above Arkansas City, Ark.
Yazoo River belowSteele Bayou, Miss.
Mississippi River below Vicksburg, Miss.
Old River Outflow Channelnear Knox Landing, La.
Mississippi River near St. Francisville, La.
Mississippi River below Belle Chasse, La.
Organic carbon (metric
tons per day)
572
1,2241,975
1,636
1,751
2,1544,112
5,145
6,280
106
469
7,321
245
6,300
1,390
4,596
5,218
Nitrogen (metric tons
per day)
70
113176
169
192
213454
579
674
15
61
755
27
590
139
481
536
Mineral-colloid transport
Organic carbon (metric
tons per day)
123
3063
230
234
370418
636
844
44
178
1,114
124
1,554
314
783
863
Nitrogen (metric tons
per day)
69
7.99.5
30
29
5138
70
84
4.4
12
132
23
138
35
85
136
Organic-colloid transport
Organic carbon (metric
tons per day)144
4357
158
126
ND293
334
219
10
89
511
50
689
61
228
314
Nitrogen (metric tons
per day)
14.4
4.35.7
16
13
ND29
33
22
1.0
8.9
51
5.0
69
6.1
23
31
SAMPLING CRUISE 5, JUNE 1989 51
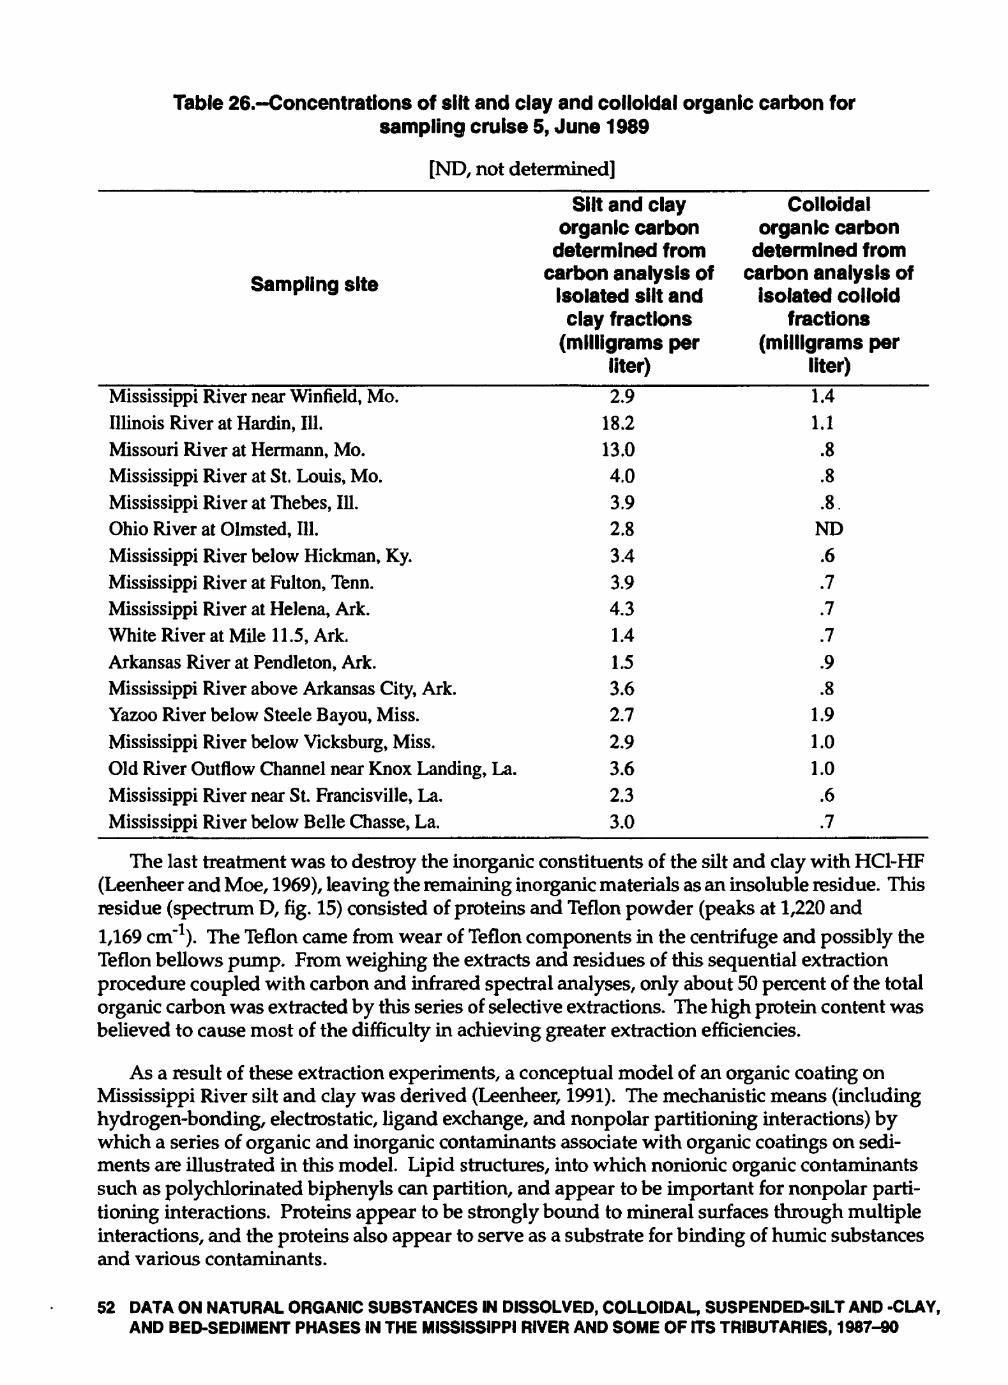
Table 26.-Concentrations of silt and clay and colloidal organic carbon forsampling cruise 5, June 1989
[ND, not determined]
Sampling site
Silt and clayorganic carbon
determined fromcarbon analysis of
isolated silt andclay fractions
(milligrams perliter)
Colloidalorganic carbon
determined fromcarbon analysis of
isolated colloidfractions
(milligrams perliter)
Mississippi River near Winfield, Mo.Illinois River at Hardin, 111.Missouri River at Hermann, Mo.Mississippi River at St. Louis, Mo.Mississippi River at Thebes, 111.Ohio River at Olmsted, 111.Mississippi River below Hickman, Ky.Mississippi River at Fulton, Tenn.Mississippi River at Helena, Ark.White River at Mile 11.5, Ark.Arkansas River at Pendleton, Ark.Mississippi River above Arkansas City, Ark.Yazoo River below Steele Bayou, Miss.Mississippi River below Vicksburg, Miss.Old River Outflow Channel near Knox Landing, La.Mississippi River near St. Francisville, La.Mississippi River below Belle Chasse, La.
2.918.213.04.03.92.83.43.94.31.41.53.62.72.93.62.33.0
1.41.1
.8
.8
.8.ND.6.7.7.7.9.8
1.91.01.0.6.7
The last treatment was to destroy the inorganic constituents of the silt and clay with HC1-HF (Leenheer and Moe, 1969), leaving the remaining inorganic materials as an insoluble residue. This residue (spectrum D, fig. 15) consisted of proteins and Teflon powder (peaks at 1,220 and1,169 cm ). The Teflon came from wear of Teflon components in the centrifuge and possibly the Teflon bellows pump. From weighing the extracts and residues of this sequential extraction procedure coupled with carbon and infrared spectral analyses, only about 50 percent of the total organic carbon was extracted by this series of selective extractions. The high protein content was believed to cause most of the difficulty in achieving greater extraction efficiencies.
As a result of these extraction experiments, a conceptual model of an organic coating on Mississippi River silt and clay was derived (Leenheer, 1991). The mechanistic means (including hydrogen-bonding, electrostatic, ligand exchange, and nonpolar partitioning interactions) by which a series of organic and inorganic contaminants associate with organic coatings on sedi ments are illustrated in this model. Lipid structures, into which nonionic organic contaminants such as polychlorinated biphenyls can partition, and appear to be important for nonpolar parti tioning interactions. Proteins appear to be strongly bound to mineral surfaces through multiple interactions, and the proteins also appear to serve as a substrate for binding of humic substances and various contaminants.
52 DATA ON NATURAL ORGANIC SUBSTANCES IN DISSOLVED, COLLOIDAL, SUSPENDED-SILT AND -CLAY, AND BED-SEDIMENT PHASES IN THE MISSISSIPPI RIVER AND SOME OF ITS TRIBUTARIES, 1987-90
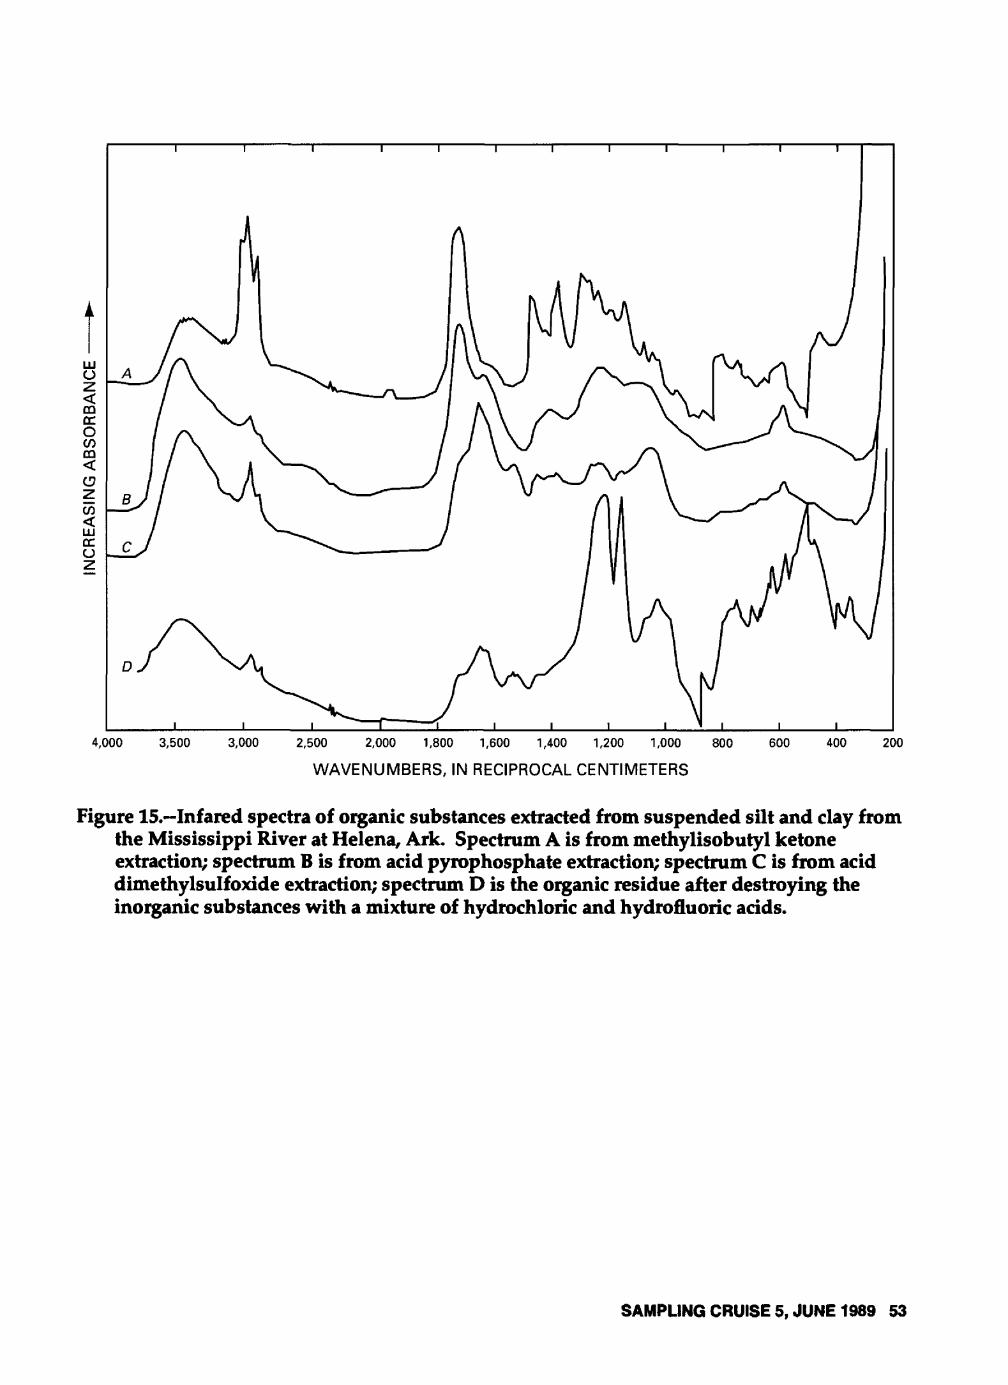
4,000 3,500 3,000 2,500 2,000 1,800 1,600 1,400 1,200 1,000
WAVENUMBERS, IN RECIPROCAL CENTIMETERS
800 600 400 200
Figure 15. Infared spectra of organic substances extracted from suspended silt and clay from the Mississippi River at Helena, Ark. Spectrum A is from methylisobutyl ketone extraction; spectrum B is from acid pyrophosphate extraction; spectrum C is from acid dimethylsulfoxide extraction; spectrum D is the organic residue after destroying the inorganic substances with a mixture of hydrochloric and hydrofluoric acids.
SAMPLING CRUISE 5, JUNE 1989 53
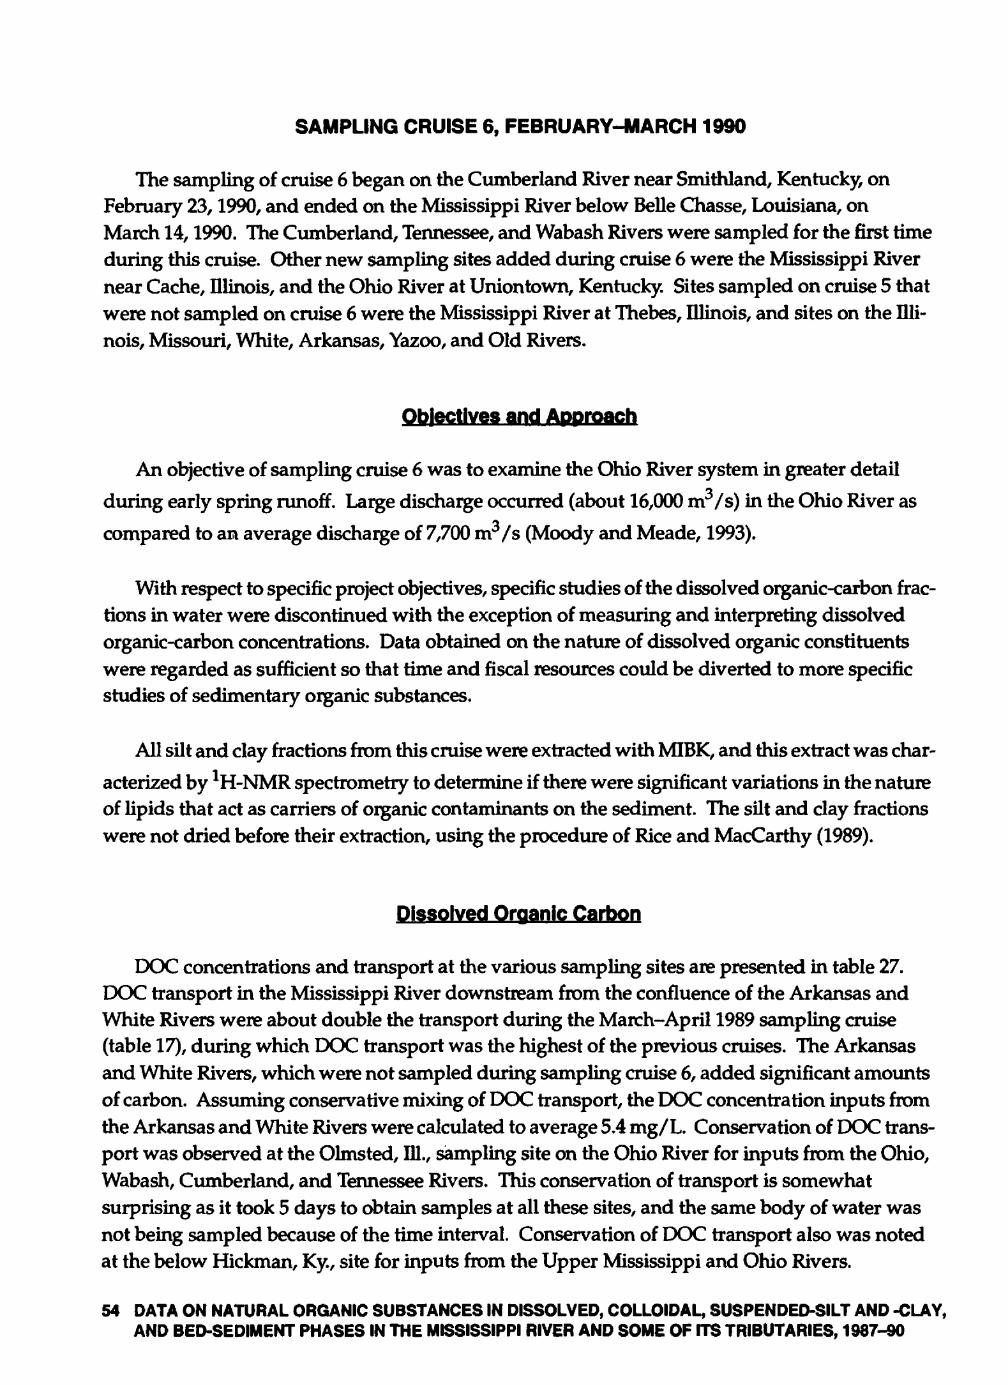
SAMPLING CRUISE 6, FEBRUARY-MARCH 1990
The sampling of cruise 6 began on the Cumberland River near Southland, Kentucky, on February 23,1990, and ended on the Mississippi River below Belle Chasse, Louisiana, on March 14,1990. The Cumberland, Tennessee, and Wabash Rivers were sampled for the first time during this cruise. Other new sampling sites added during cruise 6 were the Mississippi River near Cache, Illinois, and the Ohio River at Uniontown, Kentucky. Sites sampled on cruise 5 that were not sampled on cruise 6 were the Mississippi River at Thebes, Illinois, and sites on the Illi nois, Missouri, White, Arkansas, Yazoo, and Old Rivers.
Objectives and Approach
An objective of sampling cruise 6 was to examine the Ohio River system in greater detail
during early spring runoff. Large discharge occurred (about 16,000 m3/s) in the Ohio River as
compared to an average discharge of 7,700 m3/s (Moody and Meade, 1993).
With respect to specific project objectives, specific studies of the dissolved organic-carbon frac tions in water were discontinued with the exception of measuring and interpreting dissolved organic-carbon concentrations. Data obtained on the nature of dissolved organic constituents were regarded as sufficient so that time and fiscal resources could be diverted to more specific studies of sedimentary organic substances.
All silt and clay fractions from this cruise were extracted with MIBK, and this extract was char
acterized by 1H-NMR spectrometry to determine if there were significant variations in the nature of lipids that act as carriers of organic contaminants on the sediment. The silt and clay fractions were not dried before their extraction, using the procedure of Rice and MacCarthy (1989).
Dissolved Organic Carbon
DOC concentrations and transport at the various sampling sites are presented in table 27. DOC transport in the Mississippi River downstream from the confluence of the Arkansas and White Rivers were about double the transport during the March-April 1989 sampling cruise (table 17), during which DOC transport was the highest of the previous cruises. The Arkansas and White Rivers, which were not sampled during sampling cruise 6, added significant amounts of carbon. Assuming conservative mixing of DOC transport, the DOC concentration inputs from the Arkansas and White Rivers were calculated to average 5.4 mg/L. Conservation of DOC trans port was observed at the Olmsted, HI., sampling site on the Ohio River for inputs from the Ohio, Wabash, Cumberland, and Tennessee Rivers. This conservation of transport is somewhat surprising as it took 5 days to obtain samples at all these sites, and the same body of water was not being sampled because of the time interval. Conservation of DOC transport also was noted at the below Hickman, Ky., site for inputs from the Upper Mississippi and Ohio Rivers.
54 DATA ON NATURAL ORGANIC SUBSTANCES IN DISSOLVED, COLLOIDAL, SUSPENDED-SILT AND -CLAY, AND BED-SEDIMENT PHASES IN THE MISSISSIPPI RIVER AND SOME OF ITS TRIBUTARIES, 1987-90
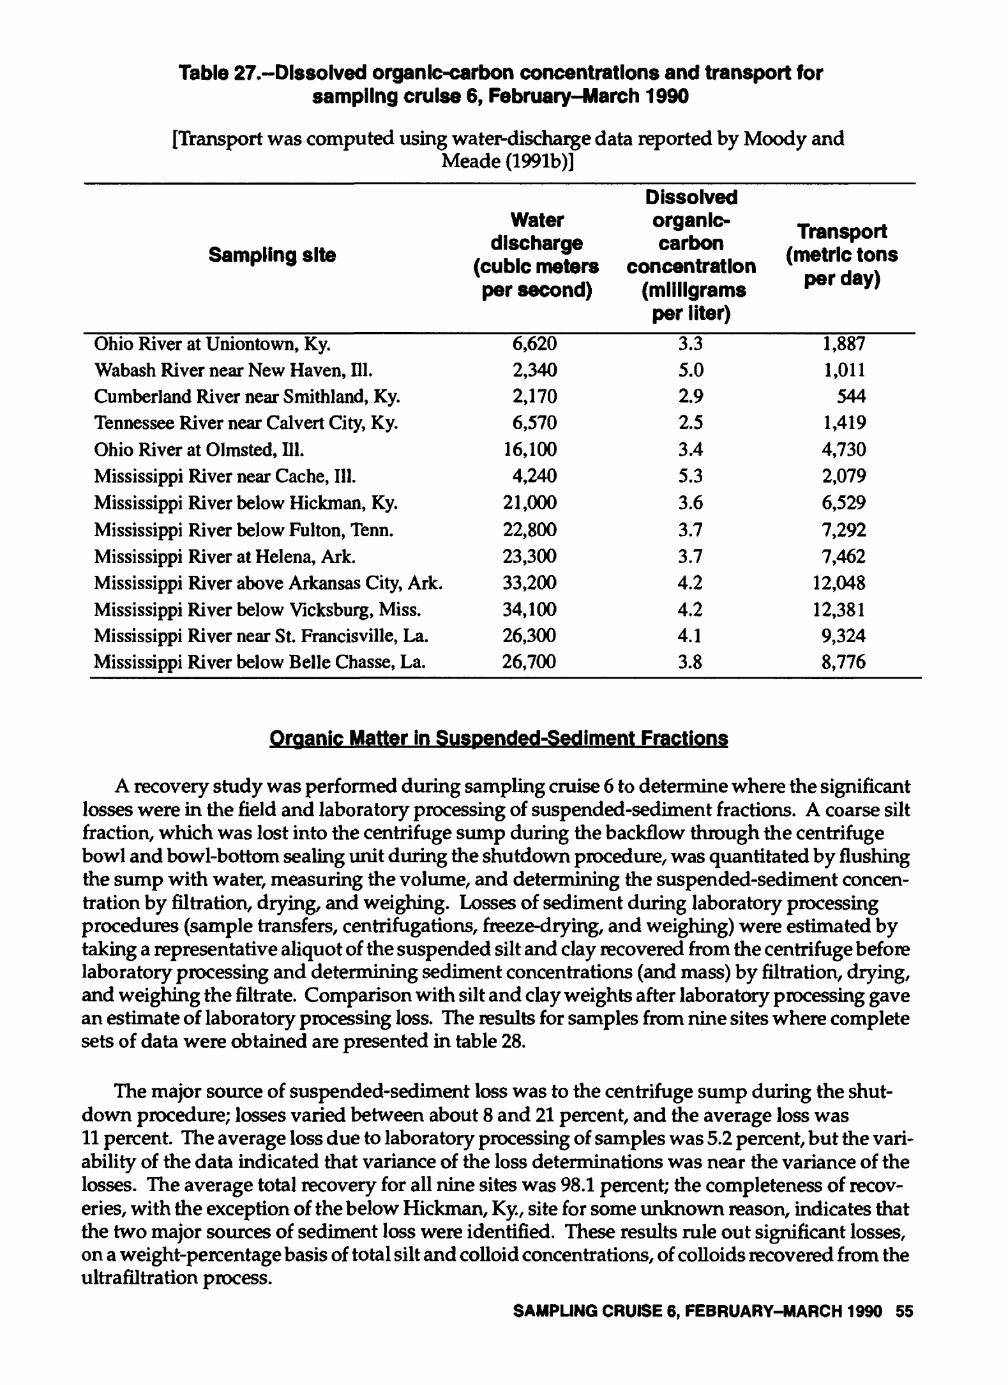
Table 27.-Dissolved organic-carbon concentrations and transport for sampling cruise 6, February-March 1990
[Transport was computed using water-discharge data reported by Moody andMeade (1991b)]
Sampling site
Ohio River at Uniontown, Ky.Wabash River near New Haven, 111.Cumberland River near Smithland, Ky.Tennessee River near Calvert City, Ky.Ohio River at Olmsted, 111.Mississippi River near Cache, 111.Mississippi River below Hickman, Ky.Mississippi River below Fulton, Tenn.Mississippi River at Helena, Ark.Mississippi River above Arkansas City, Ark.Mississippi River below Vicksburg, Miss.Mississippi River near St. Francisville, La.Mississippi River below Belle Chasse, La.
Water discharge
(cubic meters per second)
6,6202,3402,1706,570
16,1004,240
21,00022,80023,30033,20034,10026,30026,700
Dissolvedorganic- carbon
concentration (milligrams per liter)
3.35.02.92.53.45.33.63.73.74.24.24.13.8
Transport (metric tons
per day)
1,8871,011
5441,4194,7302,0796,5297,2927,462
12,04812,3819,3248,776
Organic Matter in Suspended-Sediment Fractions
A recovery study was performed during sampling cruise 6 to determine where the significant losses were in the field and laboratory processing of suspended-sediment fractions. A coarse silt fraction, which was lost into the centrifuge sump during the backflow through the centrifuge bowl and bowl-bottom sealing unit during the shutdown procedure, was quantitated by flushing the sump with water, measuring the volume, and determining the suspended-sediment concen tration by filtration, drying, and weighing. Losses of sediment during laboratory processing procedures (sample transfers, centrifugations, freeze-drying, and weighing) were estimated by taking a representative aliquot of the suspended silt and clay recovered from the centrifuge before laboratory processing and determining sediment concentrations (and mass) by filtration, drying, and weighing the filtrate. Comparison with silt and clay weights after laboratory processing gave an estimate of laboratory processing loss. The results for samples from nine sites where complete sets of data were obtained are presented in table 28.
The major source of suspended-sediment loss was to the centrifuge sump during the shut down procedure; losses varied between about 8 and 21 percent, and the average loss was 11 percent. The average loss due to laboratory processing of samples was 5.2 percent, but the vari ability of the data indicated that variance of the loss determinations was near the variance of the losses. The average total recovery for all nine sites was 98.1 percent; the completeness of recov eries, with the exception of the below Hickman, Ky, site for some unknown reason, indicates that the two major sources of sediment loss were identified. These results rule out significant losses, on a weight-percentage basis of total silt and colloid concentrations, of colloids recovered from the ultrafiltration process.
SAMPLING CRUISE 6, FEBRUARY-MARCH 1990 55
Table 28.-Recovery study of suspended-sediment fractions1 from the Ohio, Mississippi, and Tennessee Rivers during sampling cruise 6, February-March 1990
[ND, not determined]
Sampling site
Ohio River atUniontown, Ky.
Tennessee River nearCalvert City, Ky.
Ohio River atOlmsted, 111.
Mississippi River belowHickman, Ky.
Mississippi River belowFulton, Tenn.
Mississippi River atHelena, Ark.
Mississippi River aboveArkansas City, Ark.
Mississippi River belowVicksburg, Miss.
Mississippi River nearSt. Francisville, La.
Average recoveries
Percent of suspendedsediment1
determined by filtration,
drying, snd weighing a
representative siiquot of silt
end clay suspensionrecovered
fromcentrifuge
81.0
73.1
80.6
66.6
60.8
67.7
76.7
84.9
77.0
74.3
Percent of sus- nmjgnj
sediment1 deter
mined by froeze- drying
and weighing
a representative split
76.3
70.1
66.5
66.1
67.0
65.8
69.5
72.3
68.3
69.1
Percentlaboratory
drying,sample -- r>a<^«-iransieft
end weighing losses
determined by
subtracting data Insecond
columnfromdata In first
column
4.7
3.0
14.1
.5
-6.2
1.9
7.2
12.6
8.7
5.2
Percent ofsuspended sediment1
lost to waste
sump in centrifuge
during shutdownprocedure
13.8
7.5
11.3
9.2
20.7
14.8
8.3
8.2
12.4
11.8
Mineral-colloid fraction
recoveredfmnjin.TrOfn
uHraflKer (percent of
sus pended
sediment1)
6.8
20.6
9.3
9.2
10.1
7.4
11.5
11.9
11.6
10.9
Organic- colloid fraction (percent of sus pended
sediment1)
0.3
1.5
.6
.5
ND
.6
ND
.5
ND
.7
Totalaccount
ed recovery
of sus pended
sedi ment1,
inpercent
101.9
102.7
101.8
85.5
97.8
90.5
96.5
105.5
101.0
98.1
The sand fraction was not included in suspended-sediment concentrations.
56 DATA ON NATURAL ORGANIC SUBSTANCES IN DISSOLVED, COLLOIDAL, SUSPENDED-SILT AND -CLAY, AND BED-SEDIMENT PHASES IN THE MISSISSIPPI RIVER AND SOME OF ITS TRIBUTARIES, 1987-90
The findings of this loss study were applied to the calculation of carbon and nitrogen transport data from the previous cruises where sources of losses were not yet identified. Calculation of silt and clay and colloid distributions by taking silt and clay masses from pumped composite sample data and multiplying colloid masses obtained from the depth-integrated composite sample by a volume factor difference between the pumped and depth-integrated samples potentially can minimize these errors apparent in depth-integrated composite sample data because of the greater mass (about 5 times) of silt and clay in the pumped composite sample. This greater mass should minimize both the losses due to laboratory processing and the percent of silt and clay lost from the centrifuge during shutdown because of greater suspended-sediment loading of the centrifuge bowl. Comparison of recovery percentages on the composite sample (with losses figured into the appropriate fractions to give valid distributions) with relative percentages calculated from combining the pumped composite sample and depth-integrated composite data, as described above, are presented in table 29. Within the variance of the data set, the averages show there is no detectable bias when the data are calculated by combining pumped composite sample data for silt and clay percentages and depth-integrated composite sample data for colloid percentages. There fore, data in tables 13,18, and 23 were calculated by combining pumped composite sample data for silt and clay percentages with depth-integrated composite sample data for colloid percentages.
A more significant error than calculation of sediment distribution percentages might be the analysis of carbon and nitrogen in the silt and clay fraction in which the coarse silt, which poten tially has a lower organic matter percentage, has been lost. Organic carbon and nitrogen percent ages on silt and clay from the pumped composite sample were consistently lower than these percentages from the depth-integrated composite sample because the pumped composite sample should contain a greater percentage of the coarse silt fraction. Therefore, organic-carbon data on the silt and clay from the pumped composite sample also were used for carbon transport calcula tions. As a result of these recovery studies, a new drain housing assembly was purchased for the continuous-flow centrifuge so that this coarse silt fraction could be recovered at the end of a centrifuge run without contaminating the sample by recovering it from the sump.
Organic-carbon and nitrogen data for the silt and clay fraction recovered from the February- March 1990 sampling are presented in table 30. A significant finding is the abrupt decrease in C:N ratios in the Ohio River between Uniontown and Olmsted because of inputs of sedimentary organic materials derived from autochthonous sources by the Cumberland and Tennessee Rivers.Even though the Cumberland and Tennessee Rivers were at high discharge (2,170 m3/s, for theCumberland River and 6,570 m3/s for the Tennessee River; Moody and Meade, 1993), it appears the reservoirs of the Tennessee Valley Authority (TVA) system were acting as a trap for allochth- onous organic-sediment inputs and were exchanging these silts and clays for silts and clays with organic material from autochthonous sources, which had been accumulating in the reservoir during low-water periods. The Wabash and upper Ohio Rivers do not have significant reservoir systems like TVA where this process can occur, and C:N ratios from these rivers were much greater. As determined in previous cruises, the Upper Mississippi River also contributes sedimen tary organic matter of low C:N ratios into the system. This situation appeared to be the case during this sampling of the Mississippi River near Cache, 111. The percent of carbon on the silt and clay fraction appeared to decrease downriver; this decrease might have been the result of instream mineralization processes of carbon. Resuspension of silt and clay from bottom sediments on which carbon mineralization had already occurred may also likely occur during high-water periods.
SAMPLING CRUISE 6, FEBRUARY-MARCH 1990 57
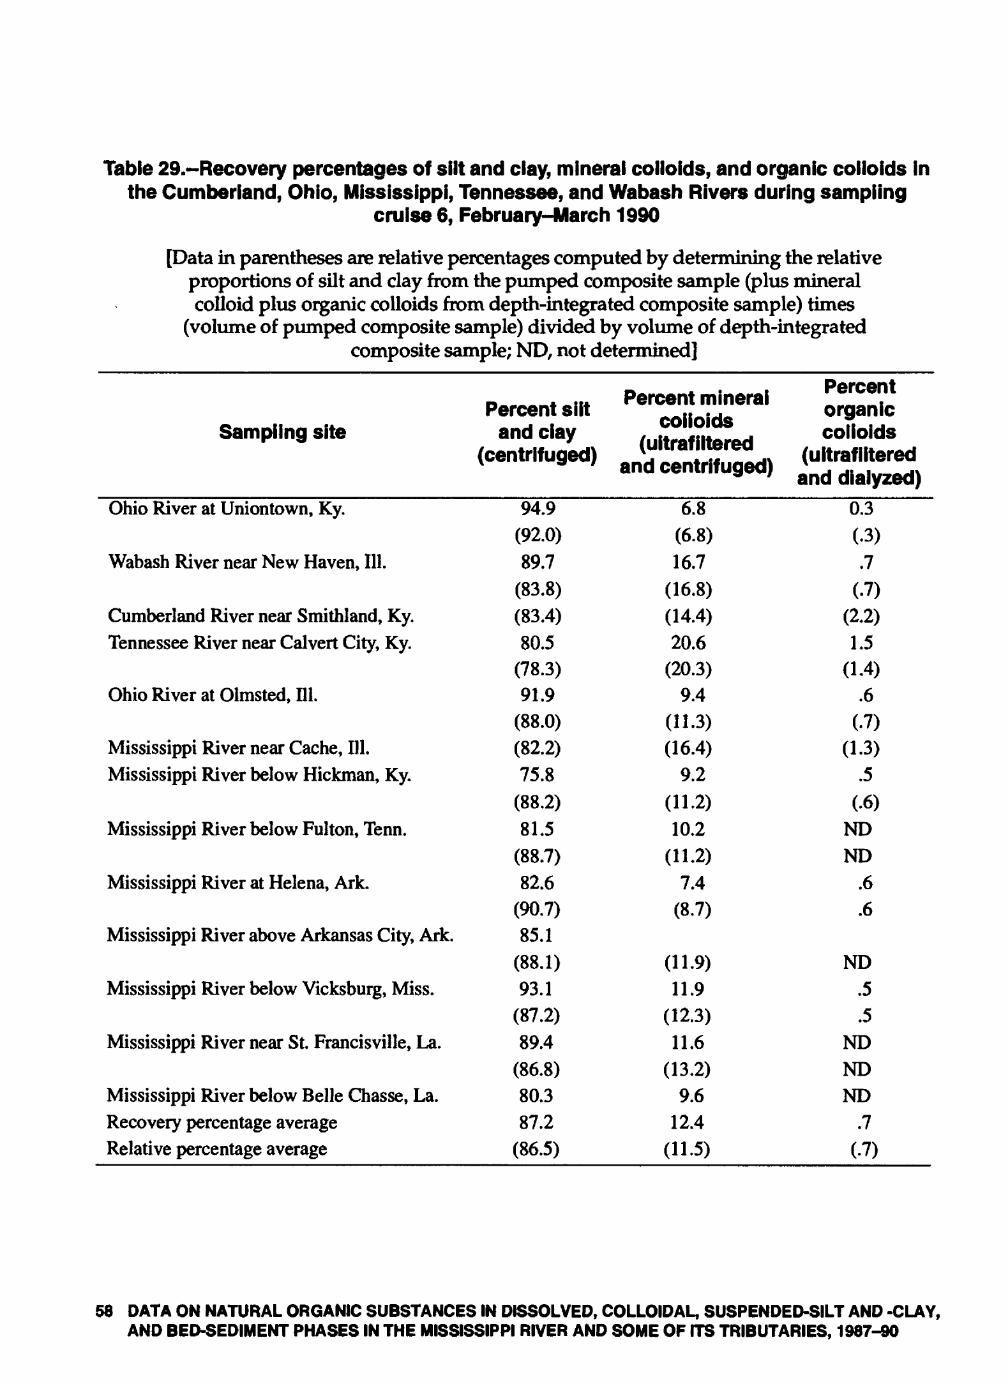
Table 29.-Recovery percentages of silt and clay, mineral colloids, and organic colloids in the Cumberland, Ohio, Mississippi, Tennessee, and Wabash Rivers during sampling
cruise 6, February-March 1990
[Data in parentheses are relative percentages computed by determining the relativeproportions of silt and clay from the pumped composite sample (plus mineralcolloid plus organic colloids from depth-integrated composite sample) times
(volume of pumped composite sample) divided by volume of depth-integratedcomposite sample; ND, not determined]
Sampling site<
Ohio River at Uniontown, Ky.
Wabash River near New Haven, 111.
Cumberland River near Smithland, Ky.Tennessee River near Calvert City, Ky.
Ohio River at Olmsted, 111.
Mississippi River near Cache, 111.Mississippi River below Hickman, Ky.
Mississippi River below Fulton, Tenn.
Mississippi River at Helena, Ark.
Mississippi River above Arkansas City, Ark.
Mississippi River below Vicksburg, Miss.
Mississippi River near St. Francisville, La.
Mississippi River below Belle Chasse, La.Recovery percentage averageRelative percentage average
Percent silt and clay
centrifuged)
94.9(92.0)89.7
(83.8)(83.4)80.5
(78.3)91.9
(88.0)(82.2)75.8
(88.2)81.5
(88.7)82.6
(90.7)85.1
(88.1)93.1
(87.2)89.4
(86.8)80.387.2
(86.5)
Percent mineral colloids
(ultrafiltered and centrifuged)
6.8(6.8)16.7
(16.8)(14.4)20.6
(20.3)9.4
(11.3)(16.4)
9.2(11.2)10.2
(11.2)7.4
(8.7)
(11.9)11.9
(12.3)11.6
(13.2)9.6
12.4(11.5)
Percent organic colloids
(ultrafiltered and dialyzed)
0.3(.3).7
(.7)(2.2)1.5
(1.4).6
(.7)(1.3)
.5(.6)
NDND
.6
.6
ND.5.5
NDNDND
.7(-7)
58 DATA ON NATURAL ORGANIC SUBSTANCES IN DISSOLVED, COLLOIDAL, SUSPENDED-SILT AND -CLAY, AND BED-SEDIMENT PHASES IN THE MISSISSIPPI RIVER AND SOME OF ITS TRIBUTARIES, 1987-90
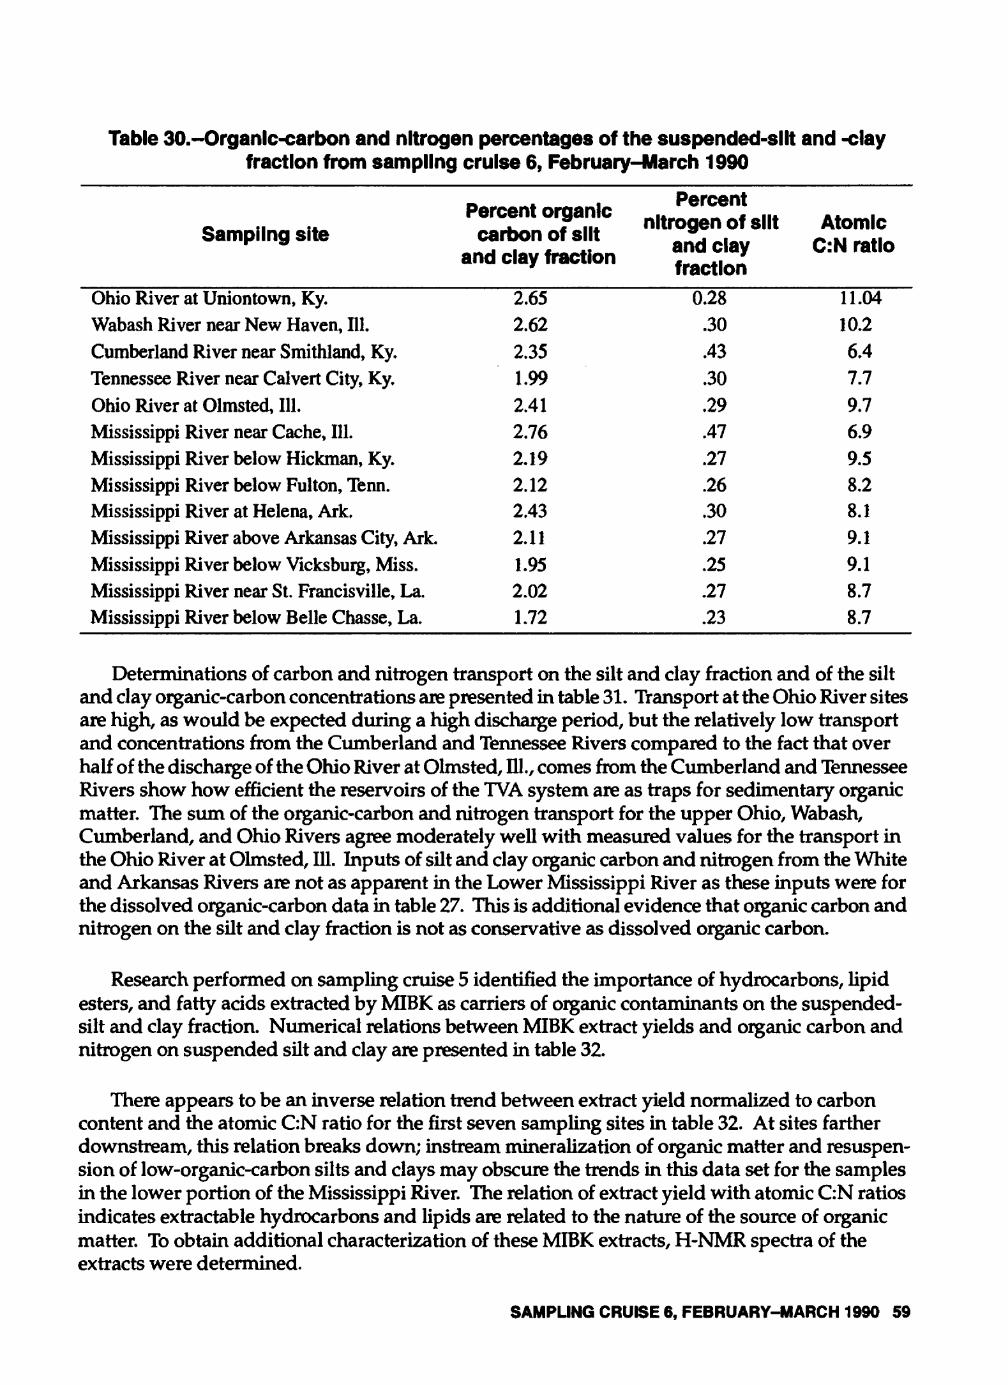
Table 30.-Organlc-carbon and nitrogen percentages of the suspended-silt and -clay fraction from sampling cruise 6, February-March 1990
Percent organic Sampling site carbon of siit
and ciay fraction
Ohio River at Uniontown, Ky.Wabash River near New Haven, HI.Cumberland River near Smithland, Ky.Tennessee River near Calvert City, Ky.Ohio River at Olmsted, 111.Mississippi River near Cache, 111.Mississippi River below Hickman, Ky.Mississippi River below Fulton, Tenn.Mississippi River at Helena, Ark.Mississippi River above Arkansas City, Ark.Mississippi River below Vicksburg, Miss.Mississippi River near St. Francisville, La.Mississippi River below Belle Chasse, La.
2.652.622.351.992.412.762.192.122.432.111.952.021.72
Percent nitrogen of siit
and clay fraction
0.28.30.43.30.29.47.27.26.30.27.25.27.23
Atomic C:N ratio
11.0410.26.47.79.76.99.58.28.19.19.18.78.7
Determinations of carbon and nitrogen transport on the silt and clay fraction and of the silt and clay organic-carbon concentrations are presented in table 31. Transport at the Ohio River sites are high, as would be expected during a high discharge period, but the relatively low transport and concentrations from the Cumberland and Tennessee Rivers compared to the fact that over half of the discharge of the Ohio River at Olmsted, 111., comes from the Cumberland and Tennessee Rivers show how efficient the reservoirs of the TVA system are as traps for sedimentary organic matter. The sum of the organic-carbon and nitrogen transport for the upper Ohio, Wabash, Cumberland, and Ohio Rivers agree moderately well with measured values for the transport in the Ohio River at Olmsted, 111. Inputs of silt and clay organic carbon and nitrogen from the White and Arkansas Rivers are not as apparent in the Lower Mississippi River as these inputs were for the dissolved organic-carbon data in table 27. This is additional evidence that organic carbon and nitrogen on the silt and clay fraction is not as conservative as dissolved organic carbon.
Research performed on sampling cruise 5 identified the importance of hydrocarbons, lipid esters, and fatty acids extracted by MIBK as carriers of organic contaminants on the suspended- silt and clay fraction. Numerical relations between MIBK extract yields and organic carbon and nitrogen on suspended silt and clay are presented in table 32.
There appears to be an inverse relation trend between extract yield normalized to carbon content and the atomic C:N ratio for the first seven sampling sites in table 32. At sites farther downstream, this relation breaks down; instream mineralization of organic matter and resuspen- sion of low-organic-carbon silts and clays may obscure the trends in this data set for the samples in the lower portion of the Mississippi River. The relation of extract yield with atomic C:N ratios indicates extractable hydrocarbons and lipids are related to the nature of the source of organic matter. To obtain additional characterization of these MIBK extracts, H-NMR spectra of the extracts were determined.
SAMPLING CRUISE 6, FEBRUARY-MARCH 1990 59
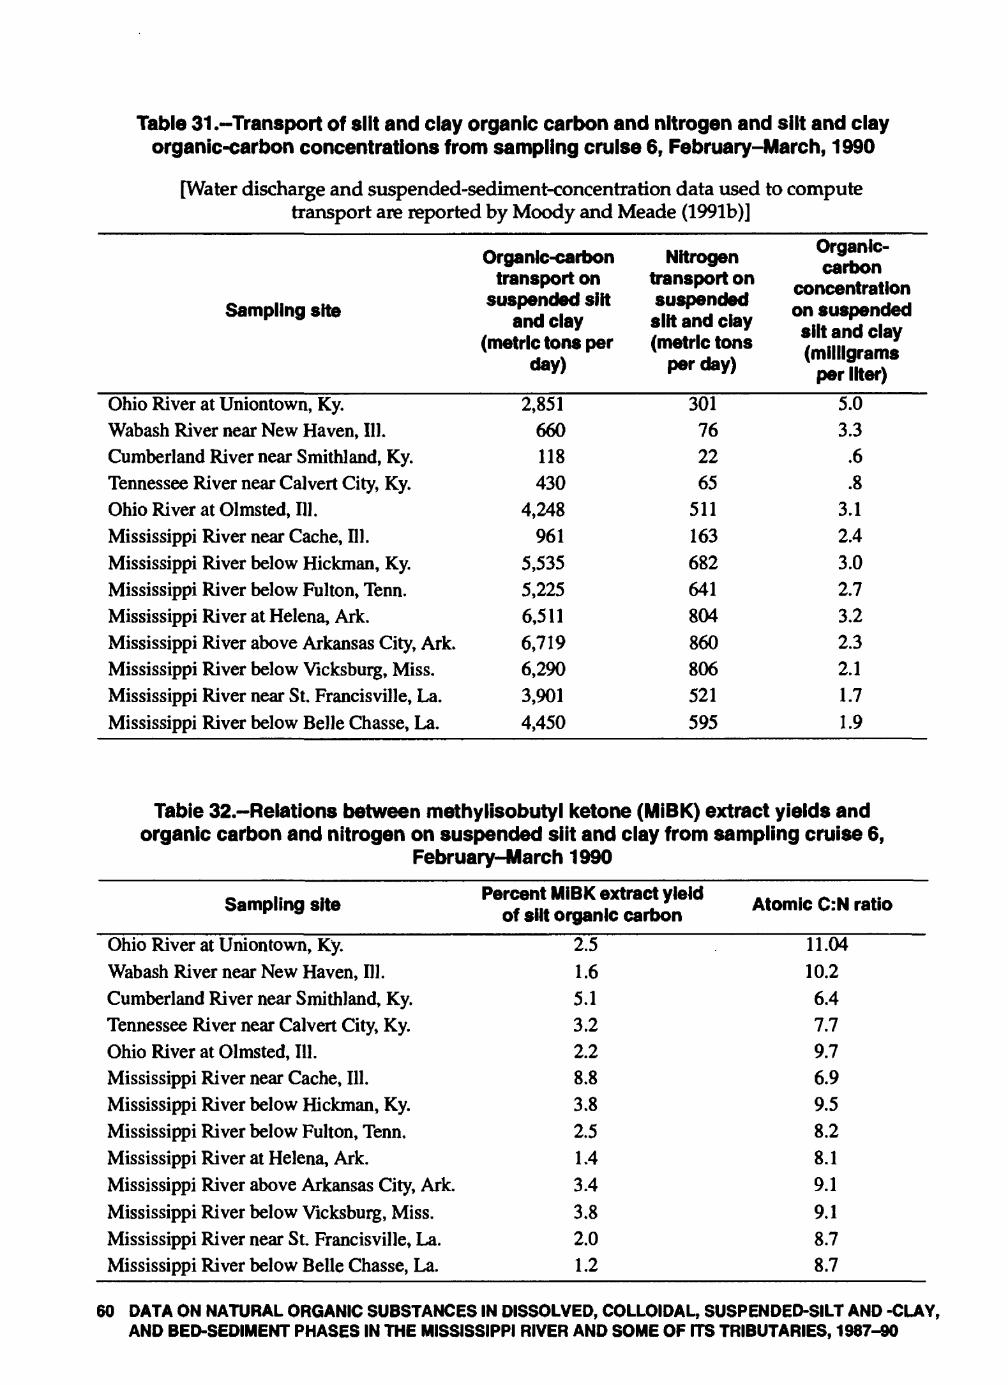
Table 31 .-Transport of silt and clay organic carbon and nitrogen and silt and clay organic-carbon concentrations from sampling cruise 6, February-March, 1990
[Water discharge and suspended-sediment-concentration data used to compute transport are reported by Moody and Meade (1991b)]
<
Sampling site
(
Ohio River at Uniontown, Ky.Wabash River near New Haven, 111.Cumberland River near Smithland, Ky.Tennessee River near Calvert City, Ky.Ohio River at Olmsted, 111.Mississippi River near Cache, 111.Mississippi River below Hickman, Ky.Mississippi River below Fulton, Tenn.Mississippi River at Helena, Ark.Mississippi River above Arkansas City, Ark.Mississippi River below Vicksburg, Miss.Mississippi River near St. Francisville, La.Mississippi River below Belle Chasse, La.
Organic-carbon transport on
suspended silt and clay
metric tons per day)
2,851660118430
4,248961
5,5355,2256,5116,7196,2903,9014,450
Nitrogen transport on suspended slit and clay (metric tons
per day)
301762265
511163682641804860806521595
Organic- carbon
concentration on suspended silt and clay (milligrams
per liter)5.03.3
.6
.83.12.43.02.73.22.32.11.71.9
Table 32.-Relations between methylisobutyl ketone (MIBK) extract yields and organic carbon and nitrogen on suspended silt and clay from sampling cruise 6,
February-March 1990
Sampling site
Ohio River at Uniontown, Ky. Wabash River near New Haven, 111. Cumberland River near Smithland, Ky. Tennessee River near Calvert City, Ky. Ohio River at Olmsted, 111. Mississippi River near Cache, 111.Mississippi River below Hickman, Ky. Mississippi River below Fulton, Tenn. Mississippi River at Helena, Ark. Mississippi River above Arkansas City, Ark.Mississippi River below Vicksburg, Miss.Mississippi River near St. Francisville, La. Mississippi River below Belle Chasse, La.
Percent MIBK extract yield of silt organic carbon
2.5 1.6 5.1 3.2 2.2 8.83.82.5 1.4 3.43.82.0 1.2
Atomic C:N ratio
11.04 10.2 6.4 7.7 9.7 6.99.5 8.2 8.1 9.19.18.7 8.7
60 DATA ON NATURAL ORGANIC SUBSTANCES IN DISSOLVED, COLLOIDAL, SUSPENDED-SILT AND -CLAY, AND BED-SEDIMENT PHASES IN THE MISSISSIPPI RIVER AND SOME OF ITS TRIBUTARIES, 1987-90
Two general types of 1H-NMR spectral patterns are shown in figure 16. Extracts from silts and clays with low C:N ratios (autochthonous source term) gave spectra similar to spectrum A, figure 16, whereas extracts from silts and clays with high C:N ratios (allochthonous source term) gave spectra similar to spectrum B, figure 16. The composition of the extract of spectrum A appears to be straight chain acids, lipids, and hydrocarbons (peaks 1 and 2), with some olefinic hydrocarbons (peak 4) in the mixture. The extract of spectrum B differs from spectrum A in that the peak height ratio of peak 1 to peak 2 is greater, meaning there are more branched hydrocarbon components. Peak 3 is also much greater in spectrum B. Peak 3 may be indicative of methyl groups attached to a doubly-bonded carbon, as is found in plant pigments such as the carotene hydrocarbons. Nospecific organic contaminants or classes of organic contaminants were detected in the 1H-NMR survey of MIBK extracts of suspended silts and clays.
SAMPLING CRUISE 6, FEBRUARY-MARCH 1990 61
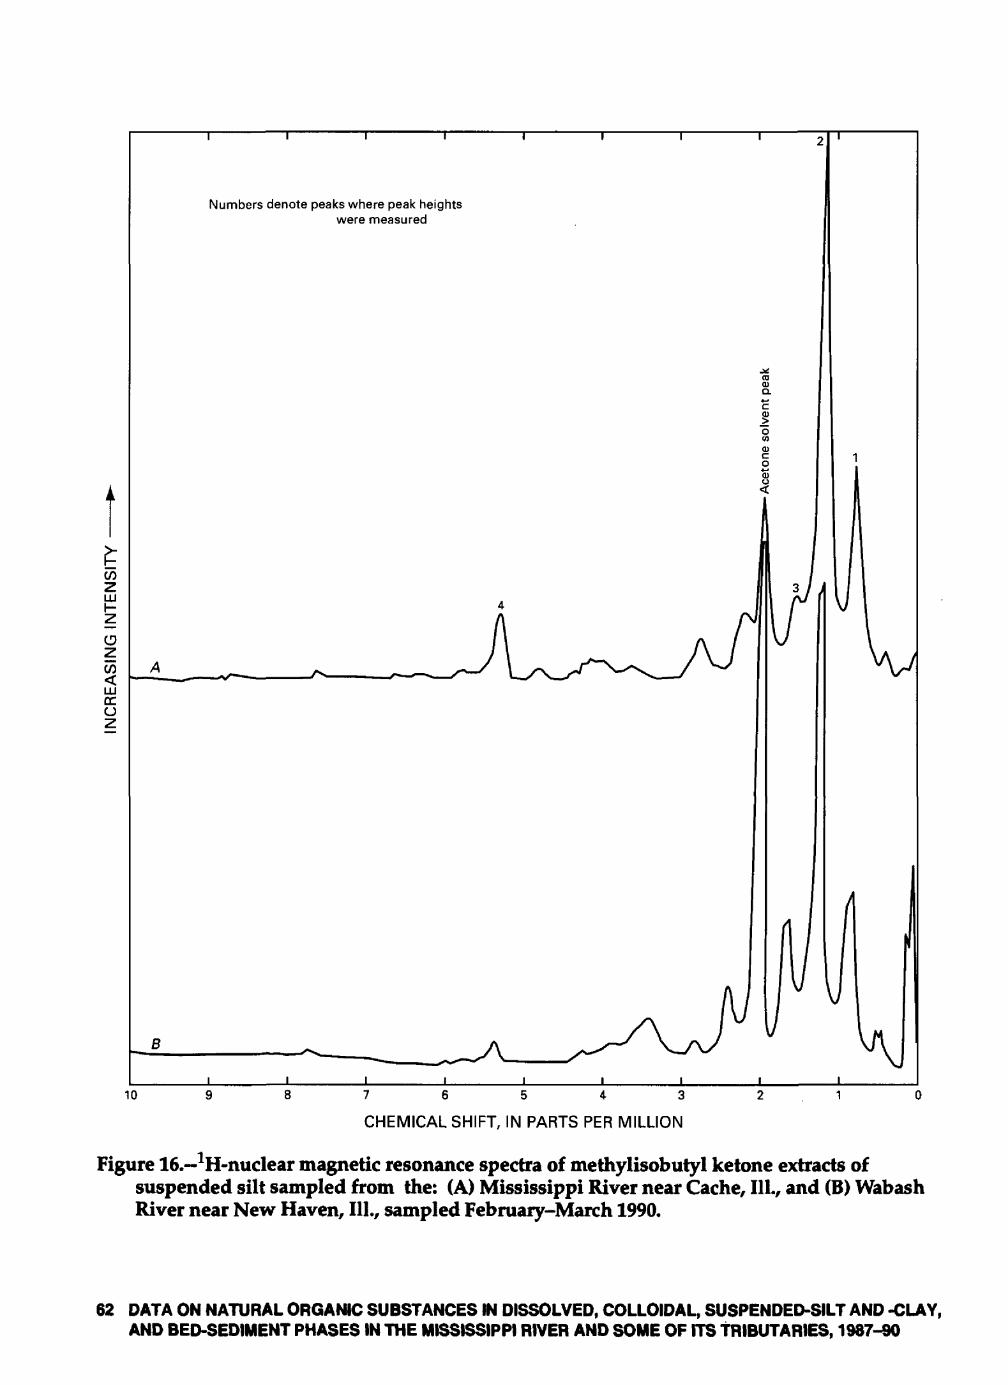
Numbers denote peaks where peak height: were measured
76543
CHEMICAL SHIFT, IN PARTS PER MILLION
Figure 16. 1H-nuclear magnetic resonance spectra of methylisobutyl ketone extracts ofsuspended silt sampled from the: (A) Mississippi River near Cache, 111., and (B) Wabash River near New Haven, 111., sampled February-March 1990.
62 DATA ON NATURAL ORGANIC SUBSTANCES IN DISSOLVED, COLLOIDAL, SUSPENDED-SILT AND -CLAY, AND BED-SEDIMENT PHASES IN THE MISSISSIPPI RIVER AND SOME OF ITS TRIBUTARIES, 1987-90
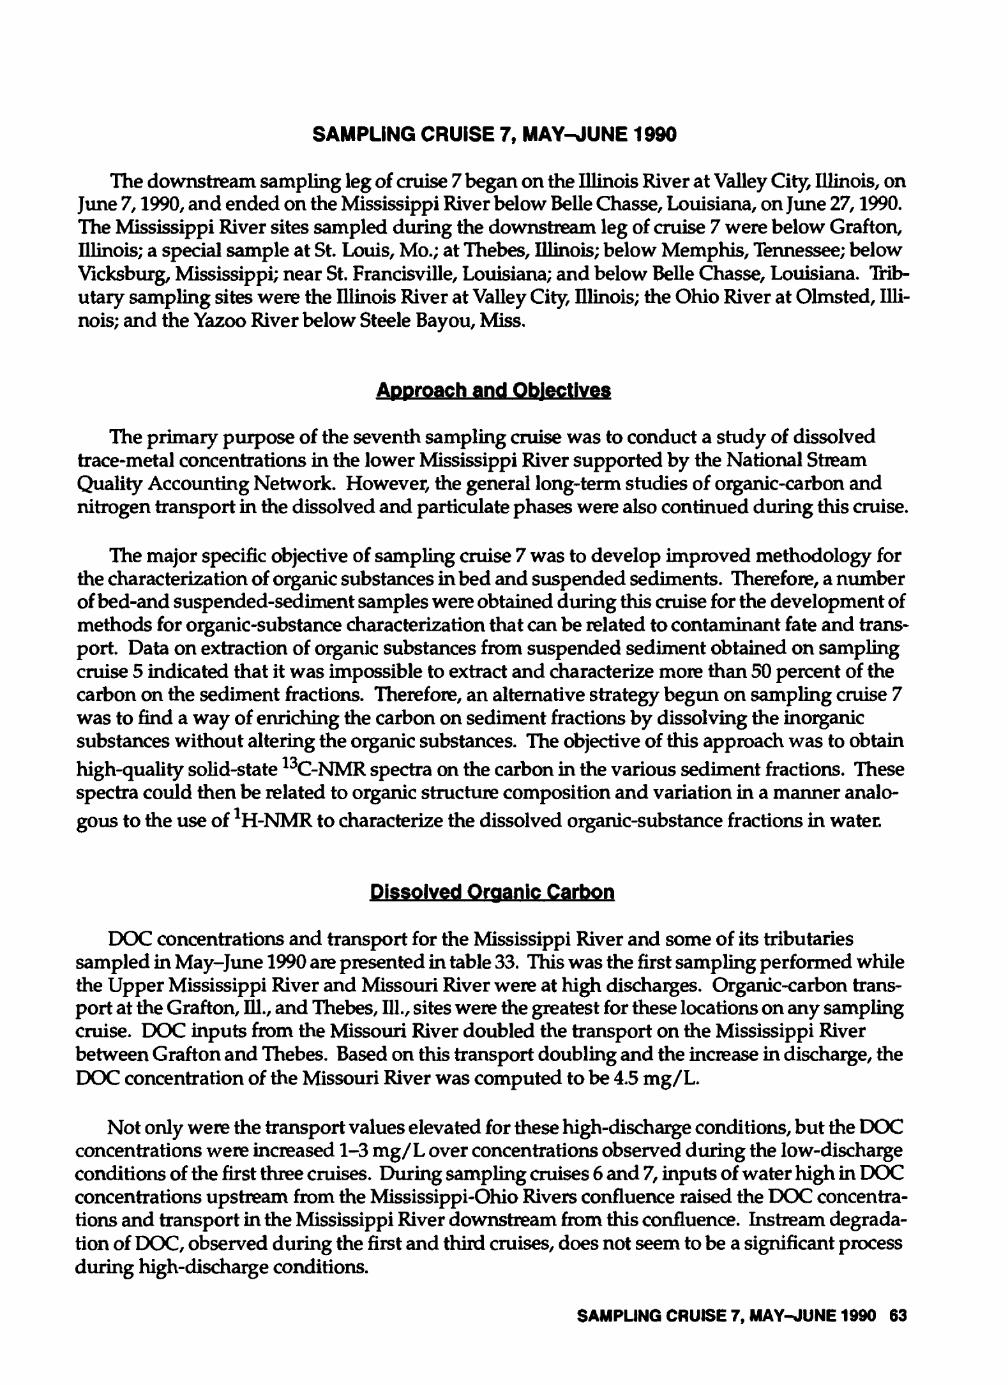
SAMPLING CRUISE 7, MAY-JUNE 1990
The downstream sampling leg of cruise 7 began on the Illinois River at Valley City, Illinois, on June 7,1990, and ended on the Mississippi River below Belle Chasse, Louisiana, on June 27,1990. The Mississippi River sites sampled during the downstream leg of cruise 7 were below Grafton, Illinois; a special sample at St. Louis, Mo.; at Thebes, Illinois; below Memphis, Tennessee; below Vicksburg, Mississippi; near St. Francisville, Louisiana; and below Belle Chasse, Louisiana. Trib utary sampling sites were the Illinois River at Valley City, Illinois; the Ohio River at Olmsted, Illi nois; and the Yazoo River below Steele Bayou, Miss.
Approach and Objectives
The primary purpose of the seventh sampling cruise was to conduct a study of dissolved trace-metal concentrations in the lower Mississippi River supported by the National Stream Quality Accounting Network. However, the general long-term studies of organic-carbon and nitrogen transport in the dissolved and particulate phases were also continued during this cruise.
The major specific objective of sampling cruise 7 was to develop improved methodology for the characterization of organic substances in bed and suspended sediments. Therefore, a number of bed-and suspended-sediment samples were obtained during this cruise for the development of methods for organic-substance characterization that can be related to contaminant fate and trans port. Data on extraction of organic substances from suspended sediment obtained on sampling cruise 5 indicated that it was impossible to extract and characterize more than 50 percent of the carbon on the sediment fractions. Therefore, an alternative strategy begun on sampling cruise 7 was to find a way of enriching the carbon on sediment fractions by dissolving the inorganic substances without altering the organic substances. The objective of this approach was to obtainhigh-quality solid-state 13C-NMR spectra on the carbon in the various sediment fractions. These spectra could then be related to organic structure composition and variation in a manner analo gous to the use of 1H-NMR to characterize the dissolved organic-substance fractions in water.
Dissolved Orosnic Csrbon
DOC concentrations and transport for the Mississippi River and some of its tributaries sampled in May-June 1990 are presented in table 33. This was the first sampling performed while the Upper Mississippi River and Missouri River were at high discharges. Organic-carbon trans port at the Grafton, 111., and Thebes, 111., sites were the greatest for these locations on any sampling cruise. DOC inputs from the Missouri River doubled the transport on the Mississippi River between Grafton and Thebes. Based on this transport doubling and the increase in discharge, the DOC concentration of the Missouri River was computed to be 4.5 mg/L.
Not only were the transport values elevated for these high-discharge conditions, but the DOC concentrations were increased 1-3 mg/L over concentrations observed during the low-discharge conditions of the first three cruises. During sampling cruises 6 and 7, inputs of water high in DOC concentrations upstream from the Mississippi-Ohio Rivers confluence raised the DOC concentra tions and transport in the Mississippi River downstream from this confluence. Instream degrada tion of DOC, observed during the first and third cruises, does not seem to be a significant process during high-discharge conditions.
SAMPLING CRUISE 7, MAY-JUNE 1990 63
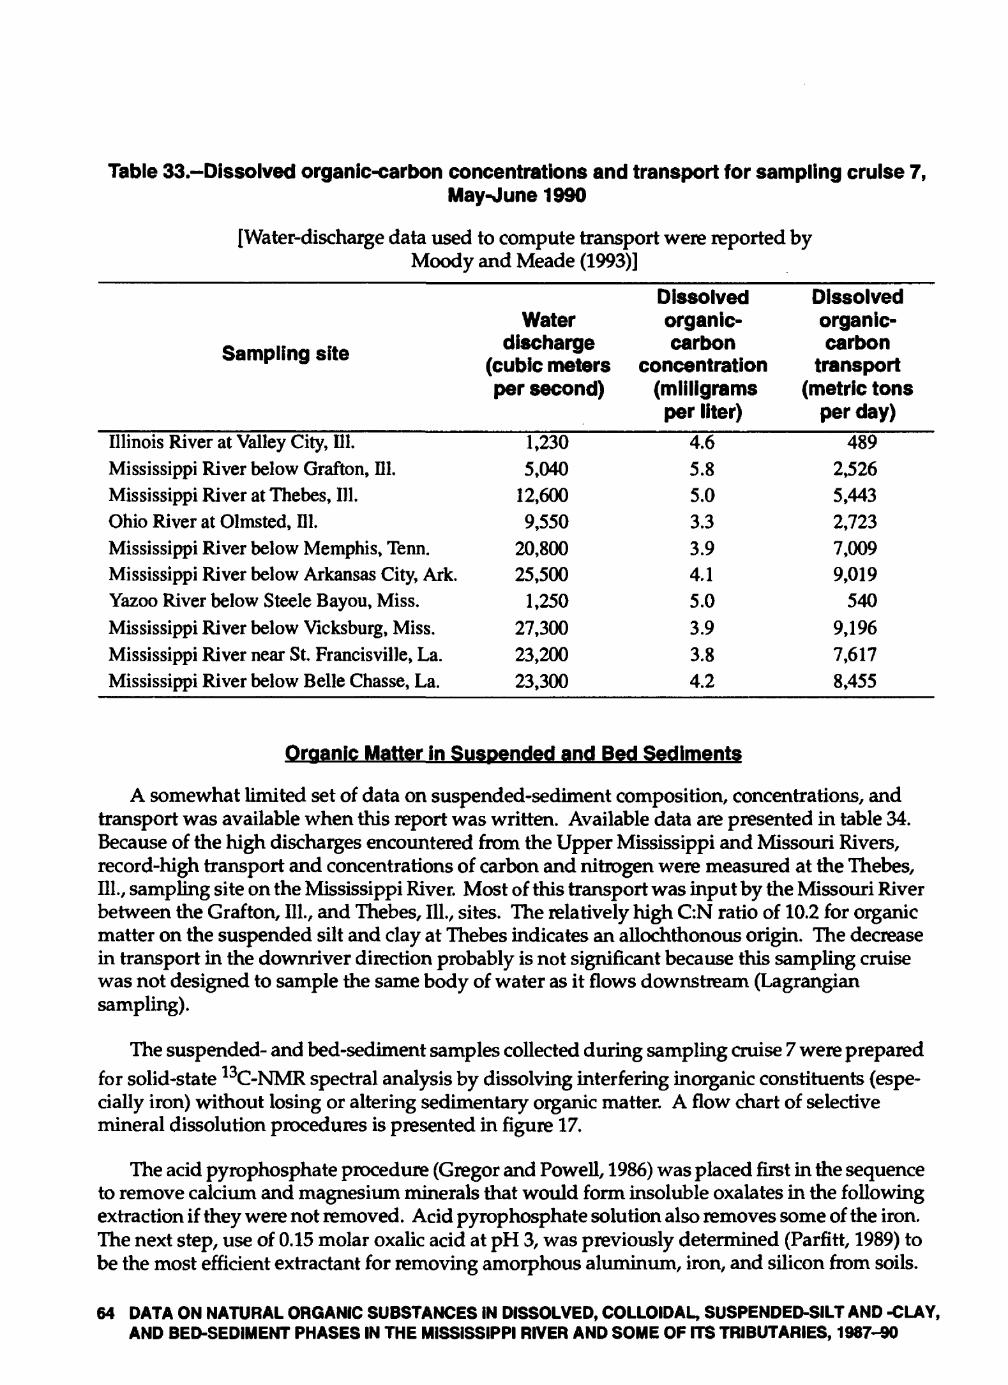
Table 33.-Dissolved organic-carbon concentrations and transport for sampling cruise 7,May-June 1990
[Water-discharge data used to compute transport were reported by Moody and Meade (1993)]
Sampling site
Illinois River at Valley City, 111.Mississippi River below Grafton, 111.Mississippi River at Thebes, 111.Ohio River at Olmsted, 111.Mississippi River below Memphis, Tenn.Mississippi River below Arkansas City, Ark. Yazoo River below Steele Bayou, Miss.Mississippi River below Vicksburg, Miss. Mississippi River near St. Francisville, La.Mississippi River below Belle Chasse, La.
Water discharge
(cubic meters per second)
1,2305,040
12,6009,550
20,80025,500
1,25027,300 23,20023,300
Dissolvedorganic- carbon
concentration (milligrams per liter)
4.65.85.03.33.94.1 5.03.9 3.84.2
Dissolvedorganic- carbon
transport (metric tons
per day)489
2,5265,4432,7237,0099,019
5409,196 7,6178,455
Organic Matter in Suspended and Bed Sediments
A somewhat limited set of data on suspended-sediment composition, concentrations, and transport was available when this report was written. Available data are presented in table 34. Because of the high discharges encountered from the Upper Mississippi and Missouri Rivers, record-high transport and concentrations of carbon and nitrogen were measured at the Thebes, HI., sampling site on the Mississippi River. Most of this transport was input by the Missouri River between the Grafton, 111., and Thebes, 111., sites. The relatively high C:N ratio of 10.2 for organic matter on the suspended silt and clay at Thebes indicates an allochthonous origin. The decrease in transport in the downriver direction probably is not significant because this sampling cruise was not designed to sample the same body of water as it flows downstream (Lagrangian sampling).
The suspended- and bed-sediment samples collected during sampling cruise 7 were preparedfor solid-state 13C-NMR spectral analysis by dissolving interfering inorganic constituents (espe cially iron) without losing or altering sedimentary organic matter. A flow chart of selective mineral dissolution procedures is presented in figure 17.
The acid pyrophosphate procedure (Gregor and Powell, 1986) was placed first in the sequence to remove calcium and magnesium minerals that would form insoluble oxalates in the following extraction if they were not removed. Acid pyrophosphate solution also removes some of the iron. The next step, use of 0.15 molar oxalic acid at pH 3, was previously determined (Parfitt, 1989) to be the most efficient extractant for removing amorphous aluminum, iron, and silicon from soils.
64 DATA ON NATURAL ORGANIC SUBSTANCES IN DISSOLVED, COLLOIDAL, SUSPENDED-SILT AND -CLAY, AND BED-SEDIMENT PHASES IN THE MISSISSIPPI RIVER AND SOME OF ITS TRIBUTARIES, 1987-90
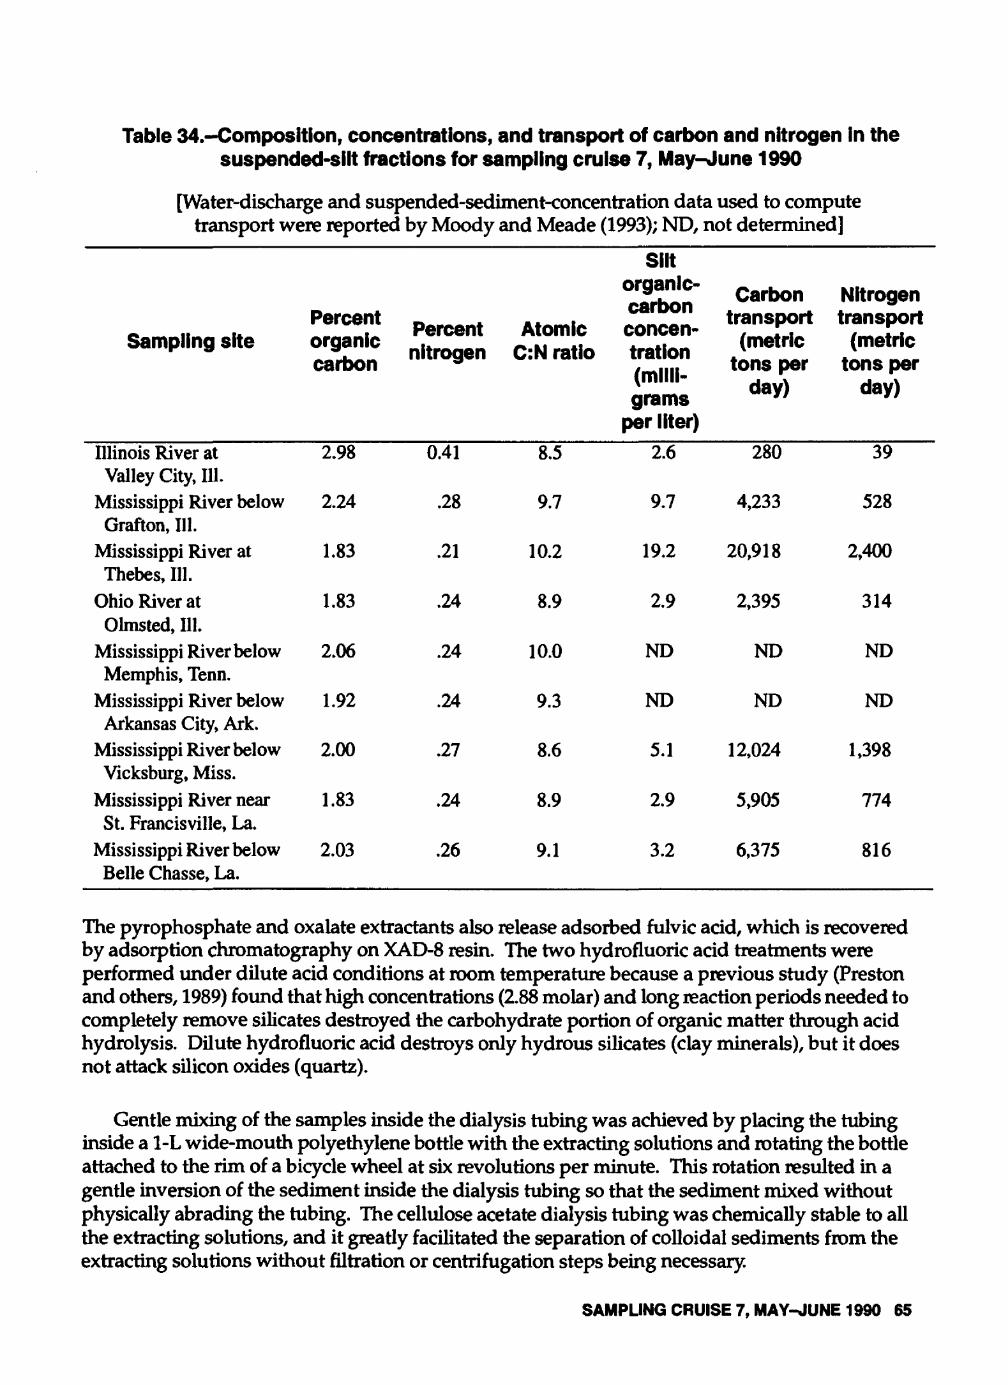
Table 34.-Composition, concentrations, and transport of carbon and nitrogen in the suspended-silt fractions for sampling cruise 7, May-June 1990
[Water-discharge and suspended-sediment-concentration data used to compute transport were reported by Moody and Meade (1993); ND, not determined]
Silt
Perce1site Percent Atomic concen-
Carbon tr "8P°rt
Illinois River at Valley City, 111.
Mississippi River below Grafton, 111.
Mississippi River at Thebes, 111.
Ohio River atOlmsted, 111.
Mississippi River below Memphis, Tenn.
Mississippi River below Arkansas City, Ark.
Mississippi River below Vicksburg, Miss.
Mississippi River near St. Francisville, La.
Mississippi River below Belle Chasse, La.
carbon
2.98
2.24
1.83
1.83
2.06
1.92
2.00
1.83
2.03
iiiuwycn
0.41
.28
.21
.24
.24
.24
.27
.24
.26
\S.I1 IdUVI
8.5
9.7
10.2
8.9
10.0
9.3
8.6
8.9
9.1
t 11 dllWI 1
(milli grams
per liter)2.6
9.7
19.2
2.9
ND
ND
5.1
2.9
3.2
tons per day)
280
4,233
20,918
2,395
ND
ND
12,024
5,905
6,375
tons per day)
39
528
2,400
314
ND
ND
1,398
774
816
The pyrophosphate and oxalate extractants also release adsorbed fulvic acid, which is recovered by adsorption chromatography on XAD-8 resin. The two hydrofluoric acid treatments were performed under dilute acid conditions at room temperature because a previous study (Preston and others, 1989) found that high concentrations (2.88 molar) and long reaction periods needed to completely remove silicates destroyed the carbohydrate portion of organic matter through acid hydrolysis. Dilute hydrofluoric acid destroys only hydrous silicates (clay minerals), but it does not attack silicon oxides (quartz).
Gentle mixing of the samples inside the dialysis tubing was achieved by placing the tubing inside a 1-L wide-mouth polyethylene bottle with the extracting solutions and rotating the bottle attached to the rim of a bicycle wheel at six revolutions per minute. This rotation resulted in a gentle inversion of the sediment inside the dialysis tubing so that the sediment mixed without physically abrading the tubing. The cellulose acetate dialysis tubing was chemically stable to all the extracting solutions, and it greatly facilitated the separation of colloidal sediments from the extracting solutions without filtration or centrifugation steps being necessary.
SAMPLING CRUISE 7, MAY-JUNE 1990 65
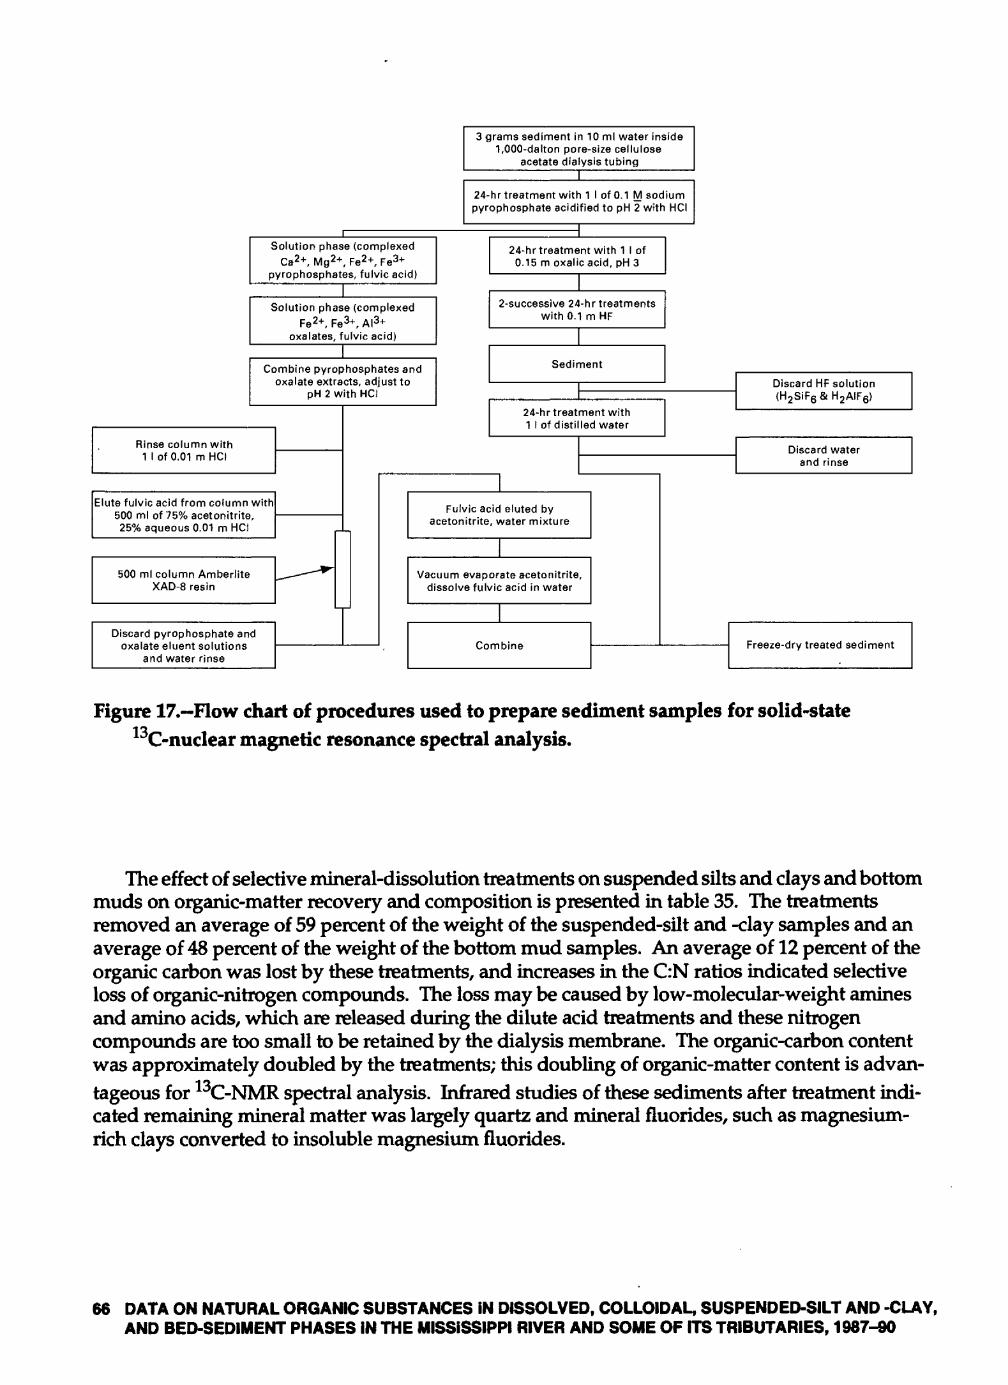
Rinse column with 1 I of 0.01 mHCt
Solution phase {complexedCa2+ , Mg 2+ , Fe2+ , Fe3+
pyrophosphates, fulvic acid)
Solution phase (complexedFe 2+ , Fe3+ , AI3+
oxalates, fulvic acid)
Combine pyrophosphates andoxalate extracts, adjust to
pH 2 with HCI
Elute fulvic acid from column with! 500 ml of 75% acetonitrite, 25% aqueous 0.01 m HCI
500 ml column Amberlite XAD-8 resin
Discard pyrophosphate andoxalate eluent solutions
and water rinse
3 grams sediment in 10 ml water inside1,000-dalton pore-size cellulose
acetate dialysis tubing_L
24-hr treatment with 1 I of 0.1 M sodium pyrophosphate acidified to pH 2 with HCI
24-hr treatment with 1 I of 0.15 m oxalic acid, pH 3
2-successive 24-hr treatments with 0.1 m HF
Sediment
24-hr treatment with 1 I of distilled water
Discard HF solution (H 2 SiF6 &H 2AIF6)
Fulvic acid eluted by acetonitrite, water mixture
Vacuum evaporate acetonitrite, dissolve fulvic acid in water
Combine
Discard water and rinse
Freeze-dry treated sediment
Figure 17. Flow chart of procedures used to prepare sediment samples for solid-state 13C-nuclear magnetic resonance spectral analysis.
The effect of selective mineral-dissolution treatments on suspended silts and clays and bottom muds on organic-matter recovery and composition is presented in table 35. The treatments removed an average of 59 percent of the weight of the suspended-silt and -clay samples and an average of 48 percent of the weight of the bottom mud samples. An average of 12 percent of the organic carbon was lost by these treatments, and increases in the C:N ratios indicated selective loss of organic-nitrogen compounds. The loss may be caused by low-molecular-weight amines and amino acids, which are released during the dilute acid treatments and these nitrogen compounds are too small to be retained by the dialysis membrane. The organic-carbon content was approximately doubled by the treatments; this doubling of organic-matter content is advan tageous for 13C-NMR spectral analysis. Infrared studies of these sediments after treatment indi cated remaining mineral matter was largely quartz and mineral fluorides, such as magnesium- rich clays converted to insoluble magnesium fluorides.
66 DATA ON NATURAL ORGANIC SUBSTANCES IN DISSOLVED, COLLOIDAL, SUSPENDED-SILT AND -CLAY, AND BED-SEDIMENT PHASES IN THE MISSISSIPPI RIVER AND SOME OF ITS TRIBUTARIES, 1987-90
Table 35.-Effect of selective mineral dissolution treatments on suspended-silts and -ciays and bottom muds on organic matter recoveries and composition
Sampling site and sample
Per- Per cent cent
carbon carbon before after treat- treat ment ment
Per- Per cent cent nitro- nitro gen gen
before after treat- treat ment ment
Per cent Atomic Atomic or- C:N C:N
gen gen JT" ganic before after efore after W«*'SIU car. treat- treat-
bon ioss
Per cent
losstreat ment
2.14 4.98
1.26 2.67
1.78 3.42
.14 .26 45.94 -12.8 10.5
treat ment
10.0
.25 .56 63.47 15.0 10.0 10.4
12.0
Illinois River at Valley City, HI.
Suspended silt 3.23 7.27 0.44 0.85 60.75 11.7 8.6and clay
Mississippi River below Grafton, HI.
Suspended siltand clay
Bottom mud Mississippi River at
St. Louis, Mo. Suspended silt
and clayMississippi River at Thebes, HI.
Suspended silt 1.82 3.64 .21 .36 57.60 15.2 10.1 11.8 and clay
Bottom mud 1.17 1.88 .16 .18 48.82 17.8 8.5 12.2 Ohio River at
Olmsted, 111.
.20 .32 52.11 8.0 10.4 12.5
Suspended silt and clay
Bottom mud
2.08
1.44
4.52
3.02
.24
.16
.46
.27
60.2
48.5
13.5
10.5
10.1
13.0
11.5
13.1
A recent advance in 13C-NMR spectrometry is the development of large-sample, magic-angle spinners that provide enhanced signal-to-noise ratios in the spectra (Zhang and Maciel, 1990). This new technology was applied to both treated and untreated suspended silts sampled at St. Louis, Mo. The results are shown in figure 18. Results on the untreated sample (spectrum A) are superior to previous results obtained with the small-volume, magic-angle spinner used for the colloids from sampling cruise 1 (fig. 5); and results on the treated sample (spectrum B) gave much better resolution of peaks than the untreated sample (spectrum A). The spectral band-broadening problem caused by iron in the untreated sample was solved by the treatment procedure, and the peak resolution and interpretation of the spectra were facilitated in spectrum B.
SAMPLING CRUISE 7, MAY-JUNE 1990 67
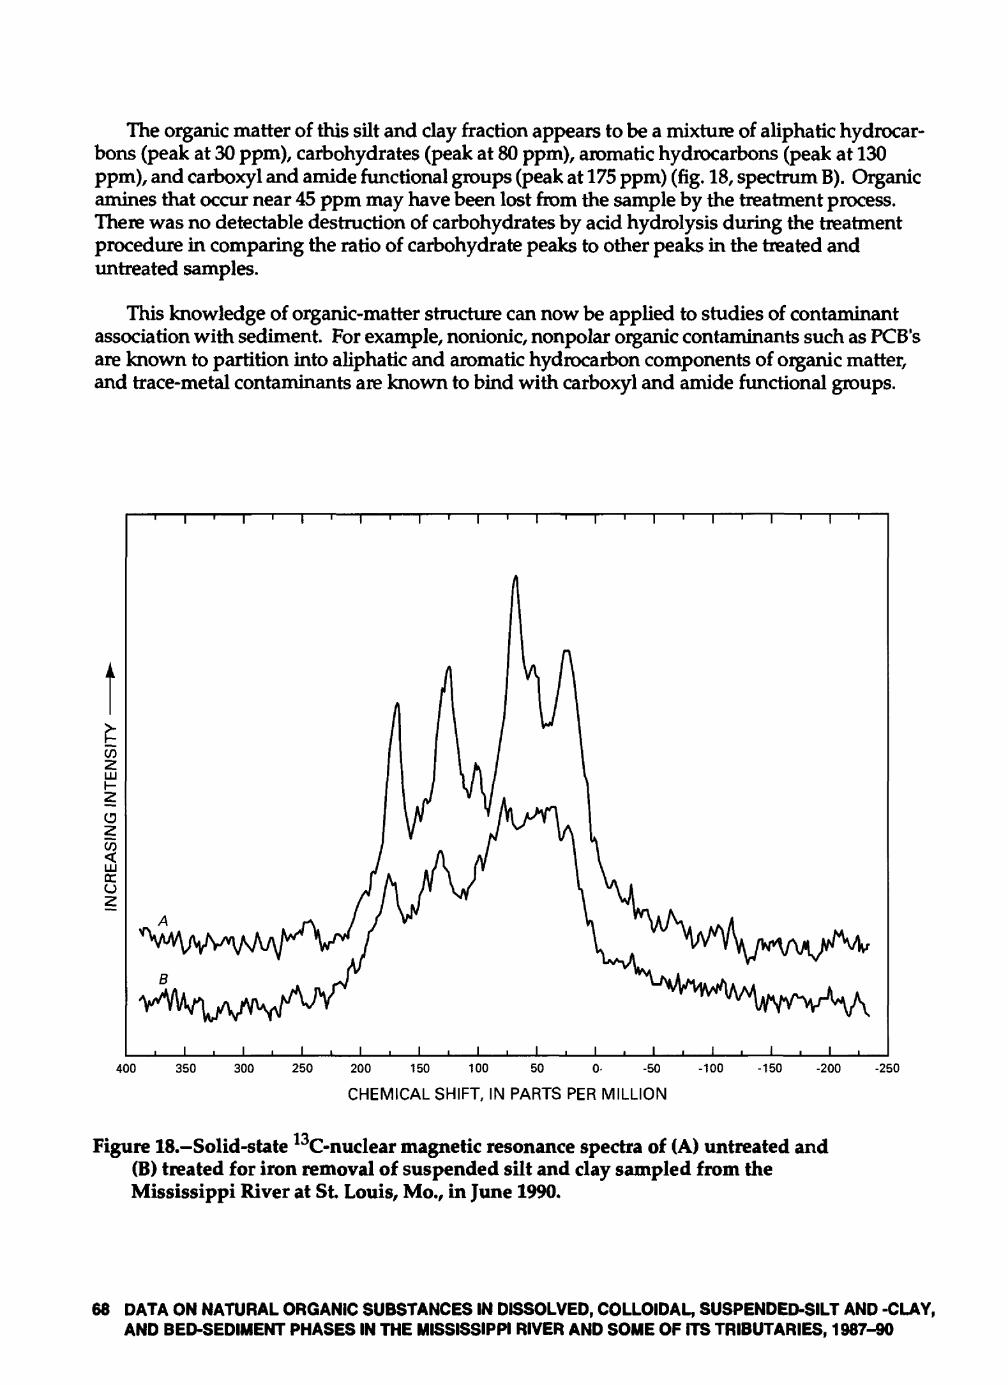
The organic matter of this silt and day fraction appears to be a mixture of aliphatic hydrocar bons (peak at 30 ppm), carbohydrates (peak at 80 ppm), aromatic hydrocarbons (peak at 130 ppm), and carboxyl and amide functional groups (peak at 175 ppm) (fig. 18, spectrum B). Organic amines that occur near 45 ppm may have been lost from the sample by the treatment process. There was no detectable destruction of carbohydrates by acid hydrolysis during the treatment procedure in comparing the ratio of carbohydrate peaks to other peaks in the treated and untreated samples.
This knowledge of organic-matter structure can now be applied to studies of contaminant association with sediment. For example, nonionic, nonpolar organic contaminants such as PCB's are known to partition into aliphatic and aromatic hydrocarbon components of organic matter, and trace-metal contaminants are known to bind with carboxyl and amide functional groups.
CO
CO<LU QC O
I
400 350 300 250 200 150 100 50 0- -50
CHEMICAL SHIFT, IN PARTS PER MILLION
-100 -150 -200 -250
Figure 18.-Solid-state 13C-nuclear magnetic resonance spectra of (A) untreated and (B) treated for iron removal of suspended silt and clay sampled from the Mississippi River at St. Louis, Mo., in June 1990.
68 DATA ON NATURAL ORGANIC SUBSTANCES IN DISSOLVED, COLLOIDAL, SUSPENDED-SILT AND -CLAY, AND BED-SEDIMENT PHASES IN THE MISSISSIPPI RIVER AND SOME OF ITS TRIBUTARIES, 1987-90
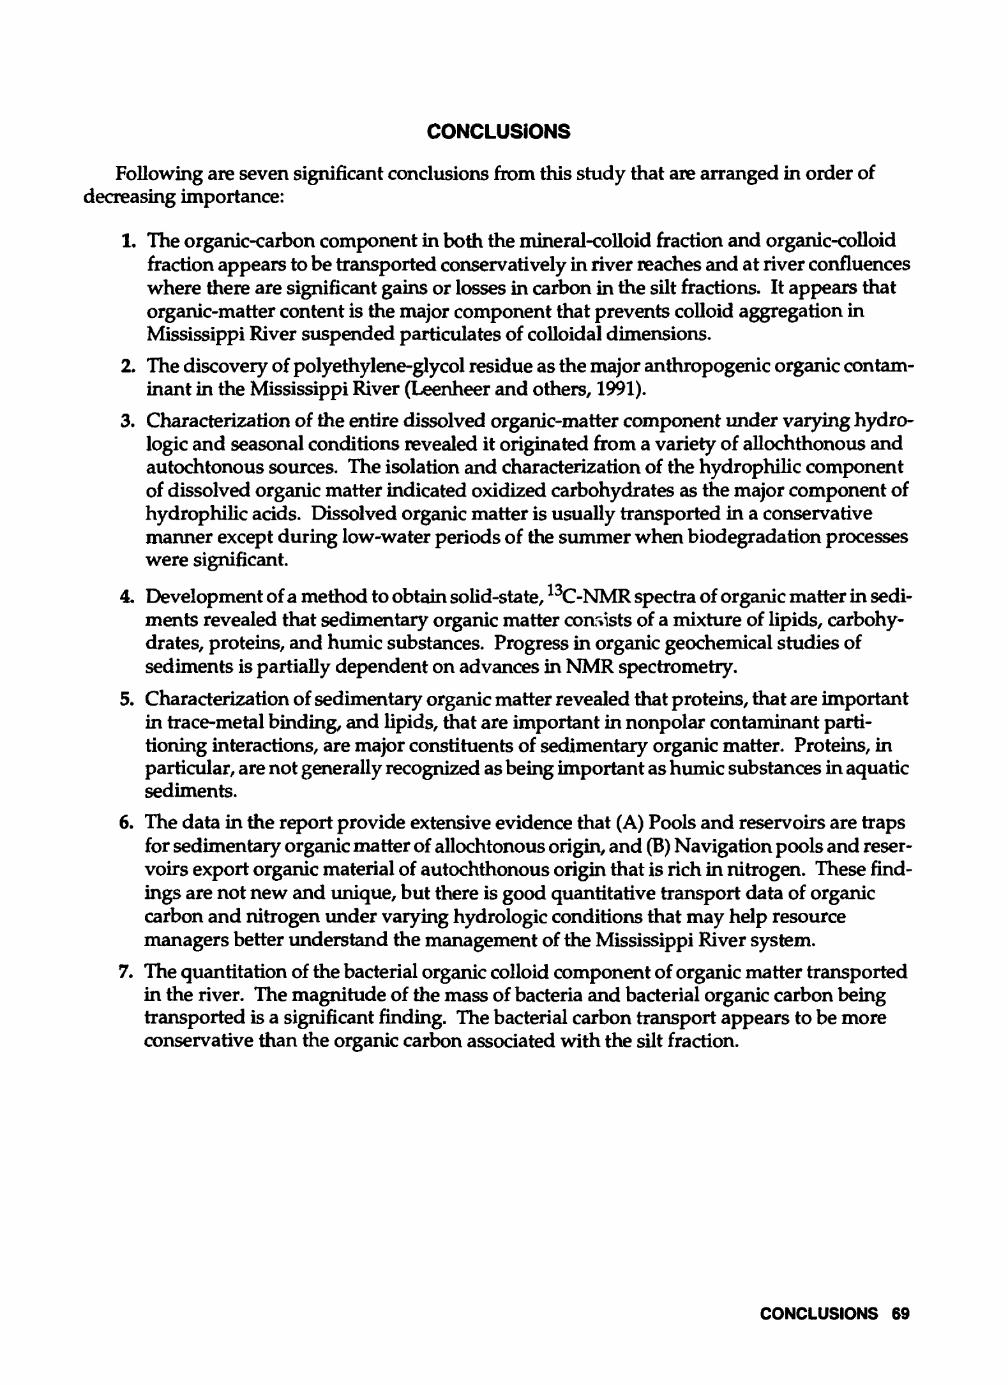
CONCLUSIONS
Following are seven significant conclusions from this study that are arranged in order of decreasing importance:
1. The organic-carbon component in both the mineral-colloid fraction and organic-colloid fraction appears to be transported conservatively in river reaches and at river confluences where there are significant gains or losses in carbon in the silt fractions. It appears that organic-matter content is the major component that prevents colloid aggregation in Mississippi River suspended particulates of colloidal dimensions.
2. The discovery of polyethylene-glycol residue as the major anthropogenic organic contam inant in the Mississippi River (Leenheer and others, 1991).
3. Characterization of the entire dissolved organic-matter component under varying hydro- logic and seasonal conditions revealed it originated from a variety of allochthonous and autochtonous sources. The isolation and characterization of the hydrophilic component of dissolved organic matter indicated oxidized carbohydrates as the major component of hydrophilic acids. Dissolved organic matter is usually transported in a conservative manner except during low-water periods of the summer when biodegradation processes were significant.
4. Development of a method to obtain solid-state, 13C-NMR spectra of organic matter in sedi ments revealed that sedimentary organic matter consists of a mixture of lipids, carbohy drates, proteins, and humic substances. Progress in organic geochemical studies of sediments is partially dependent on advances in NMR spectrometry.
5. Characterization of sedimentary organic matter revealed that proteins, that are important in trace-metal binding, and lipids, that are important in nonpolar contaminant parti tioning interactions, are major constituents of sedimentary organic matter. Proteins, in particular, are not generally recognized as being important as humic substances in aquatic sediments.
6. The data in the report provide extensive evidence that (A) Pools and reservoirs are traps for sedimentary organic matter of allochtonous origin, and (B) Navigation pools and reser voirs export organic material of autochthonous origin that is rich in nitrogen. These find ings are not new and unique, but there is good quantitative transport data of organic carbon and nitrogen under varying hydrologic conditions that may help resource managers better understand the management of the Mississippi River system.
7. The quantisation of the bacterial organic colloid component of organic matter transported in the river. The magnitude of the mass of bacteria and bacterial organic carbon being transported is a significant finding. The bacterial carbon transport appears to be more conservative than the organic carbon associated with the silt fraction.
CONCLUSIONS 69
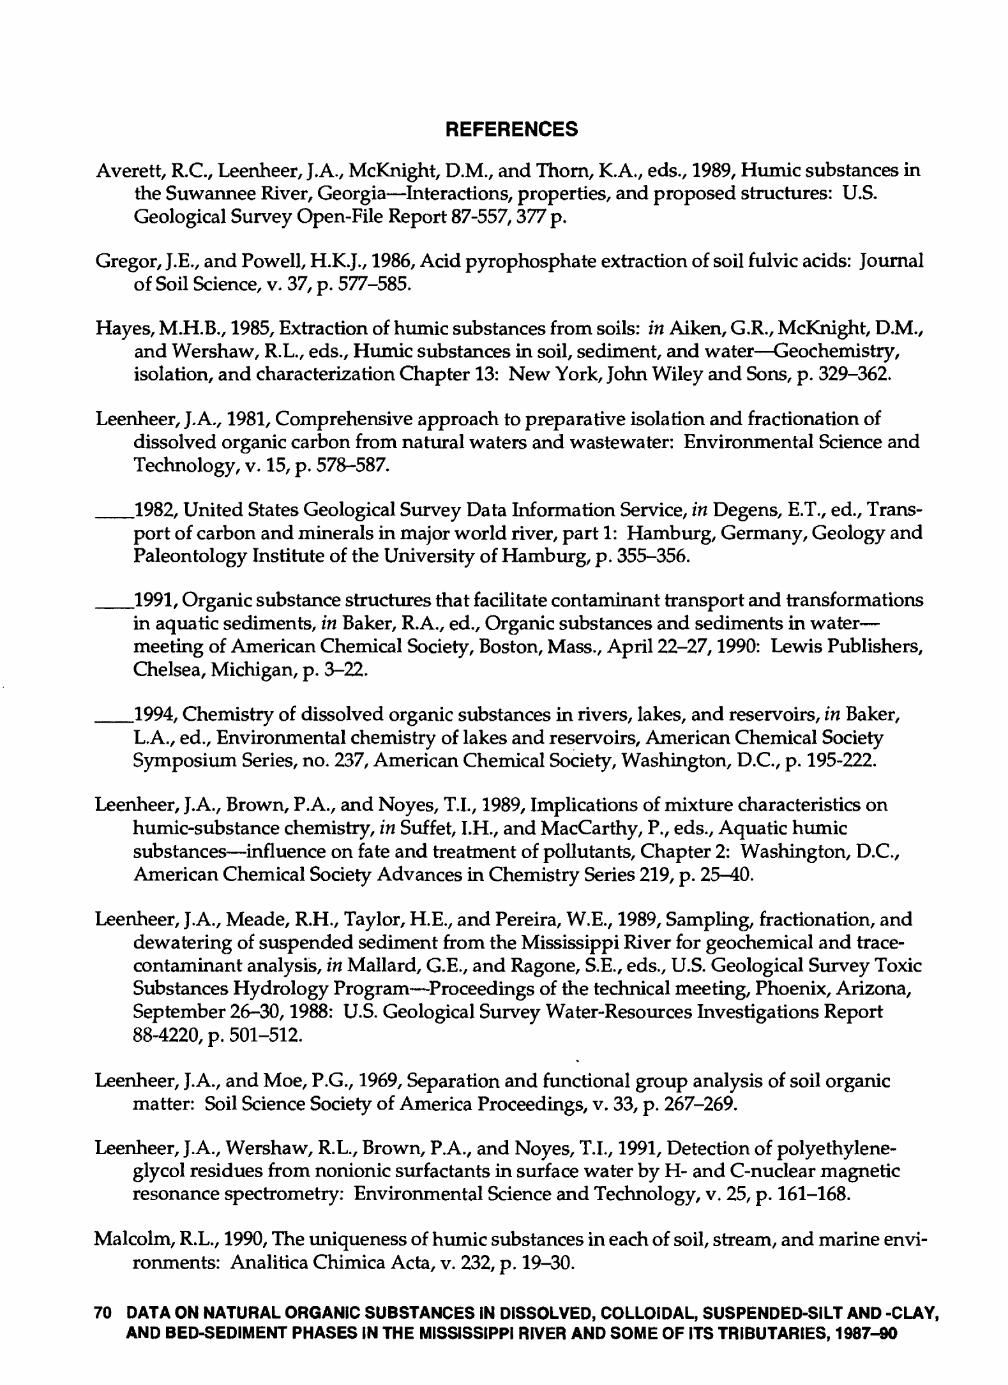
REFERENCES
Averett, R.C., Leenheer, J.A., McKnight, D.M., and Thorn, K.A., eds., 1989, Humic substances in the Suwannee River, Georgia Interactions, properties, and proposed structures: U.S. Geological Survey Open-File Report 87-557,377 p.
Gregor, J.E., and Powell, H.K.J., 1986, Acid pyrophosphate extraction of soil fulvic acids: Journal of Soil Science, v. 37, p. 577-585.
Hayes, M.H.B., 1985, Extraction of humic substances from soils: in Aiken, G.R., McKnight, D.M., and Wershaw, R.L., eds., Humic substances in soil, sediment, and water Geochemistry, isolation, and characterization Chapter 13: New York, John Wiley and Sons, p. 329-362.
Leenheer, J.A., 1981, Comprehensive approach to preparative isolation and fractionation of dissolved organic carbon from natural waters and wastewater: Environmental Science and Technology, v. 15, p. 578-587.
__1982, United States Geological Survey Data Information Service, in Degens, E.T., ed., Trans port of carbon and minerals in major world river, part 1: Hamburg, Germany, Geology and Paleontology Institute of the University of Hamburg, p. 355-356.
__1991, Organic substance structures that facilitate contaminant transport and transformations in aquatic sediments, in Baker, R.A., ed., Organic substances and sediments in water meeting of American Chemical Society, Boston, Mass., April 22-27,1990: Lewis Publishers, Chelsea, Michigan, p. 3-22.
__1994, Chemistry of dissolved organic substances in rivers, lakes, and reservoirs, in Baker, L.A., ed., Environmental chemistry of lakes and reservoirs, American Chemical Society Symposium Series, no. 237, American Chemical Society, Washington, D.C., p. 195-222.
Leenheer, J.A., Brown, P.A., and Noyes, T.I., 1989, Implications of mixture characteristics on humic-substance chemistry, in Suffet, I.H., and MacCarthy, P., eds., Aquatic humic substances influence on fate and treatment of pollutants, Chapter 2: Washington, D.C., American Chemical Society Advances in Chemistry Series 219, p. 25-40.
Leenheer, J.A., Meade, R.H., Taylor, H.E., and Pereira, W.E., 1989, Sampling, fractionation, and dewatering of suspended sediment from the Mississippi River for geochemical and trace- contaminant analysis, in Mallard, G.E., and Ragone, S.E., eds., U.S. Geological Survey Toxic Substances Hydrology Program Proceedings of the technical meeting, Phoenix, Arizona, September 26-30,1988: U.S. Geological Survey Water-Resources Investigations Report 88-4220, p. 501-512.
Leenheer, J. A., and Moe, P.G., 1969, Separation and functional group analysis of soil organic matter: Soil Science Society of America Proceedings, v. 33, p. 267-269.
Leenheer, J.A., Wershaw, R.L., Brown, P.A., and Noyes, T.I., 1991, Detection of polyethylene- glycol residues from nonionic surfactants in surface water by H- and C-nuclear magnetic resonance spectrometry: Environmental Science and Technology, v. 25, p. 161-168.
Malcolm, R.L., 1990, The uniqueness of humic substances in each of soil, stream, and marine envi ronments: Analitica Chimica Acta, v. 232, p. 19-30.
70 DATA ON NATURAL ORGANIC SUBSTANCES IN DISSOLVED, COLLOIDAL, SUSPENDED-SILT AND -CLAY, AND BED-SEDIMENT PHASES IN THE MISSISSIPPI RIVER AND SOME OF ITS TRIBUTARIES, 1987-90
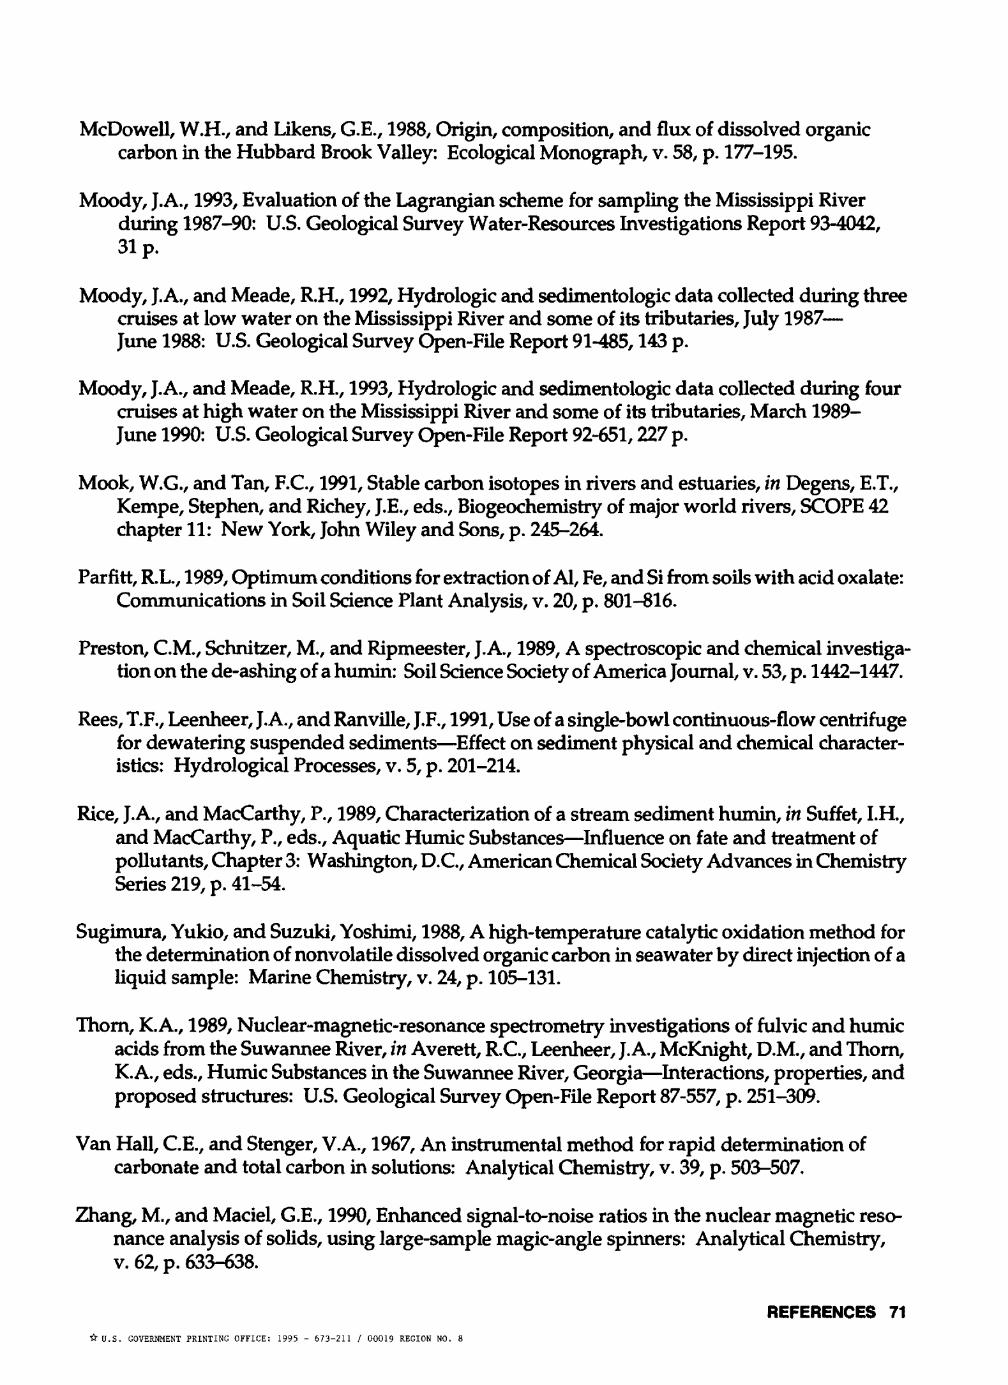
McDowell, W.H., and Likens, G.E., 1988, Origin, composition, and flux of dissolved organic carbon in the Hubbard Brook Valley: Ecological Monograph, v. 58, p. 177-195.
Moody, J.A., 1993, Evaluation of the Lagrangian scheme for sampling the Mississippi River during 1987-90: U.S. Geological Survey Water-Resources Investigations Report 93-4042, 31 p.
Moody, J. A., and Meade, R.H., 1992, Hydrologic and sedimentologic data collected during three cruises at low water on the Mississippi River and some of its tributaries, July 1987 June 1988: U.S. Geological Survey Open-File Report 91-485,143 p.
Moody, J. A., and Meade, R.H., 1993, Hydrologic and sedimentologic data collected during four cruises at high water on the Mississippi River and some of its tributaries, March 1989- June 1990: U.S. Geological Survey Open-File Report 92-651,227 p.
Mook, W.G., and Tan, F.C., 1991, Stable carbon isotopes in rivers and estuaries, in Degens, E.T., Kempe, Stephen, and Richey, J.E., eds., Biogeochemistry of major world rivers, SCOPE 42 chapter 11: New York, John Wiley and Sons, p. 245-264.
Parfitt, R.L., 1989, Optimum conditions for extraction of Al, Fe, and Si from soils with acid oxalate: Communications in Soil Science Plant Analysis, v. 20, p. 801-816.
Preston, C.M., Schnitzer, M., and Ripmeester, J. A., 1989, A spectroscopic and chemical investiga tion on the de-ashing of a humin: Soil Science Society of America Journal, v. 53, p. 1442-1447.
Rees, T.F., Leenheer, J.A., and Ranville, J.F., 1991, Use of a single-bowl continuous-flow centrifuge for dewatering suspended sediments Effect on sediment physical and chemical character istics: Hydrological Processes, v. 5, p. 201-214.
Rice, J.A., and MacCarthy, P., 1989, Characterization of a stream sediment humin, in Suffet, I.H., and MacCarthy, P., eds., Aquatic Humic Substances Influence on fate and treatment of pollutants, Chapter 3: Washington, D.C., American Chemical Society Advances in Chemistry Series 219, p. 41-54.
Sugimura, Yukio, and Suzuki, Yoshimi, 1988, A high-temperature catalytic oxidation method for the determination of nonvolatile dissolved organic carbon in seawater by direct injection of a liquid sample: Marine Chemistry, v. 24, p. 105-131.
Thorn, K.A., 1989, Nuclear-magnetic-resonance spectrometry investigations of fulvic and humic acids from the Suwannee River, in Averett, R.C., Leenheer, J.A., McKnight, D.M., and Thorn, K. A., eds., Humic Substances in the Suwannee River, Georgia Interactions, properties, and proposed structures: U.S. Geological Survey Open-File Report 87-557, p. 251-309.
Van Hall, C.E., and Stenger, V.A., 1967, An instrumental method for rapid determination of carbonate and total carbon in solutions: Analytical Chemistry, v. 39, p. 503-507.
Zhang, M., and Maciel, G.E., 1990, Enhanced signal-to-noise ratios in the nuclear magnetic reso nance analysis of solids, using large-sample magic-angle spinners: Analytical Chemistry, v. 62, p. 633-638.
REFERENCES 71 &U.S. GOVERNMENT PRINTING OFFICE: 1995 - 673-211 / 00019 REGION NO. 8