data mining lecturedatamining.liacs.nl/dami2013-2014/slides/data... · 2013-09-06 · example:...
TRANSCRIPT
Data Representation
The popular table
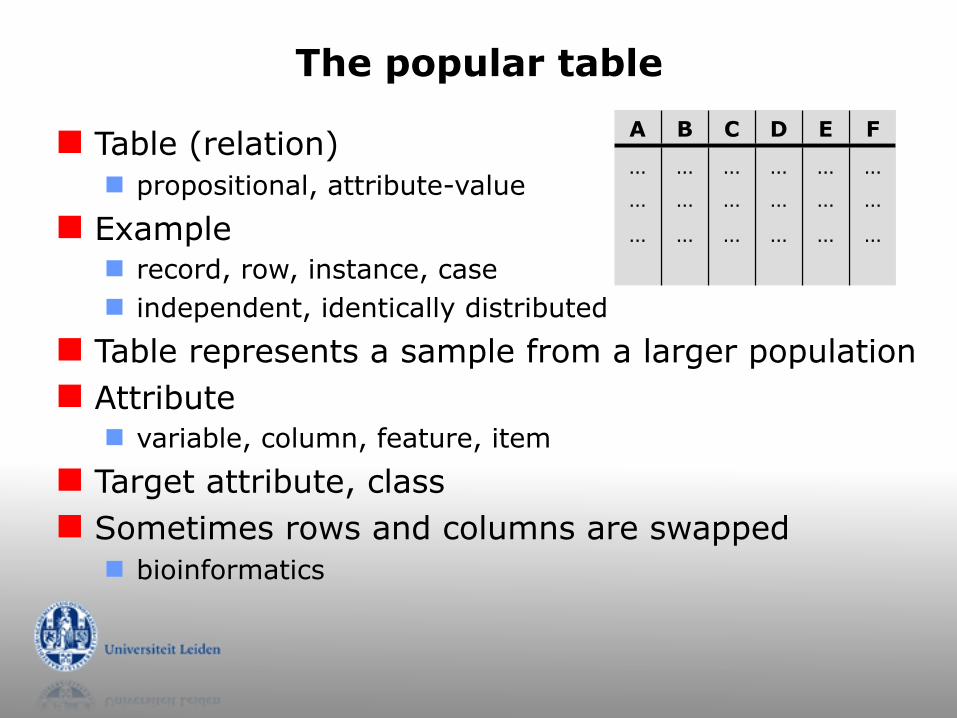
Table (relation) propositional, attribute-value
Example record, row, instance, case independent, identically distributed
Table represents a sample from a larger population Attribute
variable, column, feature, item Target attribute, class Sometimes rows and columns are swapped
bioinformatics
A B C D E F
… … … … … …… … … … … …… … … … … …

Example: symbolic weather data
Outlook Temperature Humidity Windy Play
sunny hot high false no
sunny hot high true no
overcast hot high false yes
rainy mild high false yes
rainy cool normal false yes
rainy cool normal true no
overcast cool normal true yes
sunny mild high false no
sunny cool normal false yes
rainy mild normal false yes
sunny mild normal true yes
overcast mild high true yes
overcast hot normal false yes
rainy mild high true no
attributes
examples
target attribute

Example: symbolic weather dataOutlook Temperature Humidity Windy Play
sunny hot high false no
sunny hot high true no
overcast hot high false yes
rainy mild high false yes
rainy cool normal false yes
rainy cool normal true no
overcast cool normal true yes
sunny mild high false no
sunny cool normal false yes
rainy mild normal false yes
sunny mild normal true yes
overcast mild high true yes
overcast hot normal false yes
rainy mild high true no
three examples covered,100% correct

Example: symbolic weather dataOutlook Temperature Humidity Windy Play
sunny hot high false no
sunny hot high true no
overcast hot high false yes
rainy mild high false yes
rainy cool normal false yes
rainy cool normal true no
overcast cool normal true yes
sunny mild high false no
sunny cool normal false yes
rainy mild normal false yes
sunny mild normal true yes
overcast mild high true yes
overcast hot normal false yes
rainy mild high true no
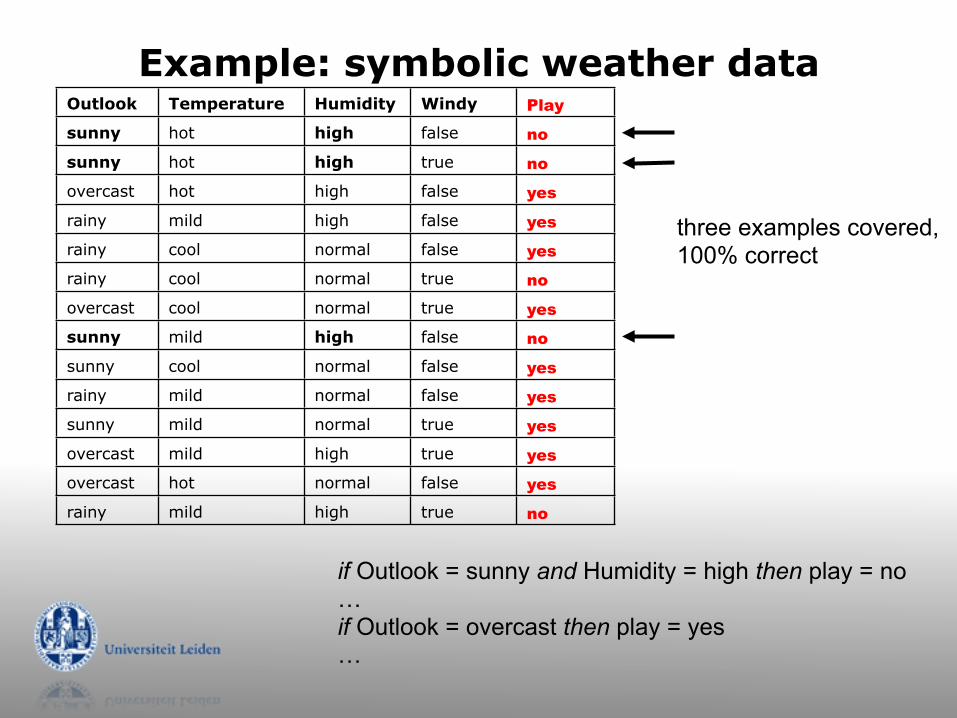
if Outlook = sunny and Humidity = high then play = no…if Outlook = overcast then play = yes
three examples covered,100% correct
Example: symbolic weather dataOutlook Temperature Humidity Windy Play
sunny hot high false no
sunny hot high true no
overcast hot high false yes
rainy mild high false yes
rainy cool normal false yes
rainy cool normal true no
overcast cool normal true yes
sunny mild high false no
sunny cool normal false yes
rainy mild normal false yes
sunny mild normal true yes
overcast mild high true yes
overcast hot normal false yes
rainy mild high true no
if Outlook = sunny and Humidity = high then play = no…if Outlook = overcast then play = yes…
three examples covered,100% correct
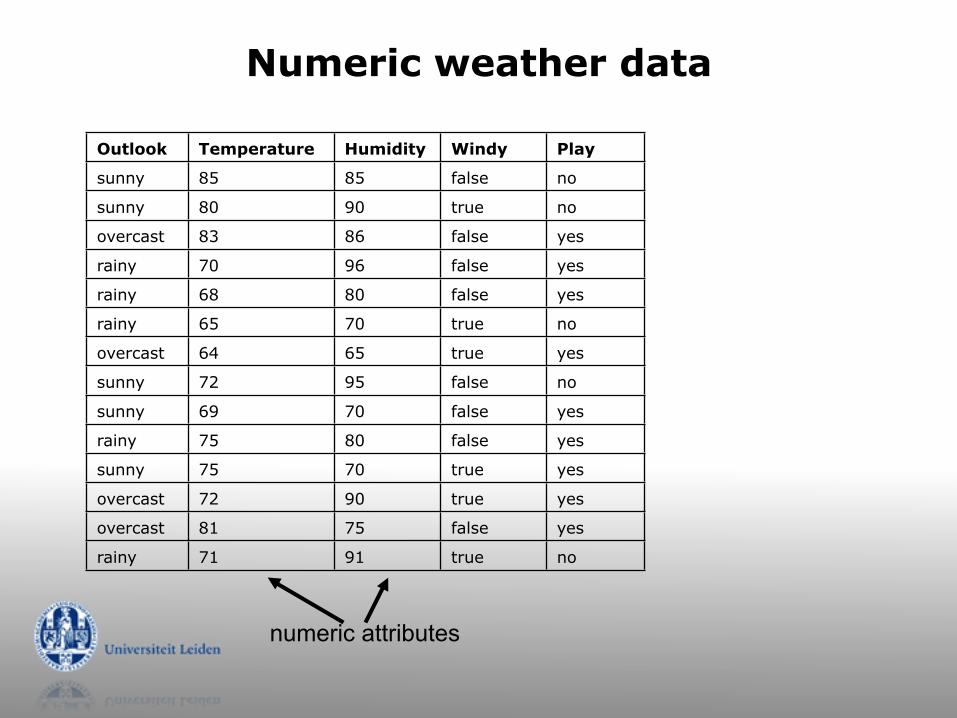
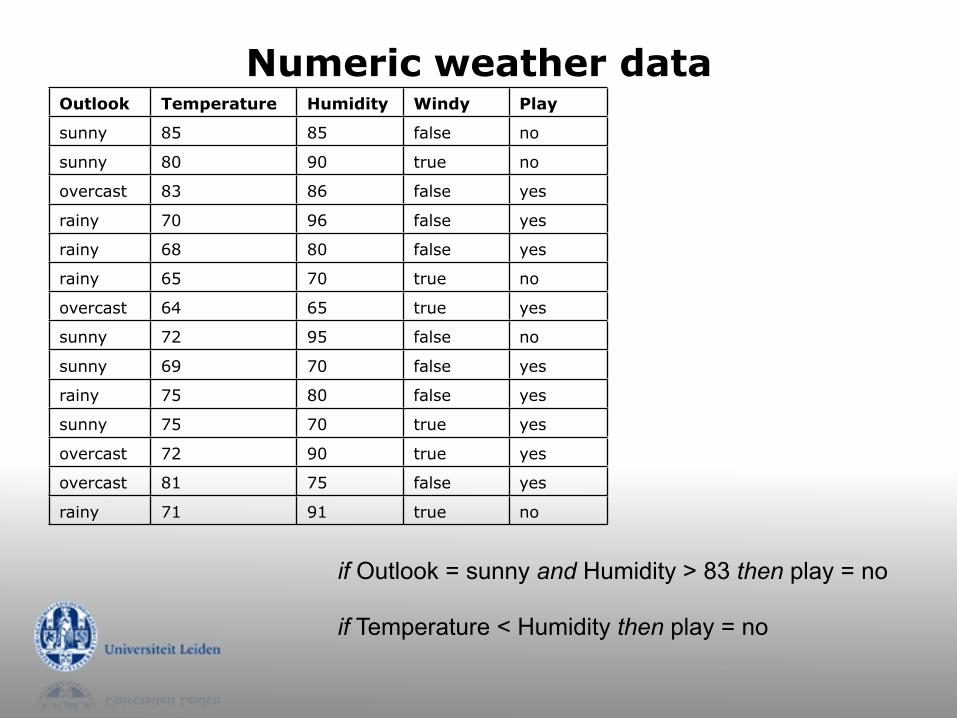
Numeric weather data
Outlook Temperature Humidity Windy Play
sunny 85 85 false no
sunny 80 90 true no
overcast 83 86 false yes
rainy 70 96 false yes
rainy 68 80 false yes
rainy 65 70 true no
overcast 64 65 true yes
sunny 72 95 false no
sunny 69 70 false yes
rainy 75 80 false yes
sunny 75 70 true yes
overcast 72 90 true yes
overcast 81 75 false yes
rainy 71 91 true no
numeric attributes

Numeric weather data
Outlook Temperature Humidity Windy Play
sunny 85 (hot) 85 false no
sunny 80 (hot) 90 true no
overcast 83 (hot) 86 false yes
rainy 70 96 false yes
rainy 68 80 false yes
rainy 65 70 true no
overcast 64 65 true yes
sunny 72 95 false no
sunny 69 70 false yes
rainy 75 80 false yes
sunny 75 70 true yes
overcast 72 90 true yes
overcast 81 75 false yes
rainy 71 91 true no
numeric attributes
Numeric weather dataOutlook Temperature Humidity Windy Play
sunny 85 85 false no
sunny 80 90 true no
overcast 83 86 false yes
rainy 70 96 false yes
rainy 68 80 false yes
rainy 65 70 true no
overcast 64 65 true yes
sunny 72 95 false no
sunny 69 70 false yes
rainy 75 80 false yes
sunny 75 70 true yes
overcast 72 90 true yes
overcast 81 75 false yes
rainy 71 91 true no
if Outlook = sunny and Humidity > 83 then play = no
if Temperature < Humidity then play = no
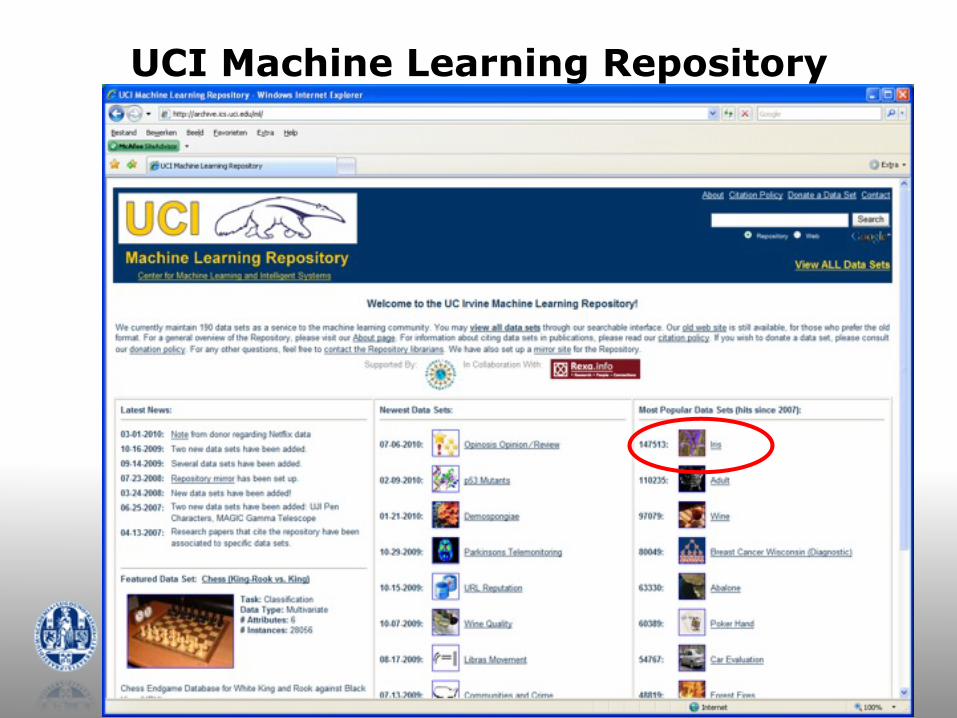
UCI Machine Learning Repository
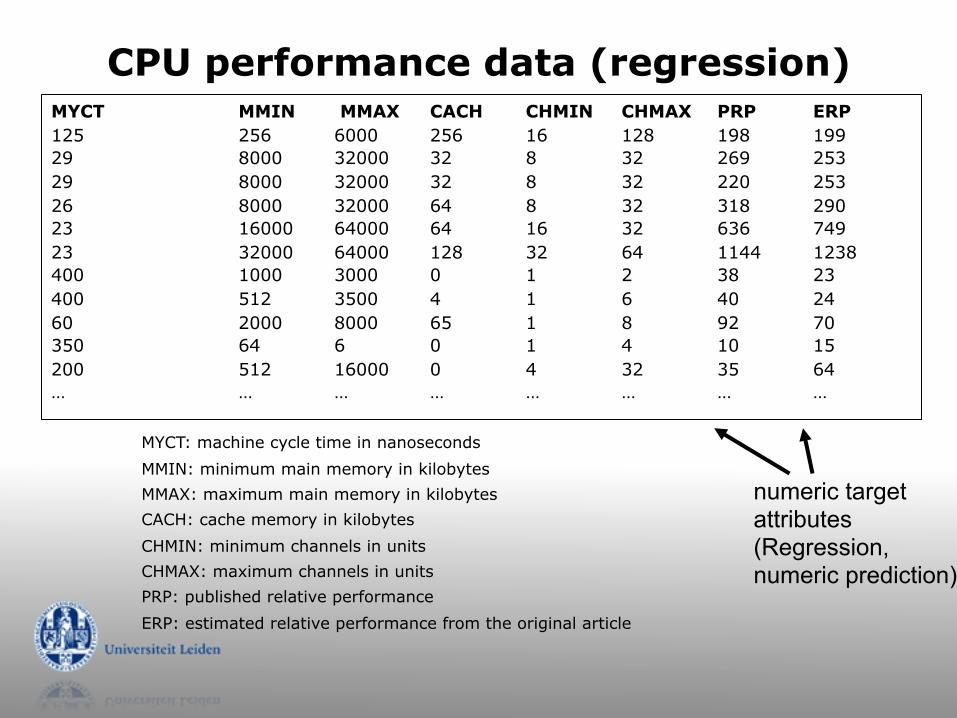
CPU performance data (regression)
MYCT: machine cycle time in nanoseconds MMIN: minimum main memory in kilobytes MMAX: maximum main memory in kilobytes CACH: cache memory in kilobytes CHMIN: minimum channels in units CHMAX: maximum channels in units PRP: published relative performance ERP: estimated relative performance from the original article
MYCT MMIN MMAX CACH CHMIN CHMAX PRP ERP125 256 6000 256 16 128 198 19929 8000 32000 32 8 32 269 25329 8000 32000 32 8 32 220 25326 8000 32000 64 8 32 318 29023 16000 64000 64 16 32 636 74923 32000 64000 128 32 64 1144 1238400 1000 3000 0 1 2 38 23400 512 3500 4 1 6 40 2460 2000 8000 65 1 8 92 70350 64 6 0 1 4 10 15200 512 16000 0 4 32 35 64… … … … … … … …
numeric targetattributes(Regression, numeric prediction)

CPU performance data (regression)
Linear model of Published Relative Performance:PRP = -55.9 + 0.0489*MYCT + 0.0153*MMIN + 0.0056*MMAX +
0.641*CACH – 0.27*CHMIN + 1.48*CHMAX
MYCT MMIN MMAX CACH CHMIN CHMAX PRP ERP125 256 6000 256 16 128 198 19929 8000 32000 32 8 32 269 25329 8000 32000 32 8 32 220 25326 8000 32000 64 8 32 318 29023 16000 64000 64 16 32 636 74923 32000 64000 128 32 64 1144 1238400 1000 3000 0 1 2 38 23400 512 3500 4 1 6 40 2460 2000 8000 65 1 8 92 70350 64 6 0 1 4 10 15200 512 16000 0 4 32 35 64… … … … … … … …

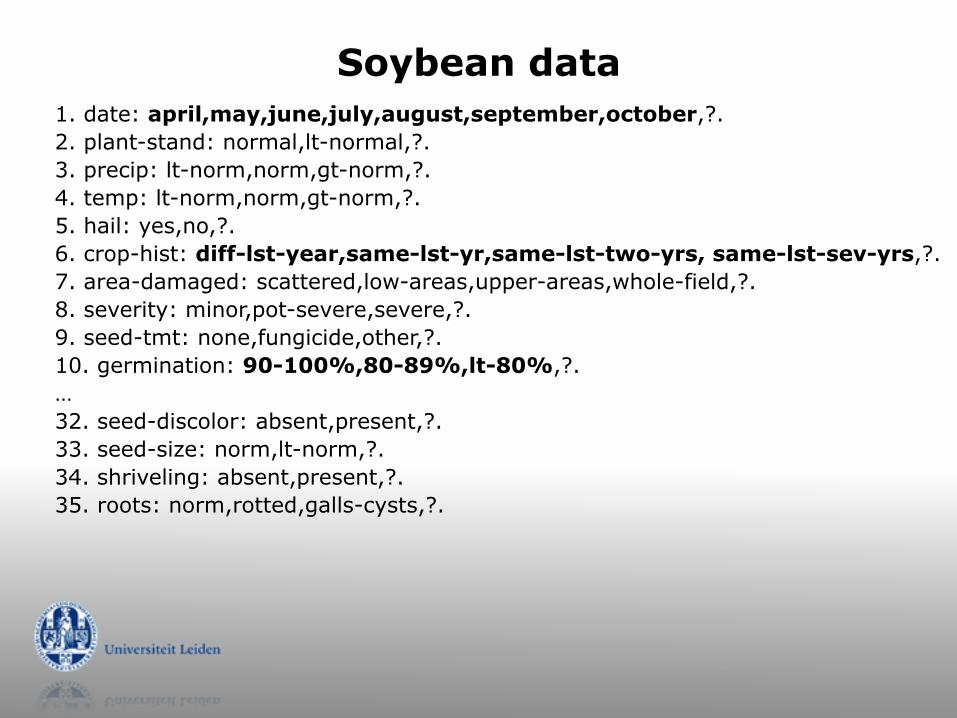
Soybean disease data
Michalski and Chilausky, 1980 ‘Learning by being told and learning from examples: an experimental
comparison of the two methods of knowledge acquisition in the context of developing an expert system for soybean disease diagnosis.’
680 examples, 35 attributes, 19 categories Two methods:
rules induced from 300 selected examples rules acquired from plant pathologist
Scores: induced model 97.5% expert 72%

Soybean data1. date: april,may,june,july,august,september,october,?. 2. plant-stand: normal,lt-normal,?. 3. precip: lt-norm,norm,gt-norm,?. 4. temp: lt-norm,norm,gt-norm,?. 5. hail: yes,no,?. 6. crop-hist: diff-lst-year,same-lst-yr,same-lst-two-yrs, same-lst-sev-yrs,?. 7. area-damaged: scattered,low-areas,upper-areas,whole-field,?. 8. severity: minor,pot-severe,severe,?. 9. seed-tmt: none,fungicide,other,?. 10. germination: 90-100%,80-89%,lt-80%,?. …32. seed-discolor: absent,present,?. 33. seed-size: norm,lt-norm,?. 34. shriveling: absent,present,?. 35. roots: norm,rotted,galls-cysts,?.
Soybean data1. date: april,may,june,july,august,september,october,?. 2. plant-stand: normal,lt-normal,?. 3. precip: lt-norm,norm,gt-norm,?. 4. temp: lt-norm,norm,gt-norm,?. 5. hail: yes,no,?. 6. crop-hist: diff-lst-year,same-lst-yr,same-lst-two-yrs, same-lst-sev-yrs,?. 7. area-damaged: scattered,low-areas,upper-areas,whole-field,?. 8. severity: minor,pot-severe,severe,?. 9. seed-tmt: none,fungicide,other,?. 10. germination: 90-100%,80-89%,lt-80%,?. …32. seed-discolor: absent,present,?. 33. seed-size: norm,lt-norm,?. 34. shriveling: absent,present,?. 35. roots: norm,rotted,galls-cysts,?.

Types Nominal, categorical, symbolic, discrete
only equality (=) no distance measure
Numeric inequalities (<, >, <=, >=) arithmetic distance measure
Ordinal inequalities no arithmetic or distance measure
Binary like nominal, but only two values, and True (1, yes, y)
plays special role.
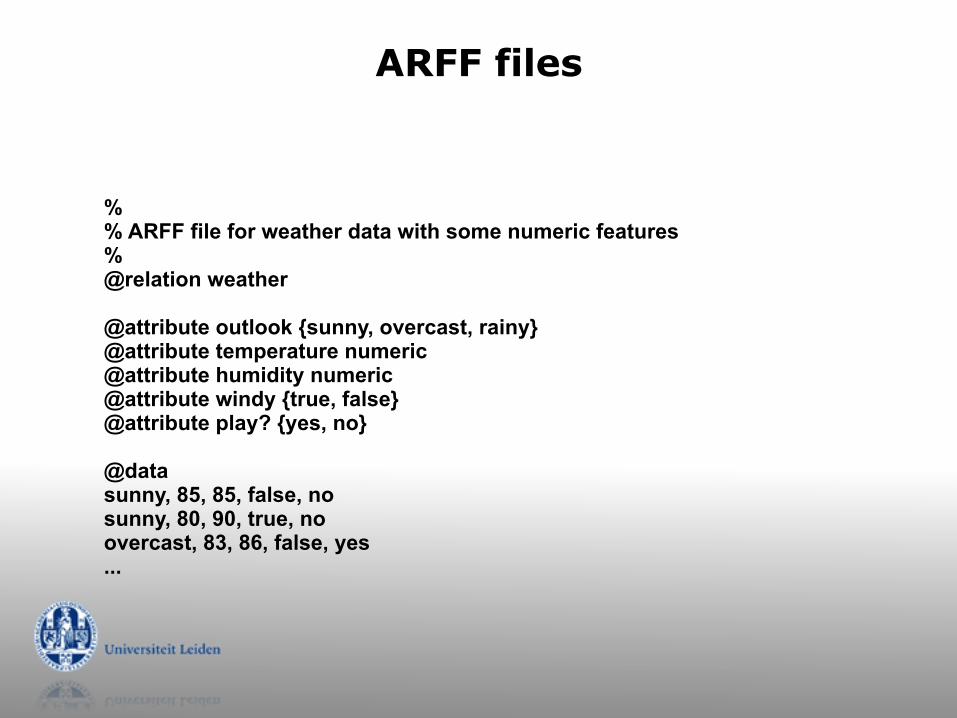
ARFF files
%% ARFF file for weather data with some numeric features%@relation weather
@attribute outlook {sunny, overcast, rainy}@attribute temperature numeric@attribute humidity numeric@attribute windy {true, false}@attribute play? {yes, no}
@datasunny, 85, 85, false, nosunny, 80, 90, true, noovercast, 83, 86, false, yes...

Other data representations
time series uni-variate multi-variate
Data streams stream of discrete events, with time-stamp e.g. shopping baskets, network traffic, webpage hits

Other representations
Database of graphs
Large graphs social networks
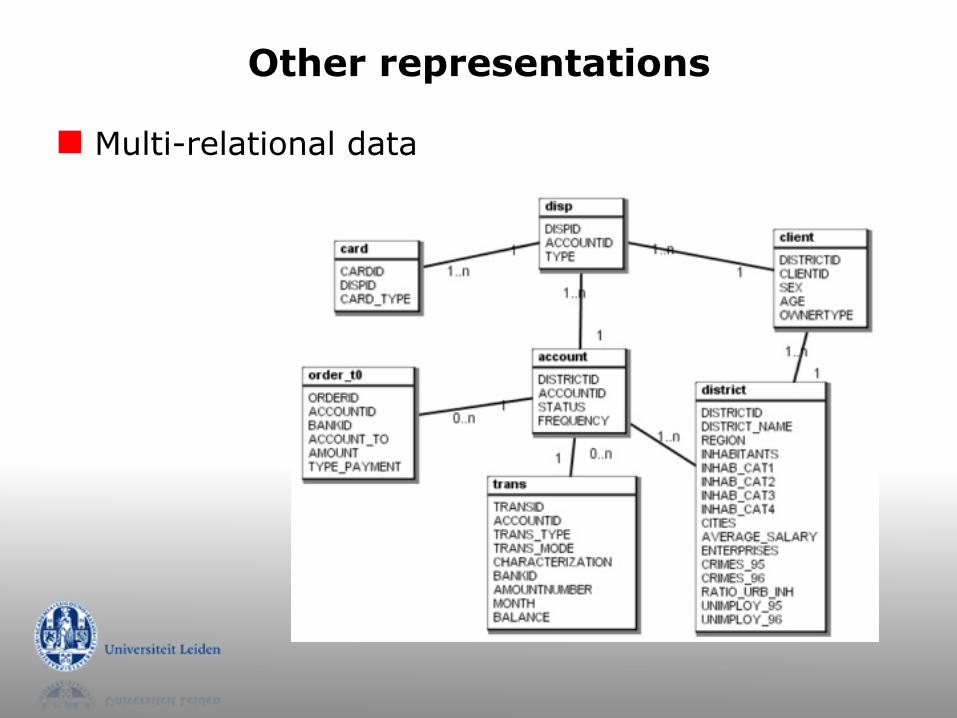
Other representations
Multi-relational data

Assignment
Direct Marketing in holiday park Campaign for new offer uses data of previous booking:
customer id price number of guests class of house data from previous booking arrival date departure date positive response? (target)
Question: what alternative representations for the 2 dates can you suggest? The (multiple) new attributes should make explicit those features of a booking that are relevant (such as holidays etc).