data infrastructure at linkedin - university of...
TRANSCRIPT

Data Infrastructure at LinkedIn Aditya Auradkar, Chavdar Botev, Shirshanka Das, Dave DeMaagd, Alex Feinberg, Phanindra Ganti, Lei Gao,
Bhaskar Ghosh, Kishore Gopalakrishna, Brendan Harris, Joel Koshy, Kevin Krawez, Jay Kreps, Shi Lu, Sunil
Nagaraj, Neha Narkhede, Sasha Pachev, Igor Perisic, Lin Qiao, Tom Quiggle, Jun Rao, Bob Schulman, Abraham
Sebastian, Oliver Seeliger, Adam Silberstein, Boris Shkolnik, Chinmay Soman, Roshan Sumbaly, Kapil Surlaker,
Sajid Topiwala, Cuong Tran, Balaji Varadarajan, Jemiah Westerman, Zach White, David Zhang, and Jason Zhang
Abstract— LinkedIn is among the largest social networking sites in the world. As the company has grown, our core data sets and request processing requirements have grown as well. In this paper, we describe a few selected data infrastructure projects at LinkedIn that have helped us accommodate this increasing scale. Most of those projects build on existing open source projects and are themselves available as open source. The projects covered in this paper include: (1) Voldemort: a scalable and fault tolerant key-value store; (2) Databus: a framework for delivering database changes to downstream applications; (3) Espresso: a distributed data store that supports flexible schemas and secondary indexing; (4) Kafka: a scalable and efficient messaging system for collecting various user activity events and log data.
I. INTRODUCTION
LinkedIn logically divides into three fairly traditional tiers
of services: a data tier that maintains persistent state including
all user data, a service tier that implements an API layer
capturing the logical operations of the website, and a display
tier responsible for translating APIs into user interfaces
including web pages and other user-facing applications such
as “sharing” widgets on external sites or mobile application
content. These tiers physically run on separate hardware and
communicate via RPC.
The service tier and display tier are both largely stateless—
all data and state comes only from transient caches and
underlying data systems. As a result the request capacity of
these stateless services can be increased by randomly
balancing the load over an increased hardware pool. Likewise
failures are handled trivially by removing the failed machines
from the live pool. The key is that since there is no state in
these tiers, all machines are interchangeable.
This is a common strategy for simplifying the design of a
large website: state is pushed down into a small number of
general data systems which allows the harder problem of
scaling stateful systems to be solved in as few places as
possible. The details of these systems differ, but they share
some common characteristics. Data volume generally requires
partitioning data over multiple machines, and requests must be
intelligently routed to the machine where the data resides.
Availability requirements require replicating data onto
multiple machines to allow fail-over without data loss.
Replicated state requires reasoning about the consistency of
data across these machines. Expansion requires redistributing
data over new machines without downtime or interruption.
LinkedIn’s core data systems are (a) live storage, (b) stream
systems, (c) search, (d) social graph, (e) recommendations,
and (f) batch computing. A high level architecture of those
systems is shown in Figure I.1. We will give a brief overview
of each of these areas, and provide details on a few selected
systems.
A. LinkedIn’s Site Architecture
Figure I.1 A very high-level overview of LinkedIn’s
architecture, focusing on the core data systems.
Live storage systems are simply variations on traditional
OLTP databases, though high request load and large data
volume have forced a trade-off to disallow more complex
queries to enable horizontal scalability. Live storage systems
are the workhorse of web applications, serving the majority of
data requests that make up the user experience. We describe
two storage systems in the later sections, one aimed at
providing primary data storage with rich query capabilities
and a timeline consistency model (Espresso) and one aimed at
providing simple, fast, eventually consistent key-value access
(Voldemort).
Batch processing consists of large-scale offline data
processing jobs that run on a fixed schedule, say, hourly, daily,
or weekly. Much of the most complex algorithmic data
processing work is offloaded to this setting. LinkedIn’s batch
2012 IEEE 28th International Conference on Data Engineering
1084-4627/12 $26.00 © 2012 IEEE
DOI 10.1109/ICDE.2012.147
1370
2012 IEEE 28th International Conference on Data Engineering
1084-4627/12 $26.00 © 2012 IEEE
DOI 10.1109/ICDE.2012.147
1370

processing workloads divide into two major categories. The
first is production batch processing jobs whose purpose is to
generate data sets that will be served to users on our website.
The second is analytical processing aimed at business
intelligence or producing internal reports. LinkedIn’s
production batch processing runs entirely on Hadoop. It uses a
workflow containing both Pig and MapReduce jobs and run
through a central scheduler. LinkedIn’s analytical batch
processing runs on a combination of traditional relational data
warehouse and the Hadoop system. Analytical Hadoop access
is primarily Hive and Pig queries.
Recommendation systems and social search systems are
both closely related. These systems are concerned with
matching rich structured data to users in a highly personalized
way. The search system powers people search, which is a core
feature for LinkedIn, but also handles search over all other
LinkedIn content (including verticals for jobs, groups, and
companies). The recommendation system matches relevant
jobs, job candidates, connections, ads, news articles, and other
content to users. The queries to these systems are orders of
magnitude more complex than traditional systems since they
involve ranking against complex models as well as integration
of activity data and social features.
The social graph powers the social features on the site from
a partitioned graph of LinkedIn members and their attribute
data (such as companies or groups). Its purpose is to serve
low-latency social graph queries. Example queries include
showing paths between users, calculating minimum distances
between users, counting or intersecting connection lists and
other social functionality. This is one of the backbones of the
site, processing hundreds of thousandss graph queries per
second and acting as one of the key determinants of
performance and availability for the site as a whole.
Stream systems provide feeds of data to applications and
many of the other data systems mentioned above. These feeds
can be used either for processing or notification purposes.
Stream systems enable near real-time processing of data as is
needed for email, newsfeed systems, and other core parts of
the site that do their work asynchronously from user actions.
In addition, the very presence of these use-case specific data
systems puts special emphasis on the stream-oriented systems;
they serve as a central replication layer that transports updates
to all relevant subscriber systems. For example, the social
graph, search, and recommendation systems subscribe to the
feed of profile changes, and our newsfeed features are built on
top of member activity and status feeds. Such feeds are also
pulled into the batch systems for offline processing. In this
paper we describe LinkedIn’s two stream systems: Databus
which handles database stream replication and Kafka, which
handles general pub/sub, user activity events and log data.
For brevity we detail only the stream and storage systems
in the remaining sections.
II. VOLDEMORT
Project Voldemort is a highly available, low-latency
distributed data store. It was initially developed at LinkedIn in
2008 in order to provide key-value based storage for read-
write data products like “Who viewed my profile”, thereby
acting an alternative to our primary storage Oracle system.
Over time it has also been adapted to serve static read-only
data produced in offline bulk systems like Hadoop. Voldemort
was open-sourced in January 2009 and has seen widespread
adoption by various other companies for applications that
require high availability and low latency. At LinkedIn,
Voldemort powers various components of our real time
recommendation products, network updates, and rate limiting
system. We currently house roughly ten clusters, spanning
more than a hundred nodes, holding several hundred stores
(database tables). Recent additions to Voldemort allow it to
span nodes located in multiple datacenters. This, along with
the ability to add nodes without downtime, has helped us scale
Voldemort to handle tens of thousands of requests a second.
Voldemort can best be categorized as a distributed hash
table (DHT). Unlike previous DHT work (like Chord
[SMK+01]), it has been designed to have relatively low node
membership churn, i.e. few changes in cluster topology.
Instead it has been designed for frequent transient and short-
term failures [FLP+10], which are very prevalent in
production datacenters. This lets us store the complete
topology metadata on every node instead of partial “finger
tables” as in Chord, thereby decreasing lookups from O(log N)
to O(1). Overall, Voldemort’s design and architecture has
been heavily inspired by Amazon's Dynamo [DHJ+07], a
highly available and eventually consistent key-value store that
powers Amazon’s shopping cart.
B. Architecture
Figure II.1 Pluggable architecture of Voldemort
We start by defining key terms we use to describe
Voldemort. A Voldemort cluster can contain multiple nodes,
each with a unique id. Stores correspond to database tables.
Each store maps to a single cluster, with the store partitioned
over all nodes in the cluster. Every store has its set of
configurations, including - replication factor (N), required
number of nodes which should participate in read (R) and
writes (W) and finally a schema (key and value serialization
13711371
formats). Keys for the same store are hashed to a hash ring - a
representation of the key space split into equal sized logical
partitions. Every node in a cluster is then responsible for a
certain set of partitions.
Figure II.1 shows the pluggable architecture of Voldemort.
Most of the modules have functionality similar to those
described in Amazon's Dynamo paper. Every module in the
architecture implements the same code interface thereby
making it easy to (a) interchange modules (e.g., Voldemort
supports both server and client side routing by moving the
routing and associated modules) and (b) test code easily by
mocking modules.
Client API and Conflict Resolution: Starting from the top
of the architecture our client has the API described in Figure
II.2. As a Dynamo implementation, Voldemort differs from
conventional master-slave replicated systems in that any
replica of a given partition is able to accept a write. As a result,
it is possible for divergent version histories to form on
multiple nodes during failures / partitions. As shown in our
API, we use vector clocks [LAM78] to version our tuples and
delegate conflict resolution of concurrent versions to the
application. Methods 3) and 4) of the API allow the user to
run a transform on the value on the server side. For example,
if the value is a list, we can run a transformed get to retrieve a
sub-list or a transformed put to append an entity to a list,
thereby saving a client round trip and network bandwidth.
Vector clocks also allow us to support a form of optimistic
locking on the client side. Two concurrent updates to the same
key results in one of the clients failing due to an already
written vector clock. This client receives a special error,
which can trigger a retry with the updated vector clock. This
retry logic can be encapsulated in the applyUpdate call and
can be used in cases like counters where “read, modify, write
if no change” loops are required.
Repair mechanism: This module is responsible for
reconciling the inconsistent versions of the same key. We
adopted the two repair mechanisms highlighted in the
Dynamo paper viz. read repair and hinted handoff. Read
repair detects inconsistencies during gets while hinted handoff
is triggered during puts.
Failure Detector: Due to frequent transient errors, it is
important that the routing module maintain an up-to-date
status of each storage node’s availability. By using this
knowledge during request routing, we can also prevent the
client from doing excessive requests to a server that is
currently overloaded. We support various failure detectors,
but the most commonly used one marks a node as down when
its “success ratio” i.e. ratio of successful operations to total,
falls below a pre-configured threshold. Once marked down the
node is considered online only when an asynchronous thread
is able to contact it again.
Routing: This module of Voldemort employs a simple
implementation of consistent hashing to perform replication.
A key is hashed to a logical partition, after which we jump the
ring till we find N-1 other partitions on different nodes to
store the replicas. This non-order preserving partitioning
scheme prevents formation of hot spots.
Since our routing layer is pluggable we also plugged in a
variant of consistent hashing that supports routing in a
multiple datacenter environment. We group co-located nodes
into logical clusters called 'zones', which in turn are defined
by a proximity list of distances from other zones. The routing
algorithm now jumps the consistent hash ring with an extra
constraint to satisfy number of zones required for the request.
Storage Engine: Of the various storage engine
implementations supported by Voldemort, the most
commonly used ones are BerkeleyDB Java Edition (BDB)
[OBS99] (for read-write traffic) and a custom read-only
storage engine (for static offline data).
The custom read-only storage engine was built for
applications that require running various multi-stage complex
algorithms, using offline systems like Hadoop to generate
their final results. By offloading the index construction to the
offline system we do not hurt the performance of the live
indices. The storage engine data layout on Voldemort nodes
consists of compact index and data files stored in versioned
directories per store, with every new data deployment
resulting in a new versioned directory. Storing multiple
versions of the complete dataset allows the developers to do
instantaneous rollbacks in case of data problems. The
complete data pipeline to get this static data into Voldemort is
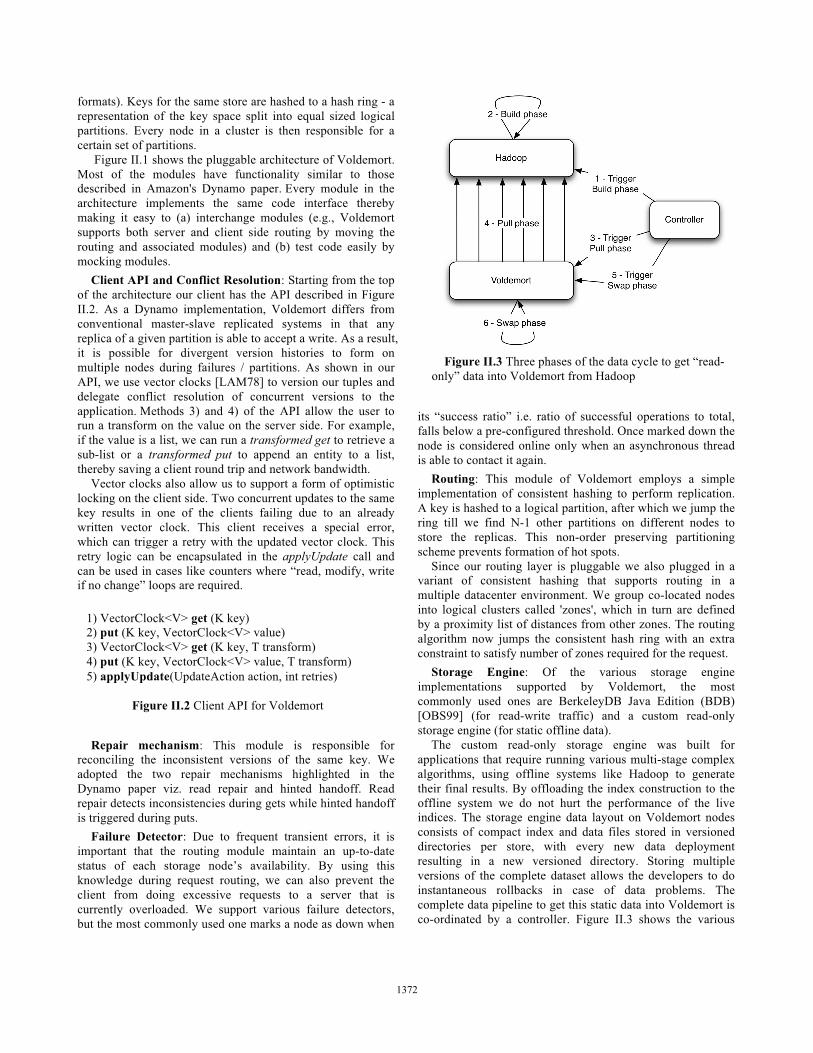
co-ordinated by a controller. Figure II.3 shows the various
1) VectorClock<V> get (K key)
2) put (K key, VectorClock<V> value)
3) VectorClock<V> get (K key, T transform)
4) put (K key, VectorClock<V> value, T transform)
5) applyUpdate(UpdateAction action, int retries)
Figure II.2 Client API for Voldemort
Figure II.3 Three phases of the data cycle to get “read-
only” data into Voldemort from Hadoop
13721372

phases of the data pipeline and their order of execution - (a)
Build phase - We take the output of complex algorithms and
generate partitioned sets of data and index files in Hadoop
[WHI09]. These files are partitioned by destination nodes and
stored in HDFS. An index file is a compact list of sorted MD5
of key and offset to data into the data file. To generate these
indices, we leverage Hadoop’s ability to sort its values in the
reducers. Finally a search on the Voldemort side is done using
binary search. (b) Pull phase – Voldemort gets notified of the
location of the output of the build phase and starts a parallel
fetch from HDFS into a new versioned directory for the store.
(c) Swap phase – On completion of the pull the controller co-
ordinates an atomic swap across all the nodes by closing the
current index files and memory mapping the new index files.
Instead of building complex caching structures, memory
mapping the files delegates the caching to the operating
system’s page-cache.
Admin Service: In addition to the above stack, every node
also runs an administrative service, which allows the
execution of privileged commands without downtime. This
includes the ability to add / delete store and rebalance the
cluster without downtime. Rebalancing (dynamic cluster
membership) is done by changing ownership of partitions to
different nodes. We maintain consistency during rebalancing
by redirecting requests of moving partitions to their new
destination.
C. Usage at LinkedIn At LinkedIn we have ten Voldemort clusters – nine of
which serve BDB backed read-write traffic (six of which are
running across two datacenters) while one serves custom read-
only storage engine backed traffic. Our largest read-write
cluster has about 60% reads and 40% writes. This cluster
serves around 10K queries per second at peak with average
latency of 3 ms. Similarly the read-only cluster serves about
9K reads per second with an average latency of less than 1 ms.
Voldemort also successfully handles varying data sizes for the
stores – our smallest store is around 8 KB while the largest
one is around 2.8 TB for read-only and 1.4 TB for the read-
write cluster.
We now highlight two applications in LinkedIn that use
Voldemort. The first example is that of read-write stores used
to run “Company Follow” – a feature on LinkedIn that allows
the user to get a feed of company updates by following it. This
uses two stores to maintain a cache-like interface on top of our
primary storage Oracle – the first one stores member id to list
of company ids followed by the user and the second one stores
company id to a list of member ids that follow it. Both stores
are fed by a Databus (described in Section III) relay and are
populated whenever a user follows a new company. Since it is
used as cache, having inconsistent values across stores is not a
problem. Both the stores have a Zipfian distribution for their
data size, but still manage to retrieve large values with an
average latency of 4 ms.
The second example is a link prediction problem used to
generate “People You May Know” on LinkedIn. This
application is powered by a single store backed by the custom
read-only storage engine. The store saves, for every member
id, a list of recommended member ids, along with a score. Due
to continuous iterations on the prediction algorithm and the
rapidly changing social graph, most of the scores change
between runs. Some of the optimizations we run on the read-
only cluster include (a) throttling the pulls and (b) pulling the
index files after all the data files to achieve cache-locality
post-swap. This has helped us achieve an average latency in
sub-milliseconds for this store.
Our future work includes faster rebalancing, an update
stream to which consumers can listen and new index formats
to optimize read-only store performance.
III. DATABUS
A. Motivation Modern Internet-based systems are increasingly facing the
difficult challenge of performing complex processing over
large amounts of valuable data with strict upper bounds on
latency. For example, at LinkedIn, we have to continuously
maintain indexes and statistical models over many aspects of
the online professional identity of our constantly increasing
user base of 135+ million. These indexes and models facilitate
the discovery of new opportunities for our members. Other
use cases include database replication for read scalability, data
standardization, and query result pre-computation and caching.
At LinkedIn, we have built Databus, a system for change
data capture (CDC), that is being used to enable complex
online and near-line computations under strict latency bounds.
It provides a common pipeline for transporting CDC events
from LinkedIn primary databases to various applications.
Among these applications are the Social Graph Index, the
People Search Index, Read Replicas, and near-line processors
like the Company Name and Position Standardization.
Databus contains adapters written for Oracle and MySQL,
two of the primary database technologies at use at LinkedIn,
and a subscription API that allows applications to subscribe to
changes from one or more data sources. It is extremely easy to
extend it to add support for other kinds of data sources
(transaction log providers).
Figure III.1 Databus at LinkedIn
B. Problem Definition Next, we discuss what the important requirements for
Databus are.
Strong timeline consistency: To avoid having the
subscribers see partial and/or inconsistent data we need to
capture:
• Transaction boundaries: A single user’s action can
trigger atomic updates to multiple rows across
13731373

stores/tables, e.g. an insert into a member’s mailbox
and update on the member’s mailbox unread count.
• The commit order of the primary database
• All changes
User-space processing: By “user-space processing”, we
refer to the ability to perform the computation triggered by the
data change outside the database server. This is in contrast to
traditional database triggers that are run in the database server.
Moving the computation to user space has the following
benefits:
• Reduces the load on the database server
• Decouples the subscriber implementation from the
specifics of the database server implementation
• Enables independent scaling of the subscribers
Support for long look-back queries: Typically,
subscribers are interested only in recent changes that they
have not processed yet. Yet, there are occasions when
subscribers may want to read older changes.
• If they have suffered a performance hiccup or they have
been taken down for maintenance;
• New subscribers are added to increase capacity might
need to initialize their state and get a recent snapshot of
the database;
• All clients need to re-initialize their state because of the
need to reprocess the whole data set, e.g. processing
algorithm changes
Data source / subscriber isolation: Subscribers often
perform complex computations that may not allow a single
instance to keep up with the data change rate. In those cases, a
standard solution is to distribute the computation among
multiple instances along some partitioning axis.
Therefore, the pipeline should
• Allow multiple subscribers to process the changes as a
group; i.e. support partitioning;
• Support different types of partitioning for computation
tasks with different scalability requirements;
• Isolate the source database from the number of
subscribers so that increasing the number of the latter
should not impact the performance of the former;
• Isolate the source database from slow or failing
subscribers that should not negatively impact the
database performance;
• Isolate subscribers from the operational aspects of the
source database: database system choice, partitioning,
schema evolution, etc.
Low latency of the pipeline: Any overhead introduced by
the pipeline may introduce risk of inconsistencies, negatively
affect performance, or decrease the available time for the
asynchronous computations. For example, any latency in
updating a secondary index structures (like the previously
mentioned LinkedIn social graph index) increases the risk of
serving stale or inconsistent data. In the case of replication for
read scaling, pipeline latency can lead to higher front-end
latencies since more traffic will go to the master for the
freshest results.
Databus addresses the above requirements with features
like:
• Data-source independence: Oracle, MySQL, etc.
• Portable change event serialization and versioning
• Consumption from arbitrary point in the stream of
events (uses compressed deltas to avoid storing all
events)
Databus guarantees:
• Timeline consistency with the data source with
transactional semantics and at-least-once delivery
• No loss in durability (relies on bootstrap and primary
store on failure)
• High availability (replicated availability)
• Low latency (low milliseconds)
C. Architecture This section dives deeper into the architecture of Databus
and covers how it addresses the requirements from the
previous sub-section.
The Databus pipeline consists of three main components:
the Relay, the Bootstrap Server, and the Databus Client
Library. The Relay captures changes in the source database,
serializes them to a common binary format and buffers those.
Each change is represented by a Databus CDC event which
contains a sequence number in the commit order of the source
database, metadata, and payload with the serialized change.
Relays serve Databus events to both clients and the Bootstrap
servers. Bootstrap servers provide clients with arbitrary long
look-back queries in Databus event stream and isolate the
source database from having to handle these queries.
Figure III.2 Detailed Databus Architecture
Next, we will describe the three main components in
greater detail.
Relay: As mentioned above, the first task of the relay is to
capture changes from the source database. At LinkedIn, we
employ two capture approaches, triggers or consuming from
the database replication log.
Once captured, the changes are serialized to a data source-
independent binary format. We chose Avro because it is an
open format with multiple language bindings. Further, unlike
13741374

other formats like Protocol Buffers, Avro allows serialization
in the relay without generation of source-schema specific code.
The serialized events are stored in a circular in-memory
buffer that is used to serve events to the Databus clients. We
typically run multiple shared-nothing relays that are either
connected directly to the database, or to other relays to
provide replicated availability of the change stream.
The relay with the in-memory circular buffer provides:
• Default serving path with very low latency (<1 ms)
• Efficient buffering of tens of GB of data with
hundreds of millions of Databus events
• Index structures to efficiently serve to Databus clients
events from a given sequence number S
• Server-side filtering for support of multiple
partitioning schemes to the clients
• Support of hundreds of consumers per relay with no
additional impact on the source database
Figure III.3 Bootstrap server design
Bootstrap server: The main task of the bootstrap server is to
listen to the stream of Databus events and provide long-term
storage for them. It serves all requests from clients that cannot
be processed by the relay because of its limited memory. Thus,
the bootstrap server isolates the primary database from having
to serve those clients. There are two types of queries supported:
• Consolidated delta since sequence number (say T)
• Consistent snapshot at sequence number (say U)
The first query is used from clients that have some state but
have fallen behind the time span of events stored in the relay.
Instead of replaying all changes since T, the bootstrap server
will return what we refer to as consolidated delta: only the last
of multiple updates to the same row/key are returned. This has
the effect of “fast playback” of time and allows the client to
return faster to consumption from the relay.
The second type of query is used when the client does not
have any state (e.g. a new client). In that case, the bootstrap
server will serve a recent consistent snapshot of the database
and a sequence number U that is the sequence number of the
last transaction applied in the snapshot. The client can then
use the number U to continue consumption from the relay.
The main challenge is the ability to provide consistent
results for the above query types without interruption of the
events from the relay. We achieve this by using two separate
storages: a log and snapshot storage.
The Log writer listens for Databus events from the relay
and adds those to an append-only Log storage. The Log applier monitors for new rows in the Log storage and applies
those to the Snapshot storage where only the last event for a
given row/key is stored. On requests, the Server determines
the optimal path. For clients whose request sequence number
T is recent, it will serve directly from the Log storage. The
append-only nature of the Log storage guarantees that the
result is consistent. All other requests are first served from the
Snapshot storage. This may return inconsistent results, as
some of the rows may be modified during the snapshot
serving (which can take a long time). To guarantee
consistency, the Server replays all changes that have happened
since the start of the snapshot phase.
Like the relay, the Bootstrap server also supports server-
side filters that are pushed down to the storage if possible.
Databus client library: The Databus client library is the glue
between the Relays and Bootstrap servers and the business
logic of the Databus consumers. It provides: • Tracking of progress in the Databus event stream with
automatic switchover between the Relays and
Bootstrap servers when necessary;
• Push (callbacks) or pull interface
• Local buffering and flow control to ensure continuous
stream of Databus events to the consumers
• Support for multi-thread processing
• Retry logic if consumers fail to process some events
D. Related Systems The related systems can be classified in three
categories: generic pub/sub systems, database replication
systems, and other CDC systems. Generic pub/sub systems
like JMS implementations, Kafka and Hedwig generally
provide message-level or, at best, topic-level
semantics. Topic-level lets clients serialize messages on a
particular topic. These semantics do not suffice for
transaction log replication. Providing transaction-level
semantics requires implementing a transaction envelope on
top of the vanilla messaging API with transaction boundaries
provided by the producers and bubbled up to the consumers.
Distributed messaging systems let producers write to them
and are designed to provide persistence and ordering within a
topic. In order to provide fault-tolerance and high-availability,
they must implement fairly complex protocols that write each
message to multiple locations before acknowledging the
producer. As a benefit, the producer need not track or persist
its outgoing messages; consumers need only request and re-
request messages from the messaging system. This complexity
however comes at a cost in terms of development, operations,
sometimes reduced performance and corner cases around node
failures that can result in message loss.
Two assumptions about the data source and consumer state
greatly simplify the messaging system requirements. The first
13751375

assumption is that the data source is the source of truth, and
generates a commit sequence number with each transaction.
The transaction log generated is then replay-able from any
commit sequence number. The second assumption is that
consumers define their state relative to the source in terms of
sequence number, and persist their current state; this means a
consumer always knows which messages it has applied and
which it has not. These assumptions simplify the messaging
tier from worrying about persistence and delivery guarantees,
and focus just on scalable transport and replicated availability.
The Databus relay cluster therefore is a much simpler system
which pulls from a database, is stateless across restarts, and
can be replicated very simply since it relies on the source
database to provide the transaction log and drive ordering.
Finally, generic pub/sub systems provide only log storage
(typically limited by data size) and do not support snapshots
and consolidated deltas.
Database replication systems are often database vendor
specific (with some exceptions like Tungsten Replicator) and
have limited capabilities for user-space processing. Many of
the CDC systems are also database vendor specific and to the
best of our knowledge do not have support for consistent
snapshot or consolidated deltas.
E. Usage at LinkedIn Databus has been a foundational piece of LinkedIn’s
architecture since early 2005. It started off as the way to keep
LinkedIn’s social graph and search index consistent and up-to-
date with the changes happening in the databases. Over time,
it started to get used as a pure replication system for
populating read replicas, invalidating and keeping caches
consistent as well as supporting near-line processing
requirements. In 2010, we added the bootstrapping capability
and reworked the in-memory data structures at the relay to
provide high throughput and very low latency while scaling to
very large memory sizes without any performance penalties.
In terms of operational scale, Databus provides change
capture for close to a hundred data sources with tens of relays
at low millisecond latencies. Databus is the native replication
tier for our next-gen distributed data store ESPRESSO,
described next. Future work includes releasing the source
code back to the open source community, supporting
declarative data transformations and multi-tenancy.
IV. ESPRESSO
Espresso is a distributed, timeline consistent, scalable,
document store that supports local secondary indexing and
local transactions. ESPRESSO relies on Databus for internal
replication and therefore provides a Change Data Capture
pipeline to downstream consumers.
The development of Espresso was motivated by our desire
to migrate LinkedIn’s online serving infrastructure from
monolithic, commercial, RDBMS systems running on high
cost specialized hardware to elastic clusters of commodity
servers running free software; and to improve agility by
enabling rapid development by simplifying the programming
model, separating scalability, routing, caching from business
logic. Espresso bridges the semantic gap between a simple
Key Value store like Voldemort and a full RDBMS.
A. Data Model and API Espresso is a document-oriented data store that provides
hierarchical ordering of documents and local secondary
indexing. Documents in Espresso are identified by URIs in
the following form:
http://<host>[:<port>]/<database>/<table>/<resource_id>[/<subresource_id>…]
The resource specified by a resource_id may be a
singleton resource that references an individual document, or
a collection resource that references a set of related
documents. In the latter case, one or more
subresource_ids identify individual documents within
the collection.
In Espresso, a database is a container of tables. A table is a
container of documents.
Each database, table, and document has an associated
schema. Schemas are represented in JSON in the format
specified by Avro [Avro]. A database schema defines how the
database is partitioned. At present, the only supported
partitioning strategies are hash-based partitioning or un-
partitioned (all documents are stored on all nodes). We
anticipate adding range based partitioning in the future.
A table schema defines how documents within the table are
referenced. When defining the URI schema for a table, the
resource_id may designate a single document or a
collection of related documents that are identified by further
elements of the URI path. For example, the Music database
Artists table might contain profiles for recording artists by
artist name:
/Music/Artist/Rolling_Stones /Music/Artist/The_Beatles
whereas the Albums table might contain Albums by Artist
/Music/Album/Cher/Greatest_Hits /Music/Album/Elton_John/Greatest_Hits
and the Song table might contain songs by artist by album
/Music/Song/Doris_Day/Move_Over_Darling/At_Last /Music/Song/Etta_James/Gold/At_Last /Music/Song/Etta_James/Her_Best/At_Last
Each of these tables is defined by a table schema that
describes the elements of the URI path.
The document schema defines the structure of the
documents stored within a table. Document schemas are
freely evolvable. To evolve a document schema, one simply
posts a new version to the schema URI. New document
schemas must be compatible according to the Avro schema
resolution rules to insure that existing documents can be
promoted to the new schema. For each document, the system
stores a binary serialized version of the document along with
the schema version needed to deserialize the stored document.
Fields within the document schema may be annotated with
indexing constraints, indicating that documents should be
indexed for retrieval via the field’s value. HTTP query
parameters allow retrieval of documents via these secondary
13761376

indexes. For example, if the Songs document schema
contained a field lyrics with a free text index constraint, a
GET for the URI:
/Music/Song/The_Beatles?query=lyrics:”Lucy in the sky”
would return
/Music/Song/The_Beatles/Sgt._Pepper/Lucy_in_the_Sky_with_Diamonds /Music/Song/The_Beatles/Magical_Mystery_Tour/I_am_the_Walrus
At present, indexed access is limited to collection resources
accessed via a common resource_id in the URI path.
Future enhancements will implement global secondary
indexes maintained via a listener to the update stream.
Within a database, tables with a common resource_id
schema may be updated transactionally. Espresso guarantees
that all tables within a single database indexed by the same
resource_id path element will partition identically, thus
allowing their transactional update. In our example, the
Artist, Album and Song tables all share the artist name as
resource_id. One could post a new album for an artist to
the Album table and each of the album’s songs to the Song
table in a single transaction. Transactional updates are
performed by a POST to a database with a wildcard table
name in the URI, where the entity-body contains the
individual document updates. Espresso guarantees either all
updates commit successfully or none commit.
B. System Architecture The Espresso system consists of four major components:
routers, storage nodes, relays and cluster managers.
Figure IV.1 Espresso Architecture
Router: The router accepts HTTP requests, inspects the
URI and forwards the request to the appropriate storage node.
For a given request, the router examines the database
component of the path and retrieves the routing function from
the corresponding database schema. It then applies the
routing function to the resource_id element of the request
URI to compute a partition id. Next it consults the routing
table maintained by the cluster manager to determine which
storage node is the master for the partition. Finally, the router
forwards the HTTP request to the selected storage node.
Storage Node: Requests for a document are routed to the
storage node that is the master for the containing partition.
The storage node maintains a consistent view of each
document in a local data store and optionally indexes each
document in a local secondary index based on the index
constraints specified in the document schema. The initial
implementation stores documents in MySQL as the local data
store and Lucene for the local secondary index, though the
design allows for alternate implementations via a plugin
model. Each document is stored as a serialized byte stream
indexed by the URL resource_id and any
subresource_id. In our Song table example, the
underlying MySQL table contains:
+-----------------+--------------+------+-----+ | Field | Type | Null | Key | +-----------------+--------------+------+-----+ | artist | varchar | NO | PRI | | album | varchar | NO | PRI | | song | varchar | NO | PRI | | timestamp | bigint(20) | NO | | | etag | varchar(10) | NO | | | val | blob | YES | | | schema_version | smallint(6) | NO | | +-----------------+--------------+------+-----+
Table IV.1 Database Schema
The timestamp and etag fields are used to implement
conditional HTTP requests. Requests for specific resources
can be satisfied via direct lookup in the local data store.
Queries first consult a local secondary index then return the
matching documents from the local data store.
Each partition is replicated n ways within the cluster. The
replication factor is specified in the schema for the database.
Each storage node is master for a set of partitions and slave
for a disjoint set of partitions.
Consider the application view of the Albums table
described above as shown in Figure IV.2.
Figure IV.2 Album Table – Application View
Espresso partitions tables according to the resource_id
component of the URL - the Artist in this example.
Different values for Artist hash to different partitions. The
above table might partition as shown in Figure IV.3.
Relay: Espresso replication lays the foundation for
Espresso’s fault-tolerant and elastic solution. It is designed to
be timeline consistent, efficient, and robust.
Timeline consistency: Changes are applied on a slave
partition in the same order as on its master partition, i.e. in
RouterRouter
RouterDatabus Relay
ClusterManager
ClusterManager
Storage Node
MySQLLucene
Storage Node
MySQLLucene
Storage Node
MySQLLucene
...
ZooKeeper
Application
Artist Album Year
Akon Trouble 2004
Akon Stadium 2011
Babyface Lovers 1986
Babyface A Closer Look 1991
Babyface Face2Face 2001
Coolio Steal Hear 2008
... ... ...
Album Table - Client View
13771377

transaction commit order. This feature provides the basis for
implementing failover and rebalancing in Espresso. Changes
are captured, transferred and populated in the following
manner. First, on a storage node, all changes are tagged with
their transaction sequence number and captured in the MySQL
binlog. Second, the MySQL binlog is shipped to a Databus
relay node via MySQL Replication. Third, a storage node
pulls changes from Databus relay and applies them to the
slave partitions. All these steps follow the transaction commit
order so that timeline consistency is guaranteed.
Figure IV.3 Album Table – Partition Layout
Efficiency: Replication uses minimal resources on the
storage nodes so the impact on user query performance is
minimized. We achieve such efficiency by 1) maintaining a
single replication log on each storage node, and 2) pushing
work to the Databus relay nodes. On a storage node, we run
one MySQL instance and changes to all master partitions are
logged in a single MySQL binlog to preserve sequential I/O
pattern. However, each slave partition subscribes to changes
only from its master partition, so binlog sharding is required.
We use MySQL replication to publish the binlog of all master
partitions on a storage node to the Databus relay, where the
binlog is sharded into separate event buffers, one per partition.
A slave partition consumes events from the corresponding
Databus event buffer.
Robustness: Changes made by a transaction are durable
under failures. Each change is written to two places before
being committed -- the local MySQL binlog and the Databus
relay. If a storage node fails, the committed changes can still
be found in the Databus relay and propagated to other storage
nodes. We use the semi-synchronous feature of MySQL
replication to achieve this goal. As described in Section III,
the Databus relay is fault-tolerant and can sustain a certain
degree of failure. So the end-to-end replication is robust with
these features provided.
Espresso provides faults-tolerance and elasticity through its
replication tier. When a master partition fails, a slave partition
is selected to take over. The slave partition first consumes all
outstanding changes to the partition from the Databus relay,
and then becomes a master partition. It continues to replicate
changes to the Databus relay. When adding new nodes to an
existing Espresso cluster, certain master and slave partitions
are selected to migrate to a new node. For each migrated
partition, we first bootstrap the new partition from a snapshot
taken from the original master partition, and then apply any
changes since the snapshot from the Databus Relay. Once
caught up, the new partition is a slave. We then hand off
mastership to selected slaves.
Cluster Manager: The cluster manager, Helix, is a generic
platform for managing a cluster of nodes, including Espresso
storage nodes and Databus relay nodes. There are various scenarios, such as node failures and partition migration, where the system must react appropriately to satisfy the requirements of a fault tolerant system. Helix manages the various components in the cluster. It provides the following features:
Robust hosted services: It provides control flow for fault
tolerance and optimized rebalancing during cluster expansion
for partitioned and replication resources.
Load balancing: It performs smart allocation of resources
to servers (nodes) based on server capacity and resource
profile (size of partition, access pattern etc.).
Service discovery: It manages cluster configuration in a
centralized fashion, and provides automatic service discovery
to route requests.
Server lifecycle management: It manages entire operational
lifecycle of server -- addition, deletion, start, stop, enable and
disable without downtime.
Health check: It monitors cluster health and provides alerts
on SLA violations.
To build such a system, we need a mechanism to co-
ordinate between different nodes or components in the system.
This mechanism can be achieved with software that observes
any changes in the cluster and generates a set of tasks needed
to bring the cluster to a stable state. The tasks are assigned to
one or more nodes in the cluster. Helix is modelled as state
machine. Helix implements a state machine that contains the
following states:
• The IDEALSTATE for the cluster, representing the state when all configured nodes are up and running.
• The CURRENTSTATE representing the current state of
the nodes in the cluster. The CURRENTSTATE differs from the IDEALSTATE when one or more nodes are
unavailable due to system failure, maintenance, etc.
• The BESTPOSSIBLESTATE is the state closest to the
IDEALSTATE given the set of available nodes.
We omit the details of how we compute these states. Helix
generates tasks to transform the CURRENTSTATE of the cluster
to the BESTPOSSIBLESTATE. When all nodes are available, the
BESTPOSSIBLESTATE will converge to the IDEALSTATE. Tasks
are assigned to nodes to perform state changes. Helix uses
Zookeeper as a distributed store to maintain the state of the
cluster and a notification system to notify if there are any
changes in the cluster state.
C. Related Work Espresso draws inspiration from a number of prominent large-
scale data serving systems. Many such systems also store
records as documents. Microsoft’s Azure [Azure] and
Node 1
Artist Album Year
Akon Trouble 2004
Akon Stadium 2011
... ... ...
Partition 1 Master
Node 2
Node N
Artist Album Year
Coolio Steal Hear 2008
... ... ...
Partition N Master
Album Table - Partition Distribution
Artist Album Year
Babyface Lovers 1986
Babyface A Closer Look 1991
Babyface Face2Face 2001
... ... ...
Partition 2 Master
Artist Album Year
Babyface Lovers 1986
Babyface A Closer Look 1991
Babyface Face2Face 2001
... ... ...
Partition 2 Slave
Artist Album Year
Coolio Steal Hear 2008
... ... ...
Partition N Slave
Artist Album Year
Akon Trouble 2004
Akon Stadium 2011
... ... ...
Partition 1 Slave
Artist Album YearYY
Babyface Lovers 1986
Babyface A Closer LookA 1991
Babyface Face2Face 2001
... ... ...
Artist Album YearYY
Akon Trouble 2004
Akon Stadium 2011
... ... ...
Artist Album YearYY
Coolio Steal Hear 2008
... ... ...
13781378
Google’s Megastore [BBJ+11], in particular, support record
hierarchies, similar to our resources and subresources. Like us,
Yahoo’s PNUTS [CRS+08] uses MySQL as its storage engine,
and replicates writes asynchronously through a separate
transport layer (Databus in our case).
D. Espresso Deployment at LinkedIn
Espresso was first deployed at LinkedIn in September 2011
to serve read traffic for company profiles, products and
reviews. Test deployments for users’ inbox content are
underway. Future deployments are under development.
V. KAFKA
There is a large amount of event data generated at any
sizable internet company. This data typically includes (1) user
activity events corresponding to logins, page-views, clicks,
“likes”, sharing, comments, and search queries; (2)
operational metrics such as various service metrics and call
stack. Event data has long been a component of offline
analysis for tracking user engagement and system utilization.
However, an increasing number of applications require online
consumption of this data. These include (1) search relevance,
(2) recommendations which may be driven by item popularity
or co-occurrence in the activity stream, (3) security
applications that protect against abusive behaviours such as
spam or unauthorized data scraping, (4) newsfeed features that
aggregate user status updates or actions for their “friends” or
“connections” to read, and (5) real time dashboards of various
service metrics.
We developed a system called Kafka [KNR11] for
collecting and delivering event data. Kafka adopts a
messaging API to support both real time and offline
consumption of this data. Since event data is 2-3 orders
magnitude larger than data handled in traditional messaging
systems, we made a few unconventional yet practical design
choices to make our system simple, efficient and scalable.
A. Kafka API and Architecture We first introduce the basic concepts in Kafka. A stream of
messages of a particular type is defined by a topic. A producer
publishes messages to a topic. The published messages are
stored at a set of servers called brokers. A consumer
subscribes to one or more topics, and consumes the subscribed
messages by pulling data from the brokers.
Messaging is conceptually simple, and we have tried to
make the Kafka API equally simple to reflect this. Instead of
showing the exact API, we present some sample code to show
how the API is used. The sample code of the producer is given
below. A message is defined to contain just a payload of bytes.
A user can choose her favorite serialization method to encode
a message. For efficiency, the producer can send a set of
messages in a single publish request.
To subscribe to a topic, a consumer first creates one or
more message streams for the topic. The messages published
to that topic will be evenly distributed into these sub-streams.
The details about how Kafka distributes the messages are
described later in Section V.C. Each message stream provides
an iterator interface over the continual stream of messages
being produced. The consumer then iterates over every
message in the stream and processes the payload of the
message. Unlike traditional iterators, the message stream
iterator never terminates. If there are currently no more
messages to consume, the iterator blocks until new messages
are published to the topic. We support both the point-to-point
delivery model in which multiple consumers jointly consume
a single copy of all messages in a topic, as well as the
publish/subscribe model in which multiple consumers each
retrieve its own copy of a topic.
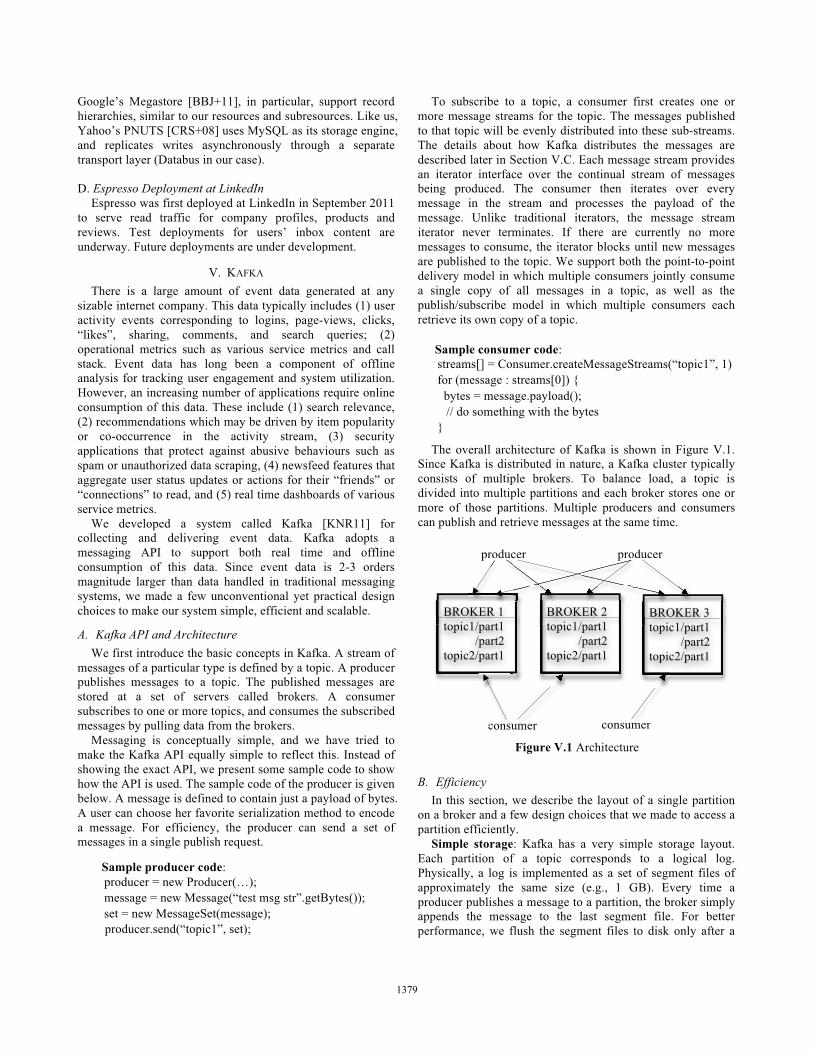
The overall architecture of Kafka is shown in Figure V.1.
Since Kafka is distributed in nature, a Kafka cluster typically
consists of multiple brokers. To balance load, a topic is
divided into multiple partitions and each broker stores one or
more of those partitions. Multiple producers and consumers
can publish and retrieve messages at the same time.
B. Efficiency In this section, we describe the layout of a single partition
on a broker and a few design choices that we made to access a
partition efficiently.
Simple storage: Kafka has a very simple storage layout.
Each partition of a topic corresponds to a logical log.
Physically, a log is implemented as a set of segment files of
approximately the same size (e.g., 1 GB). Every time a
producer publishes a message to a partition, the broker simply
appends the message to the last segment file. For better
performance, we flush the segment files to disk only after a
Sample producer code:
producer = new Producer(…);
message = new Message(“test msg str”.getBytes());
set = new MessageSet(message);
producer.send(“topic1”, set);
Sample consumer code:
streams[] = Consumer.createMessageStreams(“topic1”, 1)
for (message : streams[0]) {
bytes = message.payload();
// do something with the bytes
}
producer producer p p
consumer consumer consumer umer
Figure V.1 Architecture
BROKER 1
topic1/part1
/part2
topic2/part1
BROKER 2
topic1/part1
/part2
topic2/part1
BROKER 3
topic1/part1
/part2
topic2/part1
13791379

configurable number of messages have been published or a
certain amount of time has elapsed. A message is only
exposed to the consumers after it is flushed.
Unlike typical messaging systems, a message stored in
Kafka doesn’t have an explicit message id. Instead, each
message is addressed by its logical offset in the log. This
avoids the overhead of maintaining auxiliary index structures
that map the message ids to the actual message locations. Note
that our message ids are increasing but not consecutive. To
compute the id of the next message, we have to add the length
of the current message to its id.
Many traditional messaging systems support out of order
delivery of messages. This tends to increase the complexity of
the system and is not necessary for our purpose. Instead, in
Kafka, a consumer always consumes messages from a
partition sequentially. If the consumer acknowledges a
particular message offset, it implies that the consumer has
received all messages prior to that offset in the partition.
Under the covers, the consumer is issuing asynchronous pull
requests to the broker to have a buffer of data ready for the
application to consume. Each pull request contains the offset
of the message from which the consumption begins and a
maximum number of bytes to fetch. For every partition in a
topic, a broker keeps in memory the initial offset of each
segment file. The broker locates the segment file where the
requested message resides by searching the offset list, and
sends the data back to the consumer.
Efficient transfer: We are very careful about transferring
data in and out of Kafka. Earlier, we have shown that the
producer can submit a set of messages in a single send request.
Although the ultimate consumer API iterates one message at a
time, under the covers, each pull request from a consumer also
retrieves multiple messages up to a certain size, typically
hundreds of kilobytes.
Another unconventional choice that we made is to avoid
explicitly caching messages in memory at the Kafka layer.
Instead, we rely on the underlying file system page cache.
This has the main benefit of avoiding double buffering---
messages are only cached in the page cache. This has the
additional benefit of retaining warm cache even when a broker
process is restarted. Since Kafka doesn’t cache messages in
process at all, it has very little overhead in garbage collecting
its memory, making efficient implementation in a VM-based
language feasible. Finally, since both the producer and the
consumer access the segment files sequentially, with the
consumer often lagging the producer by a small amount,
normal operating system caching heuristics are very effective
(e.g., write-through caching and read-ahead) for performance.
In addition, we optimize the network access for consumers.
A typical approach to sending bytes from a local file to a
remote socket involves the following steps: (1) read data from
the storage media to the page cache in an OS, (2) copy data in
the page cache to an application buffer, (3) copy application
buffer to another kernel buffer, (4) send the kernel buffer to
the socket. This includes 4 data copying and 2 system calls.
On Linux and other Unix operating systems, there exists a
sendfile API [ZC] that can directly transfer bytes from a file
channel to a socket channel. This typically avoids 2 of the
copies and 1 system call introduced in steps (2) and (3). Kafka
exploits the sendfile API to efficiently deliver bytes in a log
segment file from a broker to a consumer.
Finally, to enable efficient data transfer especially across
datacenters, we support compression in Kafka. Each producer
can compress a set of messages and send it to the broker. The
compressed data is stored in the broker and is eventually
delivered to the consumer, where it is uncompressed. In
practice, we save about 2/3 of the network bandwidth with
compression enabled.
Distributed Consumer State: Unlike most other
messaging systems, in Kafka, the information about how
much each consumer has consumed is not maintained by the
broker, but by the consumer itself. Such a design reduces a lot
of the complexity and the overhead on the broker. However,
this makes it tricky to delete a message, since a broker doesn’t
know whether all subscribers have consumed the message.
Kafka solves this problem by using a simple time-based SLA
for the retention policy. A message is automatically deleted if
it has been retained in the broker longer than a certain period
(e.g., 7 days). This solution works well in practice. Most
consumers, including the offline ones, finish consuming either
daily, hourly, or in real-time.
There is an important side benefit of this design. A
consumer can deliberately rewind back to an old offset and re-
consume data. This violates the common contract of a queue,
but proves to be an essential feature for many consumers. For
example, when there is an error in application logic, the
application can re-play certain messages after the error is
fixed. As another example, the consumed data may be flushed
to a persistent store periodically (e.g., a text indexer). If the
consumer crashes, the unflushed data is lost. In this case, the
consumer can checkpoint the smallest offset of the unflushed
messages and re-consume from that offset when it’s restarted.
C. Distributed Coordination We now describe how the producers and the consumers
behave in a distributed setting. Each producer can publish a
message to either a randomly selected partition or a partition
semantically determined by a partitioning key and a
partitioning function. We will focus on how the consumers
interact with the brokers.
Kafka has the concept of consumer groups. Each consumer
group consists of one or more consumers that jointly consume
a set of subscribed topics, i.e., each message is delivered to
only one of the consumers within the group. Different
consumer groups each independently consume the full set of
subscribed messages and no coordination is needed across
consumer groups. The consumers within the same group can
be in different processes or on different machines.
Our goal is to divide the messages stored in the brokers
evenly among the consumers, without introducing too much
coordination overhead. In Kafka, the smallest unit of
parallelism for consumption is a partition within a topic. This
means that at any given time, all messages from one partition
are consumed only by a single consumer within each
consumer group. Had we allowed multiple consumers to
simultaneously consume a single partition, they would have to
13801380

coordinate who consumes what messages, which necessitates
locking and state maintenance overhead. In contrast, in our
design consuming processes only need coordination when the
load has to be rebalanced among them, an infrequent event.
For better load balancing, we require many more partitions in
a topic than the consumers in each group. We can achieve this
by over partitioning a topic.
To facilitate the coordination, we employ a highly available
consensus service Zookeeper [Zoo]. Kafka uses Zookeeper for
the following tasks: (1) detecting the addition and the removal
of brokers and consumers, (2) triggering a rebalance process
in each consumer when the above events happen, and (3)
maintaining the consumption relationship and keeping track of
the consumed offset of each partition. When a rebalance is
triggered, each consumer reads the current information in
Zookeeper and selects a subset of partitions to consume from.
D. Kafka Deployment at LinkedIn We have been using Kafka in production since Aug. 2010.
At LinkedIn, we have one Kafka cluster co-located with each
datacenter where our user-facing services run. The frontend
services generate various kinds of event data and publish it to
the local Kafka brokers in batches. The online consumers of
Kafka run in services within the same datacenter. They
include: (1) processing news postings from each member and
feed the processed data to a real-time search index; (2)
aggregating discussions across groups/forums within the same
industry; (3) a security application that limits the usage of
accounts with irregularly high activity.
We also deploy a cluster of Kafka in a separate datacenter
for offline analysis, located geographically close to our
Hadoop cluster and other data warehouse infrastructure. This
instance of Kafka runs a set of embedded consumers to pull
data from the Kafka instances in the live datacenters. We then
run data load jobs to pull data from this replica cluster of
Kafka into Hadoop and our data warehouse, where we run
various reporting jobs and analytical process on the data. We
also use this Kafka cluster for prototyping and have the ability
to run simple scripts against the raw event streams for ad hoc
querying. Without too much tuning, the end-to-end latency for
the complete pipeline is about 10 seconds on average, good
enough for our requirements.
Currently, we collect hundreds of GB of compressed
activity events per day, with a peak rate of more than 50K
messages per second produced. We have also started
collecting our service call events. We expect the peak rate to
be more than 200K messages per second when this effort is
fully ramped up.
Our tracking also includes an auditing system to verify that
there is no data loss along the whole pipeline. To facilitate that,
each message carries the timestamp and the server name when
they are generated. We instrument each producer such that it
periodically generates a monitoring event, which records the
number of messages published by that producer for each topic
within a fixed time window. The producer publishes the
monitoring events to Kafka in a separate topic. The consumers
can then count the number of messages that they have
received from a given topic and validate those counts with the
monitoring events to validate the correctness of data.
Kafka has been an Apache incubator project [KA] since
July 2011. Since then, we have seen more and more
companies outside of LinkedIn adopting Kafka. One of the
most important features that we plan to add in the future is
intra-cluster replication.
VI. CONCLUSIONS
We have described a few of the key building blocks of the
data infrastructure for a modern social web site. Each of these
systems faces related problems around partitioning, routing,
availability, expansion, management, and monitoring.
However, the constraints imposed by the application
requirements, as well as the fundamental difficulties of a
distributed system result in the need to build specialized
systems. To reduce the complexity of these solutions, we are
working on the following two most important areas: (1)
understanding the smallest most general set of infrastructure
that can serve our current and future application needs; (2)
building and leverage key lower-level distributed systems
components such as Avro, Zookeeper or Helix that can be
shared across and ease the development of these systems.
REFERENCES
[Avro] http://avro.apache.org
[Azure] Azure:
http://www.microsoft.com/windowsazure/sqlazure/
[BBJ+11] J. Baker et al., Megastore: Providing Scalable, Highly
Available Storage for Interactive Services, CIDR 2011
[CRS+08] B. Cooper et al., "PNUTS: Yahoo!'s Hosted Data
Serving Platform," VLDB 2008
[DHJ+07] Giuseppe DeCandia, et al. Dynamo: Amazon's Highly
Available Key-Value Store, SOSP 2007.
[FLP+10] Daniel Ford, et al. Availability in Globally Distributed
Storage Systems, SOSP 2010.
[KA] http://incubator.apache.org/kafka
[KNR11] Jay Kreps, Neha Narkhede and Jun Rao. Kafka: A
Distributed Messaging System for Log Processing,
NetDB 2011
[LAM78] Leslie Lamport. Time, clocks, and the ordering of
events in a distributed system. ACM Communications,
21(7), 1978
[OBS99] Michael A. Olson, Keith Bostic, and Margo Seltzer.
Berkeley DB. USENIX 1999
[SMK+01] Ion Stoica, et al. Chord: A scalable peer-to-peer lookup
service for internet applications, SIGCOMM 2001
[WHI09] Tom White. Hadoop: The Definite Guide. O’Reilly
Media. May 2009
[ZC] Efficient data transfer through zero copy:
https://www.ibm.com/developerworks/linux/library/j-
zerocopy/
[Zoo] http://zookeeper.apache.org
13811381