data entry and analysis - evaluatod · 2015-07-16 · data entry and analysis. 3 . wilder research,...
TRANSCRIPT
Data entry and analysis Wilder Research, February 2009 1
Wilder Research
Data entry and analysis Evaluation resources from Wilder Research
General instructions
Preparation for data entry
Data entry is often thought of as a time-consuming process, but there are steps you can take to make the process more efficient. You will save time in the long run if you take time up front to prepare for data entry. Below are some general steps to help you get started:
Assign an ID number to each form or survey to be entered, and write the number at the top of each survey. These can be numbers such as 1, 2, 3, 4, but each number should be used only once, even across different batches of surveys. This will make it much easier to go back and re-enter data if you realize you have made a mistake.
In some instances, like surveys you collect on a recurring basis from the same people (such as teachers), you may wish to continue to assign the same ID for each respondent. You will need to maintain a master list that you can reference for assigning and tracking these ID numbers in the future.
Schedule a large enough block of time to enter an entire batch of data at once. The time needed for this will vary depending on the length of the survey and the number of participants, but it is best to enter all of the information at the same time if possible. This will minimize the chance that you enter the same survey twice, or forget to enter any remaining surveys.
Before you begin entering the data, take time to go through each completed survey and identify questionable responses. See the section on making data entry decisions to identify some common unexpected responses that survey respondents make, and take note of the tips for working with difficult or confusing surveys. By taking time up front to identify potential problem areas, you can make consistent decisions about what you plan to enter in each situation, and you will save time once you begin entering the data.
Data entry and analysis Wilder Research, February 2009 2
Layout of databases
Wilder has created Microsoft Excel databases for you to use for most of the data entry tasks necessary for this evaluation. When first opening the Excel databases, they may appear overwhelming but the structure is actually fairly simple. There are two main components to these databases:
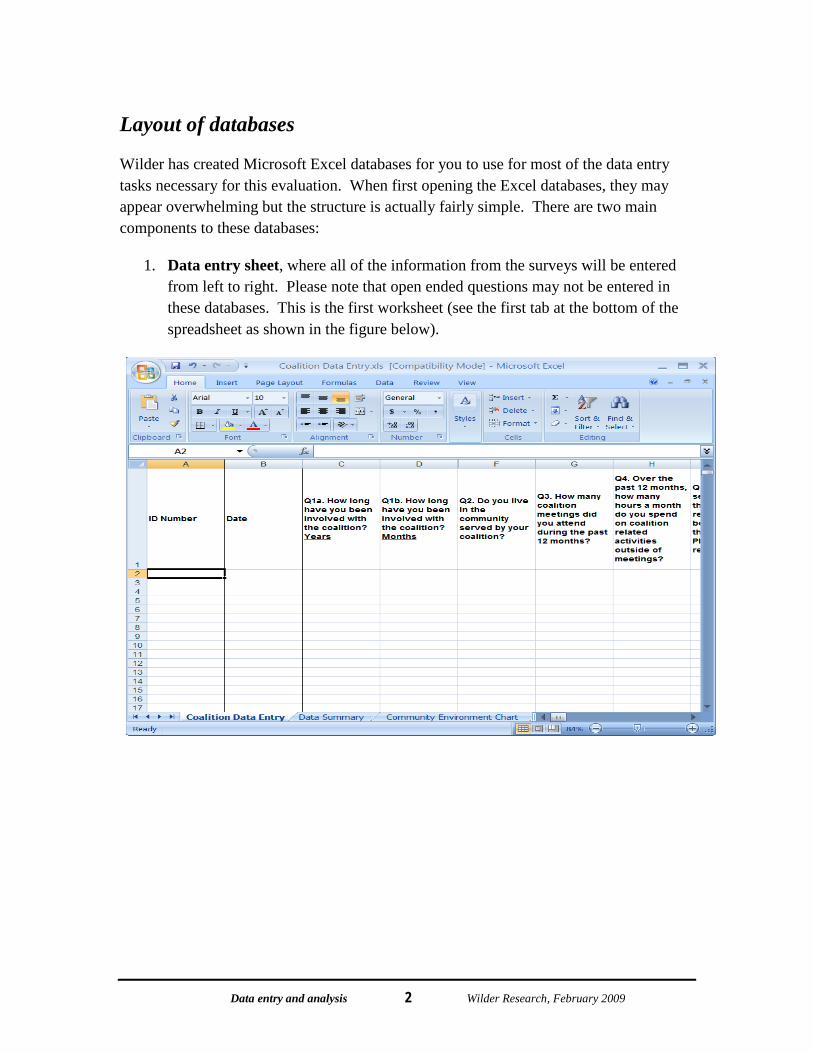
1. Data entry sheet, where all of the information from the surveys will be entered from left to right. Please note that open ended questions may not be entered in these databases. This is the first worksheet (see the first tab at the bottom of the spreadsheet as shown in the figure below).

Data entry and analysis Wilder Research, February 2009 3
2. Data analysis sheet(s), which automatically analyze data as they are entered and populate the cells in the table. The cells in this section are locked and no information should be entered in this area under any circumstances. These sheets are composed of data tables and in some cases, charts. These are the second and third worksheets (see the second and, in some cases, third tabs at the bottom of the spreadsheet as shown in the figure below).

Data entry and analysis Wilder Research, February 2009 4
Step-by-step data entry instructions There are generally three kinds of data you will be entering: 1) continuous numbers (e.g., months, years, ages, and numbers of participants), 2) multiple choice responses (e.g., strongly agree, agree, disagree, strongly disagree), and 3) text data. Each of the Excel files Wilder has created for data entry will reflect the response options of the corresponding survey. For example, for multiple choice questions, the possible categories will be available in the Excel file for you to select from a drop-down menu. For text and continuous items, the cells in the Excel file will likely be blank, and you will simply type into the appropriate cell what was written on the survey.
The following provides a step-by-step process for completing data entry into Excel.
1. The first time you open the database, be sure you save it in a secure location on your computer. This will preferably be on a password protected network or drive. From the database screen, you can simply click under the File menu (Office 2003 or earlier, see figure on the left below) or the Office button (Office 2007, see figure on the right below) located at the top left corner of the screen. Under this menu, select “Save as” and navigate to the location you would like to save the database. It may be easiest for you to save all of the data files in the same location. Add the current date to the name of the file and click “Save.” Adding the date will help you keep track of updates and versions of the database in the future. After saving the file, you are ready to begin entering your data.

Data entry and analysis Wilder Research, February 2009 5
1. At the top of the spreadsheet, you will see either the full question or the abbreviated name of the corresponding survey item listed along the top row (e.g. Q1. First time or Q1a. How long have you been involved with the coalition?). The key words are to help you keep track of what question you are on as you complete your data entry. They do not represent the full meaning of the question. Be aware that some questions have several parts to them and therefore, multiple data entry columns (e.g., Coalition Q1a. and Q1b., and Responsible Beverage Server Training Q2a. and Q2b., see figure below).
2. The item names across the top are listed in the same order as the items appear in the survey, to facilitate data entry.
3. In the first blank cell on the left under the column labeled “ID,” enter the ID number assigned to the survey that you are entering.
4. Type in the date the form or survey was completed, listed at the top of the survey when noted on the form. You can type dates with abbreviations or numbers – they will automatically format to “mo/day/yr” style (see figure below).

Data entry and analysis Wilder Research, February 2009 6
2. For multiple choice questions, a gray arrow will appear to the right of the cell when your mouse hovers over the cell. Click on this arrow to access a drop-down menu of responses. Select the response that corresponds to the response noted on the survey (see figure below). Note: be sure to select the response carefully and check your answers. It is easy to make errors at this step in the process.
3. For continuous numbers, simply enter the number as it appears on the written survey (e.g., if the respondent noted he or she has attended 6 meetings to date, type the number “6” into the cell). There are no drop-down menus for these items.
4. For text data (e.g., the information written on the survey that specifies what a response option of “other” means), there will usually be a column immediately following the column in which you selected the response option “other” that allows you to enter the written text response for “other.” If nothing is written in on the survey, you can leave that cell blank.

Data entry and analysis Wilder Research, February 2009 7
5. For surveys that contain open-ended responses, those responses will not be included in the summary analysis that is automatically generated in Excel. You may choose to enter more lengthy text responses using a program that is more familiar to you, such as Microsoft Word. Just be sure to keep track of where you enter it, as well as the survey ID and any other relevant information.
6. Enter all responses from a single survey before entering data from another survey.
7. Repeat steps for all surveys.
8. Be sure to save your data often during the data entry process!
Making data entry decisions
No matter how clearly a survey is written, there will be some survey respondents who do unexpected things. For example, respondents may choose multiple answers even when asked to choose only one, they may skip questions, or it may just be difficult to understand their intended response. The following are some common issues that you may discover and some ideas for navigating those difficult surveys. Once you have made a decision about how to treat a particular issue, make note of it in a separate document, or even in the margin of these instructions, to reference later and help ensure consistency in your decision-making process.
If data are missing or unintelligible, just leave the space blank in the database. You should not try to guess what the respondent might have been thinking.
A participant may respond to a numerical question with a range of numbers (e.g., “1 or 2” or “5-7”) or a vague reference (e.g., “a couple” or “several”) instead of a single number. In these cases, the response is too vague to translate into a single representative number, so you will simply leave this cell blank.
Sometimes respondents will be unable to choose between two options such as ‘agree’ and ‘strongly agree’, and will select both! Again, you’ll have to decide what to do in this situation. Unless it is clear that one of the responses was the intended response (e.g., the other is crossed out or one is especially obviously indicated), you are safer to just leave that space blank in the database. We do not want to try to guess participants’ intentions.
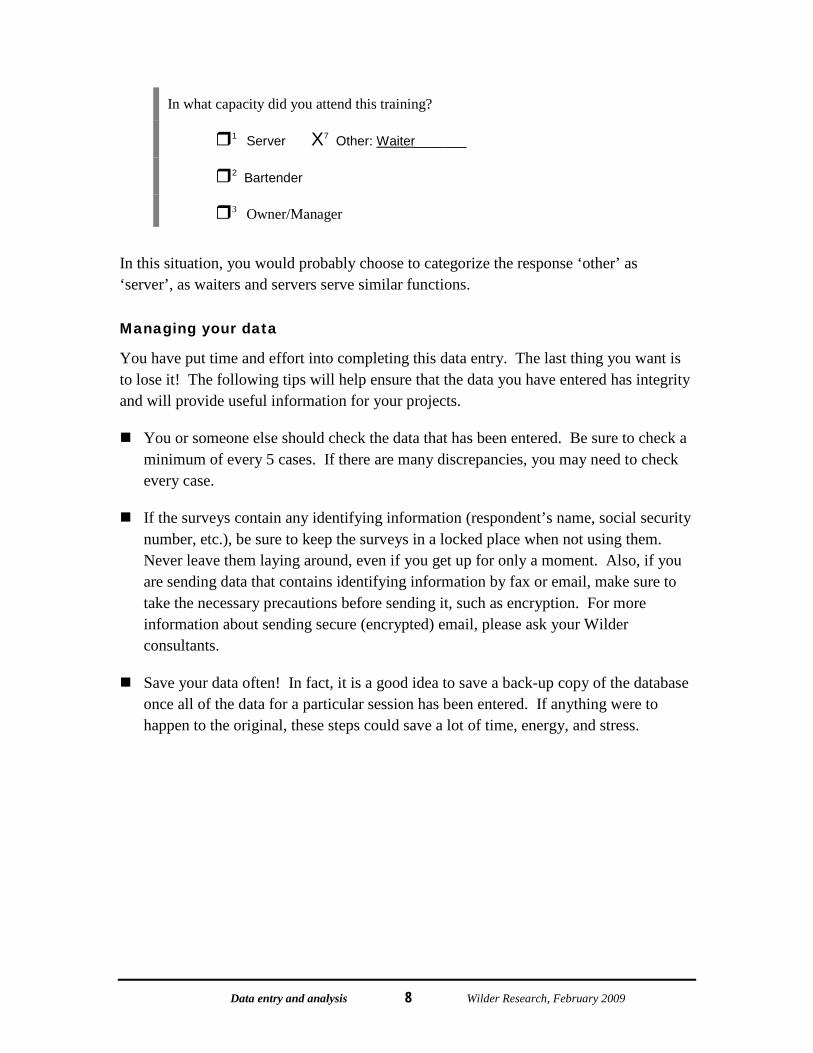
For those surveys in which an ‘other’ category is possible, you will have to decide how to treat these answers. You may enter them into the spreadsheet as described above in Step 8. However, sometimes respondents choose ‘other’, but then provide an answer that closely aligns with one of your response categories. See the example below:
Data entry and analysis Wilder Research, February 2009 8
In what capacity did you attend this training?
1 Server X7 Other: Waiter_______
2 Bartender
3 Owner/Manager
In this situation, you would probably choose to categorize the response ‘other’ as ‘server’, as waiters and servers serve similar functions.
Managing your data
You have put time and effort into completing this data entry. The last thing you want is to lose it! The following tips will help ensure that the data you have entered has integrity and will provide useful information for your projects.
You or someone else should check the data that has been entered. Be sure to check a minimum of every 5 cases. If there are many discrepancies, you may need to check every case.
If the surveys contain any identifying information (respondent’s name, social security number, etc.), be sure to keep the surveys in a locked place when not using them. Never leave them laying around, even if you get up for only a moment. Also, if you are sending data that contains identifying information by fax or email, make sure to take the necessary precautions before sending it, such as encryption. For more information about sending secure (encrypted) email, please ask your Wilder consultants.
Save your data often! In fact, it is a good idea to save a back-up copy of the database once all of the data for a particular session has been entered. If anything were to happen to the original, these steps could save a lot of time, energy, and stress.
Data entry and analysis Wilder Research, February 2009 9
Data analysis
Quantitative data analysis
Once you have collected your data, you must decide on what types of analysis to use. Statistical analysis of quantitative data can be quite complex, but some relatively simple statistics can provide useful information. Descriptive statistics help you summarize your data and identify key findings. Inferential statistics help you draw conclusions from your results. You will be focusing primarily on descriptive statistics for this evaluation. All of the analyses necessary to carry out this evaluation plan are provided for you in your Microsoft Excel databases. If you are interested in conducting additional analyses, consider talking with your Wilder consultant.
Some of the descriptive methods you will use include:
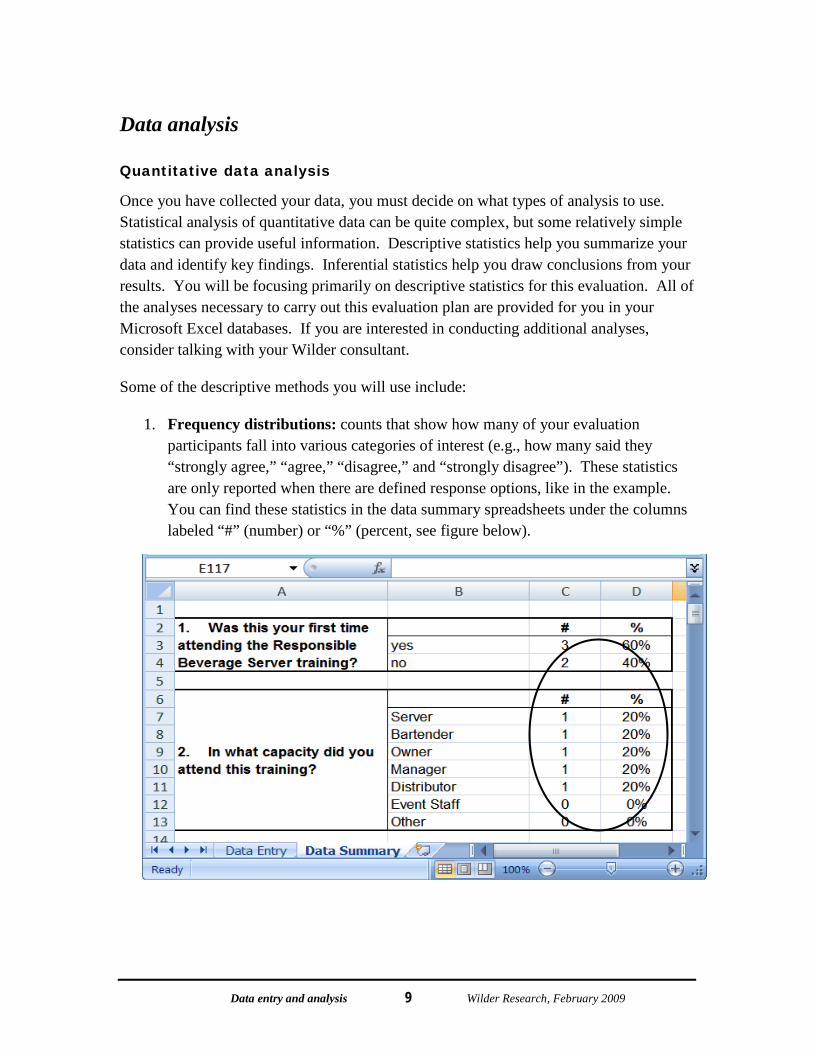
1. Frequency distributions: counts that show how many of your evaluation participants fall into various categories of interest (e.g., how many said they “strongly agree,” “agree,” “disagree,” and “strongly disagree”). These statistics are only reported when there are defined response options, like in the example. You can find these statistics in the data summary spreadsheets under the columns labeled “#” (number) or “%” (percent, see figure below).
Data entry and analysis Wilder Research, February 2009 10
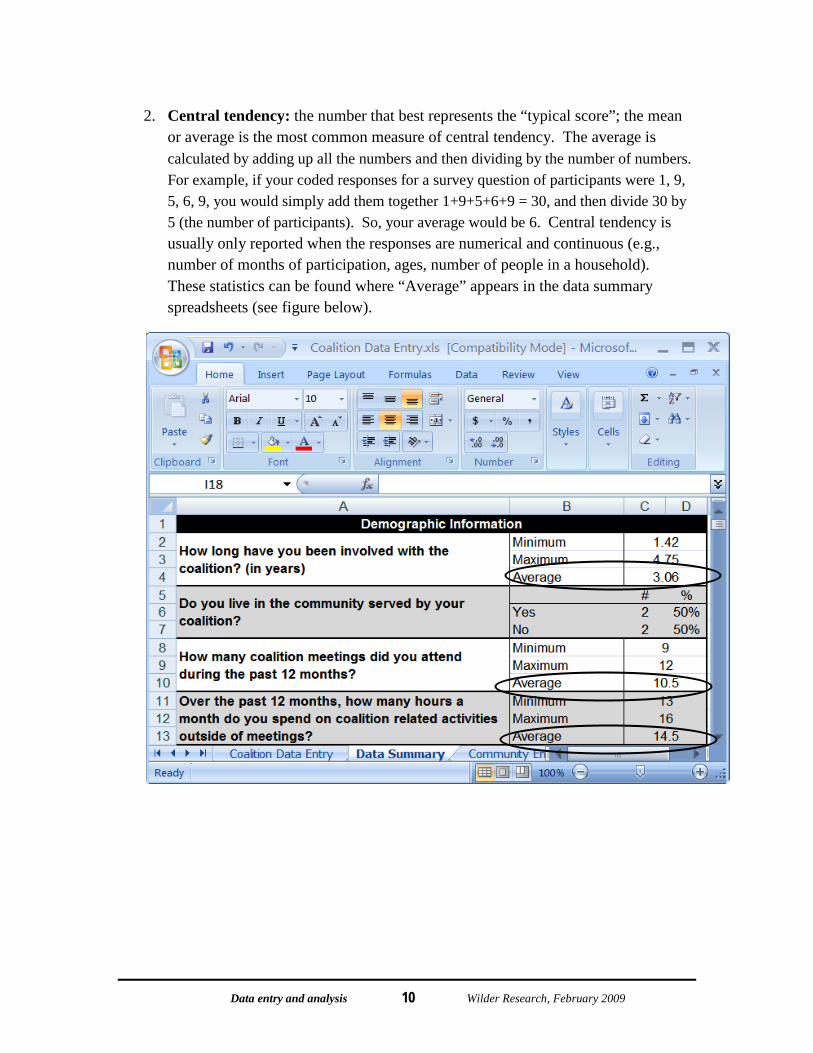
2. Central tendency: the number that best represents the “typical score”; the mean or average is the most common measure of central tendency. The average is calculated by adding up all the numbers and then dividing by the number of numbers. For example, if your coded responses for a survey question of participants were 1, 9, 5, 6, 9, you would simply add them together 1+9+5+6+9 = 30, and then divide 30 by 5 (the number of participants). So, your average would be 6. Central tendency is usually only reported when the responses are numerical and continuous (e.g., number of months of participation, ages, number of people in a household). These statistics can be found where “Average” appears in the data summary spreadsheets (see figure below).
Data entry and analysis Wilder Research, February 2009 11
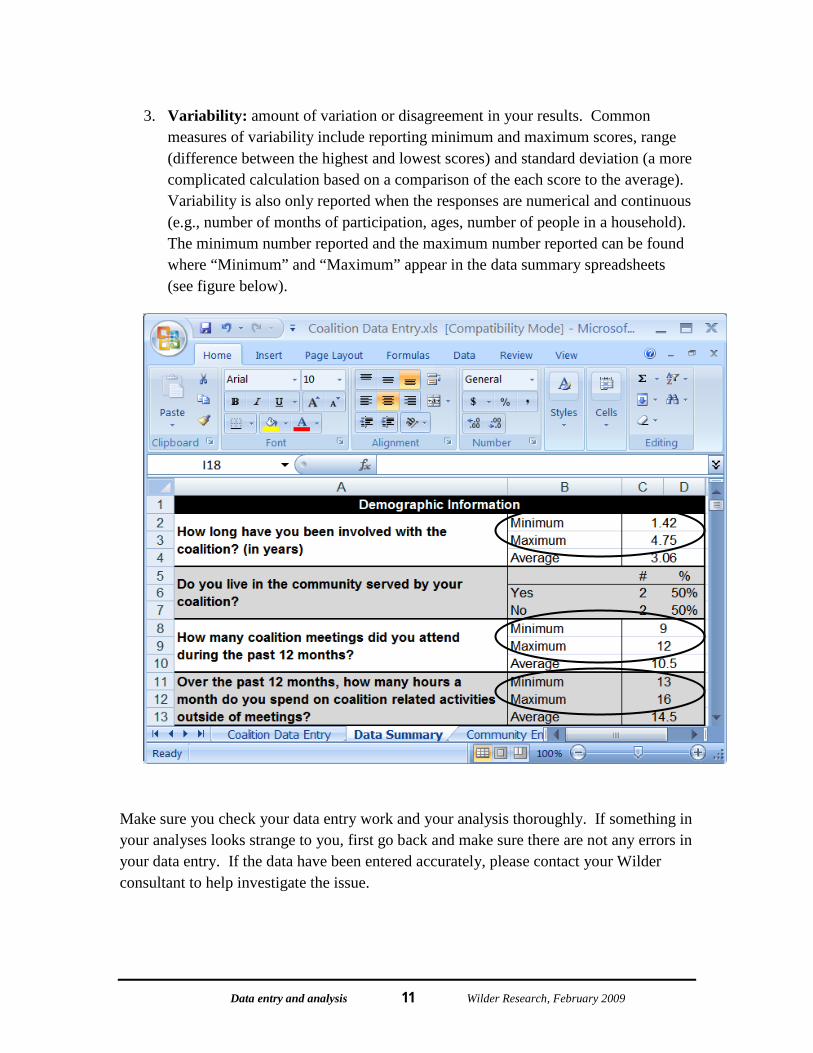
3. Variability: amount of variation or disagreement in your results. Common measures of variability include reporting minimum and maximum scores, range (difference between the highest and lowest scores) and standard deviation (a more complicated calculation based on a comparison of the each score to the average). Variability is also only reported when the responses are numerical and continuous (e.g., number of months of participation, ages, number of people in a household). The minimum number reported and the maximum number reported can be found where “Minimum” and “Maximum” appear in the data summary spreadsheets (see figure below).
Make sure you check your data entry work and your analysis thoroughly. If something in your analyses looks strange to you, first go back and make sure there are not any errors in your data entry. If the data have been entered accurately, please contact your Wilder consultant to help investigate the issue.
Data entry and analysis Wilder Research, February 2009 12
Qualitative data analysis
Although you may not need to do any analysis with your qualitative data in order to report it, you may choose to organize the open-ended comments into codes or themes. This process can be somewhat more complicated than simply listing responses, but can be very useful if there were a lot of respondents. Coding responses into themes is also helpful for identifying common ideas expressed by the respondents. See the Reporting Research Findings section of this manual for more information about coding and presenting open-ended responses.
For more information To learn more about evaluation www.wilderresearch.org FEBRUARY 2009
Wilder Research Information. Insight. Impact. 451 Lexington Parkway North Saint Paul, Minnesota 55104 651-280-2700 www.wilderresearch.org