data driven possibilities with qlik
TRANSCRIPT
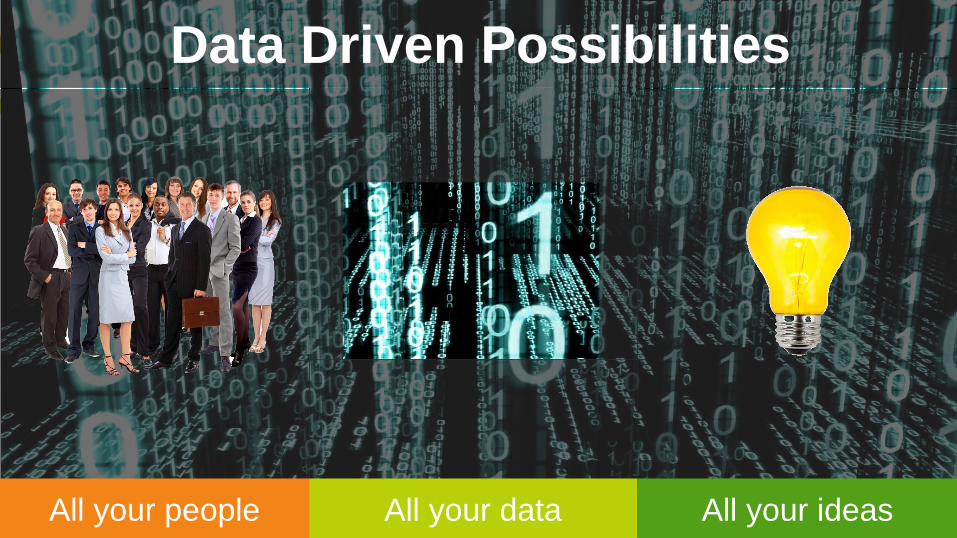
All your people All your data All your ideas
Data Driven Possibilities

Discover Data Driven Possibilities
Mischa van Werkhoven
Principal Solution Architect
@MischaDaniel
June 2016
Raise Your Expectations
#QlikSense

3
Key takeaways
• You can become data driven by connecting
─ all your people to
─ all your data and
─ all your ideas
• Qlik enables data driven possibilities through a unique approach
─ See the whole story that lives within your data
─ One platform for all visual analytics use cases
─ Right balance between governance and agility


One simple belief…
The more that people use analytics, the more value people get from analytics.
Business Intelligence is only optimized when you harness the collective human
intelligence across an organization.
This accelerates organizations towards their goal of being more agile, more data
driven, to uncover and take advantage of new possibilities.

6
“Without data you're
just another person
with an opinion”

Three fundamental forces
An explosion of
data and content
An explosion in
computing power
A rise of the
information activist

IT
Volume Variety
Changes our relationship with BI
External Data
Data
Centricity
Analysis-Centric
Analytic
Centricity
Business & Personal
Buyer
Centricity
Analytic Platforms
Developer Centricity

All your people All your data All your ideas
Possible only when you connect…

10
What it means to be data-driven
Reach the un-
empowered 75%
Agile decision
making
At the point of
decision
All your people

11
What it means to be data-driven
Data is an asset Beyond the
enterprise
Embrace
governance
All your data

12
What it means to be data-driven
Experiment and fail
fast
Ask any, and the
next question
Data-driven business
models
All your ideas
13
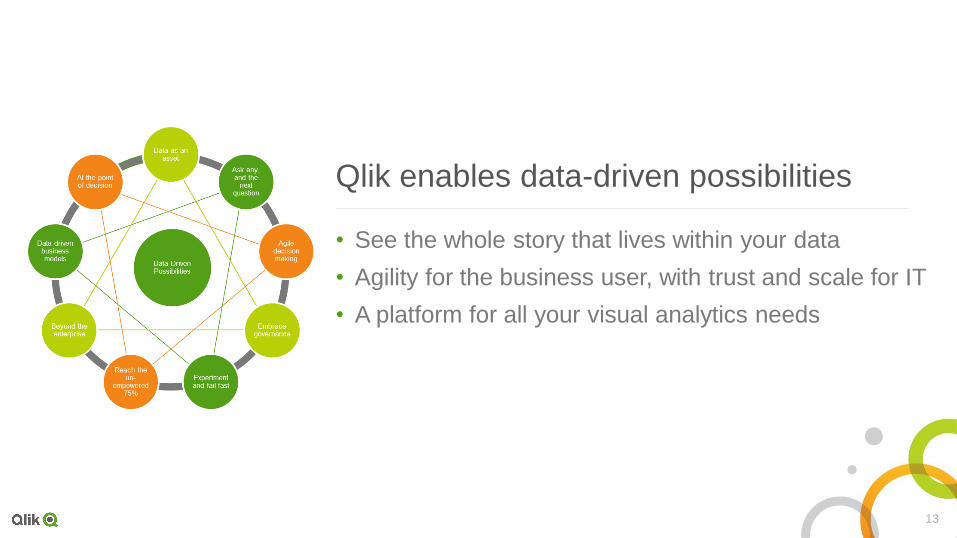
• See the whole story that lives within your data
• Agility for the business user, with trust and scale for IT
• A platform for all your visual analytics needs
Qlik enables data-driven possibilities

See the whole story that lives
within your data with assocations


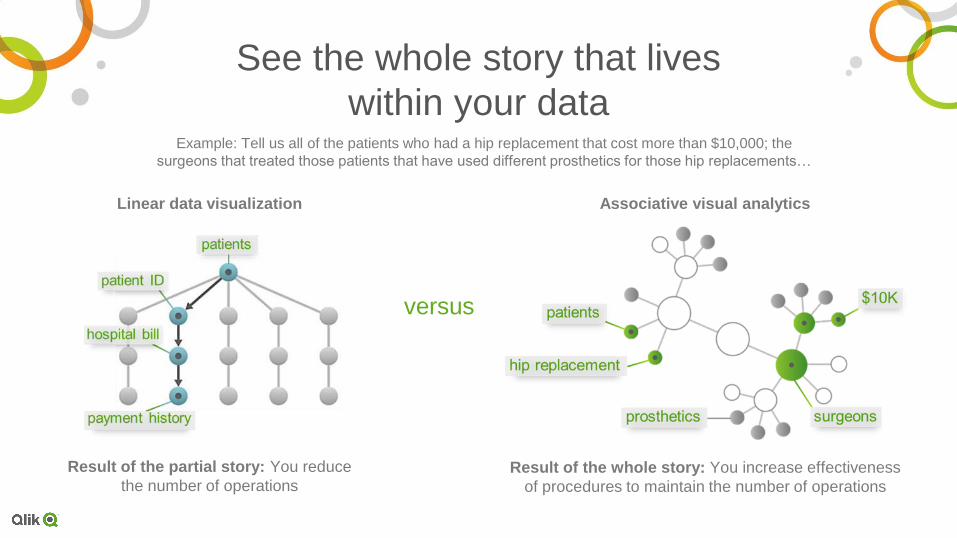
See the whole story that lives
within your data Example: Tell us all of the patients who had a hip replacement that cost more than $10,000; the
surgeons that treated those patients that have used different prosthetics for those hip replacements…
versus
Associative visual analytics Linear data visualization
Result of the partial story: You reduce
the number of operations Result of the whole story: You increase effectiveness
of procedures to maintain the number of operations

See the whole story that lives
within your data

Associative Model: Green, White & Grey

Agility for the business user,
with trust and scale for IT
Traditional
Business Intelligence Spreadsheets Data Discovery
• Total control
• IT-driven
• Limited resources
• Long delivery times
• High quality data
• Maximal flexibility
• Self service
• Many users
• Fast results
• Data quality risk

21
Re-usability Security &
Control Manageability Performance &
Scale
Multiple Data Sources
Governance drives empowerment and ensures you leave no
data behind
Agility for the business user,
with trust and scale for IT
22
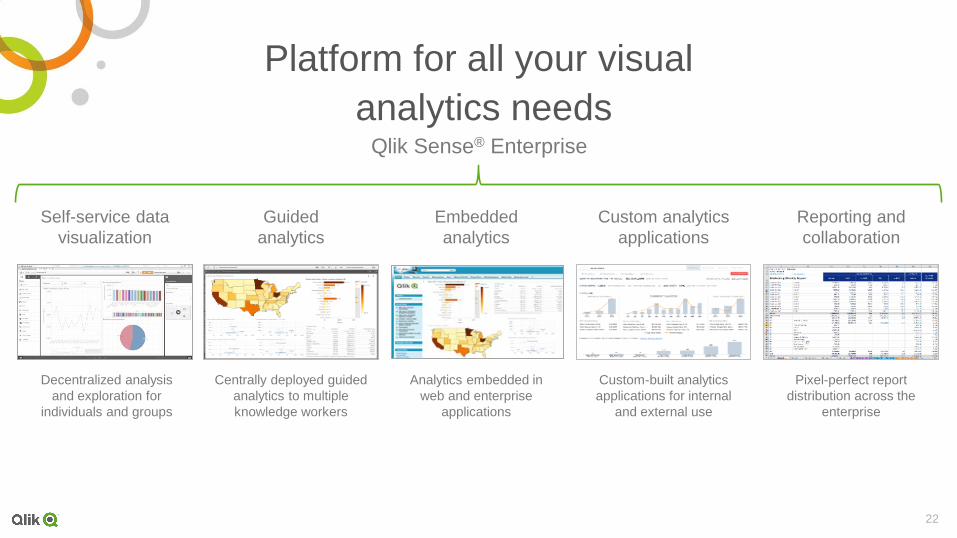
Platform for all your visual
analytics needs
Embedded
analytics
Custom analytics
applications
Self-service data
visualization
Qlik Sense® Enterprise
Guided
analytics
Reporting and
collaboration
Decentralized analysis
and exploration for
individuals and groups
Centrally deployed guided
analytics to multiple
knowledge workers
Analytics embedded in
web and enterprise
applications
Custom-built analytics
applications for internal
and external use
Pixel-perfect report
distribution across the
enterprise


24
Qlik Sense demo
1. Manager Eric presents his insights during the monthly sales performance review and
discovers which spoilage of goods impacts margin
2. Sales Manager Katy wants to know who her best performing sales reps are
3. Sales Operations Specialist John is asked to analyze the performance of Dutch stores based
on quantity, amount and margin
4. Marketing Intelligence Analyst Kelly combines data sources to find markets for expansion
5. One of our suppliers logs in to the extranet distributor portal and is provided with custom
made analytics
6. Mischa easily shares insights about today’s attendees on social media
7. Qlik Sense is an extensible platform based on open standards

1. Manager Eric presents his
insights during the monthly sales
performance review and discovers
which spoilage of goods impacts
margin
#QlikSense

Emailing PDF reports is a way of
static push reporting we all know…

…information sharing and collaboration
using interactive data storytelling is much effective

2. Sales Manager Katy wants to
know who her best performing sales
reps are
#QlikSense
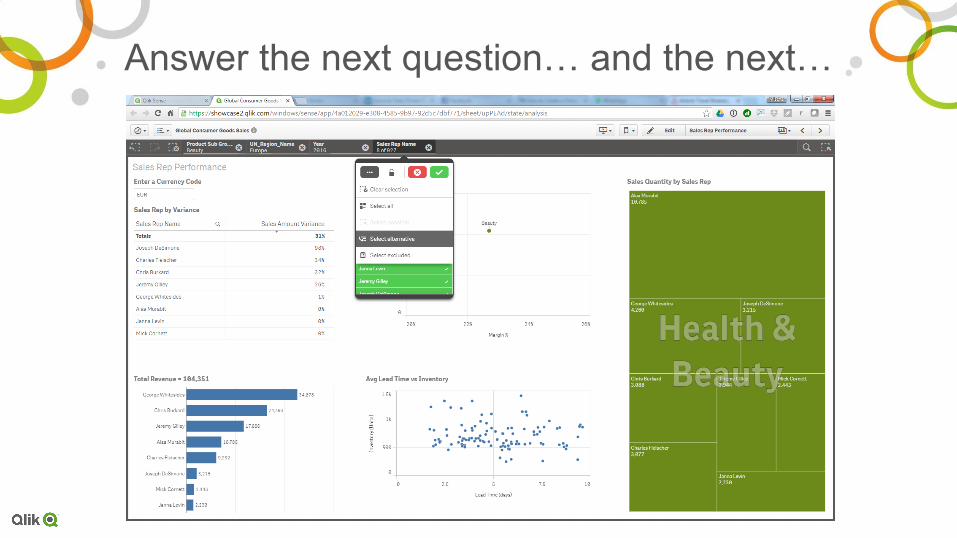
Answer the next question… and the next…

3. Sales Operations Specialist John
is asked to analyze the performance
of Dutch stores based on quantity,
amount and margin
#QlikSense

Build on existing elements and
easily share new insights with others

Governed Self-service library

4. Marketing Intelligence Analyst
Kelly combines multiple data
sources to find markets for
expansion
#QlikSense

Load data from all sources, in- and external,
on- and off-premise and leverage Qlik DataMarket
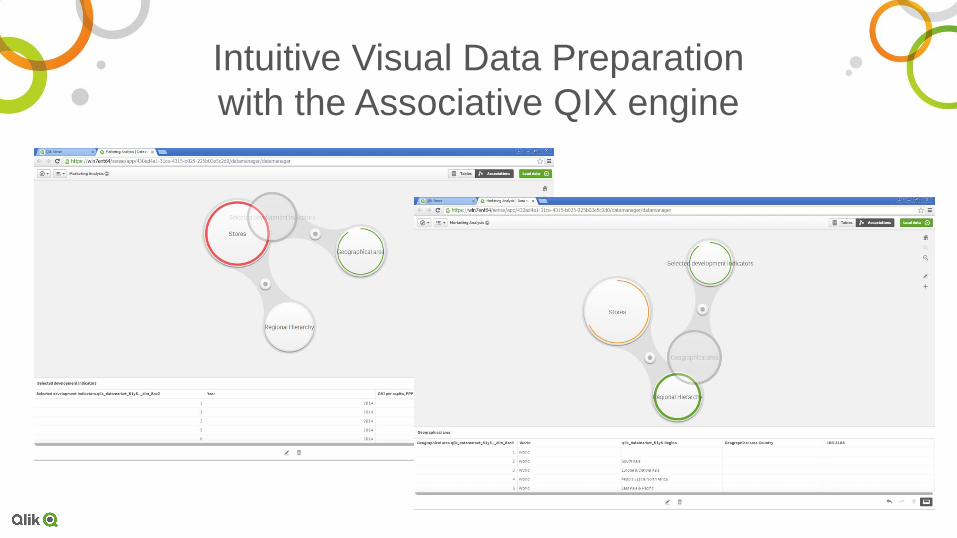
Intuitive Visual Data Preparation
with the Associative QIX engine

5. One of our suppliers logs in to the
extranet distributor portal and is
provided with custom made analytics
to analyze margin
#QlikSense
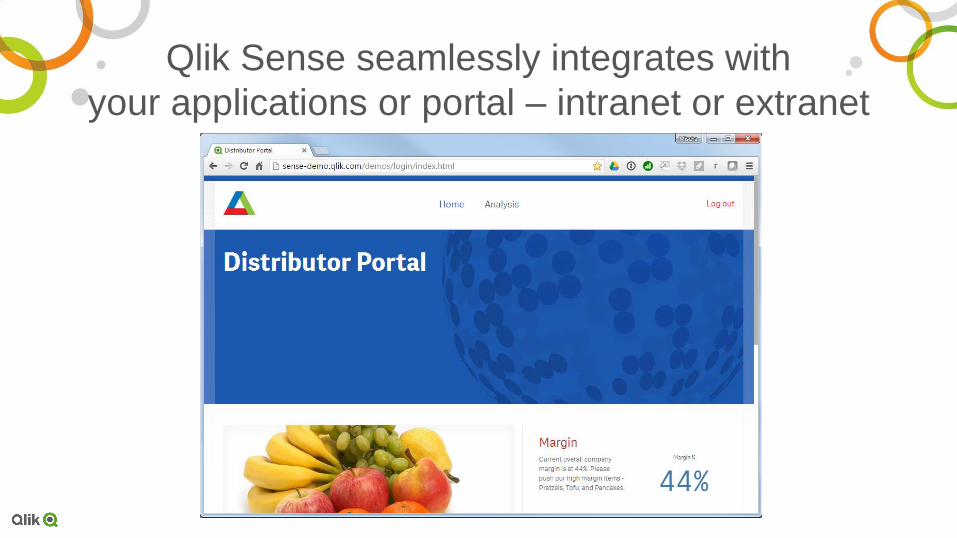
Qlik Sense seamlessly integrates with
your applications or portal – intranet or extranet

Associative engine delivers
complete dynamic interaction with your data

Mischa easily shares insights
about today’s attendees on social media
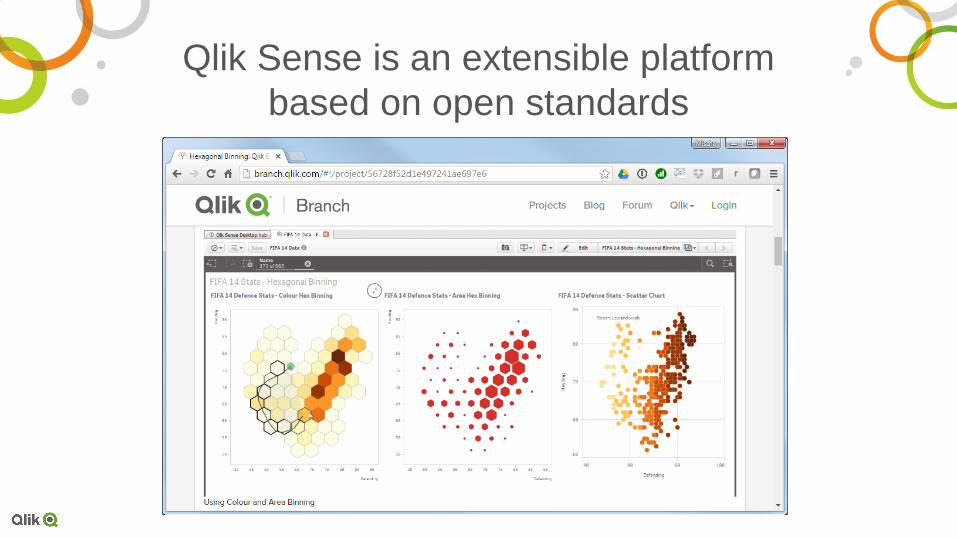
Qlik Sense is an extensible platform
based on open standards

What’s exciting in Qlik Sense 3.0
#QlikSense

What’s new – Qlik Products
This presentation and Qlik‘s strategy and possible future developments are subject to change and may be changed by Qlik at any time for any reason without notice. This document is provided
without a warranty of any kind, either express or implied, including but not limited to, the implied warranties of merchantability, fitness for a particular purpose, or non-infringement.
Qlik Sense®
Enterprise 3.0
Visual data
preparation and
search
Expanded platform
capabilities
June 2016
Qlik®
NPrinting 17.1
Next-generation
reporting and
distribution
QlikView and
Qlik Sense
June 2016
Qlik®
Connectors
Unified package of all
connectors
20+ new connectors
for web sources
based on QVSource
June 2016
Qlik® Sense
Cloud Business
Group level
management and
collaboration
Direct data
connectivity
2H 2016
Qlik®
DataMarket
New stock indices
and company
financials packages
Expanded detail in
essentials package
2H 2016

43
Key takeaways
• You can become data driven by connecting
─ all your people to
─ all your data and
─ all your ideas
• Qlik enables data driven possibilities through a unique approach
─ See the whole story that lives within your data
─ One platform for all visual analytics use cases
─ Right balance between governance and agility

44
Community ...because no one wants to be alone
https://community.qlik.com
http://branch.qlik.com/
https://www.youtube.com/user/qlikview
http://help.qlik.com/en-US/#

experience it for yourself
Create an app
qlik.com/download
Share an app
qlikcloud.com
Try an app
sense-demo.qlik.com
Test your skills
qlik.com/us/services/training/skills-assessment
Participate, Discuss & Learn
community.qlik.com

46
“If we have data,
let’s look data.
If all we have are opinions,
let’s go with mine.”

Let’s Have
Coffee
#QlikSense