data collection survey on coal power master plan follow-up...
TRANSCRIPT

SAD
JR
12-013
People’s Republic of Bangladesh
Ministry of Power, Energy and Mineral Resources
Data Collection Survey on
Coal Power Master Plan Follow-up
in the People’s Republic of Bangladesh
FINAL REPORT
March 2012
Japan International Cooperation Agency
Tokyo Electric Power Company

Data Collection Survey on Coal Power Master Plan Follow-up in the People’s Republic of Bangladesh
i
CONTENTS
Chapter1 Introduction ...................................................................................................................... 1-1
1.1 Background of the Survey ................................................................................................ 1-1
1.1.1 General Information of Bangladesh ................................................................................ 1-1
1.1.2 Industry and Economic Trends in the Bangladesh ........................................................ 1-1
1.2 Objectives of the Survey ................................................................................................... 1-2
1.2.1 Basic Work Flow ............................................................................................................... 1-2
1.3 Implementation Structure for the Survey ....................................................................... 1-4
1.3.1 Counterpart Organization ............................................................................................... 1-4
1.3.2 Experts and Respective Area of the Survey .................................................................... 1-4
1.4 Schedule of the Survey ...................................................................................................... 1-4
1.5 Contents of the Survey ...................................................................................................... 1-5
Chapter2 Follow-up Survey to the PSMP2010 ................................................................................ 2-1
2.1 Background of the PSMP2010 ......................................................................................... 2-1
2.2 Recommendation of the PSMP2010 ................................................................................ 2-1
2.3 Issues to Realize the PSMP2010 ...................................................................................... 2-4
2.4 Current Situation of Power Sector in Bangladesh ......................................................... 2-4
2.4.1 Current Situation of Power Sector and Energy Sector in Development 5-year
Plans ................................................................................................................................... 2-4
2.4.2 Current Situation of Power Sector in Bangladesh ......................................................... 2-8
2.5 Coal Policy ......................................................................................................................... 2-9
Chapter3 The Latest Issues Regarding Coal-fired Power Development in Bangladesh .............. 3-1
3.1 Current Situation of Study in Bangladesh after PSMP2010 ......................................... 3-1
3.2 Study Status Regarding Coal-fired Power Development ............................................... 3-3
3.2.1 Status of Domestic Coal-fired Power Development ........................................................ 3-3
3.2.2 Status of Imported Coal-fired Power Development ....................................................... 3-3
3.2.3 Current Status of Khulna Site .......................................................................................... 3-5
3.2.4 Current Status of Chittagong (Anwara) Site ................................................................ 3-14
3.2.5 Current Status of Maheskhali Site ................................................................................ 3-17
3.3 Review of Organization Structure for Continuous Coal-fired Power Development . 3-21
3.3.1 Structure Reform of MoPEMR ..................................................................................... 3-21

Data Collection Survey on Coal Power Master Plan Follow-up in the People’s Republic of Bangladesh
ii
3.3.2 Institute and Organizations of Power Generation, Transmission and Distribution
Business ............................................................................................................................ 3-22
3.3.3 Roles and Organization of Coal Power Generation Company (CPGC) .................... 3-23
3.3.4 Current Situation on the Establishment of Import Coal-fired Power Generation in
Khulna and Chittagong .................................................................................................. 3-27
Chapter4 Review and Comparison of the Prioritized Sites ............................................................ 4-1
4.1 Determination of the Prioritized Sites ............................................................................. 4-1
4.2 Work Flow for Site Comparison on the Prioritized Sites .............................................. 4-1
4.2.1 Work Flow for Site Screening .......................................................................................... 4-1
4.2.2 Comparison Item .............................................................................................................. 4-2
4.2.3 Sites for Comparison ........................................................................................................ 4-2
4.3 Result of Site Comparison ................................................................................................ 4-3
4.3.1 Site Survey ......................................................................................................................... 4-3
4.3.2 Evaluation Result for Each Items .................................................................................... 4-4
4.3.3 Evaluation Result for Each Item ..................................................................................... 4-6
4.3.4 Summary of Comprehensive Evaluation ...................................................................... 4-13
4.4 Result of Site Survey for the Prioritized Site ................................................................ 4-13
4.4.1 Schedule of the Site Survey ............................................................................................ 4-13
4.4.2 Contents of the Survey .................................................................................................... 4-15
Chapter5 Review of Port Planning ................................................................................................... 5-1
5.1 Coal Transportation System ............................................................................................. 5-1
5.1.1 General Description of Coal Center System ................................................................... 5-1
5.1.2 Required Capacity of Coal Storage ................................................................................. 5-2
5.1.3 Coal Transportation System at Imported Coal-fired Power Stations........................... 5-4
5.2 Coal Transportation Vessels ............................................................................................. 5-6
5.2.1 Types of Coal Transportation Vessels .............................................................................. 5-6
5.2.2 Required Number of Vessels based on Coal Consumption ............................................ 5-7
5.2.3 Number of Berths for Coal Vessels in the Prioritized Projects ..................................... 5-8
5.2.4 Wave Conditions of the Bay of Bengal .......................................................................... 5-10
5.3 Development Planning on Port Facilities ...................................................................... 5-14
5.3.1 Condition Setting ............................................................................................................ 5-14
5.3.2 General Comparison Study on Port Layout between Chittagong-South and
Maheskhali ...................................................................................................................... 5-17
Data Collection Survey on Coal Power Master Plan Follow-up in the People’s Republic of Bangladesh
iii
5.3.3 Determination of the Candidate Power Station Site in Maheskhali ........................... 5-22
5.3.4 Issues to be Addressed in F/S of Matarbari and North Maheskhali ........................... 5-28
5.4 Operating and Maintenance System of Port Facilities ................................................ 5-29
5.4.1 Operation Structure of Port Facilities ........................................................................... 5-29
5.4.2 Effects of Wave Condition on Navigation ..................................................................... 5-30
5.4.3 Outline of Dredging for Maintaining the Chittagong Port .......................................... 5-30
Chapter6 Review on Coal Procurement of the Prioritized Sites .................................................... 6-1
6.1 Current Status and Issues of Imported Coal .................................................................. 6-1
6.1.1 About Coal ......................................................................................................................... 6-1
6.1.2 Demand and Supply Situation of Imported Coal in the International Market ........... 6-2
6.1.3 Trends in Coal Prices of Steam Coal ............................................................................. 6-20
6.1.4 The Forecast of Total Amount of Imported Coal Price ............................................... 6-23
6.1.5 Coal Import Strategy in Bangladesh ............................................................................. 6-29
6.1.6 Coal Transport System ................................................................................................... 6-30
Chapter7 Power Network System Plan ............................................................................................ 7-1
7.1 Purposes of Power Network System Plan ....................................................................... 7-1
7.2 The Follow-up Situations of Power Transmission Plan of PSMP 2010 ........................ 7-1
7.3 Specific Individual Candidates of the Projects and Their Related Transmission
Lines ................................................................................................................................... 7-2
7.3.1 Specific Individual Candidates of the Projects ............................................................... 7-2
7.3.2 Planned Transmission Lines ............................................................................................. 7-2
7.4 Confirmation of Basic Presumption for Examining the Specific Individual Project .. 7-4
7.5 Confirmation of Adequacy of the Scale and the Specifications of Transmission
Lines ................................................................................................................................... 7-6
Chapter8 Schedule and Cost of the Prioritized Projects ................................................................ 8-1
8.1 Schedule of the Prioritized Project .................................................................................. 8-1
8.2 Cost of the Prioritized Project ......................................................................................... 8-1
Chapter9 Review on Implementation Framework of the Prioritized projects ............................. 9-1
9.1 History of the Power Sector Reform ............................................................................... 9-1
9.2 Increasing Efficiency through Power Sector Reform .................................................... 9-2
9.2.1 Current Status of the Corporatization (2009-2011) ....................................................... 9-2
9.2.2 Evaluation of the Corporatization of Power Division (as of February 2012) .............. 9-2
Data Collection Survey on Coal Power Master Plan Follow-up in the People’s Republic of Bangladesh
iv
9.2.3 Roles of BERC (as of February 2012)........................................................................... 9-4
9.2.4 Evaluation of the Effectiveness of DESCO Corporatization
(as of February 2012) ..................................................................................................... 9-5
9.2.5 Evaluation of Effectiveness of NWPGCL Corporatization (as of January 2012) ..... 9-6
9.3 Support to Coal-fired Power Development from Other Development Partners ......... 9-6
9.3.1 Current Status of International development agencies’ support to power sector
reform and coal-fired power development ...................................................................... 9-6
9.4 Key Considerations for Power Sector Reforms in the Future ....................................... 9-8
9.4.1 Balancing between Power Tariff and Natural Gas Price ............................................... 9-8
9.4.2 Fuel Procurement in the Power Sector ............................................................................ 9-9
9.4.3 Distribution Companies in Urban and Rural Area ........................................................ 9-9
9.4.4 Introduction of Incentives to Corporatized Companies ................................................ 9-9
9.4.5 IPP Participation by Promoting Privatization .............................................................. 9-10
9.4.6 Independence of CPGC .................................................................................................. 9-10
9.5 Recommendations on the Implementation of Coal-fired Power Generation ............. 9-11
9.5.1 Organizational Setup for Operating a Coal-fired Power Generation Company ....... 9-11
Chapter10 Economic Financial Analysis.......................................................................................... 10-1
10.1 Capital Fund-raising for the Coal-fired Power Generation Project ........................... 10-1
10.2 Taxation, Duties and Tax Privileges ............................................................................... 10-1
10.2.1 Taxation and duties in Bangladesh ................................................................................ 10-1
10.2.2 Tax Privileges for Electric Power Industry ................................................................... 10-2
10.3 Methodology and Assumptions of Financial analysis .................................................. 10-3
10.3.1 Methodology of Financial Analysis Calculation ........................................................... 10-3
10.3.2 Fund Raising and Interest rate ...................................................................................... 10-5
10.3.3 Parameters for Financial Analysis ................................................................................. 10-7
10.4 Results of the Financial Analysis ................................................................................. 10-10
10.4.1 Generation Unit Cost and Tariff .................................................................................. 10-10
10.4.2 ROE and FIRR .............................................................................................................. 10-12
10.4.3 Testing the Possibility of Cash Shortage ..................................................................... 10-12
10.4.4 Dividend Yield ............................................................................................................... 10-12
10.4.5 Comparison between Ultra Supercritical (USC) and Supercritical Power (SCP)
Cases ............................................................................................................................... 10-13
Chapter11 Environment and Social Consideration ........................................................................ 11-1

Data Collection Survey on Coal Power Master Plan Follow-up in the People’s Republic of Bangladesh
v
11.1 EIA System of Bangladesh ............................................................................................. 11-1
11.2 Environmental Status around the Priority Project Site ............................................... 11-2
11.2.1 Natural Environment ...................................................................................................... 11-2
11.2.2 Social Environment ......................................................................................................... 11-8
11.3 Environmental Issues and Draft TOR of EIA .............................................................. 11-9
11.3.1 Environmental Issues ...................................................................................................... 11-9
11.3.2 Draft TOR of EIA ......................................................................................................... 11-12
11.4 Estimation of GHG Reduction ..................................................................................... 11-13

Data Collection Survey on Coal Power Master Plan Follow-up in the People’s Republic of Bangladesh
vi
List of Figures
Figure 2-1 Image of Deep-sea Port Development by Multi-sector .................................... 2-2
Figure 2-2 Vision Proposed in PSMP2010 ........................................................................ 2-3
Figure 2-3 Annual Load Shedding/Restriction [MW] ....................................................... 2-9
Figure 3-1 Location Map of the Candidate Sites for Coal-fired Power Station in
PSMP2010 ........................................................................................................ 3-2
Figure 3-2 Location Map of Khulna Site ........................................................................... 3-5
Figure 3-3 Picture of Khulna Site from the Air ................................................................. 3-6
Figure 3-4 Location Map of Khulna Site ........................................................................... 3-6
Figure 3-5 Current Map of Project Area of Khulna Site .................................................... 3-7
Figure 3-6 Layout of Main Equipment for Khulna Power Station..................................... 3-9
Figure 3-7 Transport Route of Coal from Bay of Bengal to Mongla Port ....................... 3-11
Figure 3-8 Transport Route from Mongla Port to Khulna Power Station ........................ 3-12
Figure 3-9 Access Road to Khulna Power Station ........................................................... 3-13
Figure 3-10 Location Map of Chittagong Site ................................................................... 3-14
Figure 3-11 Location Map of Chittagong Power Station ................................................... 3-15
Figure 3-12 Boundary of Chittagong Site .......................................................................... 3-16
Figure 3-13 Location Map of Maheskhali Site .................................................................. 3-18
Figure 3-14 Facility Location Map of Maheskhali Power Station ..................................... 3-20
Figure 3-15 New Organization Structure of Power Division of MoPEMR ....................... 3-21
Figure 3-16 New Organization Structure of Planning Section of Power Division of
MoPEMR ....................................................................................................... 3-22
Figure 3-17 Organization Structure of Generation, Transmission and Distribution
Business ......................................................................................................... 3-23
Figure 3-18 Organization Structure of Coal Power Generation Company ........................ 3-24
Figure 3-19 Khulna Coal Power Generation Project and the Related ................................ 3-27
Figure 4-1 Work Flow for Site Screening .......................................................................... 4-1
Figure 4-2 Location of the Sites ......................................................................................... 4-3
Figure 4-3 Course of Site Survey ....................................................................................... 4-4
Figure 4-4 Difference in Cycle by Steam Temperature and Pressure Conditions
(Schematic Diagram) ....................................................................................... 4-5
Figure 4-5 Development of Coal-fired Power Generation Technology ............................. 4-6
Figure 4-6 Example of Long Jetty (Kamiiso Factory, Taiheiyo Cement) .......................... 4-8

Data Collection Survey on Coal Power Master Plan Follow-up in the People’s Republic of Bangladesh
vii
Figure 4-7 Image of Direct Quay ....................................................................................... 4-9
Figure 4-8 Route of Site Survey (Sea Side) ..................................................................... 4-14
Figure 4-9 Route of Site Survey (Land Side) ................................................................... 4-14
Figure 4-10 Plan Being Studied by GOB ........................................................................... 4-15
Figure 4-11 Site Location Studied by the Survey team ..................................................... 4-16
Figure 4-12 Sites for Comparison ...................................................................................... 4-16
Figure 4-13 Basic Plan for Maheskhali .............................................................................. 4-18
Figure 4-14 Basic Design (Plane View) ............................................................................. 4-19
Figure 4-15 Basic Design (Cross-Section) ......................................................................... 4-19
Figure 4-16 Aerial Photo around North Maheskhali .......................................................... 4-20
Figure 4-17 Complete Image for the Planned Coal-fired Power Station (600MWx2) ...... 4-20
Figure 4-18 Future Image .................................................................................................. 4-21
Figure 4-19 Development Plan of Matarbari Island ........................................................... 4-22
Figure 4-20 Aerial Photo around Matarbari ....................................................................... 4-22
Figure 5-1 Summary of Coal Center System ..................................................................... 5-1
Figure 5-2 Basic Concept of Coal Transportation System ................................................. 5-5
Figure 5-3 Location of Wave Prediction .......................................................................... 5-10
Figure 5-4 Annual Probability of Significant Wave Height and Period .......................... 5-11
Figure 5-5 Monthly Probability of Significant Wave Height (1) ..................................... 5-12
Figure 5-6 Monthly Probability of Significant Wave Height (2) ..................................... 5-13
Figure 5-7 Basic Layout of the Port Facilities ................................................................. 5-16
Figure 5-8 Layout Plan of the Chittagong-South Port ..................................................... 5-18
Figure 5-9 Layout Plan of the Matarbari and Maheskhali Port ........................................ 5-20
Figure 5-10 Selected Candidate Power Station Site ........................................................... 5-22
Figure 5-11 Port Layout Plan in Matarbari ........................................................................ 5-24
Figure 5-12 Port Layout Plan in North Maheskhali ........................................................... 5-25
Figure 5-13 Port Layout Plan in South Maheskhali ........................................................... 5-26
Figure 6-1 Classification of Coal ....................................................................................... 6-1
Figure 6-2 World Coal Demand Forecast .......................................................................... 6-3
Figure 6-3 Global Coal Consumption ................................................................................ 6-5
Figure 6-4 Forecast of Indonesian Coal Production, Export, Domestic Sales 2005-2025 . 6-7
Figure 6-5 Total Export Volume of Indonesian Steam Coal,
Non OECD-country Comparison of OECD Countries..................................... 6-9

Data Collection Survey on Coal Power Master Plan Follow-up in the People’s Republic of Bangladesh
viii
Figure 6-6 Breakdown of Indonesian Steam Coal Exporting Countries to Increase
Non-OECD Countries over the Past Five Years ............................................ 6-10
Figure 6-7 Forecast of Coal Production and Export in Indonesia .................................... 6-10
Figure 6-8 Australian Coal Export Volume ..................................................................... 6-12
Figure 6-9 Comparison of Exports of Non-OECD Countries and OECD Countries in
Total Exports of Australian Steam Coal ......................................................... 6-12
Figure 6-10 Breakdown of Australian Steam Coal Exporting Countries has Increased
over the Past Five Years in Non-OECD Countries ........................................ 6-13
Figure 6-11 Export Countries for Australian Coal ............................................................. 6-13
Figure 6-12 Railways in QLD ............................................................................................ 6-15
Figure 6-13 Comparison of Exports of Non-OECD Countries and OECD Countries in
Total Exports of South African Steam Coal ................................................... 6-18
Figure 6-14 Breakdown of South African Steam Coal Exporting Countries has Increased
over the Past Five Years in Non-OECD Countries ........................................ 6-18
Figure 6-15 Australian Spot Price Index and Prices of Term Contracts ............................ 6-21
Figure 6-16 CIF unit price of imported fuel in Japan ........................................................ 6-21
Figure 6-17 FOB Price Fluctuations in the Calorific Value per Each Indonesian Coal ..... 6-22
Figure 6-18 Price Fluctuations of 1,000 kcal / kg Calorific Value per Each Indonesian
Coal ................................................................................................................ 6-22
Figure 6-19 Price Fluctuations of 1,000 kcal / kg of FOB Newcastle, Australia and
FOB Indonesian Coal ..................................................................................... 6-23
Figure 6-20 FOB Price Fluctuations and Correlation Curve per 1,000 kcal / kg
at Port of Newcastle in Australia .................................................................... 6-24
Figure 6-21 Ccorrelation Curve Excluded the Data of Jan. to Oct. 2008 in Figure 6-20 ... 6-24
Figure 6-22 Eestimation of the High Case and Base Case of FOB Prices until 2030 Based
on FOB Unit Price of Coal per 1,000 kcal / kg at Port of Newcastle ............. 6-25
Figure 6-23 Actual Use of Low-grade Coal at Coal-fired Power Stations
in South Korea ................................................................................................ 6-25
Figure 6-24 Comparison of Predicted FOB Price and FOB Price of Coal in Indonesia
5,000 kcal / kg ................................................................................................ 6-27
Figure 6-25 Freight Market ................................................................................................ 6-32
Figure 7-1 Current Plan of 400 kV and 230 kV Transmission Lines from Dhaka
to Chittagong in 2020 ....................................................................................... 7-1

Data Collection Survey on Coal Power Master Plan Follow-up in the People’s Republic of Bangladesh
ix
Figure 7-2 Locations of Chittagong Power Station, Chittagong-South Power Station and
Maheskhali Power Station ................................................................................ 7-3
Figure 7-3 Transmission Lines from Chittagong-South Power Station and Maheskhali
Power Station to Anwara Substation ................................................................ 7-3
Figure 7-4 Power Flow at Peak Load Time in Case of Installation of 600 MW 2 Units
in Chittagong and 600 MW 1 Unit in Maheskhali in 2020 (Case A) ............ 7-8
Figure 7-5 Stability Swing Curve after 3LGO at 400 kV Anwara- Meghnaghat and Power
Flow at Light Load Time in Case of Installation of 600 MW 2 units in
Chittagong and 600 MW 1 unit in Maheskhali in 2020 (Case A) ................. 7-9
Figure 7-6 Power Flow at Peak Load Time in Case of installation of 600 MW 2 units
in Chittagong and 600 MW 2 unit in Maheskhali in 2020 (Case B) ........... 7-10
Figure 7-7 Stability Swing Curve after 3LGO at 400 kV Anwara- Meghnaghat and Power
Flow at Light Load Time in Case of Installation of 600 MW 2 units in
Chittagong and 600 MW 2 unit in Maheskhali in 2020 (Case B) ............... 7-11
Figure 7-8 400 kV Double Circuit Transmission Line between Anwara–Meghnaghat ... 7-13
Figure 7-9 System Configuration in Option I (400 kV Power Transmission) ................. 7-15
Figure 7-10 System Configuration in Option II (400 kV Power Transmission) ................ 7-16
Figure 7-11 System Configuration around Maheskhali and Chittagong ............................ 7-17
Figure 8-1 Assumed Schedule of the Project ..................................................................... 8-1
Figure 9-1 Power and Money Flows from Power Generation to Consumption ............... 9-10
Figure 10-1 Generation Unit Cost and Tariff ................................................................... 10-11
Figure 11-1 General Flow for Obtaining LCC and ECC ................................................... 11-2
Figure 11-2 Area of Sonadia Island ECA (the dotted line is the boundary) ...................... 11-3
Figure 11-3 Location of National Park and Wildlife Sanctuary in Bangladesh ................. 11-5
Figure 11-4 Boundary of Reserve Forest in Maheskhali ................................................... 11-6
Figure 11-5 Locations of Areas where Threatened Bird Species were Identified ............. 11-8
Figure 11-6 Tentative Schedule of IEE/EIA .................................................................... 11-11

Data Collection Survey on Coal Power Master Plan Follow-up in the People’s Republic of Bangladesh
x
List of Tables
Table 1-1 GDP Growth Rate of Bangladesh ..................................................................... 1-2
Table 1-2 Candidate Sites for Imported coal-fired Power Station in the PSMP2010 ....... 1-3
Table 1-3 Candidate Sites Requested for Support from the Bangladesh .......................... 1-3
Table 1-4 Overall Schedule of the Survey ........................................................................ 1-5
Table 2-1 Goals for Power Sector in the 6th Development 5-year Plan ............................ 2-5
Table 3-1 Candidate Sites for Coal-fired Power Station in PSMP2010 ........................... 3-1
Table 3-2 Prioritized Sites for Coal-fired Power Station in PSMP2010 ........................... 3-1
Table 3-3 Candidate Sites Requested for Japanese Support to Review from
the Bangladesh ................................................................................................. 3-3
Table 3-4 Candidate Sites and Issues Studied by GOB .................................................... 3-4
Table 3-5 Specification of the Land under Acquisition Procedure ................................... 3-7
Table 3-6 Specification of Equipments for the Power Station in Khulna ......................... 3-8
Table 3-7 Coal Quality for Use in Khulna ...................................................................... 3-10
Table 3-8 Current Land Use of Chittagong Site ............................................................. 3-16
Table 3-9 Committee formation of site selection ........................................................... 3-17
Table 3-10 Port Facility Plan in Maheskhali Port ............................................................. 3-19
Table 3-11 Specification of Land Use in Maheskhali Site ............................................... 3-19
Table 3-12 Roles and Consideration of Power Division, BPDB and CPGC Regarding
the Project (as of February 2012) ................................................................... 3-26
Table 3-13 Imported Coal-fired Power Generation Investors (As of February 2012) ... 3-28
Table 4-1 Power Plant Design Specifications ................................................................... 4-4
Table 4-2 Comparison of Needs in Bangladesh ............................................................... 4-6
Table 4-3 Comparison of Port Facility ............................................................................. 4-8
Table 4-4 Cost Comparison .............................................................................................. 4-9
Table 4-5 Comparison of the Numbers of Shipment per Year ....................................... 4-10
Table 4-6 Comparison of the Major Environment and Social Influences ...................... 4-12
Table 4-7 Summary of Evaluation .................................................................................. 4-13
Table 4-8 Schedule of Maheskhali Site Survey .............................................................. 4-13
Table 4-9 Result of Site Comparison .............................................................................. 4-17
Table 5-1 Candidate Sites for Imported Coal-fired Power Stations in PSMP2010 .......... 5-3
Table 5-2 Required Amount of Coal Stock at Candidate Imported Coal-fired Power
Stations ............................................................................................................. 5-4

Data Collection Survey on Coal Power Master Plan Follow-up in the People’s Republic of Bangladesh
xi
Table 5-3 Dimensions of Coal Stockyards and Coal Centers in the Prioritized Projects . 5-6
Table 5-4 Principal Specification of the Representative Class of Coal Vessels ............... 5-7
Table 5-5 Estimated Number of Vessels Required for Receiving Coal ........................... 5-7
Table 5-6 Estimated Number of Vessels Required for Shipping Coal to Power Stations 5-8
Table 5-7 Estimated Number of Berths for Receiving Coal ............................................. 5-9
Table 5-8 Estimated Number of Berth for Shipping Coal ................................................ 5-9
Table 5-9 Combined Frequency of Significant Wave Height and Period ...................... 5-11
Table 5-10 Specification of Power Stations ..................................................................... 5-14
Table 5-11 Parameters of the Intended Vessels ................................................................ 5-15
Table 5-12 Parameters of the Port Facilities ..................................................................... 5-15
Table 5-13 Comparison Result between Chittagong-South, Matarbari and Maheskhali .. 5-21
Table 5-14 Construction Cost of Port Facilities (unit: Million USD) ............................... 5-27
Table 5-15 Comparison Result of the Candidate Sites ..................................................... 5-28
Table 5-16 Ranking of the Sea State (WMO3700) ........................................................... 5-30
Table 6-1 Proven Reserves of Coal in the World ............................................................. 6-2
Table 6-2 Coal Demand by Region and Scenario ............................................................. 6-4
Table 6-3 Global Coal Production .................................................................................... 6-4
Table 6-4 Countries with a Higher Export Volume of Coal ............................................. 6-5
Table 6-5 Top Coal Importers .......................................................................................... 6-5
Table 6-6 Indonesian Coal Production ............................................................................. 6-6
Table 6-7 Price Indices of November 2011 ...................................................................... 6-8
Table 6-8 Australian Coal Production ............................................................................ 6-11
Table 6-9 Position in the World of South African Coal Industry ................................... 6-17
Table 6-10 South African Coal Production ...................................................................... 6-17
Table 6-11 Current Coal Production Plans in Mozambique (million tonnes) .................. 6-19
Table 6-12 Long-term Coal Price Scenario for OECD Countries .................................... 6-23
Table 6-13 FOB Price of 5,100 kcal / kg .......................................................................... 6-26
Table 6-14 Total Amount of Imported coal (20,000DWT) .............................................. 6-28
Table 6-15 Total Amount of Imported Coal (80,000DWT) ............................................. 6-29
Table 6-16 Annual Coal Requirement for a 600MW Coal-fired Power Plant .................. 6-31
Table 7-1 Methodology of Power Transmission to Anwara Substation when
the Power Output is around 1,200 MW ............................................................ 7-2
Table 7-2 Power Generation Plan in 2020 located South of Hathazari ............................ 7-4

Data Collection Survey on Coal Power Master Plan Follow-up in the People’s Republic of Bangladesh
xii
Table 7-3 Peak Power Demand of 130 kV Substations in 2020 Supplied from
the System South of Hathazari ......................................................................... 7-5
Table 7-4 Impedance and Capacities of Transmission Lines ........................................... 7-5
Table 7-5 Power Flow Passing the Border between North and South of Hathazari ......... 7-6
Table 7-6 Incremental Cost of Transmission Lines when 400 kV Power
Transmission System Applied for Operation of 600 MW 2 Units
(Excluding Preplanned 400 kV Double Circuits Transmission Lines) ............ 7-7
Table 7-7 Peak Power Demand of 130 kV Substations in 2020 Supplied from
the System South of Hathazari ....................................................................... 7-12
Table 7-8 Power Generation Plan in 2030 Located South of Hathazari
(excluding Maheskhali) .................................................................................. 7-13
Table 7-9 Line Parameters of 765 kV Transmission Line (100MVA Base, Unit:pu) .... 7-14
Table 7-10 Construction Cost of 765 kV Transmission Lines ......................................... 7-14
Table 8-1 Fiscal Expansion of Required Cost for Matarbari ............................................ 8-2
Table 8-2 Fiscal Expansion of Required Cost for Maheskhali ......................................... 8-2
Table 9-1 Corporatization and SBU(As of 2009) .......................................................... 9-1
Table 9-2 Power Tariffs (33kV) of the Distribution Companies (as of February 2012) .. 9-9
Table 10-1 Procedures for Import Tax in Bangladesh (as Example) ................................ 10-1
Table 10-2 Taxation, Duties and Tax Privileges Related to Power Industry .................... 10-2
Table 10-3 Cost Calculation and Profit-loss Formulation ................................................ 10-3
Table 10-4 Calculation of Outstanding Balance and Book Values .................................. 10-4
Table 10-5 Components of Cash Sources and Use ........................................................... 10-4
Table 10-6 Evaluation Criteria of Performance Indicators for Financial Analysis .......... 10-4
Table 10-7 Benefits & Costs Ratio and Net Benefit Value .............................................. 10-5
Table 10-8 Benefits & Costs Ratio and Net Benefit Value .............................................. 10-7
Table 10-9 Calculation Methods for Discount Rates ........................................................ 10-7
Table 10-10 Economic Preconditions ................................................................................. 10-7
Table 10-11 Preconditions of Coal Prices .......................................................................... 10-8
Table 10-12 Cash Layout of Capital Investment and Tax Rates during the Construction . 10-8
Table 10-13 Cash out during Construction Period ............................................................. 10-9
Table 10-14 Investment and Equity Ratio ........................................................................ 10-10
Table 10-15 Operational Conditions of the Power Plants ................................................ 10-10
Table 10-16 Sensitive Analysis on Coal Price Fluctuation .............................................. 10-11
Table 10-17 ROE and FIRR by Coal Price ....................................................................... 10-12
Data Collection Survey on Coal Power Master Plan Follow-up in the People’s Republic of Bangladesh
xiii
Table 10-18 Cash Flow for the 10 Years after the Start of Operation .............................. 10-12
Table 10-19 Dividend Yield Rate ..................................................................................... 10-13
Table 10-20 Capital Expenditure of USC and SCP Cases ................................................ 10-13
Table 10-21 Coal Consumption of USC and SCP Systems .............................................. 10-13
Table 10-22 Cost Difference of Power Generation Plant and Coal Consumption ........... 10-14
Table 10-23 Difference of Tariff and Unit Cost ............................................................... 10-14
Table 10-24 Wholesale Tariffs and Average Power Generation Costs ............................ 10-14
Table 10-25 Gas Prices as of February 2012 (effective from August 2009) .................... 10-17
Table 10-26 Electric Tariff as of February 2012 (effective from 1st February 2012) ....... 10-17
Table 10-27 Average Bulk Supply Power Tariffs ............................................................ 10-17
Table 10-28 Retail Tariff of DESCO ................................................................................ 10-18
Table 10-29 DESCO Bulk Purchase Tariff ...................................................................... 10-18
Table 10-30 Domestic Coal Price for All Consumers ...................................................... 10-18
Table 10-31 Retail Prices of Fuel Oil and LPG ................................................................ 10-19
Table 11-1 List of National Parks and Wildlife Sanctuary in Bangladesh ....................... 11-4
Table 11-2 Threatened Bird Species Identified around Sonadia and
Maheskhali Islands ......................................................................................... 11-7
Table 11-3 Estimated CO2 Emission from USC and Sub critical Power Plants
(600MWx1, Operation Rate 85%) ............................................................. 11-14

Data Collection Survey on Coal Power Master Plan Follow-up in the People’s Republic of Bangladesh
xiv
Abbreviations
ABARE Australian Bureau of Agricultural and Resource Economics and Sciences
ADB Asian Development Bank
APSCL Ashuganj Power Station Company Ltd
ASEAN Association of Southeast Asian Nations
BERC Bangladesh Energy Regulatory Commission
B-K-D-P Barapukuria-Khalaspir-Dighipara-Phulbari
BOT Build Operate Transfer
BOOT Build Own Operate Transfer
BOO Build Own Operate
BP British Petroleum
BPC Bangladesh Petroleum Corporation
BPDB Bangladesh Power Development Board
BUET Bangladesh University of Engineering and Technology
C/P Counter Part
CEO Chief Executive Officer
CCPP Combined Cycle Power Plant
CFM Capital Fund Management
CIF Cost, Insurance and Freight
CNG Compressed Natural Gas
CPA Chittagong Port Authority
CPGC Coal Power Generation Company
CR Critically Endangered
DCR Discount Rate
DESA Dhaka Electric Supply Authority
DESCO Dhaka Electric Supply Company Ltd.
df Forward Draft
DMO Domestic Market Obligation
DOE Department of Environment
DOS Department of Shipping
DPDC Dhaka Power Distribution Company Ltd
DWT Dead Weight Tonnage
ECA Environmental Critical Area
ECC Environmental Clearance Certificate
EGCB Electricity Generation Company of Bangladesh
EIA Environmental Impact Assessment
EMP Environmental Management Plan
EN Endangered
ERD Economic Relations Division
FIRR Financial Internal Ratio of Return
FOB Free On Board
F/S Feasibility Study
FY Fiscal Year
GDP Gross Domestic Product

Data Collection Survey on Coal Power Master Plan Follow-up in the People’s Republic of Bangladesh
xv
GEF Global Environment Facility
GOB Government of Bangladesh
GT Gas Turbine
GTCL Gas Transmission Company Limited
GW Giga-watt
HDSA Historical Disadvanged South Africans
hr hour
IDA International Development Agency
IEA International Energy Agency
IEE Initial Environmental Examination
IMF International Financial Statistics
IOCs International Oil Companies
IPP Independent Power Producer
IUCN International Union for Conservation of Nature
JBIC Japan Bank for International Cooperation
JICA Japan International Cooperation Agency
JPY Japanese Yen
JV Joint Venture
kA kilo ampere
KAFCO Karnaphuli Fertilizer Company Limited
KfW Kreditanstalt fur Wiederaufbau
kg kilogram
kW kilo-watt
kWh kilo-watt hour
LCC Location Clearance Certificate
LHV Lower Heating Value
LNG Liquefied Natural Gas
Loa Length Overall
LLCR Long Life Coverage Ratio
Lpp Length between perpendicular
MM Million
mmcfd Million Cubic Feet per Day
MOE Ministry of Environment and Forestry Affairs
MOF Ministry of Finance
MOS Ministry of Shipping
MOU Memorandum of Understanding
MoPEMR Ministry of Power, Energy & Mineral Resources
M/P Master Plan
MPa Mega Pascal
MPA Mongla Port Authority
Mtce Million Ton of Coal Equivalent
MW mega-watt
MWh mega-watt hour
NBR National Board of Revenue
NGO Non-Governmental Organization
NOx Nitrogen oxide

Data Collection Survey on Coal Power Master Plan Follow-up in the People’s Republic of Bangladesh
xvi
NSW New South Wales
NTPC National Thermal Power Corporation
NWPGCL North-West Power Generation Company Ltd
NWZPDCL North West Zone Power Distribution Company Ltd.
O&M Operation & Maintenance
ODA Official Development Assistance
OECD Organization for Economic Co-operation and Development
PD Power Division
Petrobangla Bangladesh Oil, Gas and Mineral Corporation
PGCB Power Grid Company of Bangladesh
PGCL Pashchimanchal Gas Company Limited
PLN Perusahaan Listrik Negara
PPA Power Purchase Agreement
PPP Public Private Partnership
PSC Production Sharing Contract
PSMP Power System Master Plan
QLD Queensland
RAP Resettlement Action Plan
RBCT Richards Bay Coal Terminal
REB Rural Electrification Board
RMG Ready Made Garment
ROE Return on Equity
S/S Substation
SBU Strategic Business Unit
SOx Sulfur oxide
ST Steam Turbine
Tk Taka
TOR Terms of Reference
TSS Total Suspended Solid
UNDP United Nations Development Programme
UNO Upazila Nirbahi Officer
USD United States Dollar
USC Ultra Super Critical
VAT Value Added Tax
VU Vulnerable
WACC Weighted Average Capital Cost
WB World Bank
WMO World Meteorological Organization
WZPDCL West Zone Power Distribution Company Ltd
Data Collection Survey on Coal Power Master Plan Follow-up in the People’s Republic of Bangladesh
1-1
Chapter1 Introduction 1.1 Background of the Survey
1.1.1 General Information of Bangladesh
Bangladesh is located in the east of the Indian Subcontinent, and facing the Bay of Bengal. Most of the country is covered by the world’s largest delta, which was formed from three major rivers, the Ganges River (Padma in Bengali), the Brahmaputra River (Jamuna in Bengali), and the Meghna River and their branches, of which the source of the water is from the Himalaya Mountains. Most of the lands are flat lowlands less than nine meters above sea level. The soil in Bangladesh is fertilized by nutrients carried by flooding from the three major rivers, which contributes to the growth of major agricultural produce such as rice, jute and tea. Fishing and fishery farms at rivers and ponds across the country are thriving. On the other hand, heavy rain and river water inflow from upstream countries often causes widespread floods in the rainy season, covering around one third of the whole country at peak time, which causes considerable grief and damage to people in Bangladesh and the country. The worst flood in Bangladesh’s history occurred in 1998 and submerged two thirds of the country. The land area of Bangladesh is 144,000 square kilometers. The population in Bangladesh is regarded to be as much as 144.50 million1, thus the population density is very high, around 1,000 people per one square kilometer. The mean annual growth rate of the population is 1.39%, the same degree of India’s. The majority race comprising more than 98% of the Bangladesh population is Bengali, with some minority Buddhist groups, e.g. Chakuma and other ethnic groups living in Chittagong Hill Tracts near Myanmar border. Bangladesh is located near the Tropic of Cancer so that its climate is characterized by its tropical weather, i.e. high temperatures, high humidity and rainfall that varies from season to season. In the summer, high temperatures continue from March to June, the maximum temperature during the season is around 24 to 35 degrees Celsius, sometimes 40 degrees or above. The monsoon season is from June to October, the temperature falls due to rainfall. The winter season is from October to March, however the temperature is mild. The annual rainfall in Bangladesh is about 2,300 millimeters, and around 80% is concentrated from June to September. Along with the rainfall in Bangladesh, naturally, 80% of the river flow comes from the rainfall in other countries, such as India and Nepal, and domestic rainfall is attributed to only 20% of the total river flow. The flowing in a large amount of rainfall water from the upstream countries of major rivers causes flood damage in large areas of Bangladesh every year. Natural phenomena such as floods, cyclones, tornados and bores, hit Bangladesh almost every year, which causes not only primary damage but also secondary damage to the country such as deforestation, soil deterioration, land erosion, and so on.
1.1.2 Industry and Economic Trends in the Bangladesh
The country’s recent economic growth has been attributed to the increase of exports mainly led by the clothing industry, specifically ready-made garments (RMG) as a national main industry, as well as the high growth of the service industry as well as the manufacturing industry, the growth of which has been driven by the increase of overseas workers’ remittance.
1 tentative, July 2008, Bureau of Statistics in Bangladesh
Data Collection Survey on Coal Power Master Plan Follow-up in the People’s Republic of Bangladesh
1-2
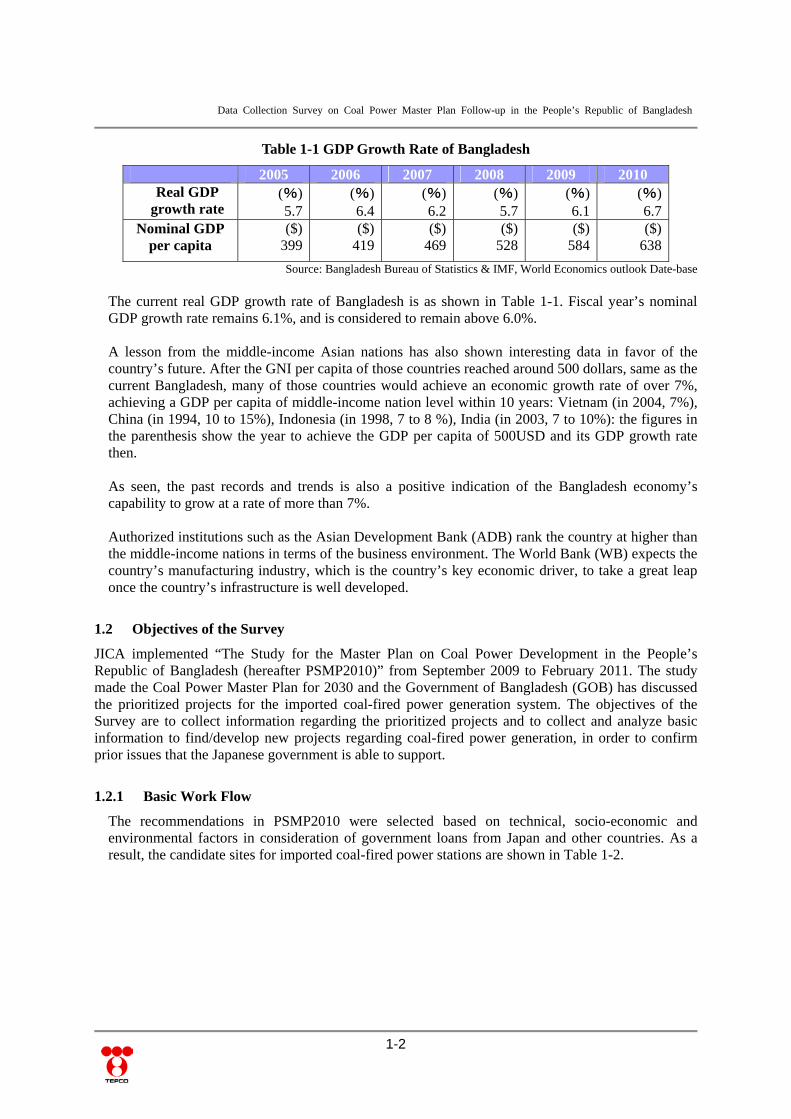
Table 1-1 GDP Growth Rate of Bangladesh
Source: Bangladesh Bureau of Statistics & IMF, World Economics outlook Date-base
The current real GDP growth rate of Bangladesh is as shown in Table 1-1. Fiscal year’s nominal GDP growth rate remains 6.1%, and is considered to remain above 6.0%. A lesson from the middle-income Asian nations has also shown interesting data in favor of the country’s future. After the GNI per capita of those countries reached around 500 dollars, same as the current Bangladesh, many of those countries would achieve an economic growth rate of over 7%, achieving a GDP per capita of middle-income nation level within 10 years: Vietnam (in 2004, 7%), China (in 1994, 10 to 15%), Indonesia (in 1998, 7 to 8 %), India (in 2003, 7 to 10%): the figures in the parenthesis show the year to achieve the GDP per capita of 500USD and its GDP growth rate then. As seen, the past records and trends is also a positive indication of the Bangladesh economy’s capability to grow at a rate of more than 7%. Authorized institutions such as the Asian Development Bank (ADB) rank the country at higher than the middle-income nations in terms of the business environment. The World Bank (WB) expects the country’s manufacturing industry, which is the country’s key economic driver, to take a great leap once the country’s infrastructure is well developed.
1.2 Objectives of the Survey
JICA implemented “The Study for the Master Plan on Coal Power Development in the People’s Republic of Bangladesh (hereafter PSMP2010)” from September 2009 to February 2011. The study made the Coal Power Master Plan for 2030 and the Government of Bangladesh (GOB) has discussed the prioritized projects for the imported coal-fired power generation system. The objectives of the Survey are to collect information regarding the prioritized projects and to collect and analyze basic information to find/develop new projects regarding coal-fired power generation, in order to confirm prior issues that the Japanese government is able to support.
1.2.1 Basic Work Flow
The recommendations in PSMP2010 were selected based on technical, socio-economic and environmental factors in consideration of government loans from Japan and other countries. As a result, the candidate sites for imported coal-fired power stations are shown in Table 1-2.
2005 2006 2007 2008 2009 2010 Real GDP
growth rate (%) 5.7
(%)6.4
(%)6.2
(%)5.7
(%) 6.1
(%)6.7
Nominal GDP per capita
($) 399
($)419
($)469
($)528
($) 584
($)638

Data Collection Survey on Coal Power Master Plan Follow-up in the People’s Republic of Bangladesh
1-3
Table 1-2 Candidate Sites for Imported coal-fired Power Station in the PSMP2010 Candidate site Specification Capacity
1 Khulna Import coal port operated already near the Mongla Port, selected as a site with a coal center
2×600MW
2 Chittagong Chittagong Port 2×600MW
3 Chittagong-South Import coal port, selected as a site with a coal center
1×600MW
4 Matarbari Import coal port, selected as a site with a coal center
4×600MW
5 Meghnaghat Burge transport From Chittagong Coal center 1×600MW 6 Mawa Burge transport From Chittagong Coal center 2×600MW
7 Zajira Burge transport From Chittagong Coal center Chittagong
1×600MW
Total 600MW × 13Units = 7,800MW
Source: by the Survey team, based on the Final Report of PSMP2010 Among the seven candidate sites, Bangladesh requested support from Japan for the three sites as shown in Table 1-3.
Table 1-3 Candidate Sites Requested for Support from the Bangladesh Candidate site Specification Capacity 2 Chittagong Chittagong Port 2×600MW
3 Chittagong-South Import coal port, selected as a site with a coal center 1×600MW
4 Matarbari Import coal port, selected as a site with a coal center 4×600MW
Total 600MW × 7Units = 4,200MW
Source: The Survey team In the Survey, a wide area of the coast in the eastern part of Bangladesh including the above three sites and the Maheskhali site where GOB is studying were compared and studied as a prioritized project (imported coal-fired power generation), and the Survey team collected the following information and review for future projects.
During the selection process, the screening of four sites was conducted with regard to the following concepts during discussion with stakeholders. After the screening, the Survey team conducted a site survey for the candidate sites. In addition, the GOB held a discussion with NTPC on coal-fired power development in Chittagong and Khulna. The Survey team collected information and data about the following topics.
Structure of coal procurement Transportation system for coal Port planning for importing Facility to stock/ transport coal Operation and Maintenance control system
Data Collection Survey on Coal Power Master Plan Follow-up in the People’s Republic of Bangladesh
1-4
1.3 Implementation Structure for the Survey
1.3.1 Counterpart Organization
On the Survey, main counterpart organizations are as follows: Ministry of Power, Energy & Mineral Resources(MoPEMR)
Power Division Energy and Mineral Resources Division (EMRD) Power Cell
Bangladesh Power Development Board(BPDB) Economic Relations Division(ERD), Ministry of Finance (MOF) Power Grid Company of Bangladesh (PGCB) Bangladesh Oil, Gas and Mineral Corporation (Petrobangla) Ministry of Environment and Forestry Affairs (MOE) Ministry of Shipping(MOS)
Department of Shipping (DOS) Chittagong Port Authority(CPA)
1.3.2 Experts and Respective Area of the Survey
Expert list and its role of work are as follows: Team Leader/ Coal-fired Power Generation System Genshiro KANO Sub-Leader/ Coal-fired Power Generation System/ O&M Management System
Yoichiro KUBOTA Civil/ Port Planning Mitsunobu ABE Fuel Procurement/ Fuel Transportation A Hajime ENDO Fuel Procurement/ Fuel Transportation B Takeshi NAKATSUCHI Power System Planning Masaharu YOGO Economic Tomoyuki INOUE Organization Structure Mayo YONEYAMA Environmental Management Takeshi SATO
1.4 Schedule of the Survey
Table 1-5 shows the overall schedule of the Survey.
The first site survey : from Saturday, 10th December 2011 to Thursday, 22nd December 2012 The second site survey : from Saturday, 28th January to Thursday, 9th February 2012 The third site survey : from Sunday, 26th February to Friday, 2nd March 2012

Data Collection Survey on Coal Power Master Plan Follow-up in the People’s Republic of Bangladesh
1-5
Table 1-4 Overall Schedule of the Survey
December January February March
Report
FY2010Month
LocalSurvey
DomesticWork
1st Survey 2nd Survey 3rd Survey
InceptionReport
Preparation 2nd Work 3rd Work
InterimReport
Draft FinalReport
Final Report
1st Work
1.5 Contents of the Survey
In order to accomplish the aforementioned objective, the JICA Survey team implemented the following contents of the Survey.
Data collection and review of PSMP2010 Review of current situation after PSMP2010 Data collection and comparison of selected sites for the prioritized projects (imported coal-fired power generation) Review of organizational structure for the prioritized projects (imported coal-fired power generation) Review of investment plan for the prioritized projects (imported coal-fired power generation) Review of port planning for the prioritized projects (imported coal-fired power generation) Review of imported coal procurement for the prioritized projects (imported coal-fired power generation) Review of environmental management for the prioritized projects (imported coal-fired power generation)
Data Collection Survey on Coal Power Master Plan Follow-up in the People’s Republic of Bangladesh
2-1
Chapter2 Follow-up Survey to the PSMP2010 2.1 Background of the PSMP2010
Regarding power generation, Bangladesh uses gas-fired power generation utilizing domestic natural gas for major sources, and the future development plan for new power generation still focuses on domestic natural gas as a main energy resource.
Since the current domestic demand has increased rapidly and the production amount of natural gas has been restricted, it is not realistic to establish a policy that depends too heavily on domestic natural gas to develop a new power generation plan for the long-term.
The GOB has revised the structure of the power supply system through energy diversification several times. They are especially convinced that there is a sufficiently large amount of mining coal in the northwestern part of Bangladesh. Therefore, the GOB has just started to establish an energy supply structure including domestic coal development and imported coal procurement.
In order to develop a policy of power source diversification in the Power sector, the GOB requested support from the Japanese government in terms of establishing the PSMP2010 which covers the strategy to expand coal-fired power generation focusing on not only domestic coal but also imported coal procurement.
In this situation, JICA implemented “The Study for Master Plan on Coal Power Development (PSMP2010)”, which started in September 2009 and finished in February 2011. The study covered the strategy to expand coal-fired power generation focusing on utilizing imported coal and developing domestic coal.
As a result of the study, various measures for power source diversification, focusing on the expansion of using coal in order to secure stable power supply in Bangladesh were proposed. By 2030, the measures targeted optimum power development planning, power system planning and the identification of potential sites for the coal-fired power station based on power source diversification. The Vision Paper proposed in the M/P is shown in Figure 2-2.
2.2 Recommendation of the PSMP2010
< Goals of the PSMP2010 (Six Value-up Plans) > To actively develop domestic primary energy resources ・ To maintain domestic primary energy supply of over 50% To establish a power system portfolio by fuel diversification ・ Fuel composition ratio as of 2030: coal 50%, natural gas 25%, others 25% To realize a low carbon society by introducing high efficient power supply and low CO²
emission technology ・ To improve thermal efficiency by 10 points on average To build an infrastructure necessary for stable power supply under joint coordination by
the multi-sector ・ To power, industry and commercial sector to jointly build a deep sea port facility To build an efficient and effective mechanism, organization and regulations for stable
power supply ・ To establish an organization for long-term stable fuel supply security ・ To formulate the regulations that govern the compulsory regular inspection of power
stations per the leadership of the government

Data Collection Survey on Coal Power Master Plan Follow-up in the People’s Republic of Bangladesh
2-2
・ To revise the tariff structure in order to recover the maintenance costs and future
investment for plant and equipment To reduce poverty through the growth of socio-economy ・ To promote the local community and mutual collaboration
< Recommendations to accomplish targets > Study for basic design regarding deep-sea port development Study for deep-sea port development per the multi-sector Image of deep-sea port development is shown in Figure 2-1.
Source: The Final Report of PSMP2010
Figure 2-1 Image of Deep-sea Port Development by Multi-sector Study for the basic design of the coal-fired power plant applied high efficiency
generation technology ・ Study for the domestic/imported coal-fired power plant Support project for the enhancement of the O&M organization and human education in
thermal power generation ・ Support for the transfer from the Break Down Maintenance to Condition Based
Maintenance Support project for the enhancement of the gas network ・ Support for the stable fuel supply to the gas-fired power station Project for offshore re-gasification facilities ・ Technical support regarding establishing the LNG chain towards the gas shortage Technical support project towards the realization of cross border trading of electric
power as a target ・ Support for the realization of cross border trading towards power shortages Support project for the joint development of a hydro power station with neighboring
countries ・ Support for the development of a hydro power station with neighboring countries

Data Collection Survey on Coal Power Master Plan Follow-up in the People’s Republic of Bangladesh
2-3
Source: The Final Report of PSMP2010
Figure 2-2 Vision Proposed in PSMP2010

Data Collection Survey on Coal Power Master Plan Follow-up in the People’s Republic of Bangladesh
2-4
2.3 Issues to Realize the PSMP2010
The importance of the following issues is recognized in order to realize the implementation of the PSMP2010.
【Issues on Coal Development】 (Domestic coal) Technical issue on an open-pit for large-scale production Environmental issues on coal development in the rural area (Imported coal) Long-term issues and the stable procurement of imported coal in the future international
market, since Bangladesh has no experience in importing coal. Issues connected to the risk of price fluctuation when purchasing imported coal Issues connected to the organizational structure to import coal for power generation Issues on the best transportation system for imported coal in the Bay of Bengal whose
depth is overall shallow (8-9 m) Issues on the port facility for coal procurement and coal transportation (Common) Issues concerning the early establishment of a Coal Policy in order to proceed with the
development project under government leadership 【Issues concerning the high-efficient coal-fired power generation system】 Technical issues concerning the realization of a high-efficient coal-fired power
generation system for Bangladesh which has not experienced enough on coal-fired power generation.
Issues concerning the performance maintenance of new power plants based on the current situation for O&M of the existing coal-fired power generation system
【Issues on financing】 Issues concerning the large amount of financing needed to realize the PSMP2010
2.4 Current Situation of Power Sector in Bangladesh
2.4.1 Current Situation of Power Sector and Energy Sector in Development 5-year Plans
In Bangladesh, five “Development 5-year Plans” for the National Development Plan had been worked out and implemented until 2002. The 5th “5-year plan” was completed in 2002, and the 6th “Development 5-year Plan (2011–2015)” started in early 2011. The outline of the 6th Development 5-year Plan and the comments from the Survey team are described as follows. 1) Outline of the 6th Development 5-year Plan (2011-2015) Based on the result of the 5th Development 5-year Plan, goals were set for the achievement of Vision 2021 and Millennium Development Goals. Due to higher economic growth, initiatives were taken for the following four items in the 5th Development 5-year Plan. Increase of the GDP growth rate Expansion of agricultural production Diversification of agriculture Improvement of educational and medical services

Data Collection Survey on Coal Power Master Plan Follow-up in the People’s Republic of Bangladesh
2-5
Regarding the power sector, two important results were mentioned: starting many IPP projects in the private sector and developing Haripur power station (360MW) and Meghnaghat power station (450MW). Goals for the power sector are shown in Table 2-1.
Table 2-1 Goals for Power Sector in the 6th Development 5-year Plan
Current Situation
(2010)
6th Development5 year Plan
2015
Vision 2021
Electricity generation (MW) 5,803 15,457 20,000 Electricity Coverage (%) 47 68 100 The 6th Development 5-year Plan contains power and energy supply planning, development planning, financial planning, and institutional reforms. Particularly in developing countries, information on energy issues often involves a power struggle among governmental organizations. Therefore, an energy plan is frequently kept in secret. This plan is excellent in comparison to other countries in the sense of information disclosure. 2) Power and Energy Demand The plan describes the energy saving rate of 1% from 2010 to 2021 (10% in 10 years). A 1% energy saving rate was targeted by the IEA2 five years ago. It means that an “Energy saving rate of 1% per year can be achieved even without any special measures for energy conservation.” As energy shortages are becoming apparent in Bangladesh, it is required that special conservation measures of 2% to 3% should be required. As for even higher targets, the energy conservation rate should aim at 4% per year like China. The plan also describes the introduction of an energy management system and labeling system that Japan is capable of supporting. Natural gas shortage Natural gas shortage in Bangladesh affects the transport sector, fertilizer factory and residential sector. The government has a plan to import LNG as a countermeasure. LNG imports are not only used as power fuel, but also used as heat fuel for other sectors. In many developing countries, the residential sector and transport sector usually do not use natural gas. Natural gas is only used in big factories and the power sector in developing countries. Bangladesh is one of the gas-producing countries, therefore, natural gas has been used in some sectors. Given this situation, the shortage of natural gas has a nationwide negative impact. The Power Division is of the opinion that the utilization of natural gas in the residential sector brings about the occurrence of frequent gas leakages and unpaid fees from customers. A plan is being considered to introduce CNG as a natural gas supply to the residential and commercial sectors. Japan has experience with CNG technology transfer in the Philippines. Japan can also support it in Bangladesh.
2 IEA, Energy Outlook 2006.
Data Collection Survey on Coal Power Master Plan Follow-up in the People’s Republic of Bangladesh
2-6
Elasticity of Power Demand The plan stated that the elasticity of power demand to the GDP would be 1.4 in the future. In Bangladesh, the power gap between the supply and demand seems to be larger than the statistical data. When the power shortage in Vietnam from 2003 to 2008 happened, the elasticity of power demand was 2.0. (1.4 elasticity is expected in 2010-2015). Vietnam is planning additional power capacity with a total 50GW coming from nuclear, coal, gas and hydropower generators. Furthermore, when GDP growth rate is 8% per year in Bangladesh, the power demand will increase by 12% per year. As being 5GW power demand in 2010, power demand will increase to 16GW in 2021 when the power demand growth ratio is 12% per year. If the elasticity is set at 2.0, the power demand will reach 22GW. In many developing countries, the maximum growth rate of domestic power supply is 10% per year. A rough estimation shows the power supply capacity only becomes 13 GW in 2021. The difference between the supply and demand is 3GW, and it has to be imported from the neighboring countries, otherwise, the Bangladesh GDP growth rate becomes slower than the plan. GDP growth rate based on the power supply is 5% per year by 2021, not 8% per year. 3) Power and Energy Development In the planning period, the policies away from dependence on natural gas (diversified energy) are prepared. Domestic coal development, imported coal utilization, the introduction of LNG, the use of renewable energy and nuclear power are indicated. It means that Bangladesh shifts from energy producing countries to importing countries. For the development of domestic energy resources, the development of domestic coal and onshore and offshore gas development are planned, and Japan has the capability to support it. However, there is the fear that domestic coal development will have a negative impact on the residential area. So there is an opinion that the development of domestic coal is not so easy. Regarding offshore natural gas development, Japan has the ability to support the development. Energy development Regarding energy development, an amendment to the PSC for IOC is being prepared. The development projects can be expected to be profitable along with the recent rise in oil and gas prices. It is said that one of the reasons for rising oil prices in 2008 was a delay in the development of oil and gas fields worldwide. As long as there is a domestic energy reserve, the developments of the domestic resources should be a high priority. PSC has been revised to facilitate the introduction of the IOC in Indonesia. Generation capacity The current generation capacity is 5-7GW. While the planned generation capacity by 2015 is 14GW and 20GW in 2021, the power supply level is very low for a population of 140 million people. As an example, it is 25GW in Vietnam for a population of nearly 90 million today, and Syria is 9GW of the power capacity ability for a population of 20 million. In light of the projected GDP growth of Bangladesh for 2010 -2021, the lack of power supply remains a problem. Measures are considered to import power, to export high-quality domestic coal, CSP (collected solar power is served for the existing gas-fired power plants) and to introduce GCC (Gas Combined Cycle). Japan can support the expansion and rehabilitation of the power plants.

Data Collection Survey on Coal Power Master Plan Follow-up in the People’s Republic of Bangladesh
2-7
Renewable energy Regarding the use of renewable energy, the development of hydropower is expected. The development of hydropower in Bangladesh is 12% to the potential, while it is 17% in India; further development room can be expected in Bangladesh. By rehabilitation of existing hydropower and modernization of the equipment, it is believed to be the capacity expansion of hydropower. Japan can support their development. As the construction of new hydro power plants will take a long time, it is considered to be a long-term theme. Optimization of the primary energy prices Although, it seems that Bangladesh is considering the diversification of primary energy and secondary energy by optimizing energy prices, development will be limited by PPP (Public Private Partnership) or IPP as long as there is no revision of current gas prices, domestic coal prices, and the electricity tariff. Therefore, the energy price policy has to be implemented urgently. And Bangladesh has to introduce cross-subsidy policy at the same time as revising energy prices. Cross subsidies have a currently negative image as energy policy in the world. However, it is acceptable in Bangladesh’s present situation. However, while introducing an excessive high power tariff to the industrial sector, foreign investment is not promoted. It is also necessary to consider not only power tariffs but also the price of oil and natural gas. One of the reasons to industrialize rapidly in Vietnam is that the industries are attracted by cheap power. Such experiences in Vietnam will serve as a good lesson. Power imports Bangladesh is currently unable to find substantial energies as replacements for natural gas. As a solution, power imports from neighboring countries have been proposed in the plan. It comes from the power trade in the northeast region of South Asia, India, Nepal, and Bhutan. Import power from India has already been planned (250MW). This is expected to increase to 1000MW in the future. In addition, investments from India are also expected to increase in Bangladesh. The Bangladesh power sector’s future dependence on India is growing. However, as imports of energy are affected by the foreign trade balance of Bangladesh, the development of domestic industries and export industries are required. The apparel industry is well known as the export industry of Bangladesh in the future, working labor abroad and exporting agricultural products and tourism should be encouraged. Japan can support it in improving high quality agricultural products. Rental generators and small generators Rental generators and small generators have become a heavy burden on the governmental budget. In an economic climate where oil prices are $ 90 / bbl, foreign oil product prices also are higher. The costs put big pressure on the government budget. A system that is inexpensive and stable power supply is required as soon as possible. There is an opinion that World Bank and ADB are not in favor of supporting coal-fired power. So a stable and low cost power supply system can be urgently expected by using imported coal. 4) Power Transmission and Distribution System The amount of information mentioned in the 6th Development 5-year Plan
- Current situation: Transmission line 230 kV 2,647 cct km, 132 kV 5,818 cct km, Distribution line 269,635 km - Government Target: Transmission Line 3,000 km, Distribution Line 60,000 km added up to 2015 - Progress of the rural electrification - List of main planned transmission lines
Data Collection Survey on Coal Power Master Plan Follow-up in the People’s Republic of Bangladesh
2-8
The abovementioned items are listed as the main contents of this Plan. According to this Plan, while the amount of T/D lines will not double while the amount of power stations that is 7,300 MW in 2011 will approximately double to 15,400 MW (in Table in p141). While the investment into the power stations will be 15 billion USD (10 billion USD for the private sector. The generation costs should be higher than this amount because it must contain fuel costs), the increase in the investment of the transmission line is less than 5 billion USD estimated by the amount of increase in the transmission lines of 3,000 km and the distribution lines of 60,000 km up to 2015. The amount of planned transmission and distribution lines does not seem sufficient because the cost amount of the transmission and distribution lines is generally considered to be approximately the same the power station. (Transmission and distribution plans are actually made reflecting the geographical locations of the power stations and their outputs and the power demand distribution based on the system reliability criteria. The abovementioned approximate estimation of their investment does not include the cost of the substations.) Development plan for the transmission and distribution system The losses of the transmission and distribution system are not mentioned in this Plan. The rural electrification and the development of distribution lines in the rural areas where so much profit cannot be earned would stagnate in a situation where distribution companies would be split up. Such kinds of business seem to require strong government-led support. Concerning the whole description of the chapters of the power sector in this Plan, only limited countermeasures were mentioned as the results and recommendations because this Plan mentioned only the plan during the next 5 years and it would generally require several years to proceed with the plan, construction and their operation of the power infrastructure except for the urgently needed installation of gas turbine generators. A description of the future plan up to at least 10 years would be required even though the title of this Plan is a “five-year plan.”
2.4.2 Current Situation of Power Sector in Bangladesh
Bangladesh’s electricity consumption per capita is 228kWh/ Capita. Malaysia’s is 3,672 kWh/ Capita, China’s is 2,631 kWh/ Capita, Thailand’s is 2,072 kWh/ Capita, India’s is 596kWh/ Capita, Pakistan’s is 452 kWh/ Capita, Sri Lanka’s is 415 kWh/ Capita and Bhutan’s is 262 kWh/ Capita. Compared with those countries, Bangladesh’s is small in the world3. And, its electrification rate is 44% in terms of population. (National census in 2005) Chronic power shortages are a problem in Bangladesh. There was an incident once when 30% of the total demand during peak hour was not supplied as shown in Figure 2-3. The World Bank report4 estimates that the productivity of the average enterprise falls by 10% as the number of blackouts per year increases by 1%.
3 IEA, Energy Balances of Non-OECD Countries, 2011; US CIA, The World Factbook 2011 4 Bangladesh: Strategy for Sustained Growth, World Bank, 2007

Data Collection Survey on Coal Power Master Plan Follow-up in the People’s Republic of Bangladesh
2-9
0
200
400
600
800
1000
1200
1400
1600
2002
2003
2004
2005
2006
2007
2008
2009
Fiscal Year
Loa
d sh
eddi
ng [
MW
]
0%
5%
10%
15%
20%
25%
30%
35%
40%
% o
f M
axim
um D
eman
d
Load Shedding % of maximum demand Source: BPDB Annual Report 2008-2009
Figure 2-3 Annual Load Shedding/Restriction [MW]
Due to the chronic power shortage, over 80% of the manufacturers are equipped with captive power, mostly gas-fired thermal engines. That is, there are redundant investments occurring in Bangladesh, by power companies and by manufacturers. The generation costs of such captive power is estimated to be 1.5 times higher than the usual grid’s electricity tariff, even though they are able to purchase natural gas for fuel inexpensively due to the help of a government subsidy. This situation has obviously undermined the international competency of the manufacturers, leading to immense economic costs paid. According to a report by the World Bank in 20035, around 70% of the interviewed enterprises answered that electricity supply is the obstacle blocking potential investments, largely exceeding the amount of the whole south Asian region, 40%. Taking into account that the other investment environments are superior to that of middle-income countries such as China and India6, it is expected that any industry which requires stable power supply would experience a lasting leap upwards once the power shortage issue is resolved.
2.5 Coal Policy
GOB has been finalizing National Coal Policy. The new Coal Policy is regarded as the main policy for future coal development and expected to cover various issues such as coal development, imported coal, investment and the environment. However, in January 2012, as Prime Minister of Bangladesh, Sheikh Hasina, stated that the Government will not implement new domestic coal power development due to the negative impact it would have on people residing in the surrounding areas. As the result, the establishment of a Coal Policy was suspended.
Regarding natural gas, since the expansion of supply-demand gap may be one of the factors preventing economic growth. The primary introduction of LNG as an alternative gas fuel and international pipeline connection are assumed.
5 “Investment Climate Assessment Survey,” World Bank and Bangladesh Enterprise Institute, 2003 6 Doing Business, World Bank

Data Collection Survey on Coal Power Master Plan Follow-up in the People’s Republic of Bangladesh
3-1
Chapter3 The Latest Issues Regarding Coal-fired Power Development in Bangladesh
3.1 Current Situation of Study in Bangladesh after PSMP2010
GOB is studying the long-term power development plan based on the PSMP2010.
The goal of the development plan is to improve the generation capacity to 35,000MW by 2030 with 50% of the capacity to be supplied by coal-fired power generations at that time. In the PSMP2010, the following sites are the proposed locations of the concrete development plan for the coal-fired power stations. Figure 3-1 shows the location of the sites.
Table 3-1 Candidate Sites for Coal-fired Power Station in PSMP2010
Priority Sites Domestic
Coal
Imported coal Direct access of import vessel
Secondary transport (via coal center)
1 Chittagong(*) ○ 2 Khulna ○ 3 Meghnaghat ○ 4 B-K-D-P ○ 5 Matarbari ○ 6 Zajira ○ 7 Maowa ○ 8 Cox’s Bazar ○
(*) Chittagong includes Chittagong-South Source: The Survey team based on the Final Report of PSMP2010
In the PSMP2010, the “most prioritized projects” were selected out of these sites, based on the concept that it is foundational to the future development of coal power in Bangladesh, the following concept was adopted without using a simple selection from the ranking,
Based on national policy that domestic resources should be developed preferentially,
one site which mainly uses domestic coal should be selected. From the sites for using imported coal, one site from each fuel transportation type
should be selected (meaning one has coal center capability and another requires domestic transportation).
Based on the above points, the following 3 sites were selected,
Table 3-2 Prioritized Sites for Coal-fired Power Station in PSMP2010 Sites Characteristics
Chittagong-South It has a 1st ranking, and is capable of being equipped with an import coal port. It is selected as a site with a coal center.
Meghnaghat It is a 3rd ranked project, and has a 1st ranking for the sites which are not capable of receiving import vessels directly. This has been selected as the site which uses imported coal with domestic transportation.
B-K-D-P It is ranked as 4th and the priority is not high, so it has been selected as a site for domestic coal.
Source: The Survey team based on the Final Report of PSMP2010

Data Collection Survey on Coal Power Master Plan Follow-up in the People’s Republic of Bangladesh
3-2
Source: The Survey team based on the power system diagram by PGCB
Figure 3-1 Location Map of the Candidate Sites for Coal-fired Power Station in PSMP2010
Matarbarii
Chittagong South
Chittagong
Zajira
Maowa
Meghnaghat
B-K-D-P
Khulna
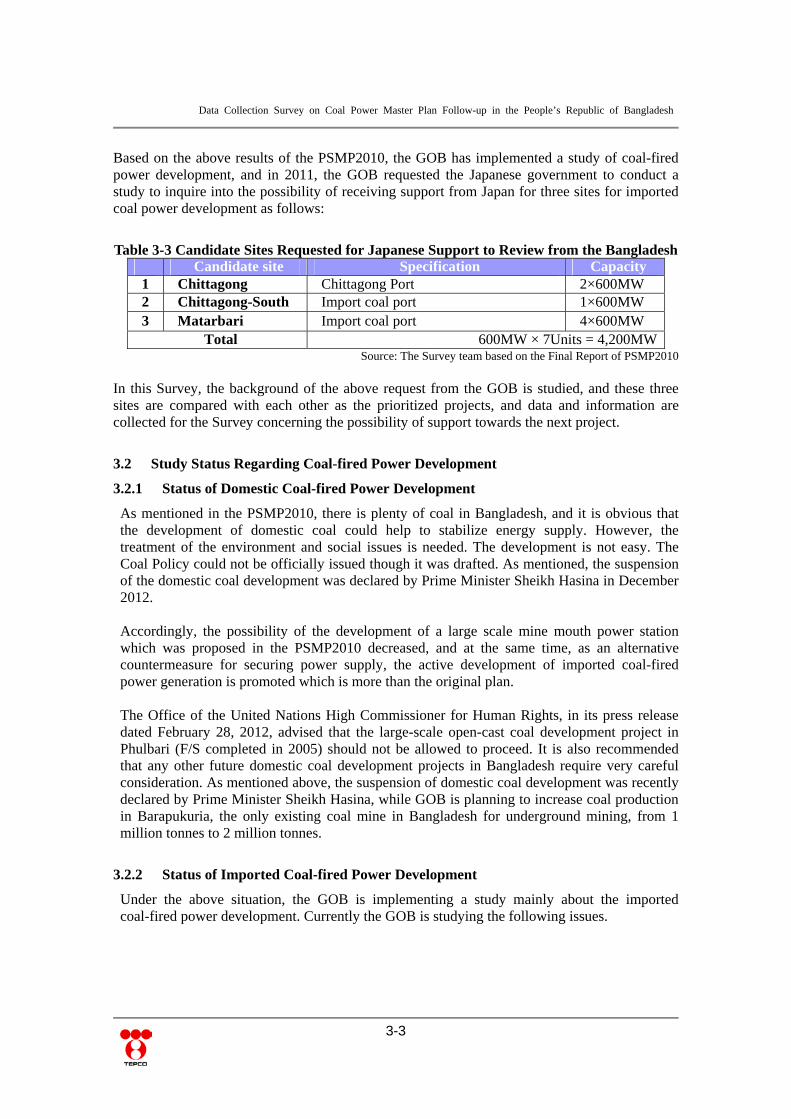
Data Collection Survey on Coal Power Master Plan Follow-up in the People’s Republic of Bangladesh
3-3
Based on the above results of the PSMP2010, the GOB has implemented a study of coal-fired power development, and in 2011, the GOB requested the Japanese government to conduct a study to inquire into the possibility of receiving support from Japan for three sites for imported coal power development as follows:
Table 3-3 Candidate Sites Requested for Japanese Support to Review from the Bangladesh Candidate site Specification Capacity 1 Chittagong Chittagong Port 2×600MW 2 Chittagong-South Import coal port 1×600MW 3 Matarbari Import coal port 4×600MW
Total 600MW × 7Units = 4,200MWSource: The Survey team based on the Final Report of PSMP2010
In this Survey, the background of the above request from the GOB is studied, and these three sites are compared with each other as the prioritized projects, and data and information are collected for the Survey concerning the possibility of support towards the next project.
3.2 Study Status Regarding Coal-fired Power Development
3.2.1 Status of Domestic Coal-fired Power Development
As mentioned in the PSMP2010, there is plenty of coal in Bangladesh, and it is obvious that the development of domestic coal could help to stabilize energy supply. However, the treatment of the environment and social issues is needed. The development is not easy. The Coal Policy could not be officially issued though it was drafted. As mentioned, the suspension of the domestic coal development was declared by Prime Minister Sheikh Hasina in December 2012.
Accordingly, the possibility of the development of a large scale mine mouth power station which was proposed in the PSMP2010 decreased, and at the same time, as an alternative countermeasure for securing power supply, the active development of imported coal-fired power generation is promoted which is more than the original plan. The Office of the United Nations High Commissioner for Human Rights, in its press release dated February 28, 2012, advised that the large-scale open-cast coal development project in Phulbari (F/S completed in 2005) should not be allowed to proceed. It is also recommended that any other future domestic coal development projects in Bangladesh require very careful consideration. As mentioned above, the suspension of domestic coal development was recently declared by Prime Minister Sheikh Hasina, while GOB is planning to increase coal production in Barapukuria, the only existing coal mine in Bangladesh for underground mining, from 1 million tonnes to 2 million tonnes.
3.2.2 Status of Imported Coal-fired Power Development
Under the above situation, the GOB is implementing a study mainly about the imported coal-fired power development. Currently the GOB is studying the following issues.

Data Collection Survey on Coal Power Master Plan Follow-up in the People’s Republic of Bangladesh
3-4
Table 3-4 Candidate Sites and Issues Studied by GOB Candidate site Specification Capacity
1 Khulna Existing import coal port near the Mongla Port and new coal center
2×500~660MW
2 Chittagong Existing Chittagong Port 2×500~660MW
3 Maheskhali New import coal port
8,3200MW LNG 750MWx4 Coal 1,000MWx4 600MWx2
Total 10,320 ~ 10,960MW
Source: The Survey team based on BPDB document The background of the selection of these sites is as follows.
Khulna and Chittagong were selected as the highest prioritized sites in the PSMP2010 because of the existence of the port facilities. The GOB is implementing the development on a priority basis for the same reason. Chittagong-South site near the estuary of the Sangu river was also proposed in the PSMP2010 as a part of the Chittagong site. However, according to the following study, its priority was lowered because of the possibility of increased port maintenance costs due to the high sedimentation speed around the downstream of the Sangu River.
According to the priority ranking in the PSMP2010, the next candidate site was Meghnaghat. However, it requires the secondary coal transportation system, which means that the construction of a coal center is needed prior to the power station development. There is no predecessor plan to the coal center, so it is difficult to implement the development with high priority. The B-K-D-P site, at the next priority ranking, has no development plans due to the suspension of domestic coal development.
Therefore, Matarbari was selected according to the priority ranking. In Bangladesh, the development of imported coal-fired power is focused due to the suspension of domestic coal development. The study of a large scale imported coal-fired power station is needed. The major merits of the Matarbari site is that there is a deep sea area (20 ~ 30m) around the site. Concerning the area of the Matarbari site, a 600MWx4 scale power development can be feasible, but it may be difficult to develop a power station with the capacity of thousands of MW. Furthermore, the GOB thought that the power plant should be installed on a hill to protect against Cyclones. As a result, the GOB started the study for Maheskhali Island as a development site which also has a deep sea area. As referred to hereinafter, according to the plan by the GOB, the power plants will be installed on the hill of Maheskhali Island.
The prioritized sites for the development were selected by the GOB through the above process. Among these three sites, in the beginning of GOB’s discussion, Khulna site, which is located in the western area, and Chittagong (Anwara) site which is located in the eastern area were the prioritized sites in cooperation with NTPC as a joint venture. Now, according to the latest information, the project in the Chittagong (Anwara) site has been suspended for review, though the Chittagong (Anwara) site still remains as the prioritized site. Regarding Chittagong (Anwara) site, the GOB has recently been planning a development project with China Huadian

Data Collection Survey on Coal Power Master Plan Follow-up in the People’s Republic of Bangladesh
3-5
Hong Kong Ltd. Company. On the other hand, the GOB and NTPC have been implementing a Feasibility Study of the Khulna site.
3.2.3 Current Status of Khulna Site
As mentioned above, BPDB and NTPC have been planning a project of 660MW X 2 Units at Khulna site in the eastern area and a project of 660MW X 2 Units at Chittagong site in the southern area.
To develop the two projects, a new alliance for energy cooperation and a new operating committee for energy policy were established between Bangladesh and India in January 2010.
The operating committee is composed of BPDB and NTPC and the two organizations will be engaged in developing the projects in Khulna and Chittagong. Afterwards, in August 2010, they committed the MOU of a joint venture for the development of a coal-fired power station with a generation capacity of 1,320MW, and in September 2010, a consulting service contract was committed between BPDB and NTPC, meaning that a feasibility study in Khulna was started.
1) Feasibility Study in Khulna Site Khulna site is located 23km on the Southern side from Khulna city, 14km from the northwestern side of Mongla Port, in 14km from Rampal city which is near Mongla Port, situated at lat.22˚37’00’’-22˚34’30’’ N and long. 89˚32’00’’-89˚34’05’’E.
Source: The Survey team
Figure 3-2 Location Map of Khulna Site
Khulna site

Data Collection Survey on Coal Power Master Plan Follow-up in the People’s Republic of Bangladesh
3-6
Source: Khulna Information Document by BPDP
Figure 3-3 Picture of Khulna Site from the Air
Source: Khulna Information Document by BPDP
Figure 3-4 Location Map of Khulna Site
Khulna site
Khan Jahan ali Air-port
Khulna City
Mongla Port
Habit for mangrove
23km
12km
14km
Khulna site Khulna City
Mongla Port
Pussur River

Data Collection Survey on Coal Power Master Plan Follow-up in the People’s Republic of Bangladesh
3-7
2) Status of Land Acquisition in Khulna Site
The specification of the project area for the power station is shown in Table 3-5. The current map of the project area is shown in Figure 3-5.
Table 3-5 Specification of the Land under Acquisition Procedure
Source: Khulna Feasibility Report by NTPC
Source: Khulna Information Document by BPDP
Figure 3-5 Current Map of Project Area of Khulna Site
Contents SpecificationProject area Figure Total: 650Acres 2,630,420m2
For what Plants: 350 Acres 1,416,380m2 Township: 75 Acres 303,510m2 Conveyor: 125 Acres 505,850m2 Ash disposal: 100 Acres 404,680m2
Current Purpose of land use
Agriculture and shrimp farm
Range of resettlement 0.8% Number of residence 150

Data Collection Survey on Coal Power Master Plan Follow-up in the People’s Republic of Bangladesh
3-8
According to BPDB, the land acquisition of 1,834 acres for the power station was approved in February 9, 2010 and is under procedure.
3) Equipment of Coal-fired Power Plants in Khulna Site The specification of planned power plants is shown in Table 3-5.
Table 3-6 Specification of Equipments for the Power Station in Khulna Contents Specification Notes
Capacity of output
2×660MW
Type Supercritical Pressure Once-through Boiler Type Thermal condition
25.6MPa 568/596˚C
Generation type
Base Load
Fuel Imported coal Cooling system
Water intake:2km down Pussul River The amount of condensed water: 9,150m3/hr
Coal transportation
<Transport between Bengal and Mongla ports> Transfer coal from a large-scale vessel to 20,000DWT vessel in 10km offshore in Bay of Bengal and transport it to Mongla Port
<Transport between Mongla port and power station> Plan 1: Conveyor type: (Single stream high capacity conveyor system) Plan 2: Build berth and vessels directly get to the power plants(dredge a channel of Pussur river and keep space for domestic vessel)
Berth system Use 10 Jetty and 11 Jetty in Mongla port. In this case, 25 acres of the land is necessary.
Mongla Port Authority
Loading facility
<Unloading facility> Type: Rail mounted grab bucket type Capacity: 4,000 t/hr
Mongla Port
Handling equipment
Install through screen feeder and crusher from the end of belt conveyor for each unit. Capacity: 1,200 t/hr
Power Plant
Coal Stock The amount of Coal: for 90 days Source: Khulna Feasibility Report by NTPC

Data Collection Survey on Coal Power Master Plan Follow-up in the People’s Republic of Bangladesh
3-9
The layout of main equipment for Khulna power station is shown in Figure 3-6.
Source: Khulna Feasibility Report by NTPC
Figure 3-6 Layout of Main Equipment for Khulna Power Station
Town ship
Coal Stock Yard
Ash Disposal
Main Plant

Data Collection Survey on Coal Power Master Plan Follow-up in the People’s Republic of Bangladesh
3-10
4) Coal in Khulna Site
According to the NTPC’s of the Feasibility Study report, it has been described that coal is supposed to be imported from Indonesia and other details have not been indicated yet. It is necessary to decide the coal quality level for the preliminary design of the main equipment of the plant. However, at the moment, the coal supplier has not decided yet. The study has been implemented under the assumption that coal is to be imported from Indonesia. The level of coal quality is shown in Table 3-6. Although Indonesia is the primary coal supplier, other countries such as South Africa and Australia will also be selected. However, the reason for the selection is vague. CEGIS, a consultant which entered into contracts with BPDB, is planning to visit the coal export countries in the end of February accompanied by government officers.
Table 3-7 Coal Quality for Use in Khulna Contents The latest data of Coal Notes Country Indonesia
Ash content 15% Calorie 6,000kcal/kg
Sulfur content 0.6% Amount of Coal
per day 12,920ton/Day 100% loading
Amount of Coal per year
4,720,000 t/Year
Source: Khulna Feasibility Report by NTPC 5) Organizational Structure for Coal-fired Power Station in Khulna Site
Regarding Khulna site, BPDB and NTPC provided the 50% of the needed capital to establish a new company for the coal-fired power station. Furthermore, BPDB is planning to procure the capital as a loan from Indian financial organizations. The details of coal procurement is not described in the NTPC report and was just written like “The coal transportation logistic study report made by BPDB around June 2011.” As of February 2011, it has not yet completed.
6) Coal Procurement in Khulna Site
Coal is transferred from a large-scale vessel to a 20, 000DWT vessel 10km offshore in the Bay of Bengal and transported to Mongla Port. The transport length is approx. 150km. The route is shown in Figure 3-7. If a new coal center is built in Sonadia Island, coal would be transported by a domestic vessel to Khulna and Chittagong power stations. BPDB is intending to promote the development of a Deep Sea Port in Sonadia Island. On the other hand, the development in Sonadia Island, which is under strict environmental regulations, will take time and the Maheskhali site would be developed in advance.

Data Collection Survey on Coal Power Master Plan Follow-up in the People’s Republic of Bangladesh
3-11
Source: Khulna Feasibility Report by NTPC
Figure 3-7 Transport Route of Coal from Bay of Bengal to Mongla Port

Data Collection Survey on Coal Power Master Plan Follow-up in the People’s Republic of Bangladesh
3-12
7) Coal Transport System from Mongla Port to Khulna Power Station
Two cases are planned for the coal transport system from Mongla Port to Khulna Power Station. Plan 1: Conveyor type
20,000DWT class vessel, which requires an 8m river depth, is unloaded in Mongla Port and is transported to the station, which is located 14km away from the port, by belt-conveyor. The route of the conveyor is shown in Figure 3-8.
Plan 2: In order to secure 8m depth of transport space in the Pussur River for a
domestic vessel, if 2 berths are built and have direct access to the plants, 30m width of the river needs to be dredged. The water route in Pussur River is shown in Figure 3-8.
Source: Khulna Feasibility Report by NTPC
Figure 3-8 Transport Route from Mongla Port to Khulna Power Station 8) Access Road to Khulna Power Station
The access road to Khulna power station branches off in Bhaga, which is located in the existing Khulna-Mongla Highway. The route image of the access road is shown in Figure 3-9. The distance of a new access road is 12.5km from Bhaga to the power station, the width is 4-5m, and one 12m long bridge is to be built. In addition, a culvert or others as a conduit facility is planned due to the water route crossing.
Dhaka Mongla Highway
Mongla port
Case-1 Route of Coal Conveyor Belt
Khulna site
Case-2 Route of Pussur River Water
Case-2 Jetty at Site

Data Collection Survey on Coal Power Master Plan Follow-up in the People’s Republic of Bangladesh
3-13
Source: Khulna Feasibility Report by NTPC
Figure 3-9 Access Road to Khulna Power Station
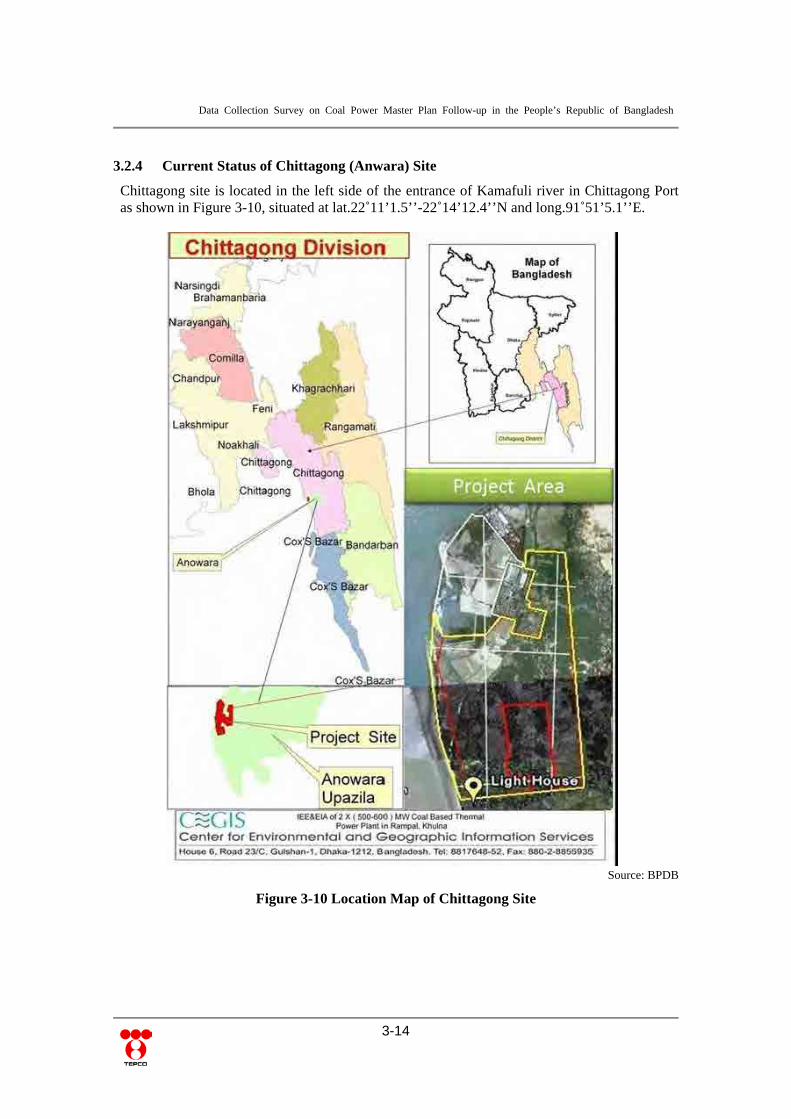
Data Collection Survey on Coal Power Master Plan Follow-up in the People’s Republic of Bangladesh
3-14
3.2.4 Current Status of Chittagong (Anwara) Site
Chittagong site is located in the left side of the entrance of Kamafuli river in Chittagong Port as shown in Figure 3-10, situated at lat.22˚11’1.5’’-22˚14’12.4’’N and long.91˚51’5.1’’E.
Source: BPDB
Figure 3-10 Location Map of Chittagong Site

Data Collection Survey on Coal Power Master Plan Follow-up in the People’s Republic of Bangladesh
3-15
Chittagong site is also located in 15km of the south direction from Kotwali Thanaj, 10.73km of the south direction from Chittagong Port, 7.7km of the southern-east direction from Shah Amanat Int. Airport, and 10.34km of the southwest from Chittagong-Cox’s Bazar Highway.
Source: BPDB
Figure 3-11 Location Map of Chittagong Power Station
SShhaahh AAmmaannaatt IInntt.. AAiirrppoorrtt
CChhiittttaaggoonngg SSeeaa PPoorrtt
KKoottwwaallii TThhaannaa
PPrroojjeecctt LLooccaattiioonn

Data Collection Survey on Coal Power Master Plan Follow-up in the People’s Republic of Bangladesh
3-16
1) Current status of land acquisition in Chittagong site
Information on the land use is shown in Table 3-7 .A boundary of land for Chittagong Power Station is as shown in Figure 3-12. On February 2012, the procedure for the land acquisition was completed for 15% of the area. However, the procedures for the rest of the area were suspended due to the protests by some environmental communities. BPDB is trying to solve it within one year.
Table 3-8 Current Land Use of Chittagong Site Contents Specification
Landuse
Total range: 1,550Acres 6,272,540m2
Agricultural land: 70%,1,085Acres 4,390,778m2
Cultivation farm:10-15%,155Acres 627,254m2
Mangrove: 5-6%, 77.5Acres 313,627m2
Settlement area: 5-6%, 77.5Acres 313,627m2
Others: 10% 627,254m2
Households 220~250Source: BPDB
Source: BPDB
Figure 3-12 Boundary of Chittagong Site

Data Collection Survey on Coal Power Master Plan Follow-up in the People’s Republic of Bangladesh
3-17
3.2.5 Current Status of Maheskhali Site
1) Committee and Plan for Maheskhali Site MoPEMR set up a new committee for site selection of power generation in October 27th, 2010. The committee formation is shown as Table 3-9. The committee has functions to select an LNG receiving terminal and both sites of the LNG power station and coal-fired power station.
Table 3-9 Committee formation of site selection Committee Formation
Member Position Power Division Convenor
BPDB Member BPC Member
UNO, Maheskhali Member PGCB Member
Source: BPDB The committee conducted site survey in August, 2010 and had a meeting in September and October 2010. The report was submitted in December 2010.
2) Report of the Site Selection by the Committee The committee proposed the following points: Securing 5,000 acres (20,234,000m²) of land for an LNG receiving terminal and a new
coal-fired power station. Securing an additional 100 acres (404,680m²) of land for the LNG receiving terminal
used by Petrobangla and Metering Stations The most sturdy facility planning is to be considered since a 6.5-7.0m high wave from
the cyclone broke the Port in 1991.
3) Proposal from the Committee The committee proposed the following points: In the Feasibility Study, a new power station has to be protected from a natural disaster. The power station needs an approx. 10m filling or embankment in the sea side.
4) Maheskhali Site
Maheskhali site is located in Maheskhali Island, 85km of the south direction of Chittagong City and 15km of the northeast direction of Cox’s Bazar City. The location map is shown in Figure 3-13. Around the Maheskhali site, there are surroundings such as Cox’s Bazar City, which is the nearest city to the Maheskhali site, a huge and long coast of Bay of Bengal and the longest beach in the world. On the other side beyond the ocean, Sonadia Island has a deep offshore, therefore Sonadia Island is a potential site for Deep Sea Port development, which means the area can be economically developed. The ocean area near Sonadia Island and Matarbari is suitable for the Deep Sea Port.
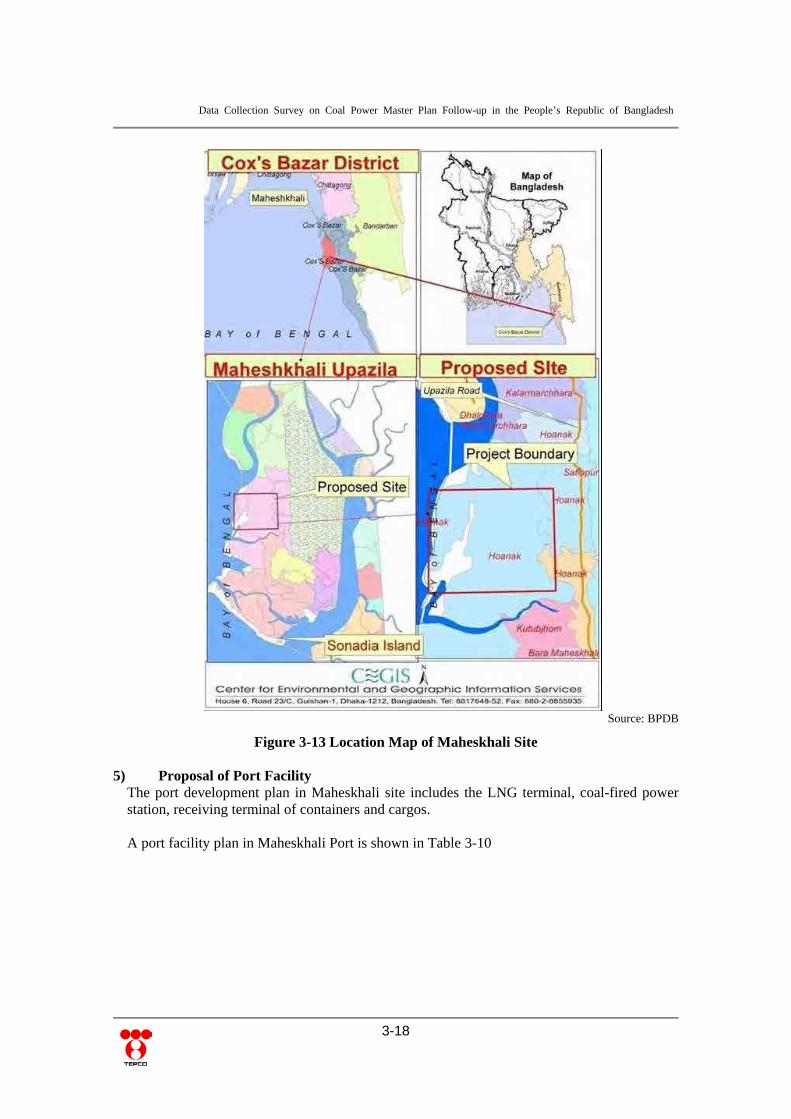
Data Collection Survey on Coal Power Master Plan Follow-up in the People’s Republic of Bangladesh
3-18
Source: BPDB
Figure 3-13 Location Map of Maheskhali Site
5) Proposal of Port Facility The port development plan in Maheskhali site includes the LNG terminal, coal-fired power station, receiving terminal of containers and cargos. A port facility plan in Maheskhali Port is shown in Table 3-10

Data Collection Survey on Coal Power Master Plan Follow-up in the People’s Republic of Bangladesh
3-19
Table 3-10 Port Facility Plan in Maheskhali Port Maheskhali Port
Berth (Jetty)
Total : 54 Phase1: 9
Container:5 , Cargo: 4 Including 2 for unloading and transporting coal
Vessel class 50,000t vessel class Max. Depth 14m
Source: BPDB
6) Status of Land Use in Maheskhali Site The specification of the land use in the Maheskhali site is shown in Table 3-11. The location map of the equipment for power generation is shown in Figure 3-14.
Table 3-11 Specification of Land Use in Maheskhali Site Contents Specification Notes
Land
Total range: 5,000Acres 20,234,420m2 Coal-fired power station:3,000Acres -4×1,000MW=4,000MW -2×660MW=1,320MW
12,145,800m2
LNG power station: 450Acres -4×750MW=3,000MW
1,821,060m2 Combined Cycle P・P
Coal center, transport, coal stock yard: 650Acres
2,630,420m2
Residential: 300Acres 1,214,040m2 LNG terminal: 100 Acres 404,680m2
800kVA substation: 200 Acres 809,360m2
Access road, extra land/ Green Belt: 300Acres
1,214,040m2
Source: BPDB

Data Collection Survey on Coal Power Master Plan Follow-up in the People’s Republic of Bangladesh
3-20
Source: BPDB
Figure 3-14 Facility Location Map of Maheskhali Power Station
7) Status of the Study As mentioned above, the GOB is drawing the scale, area and layout, but the actual status is at the desktop study. The GOB would like to follow the progress of this study and take the results of this study into consideration in their detailed study. However, the land acquisition procedures were started ahead of time for the surrounding area by the red line shown in the above figure, the preparation for the land acquisition was started. Generally speaking, it is normal that the land acquisition will proceed after the detailed design or layout is settled, however, it seems that the GOB would like to proceed ahead to avoid the plan delays due to land acquisition difficulties.
8) Review of Maheskhali Site In the plan as described in 1)-6), the generation capacity by coal is 1,000MW×4units= 4,000MW and 660MW×2units=1,320MW, so the total capacity by coal is 5,320MW. Also, the LNG power station near the site for the Coal-fired power station is planned. The capacity by LNG is 750MW×4units=3,000MW. In sum, the total power generation capacity by coal and LNG is 8,320MW. PSMP2010 indicated the total capacity by imported coal is 600MW×13units=7,800MW. Maheskhali site (Coal: 5,320MW) would have a 68% of the total capacity by imported coal. In addition, the port facility in the Maheskhali site is supposed to be a multi-development port not only for the energy sector and also for the other sectors, including the plan of terminals for containers and cargos next to the coal-fired and LNG power stations.

Data Collection Survey on Coal Power Master Plan Follow-up in the People’s Republic of Bangladesh
3-21
The existing ports in Bangladesh have a major problem where quicksand inflow into the port due to the delta area and sand is piled up to the Bay of Bengal. That is why the ocean area is shallow in the wide range. For example, the maximum depth of the largest Chittagong Port and the second largest Mongla Port is approx. 8-9m. Therefore, a 20,000DWT class vessel is the maximum size to touch the land. Compared with existing ports, the Maheskhali port is very deep. The depth is 28m at any 8km offshore point from Maheskhali Island, according to the BPDB report, which means that large vessels of more than 80,000DWT-class can touch the land and it has great advantages on the handling and cost for coal transport. In addition, it is easy to acquire land since the land in the Maheskhali site is state-owned. If the land is expanded for further development, the infrastructure built by the first investment could be used. On the other hand, there is information in the protected forest area for the natural environment. It is necessary to confirm the Natural Park, ecological critical area, precious natural environment and regulations. Maheskhali site is located 300km far from Dhaka, which is the largest energy consuming city. Transmission line development is necessary to be planned in consideration of increasing the units of power plants. A 400kV transmission line can transmit the power to the load center when Maheskhali has only 1 unit or 2 generating units. However, if additional units are built, higher-voltage transmission lines should be considered.
3.3 Review of Organization Structure for Continuous Coal-fired Power Development
3.3.1 Structure Reform of MoPEMR
Since October 2011, the Power Division of MoPEMR has been separated into three sections as shown in the following figure. The planning section has been established as a new organization and is in charge of planning for power generation, transmission and distribution. Before October 2011, the development section had responsibility for planning work. Due to an increase of the number of planning projects, a new section was established.
Secretary
Administration PlanningDevelopment
(Procurement &Contract)
Source: The Survey team
Figure 3-15 New Organization Structure of Power Division of MoPEMR
Furthermore, the planning section also consists of three groups like the following figure. “The first group” is in charge of power generation issues. “The second group” is in charge of transmission and distribution issues and “The third group” is responsible for renewable energy issues.

Data Collection Survey on Coal Power Master Plan Follow-up in the People’s Republic of Bangladesh
3-22
One characteristic of this organization is that different international development partners are allocated to three sections. JICA’s counterpart is the power generation group, the first group. The first group has several counterparts of international development agencies and banks as shown in the figure below.
Source: The Survey team
Figure 3-16 New Organization Structure of Planning Section of Power Division of MoPEMR
3.3.2 Institute and Organizations of Power Generation, Transmission and Distribution Business
In the past ages, BPDB had a monopoly on power business in Bangladesh. Since around 2006, BPDB has been promoting the corporatization of transmission, distribution and power generation businesses in line with the recommendations (Privatization, Transparency and Corporatization) from World Bank and ADB. However, the progress speed of the corporatization is slower than the World Bank and ADB’s expectation. It has been said that the entities separated from BPDB are under BPDP’ control, even today.
The following figure is the organization chart on power generation, transmission and distribution in Bangladesh, today. Furthermore, BPDB is located as one of the power generation companies in the figure. However, BPDB has strong managing control over the board of the other companies. The generation business using the imported coal is supposed to be implemented by the “Coal Power Generation Company” started from early 2012 (the company was approved by the Government in September 2011) or a new company is to be established.
Planning
Section 1 Generation
(BPDB, EGCB, APSCL,WZPDCO)
JICA, KfW, IDB,Kuwait Fund, Saudi Fund,
OPEC Fund
Section 2 Transmission & Distribution
(PGCB, DPDC, DESCO)
Annual Development Plan
Section 3Rural Electrification
& Renewable Energy(REB)
ADB WB, GIZ
Development Partners

Data Collection Survey on Coal Power Master Plan Follow-up in the People’s Republic of Bangladesh
3-23
Source: PSMP2010 Final Report
Figure 3-17 Organization Structure of Generation, Transmission and Distribution Business
3.3.3 Roles and Organization of Coal Power Generation Company (CPGC)
BPDB has been the main organization for coal-fired power development. However, after the PSMP2010 (February 2011), Coal Power Generation Company (hereinafter CPGC) was established as a directly controlled-governmental organization, which was registered as a company in September 2011. CPGC is now engaged in the development and planning of coal-fired power in Bangladesh.
1) Objective of Establishment of CPGC
CPGC is in charge of planning for coal imports and the construction of a power station as a coal-fired power generation player. The CPGC will operate and manage plants after the commissioning of the power stations. CPGC relies on local consultants (Central Environment Geographical Service: CEGIS) to study the suppliers of coal and the EIA of the candidate sites. The power division plans that CPGC is due to manage are the coal-fired power generation companies including the existing companies as a holing company in Bangladesh in the future. The CPGC has been approved as a company by the Government in February 2011, and was registered officially in September 2011. As of February 2012, the number of staff is six persons who are dispatched temporarily from BPDB. They are working on the preparation of an office room, logo marks and the office facilities for the establishment of CPGC. The fund is supplied by BPDB. A detailed organization is due to be decided in early 2012. A relationship between CPGC and other organizations is shown in the following figure.

Data Collection Survey on Coal Power Master Plan Follow-up in the People’s Republic of Bangladesh
3-24
Source: The Survey team
Figure 3-18 Organization Structure of Coal Power Generation Company
Adding the above organizations, the Survey team recommends that establish “Maheskhali Port Center” and “Environment Protection Center.” Maheskhali Port Center is in charge of Maheskhali port maintenance. Environment Protection Center is in charge of air and water pollution monitoring, mangrove and animal ecosystem survey and other environmental issues.
2) Main Items in the Establishment Article of CPGC
"Certificate of Incorporation" of CPGC has been registered in the Joint Stock Companies & Firms (Commercial registry office) on September 5, 2011. The business contents of CPGC are described in “Memorandum & Articles of Association” based on “The Company Act 1994.” CPGC was established in 2011 actually. The main business and the structure of CPGC are as follows: CPGC is a public limited company (Article 6)
The definition of the Public limited company is the shares of the company listed on the stock market. CPGC is to be established as a state owned company. However, it has prepared a room the private capital fund enters into the CPGC by means of private entities holding the shares of the CPGC.
CPGC has implemented a coal-fired power generation business by itself and JV.
(Article 7) Comment: The business contents are written in the Memorandum of Association of the Coal Power Generation Company Bangladesh Limited Act XVIII 1994. Furthermore, the CPGC has to carry out all services including the land purchases, construction of coal-fired power generation, operations, fuel purchasing and power transmission.
The authorized equity is 60 billion Taka and the price per share is 1,000Taka.(Article 8)
Comment: Since the authorized equity of NWPGCL is 1 billion Taka, the future of CPGC is expected.
The Government holds 100% equity of CPGC. (Article 9)
Comment: The government funds the whole equity (100%) of CPGC. However this project is sponsored by the government as a long term loan.
MoPEMR Power Division
Supervision Equity
Power Sales income
Regulation
Development Partner’s Loan
Loan
CPGC
PGCB
BPDB
BERC The Government Power company

Data Collection Survey on Coal Power Master Plan Follow-up in the People’s Republic of Bangladesh
3-25
The chairman of the BPDP is the chairman of CPGC. (Article 89)
Comments: The business can be stable by inviting the chairman of CPGC from BPDP. However, CPGC should be able to recruit the chairman by the board of directors in the future.
The Managing Director is elected by the board of directors through open recruitment
(Article 90) Comment: It is expected that suitable personnel can be selected via an open recruitment process. A knowledgeable person in global energy trends should be expected because coal import is required.
CPGC’s board of directors can get rid of the Managing Director after consulting
MoPEMR and Power Division. (Article 91) Comment: By the Article, the management of CPGC can reflect opinions of the Power Division. However, in consideration of the privatization, this decision should be made by the general meeting of shareholders.
Daily management of CPGC should be implemented by the Managing Director.
(Article 92) Comments: By the Article, the Managing Director of CPGC will manage the company to maximize the CPGC’s profit.
3) Roles and Consideration of Power Division, BPDB and CPGC
The following table shows the roles and current considerations of the above three organizations for the project (as of February 2012).

Data Collection Survey on Coal Power Master Plan Follow-up in the People’s Republic of Bangladesh
3-26
Table 3-12 Roles and Consideration of Power Division, BPDB and CPGC Regarding the Project (as of February 2012)
Roles and Consideration
Power
Division
1) PD is obliged to supervise the CPGC on behalf of the government.
2) PD is able to dismiss the Managing Director of CPGC. (procedures must be in place)
3) As for the view of the PD, it is unclear so far whether CPGC will become a holding company of
the imported coal power generation business or not.
4) PD has welcomed the CPGC to proceed with Maheskhali or Matarbari projects using a JICA
loan.
BPDB
1) It has already been decided that the chairman of BPDB will become the chairman of CPGC.
2) BPDB does not have any plans to invest in CPGC, even though they are able to invest in CPGC.
3) BPDB is planning to establish a joint venture company for imported coal power generation in
Chittagong and Khulna. However, these projects are uncertain at the moment.
4) According to Project Director of BPDP, they do not have any plans to run coal power
generation.
5) According to BERC, the wholesale power tariffs will be determined by the weighted average
cost of all kinds of power generation plants in BPDB, given that the imported coal power
generation plant costs are comparatively higher than other power generators in Bangladesh.
6) According to the Project Director of BPDB, the staff of BPDP will not be transferred to CPGC.
7) CPGC is currently using outsourcers to conduct an environmental impact assessment of Khulna,
Chittagong and Matarbari/Maheskhali areas.
CPGC
1) In the articles of incorporation, CPGC can implement all kinds of necessary activities such as
surveys, construction and operations relating to the import coal power generation business.
2) There is information that the power companies in Bangladesh will have some shares of CPGC,
even though the government holds 100% of the shares of CPGC in the inception stage.
3) The preparation of CPGC is in progress by 6 persons dispatched from BPDB and consultants.
4) CPGC has been established as a public limited company. However, as the Bangladesh stock
market is immature, it is said that the listing of the shares in the market does not work well in many
cases.
5) In the near future, it has been scheduled to announce an open recruitment for the Managing
Director of CPGC in line with the articles of CPGC incorporation. The recruitment method and
selection criteria are written in the articles. Other required staffs and operators will also be
recruited by open recruitment.
6) According to the Project Director of BPDP, CPGC has no relationship with a JV company of
CPGC, BPDP and Indian company.
7) The power of CPGC will be traded in line with the PPA with the BPDB.
Source: The Survey team

Data Collection Survey on Coal Power Master Plan Follow-up in the People’s Republic of Bangladesh
3-27
3.3.4 Current Situation on the Establishment of Import Coal-fired Power Generation in Khulna and Chittagong
1) Progress of Khulna Project (As of Feb 2012) Khulna project was signed in late January 2012 between BPDB and NTPC which is
Indian company. A joint venture company, “Khulna Coal-fired Power Plant Company limited,” (tentative name) will be established as a Khulna power generation project (1300MW). It is assumed that the equity rate is 30% and the loan rate is 70% of the total investment. BPDB and NTPC each invest half in the equity. On the other hand, the contributor of the loan was not determined yet as of the end in January 2012. There is a possibility that the Indian public and private banks will supply the loans.
Regarding coal procurement for Khulna power plants, it is likely to come from
Indonesia and Australia. The closest supplier of imported coal is India, but there is a problem of supply capacity. The coal is transported up to the Passur river mouth along the Bay of Bengal by using 80,000-ton vessels. Then, the coal is transferred to a smaller vessel and transported to Mongla. Imported coal is exempt from VAT and customs. The tax exemption is determined by negotiations between the government and the power generation company.
Khulna is an agricultural area, has a variety of religions and habitats for natural flora
and fauna such as tigers. Therefore, there is the opinion that it is not easy to develop power plants.
Source: The Survey team
Figure 3-19 Khulna Coal Power Generation Project and the Related 2) Progress of Chittagong Project
The some companies from the UK, China, Thailand and Malaysia are interested in the Chittagong project. As of February 2012, the available MOU between Bangladesh and foreign companies are as follows.
BPDB(50%)+ NTPC(50%)
Khulna Coal Fired Power Company Limited (O&M, coal procurement)
Indian Banks
BPDB (Power Purchasing) PGCB (Transmission)
Power to GridPower sales
Loan 70%Equity 30%

Data Collection Survey on Coal Power Master Plan Follow-up in the People’s Republic of Bangladesh
3-28
Table 3-13 Imported Coal-fired Power Generation Investors (As of February 2012) Location Capacity Candidates of JV Partner
Anwara, Chittagong 1,320 MW Huadian Power Hong Kong Corporation Ltd. & BPDB
Anwara, Chittagong 282 MW Orion Group UK & BPDBAnwara, Chittagong 619 MW Unknown
Source: The Survey team
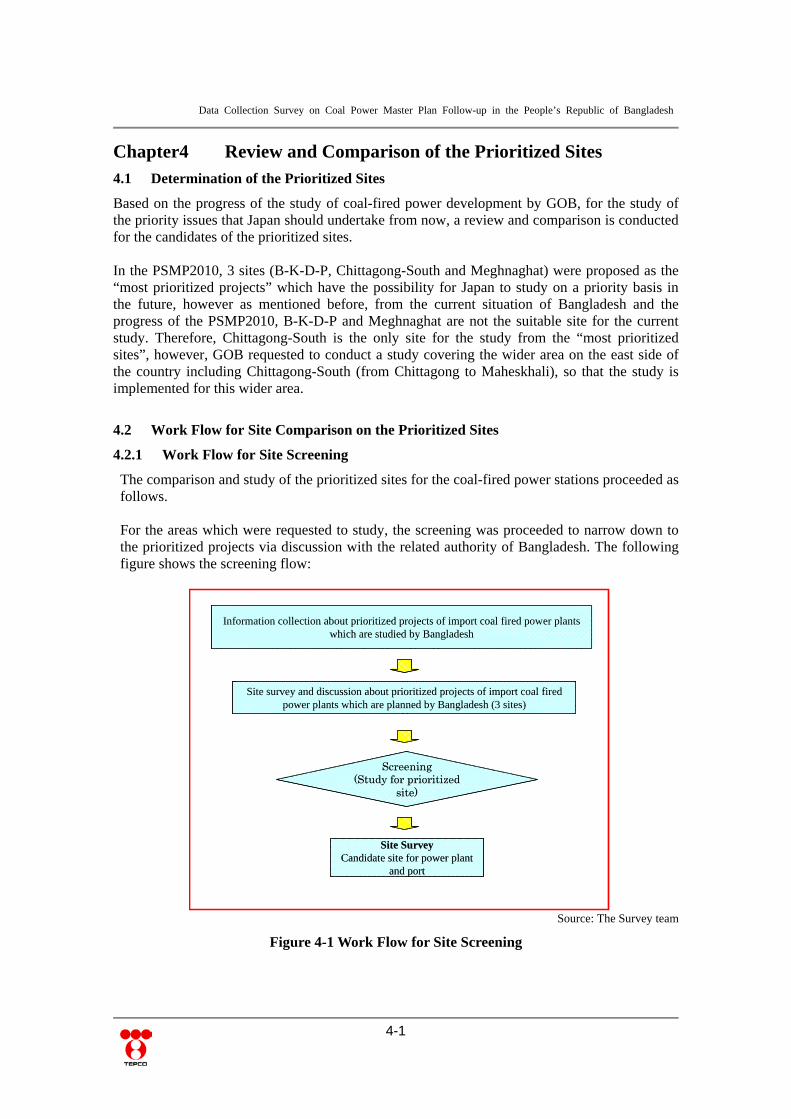
Data Collection Survey on Coal Power Master Plan Follow-up in the People’s Republic of Bangladesh
4-1
Chapter4 Review and Comparison of the Prioritized Sites 4.1 Determination of the Prioritized Sites
Based on the progress of the study of coal-fired power development by GOB, for the study of the priority issues that Japan should undertake from now, a review and comparison is conducted for the candidates of the prioritized sites.
In the PSMP2010, 3 sites (B-K-D-P, Chittagong-South and Meghnaghat) were proposed as the “most prioritized projects” which have the possibility for Japan to study on a priority basis in the future, however as mentioned before, from the current situation of Bangladesh and the progress of the PSMP2010, B-K-D-P and Meghnaghat are not the suitable site for the current study. Therefore, Chittagong-South is the only site for the study from the “most prioritized sites”, however, GOB requested to conduct a study covering the wider area on the east side of the country including Chittagong-South (from Chittagong to Maheskhali), so that the study is implemented for this wider area.
4.2 Work Flow for Site Comparison on the Prioritized Sites
4.2.1 Work Flow for Site Screening
The comparison and study of the prioritized sites for the coal-fired power stations proceeded as follows.
For the areas which were requested to study, the screening was proceeded to narrow down to the prioritized projects via discussion with the related authority of Bangladesh. The following figure shows the screening flow:
Information collection about prioritized projects of import coal fired power plants which are studied by Bangladesh
Screening(Study for prioritized
site)
Site survey and discussion about prioritized projects of import coal fired power plants which are planned by Bangladesh (3 sites)
Site SurveyCandidate site for power plant
and port
Source: The Survey team
Figure 4-1 Work Flow for Site Screening

Data Collection Survey on Coal Power Master Plan Follow-up in the People’s Republic of Bangladesh
4-2
4.2.2 Comparison Item
For the screening, the site survey for each site was implemented from the following perspectives, and the comparison and study for the results was implemented. Needs in Bangladesh (government)
After authorization of PSMP2010, the GOB is implementing the study of the concrete plan by selecting prioritized sites for the imported coal-fired power station. In the Survey, the study should be implemented with the consideration of the prioritized sites by GOB in mind.
Land acquisition The status or perspective of land acquisition for the plant is an important item for site comparison as it relates directly to the feasibility of development.
Port facility The port facility for the imported coal is essential for the prioritized site for the imported coal-fired power station; the preparation item is a major item for the Survey.
Cost Not only investment costs for construction, but also the total operation cost for the long term should be compared.
Operational risk The risk during the actual operation should be compared.
Environmental and social considerations The extraction of issues and the Survey for measures concerning environmental and social considerations should be necessary at the stage of site comparison as they are direct obstacles to construction and operation.
4.2.3 Sites for Comparison
The sites for comparison are determined as follows. The sites which GOB requested to study are Chittagong, Chittagong-South and Matarbari, which were recommended in the PSMP2010. In addition, the site where the GOB is currently studying to develop a large scale power station is close to Matarbari (south side). The biggest reason why Matarbari was selected in the PSMP2010 was that there is a deep sea area around Matarbari which means large vessels would be enable to access the potential site. In addition, at that time the LNG terminal was planned in the Matarbari area so that a synergy was expected via cooperative development. From those points, Maheskhali also has the advantage that large vessels could access the site, so that it could be a candidate site. Therefore, in the Survey, Maheskhali is also added as a candidate site for comparison which is equivalent to Matarbari site. The locations of the candidate sites are as follows:
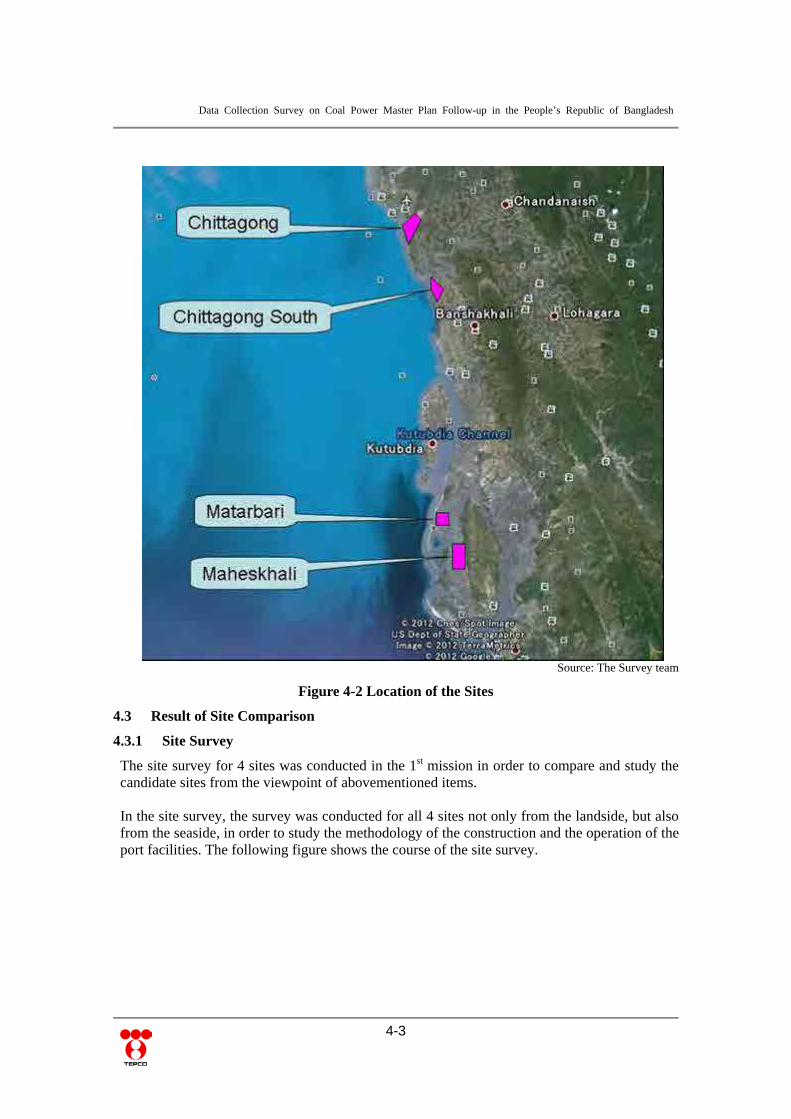
Data Collection Survey on Coal Power Master Plan Follow-up in the People’s Republic of Bangladesh
4-3
Source: The Survey team
Figure 4-2 Location of the Sites
4.3 Result of Site Comparison
4.3.1 Site Survey
The site survey for 4 sites was conducted in the 1st mission in order to compare and study the candidate sites from the viewpoint of abovementioned items.
In the site survey, the survey was conducted for all 4 sites not only from the landside, but also from the seaside, in order to study the methodology of the construction and the operation of the port facilities. The following figure shows the course of the site survey.

Data Collection Survey on Coal Power Master Plan Follow-up in the People’s Republic of Bangladesh
4-4
72km
1. Chittagong(Anwara)
2. Chittagong South(Sangu)
3. Maheskhali(Matarbari)
Bay of Bengal
Sangu River
60km
28km
Kamaphuli River
ChittagongCity
Cox’s BazarCity
MognamaGhat
72km
1. Chittagong(Anwara)
2. Chittagong South(Sangu)
3. Maheskhali(Matarbari)
Bay of Bengal
Sangu River
60km
28km
Kamaphuli River
ChittagongCity
Cox’s BazarCity
MognamaGhat
Kamaphuli River
ChittagongCity
Cox’s BazarCity
MognamaGhat
Source: The Survey team
Figure 4-3 Course of Site Survey
4.3.2 Evaluation Result for Each Items
For the comparison and study of the 4 sites, the design specifications of the coal-fired power plant are determined first as follows. These specifications are common for all 4 sites.
Table 4-1 Power Plant Design Specifications Items Specification
Type USC 600MW x 2
(Construction starts with 6 months interval for Unit 2.) Coal Low quality coal (approx. 5,100kcal/kg) Coal
consumption 1.75 mil. ton / year per unit
Cooling system Cooling tower
(Sea water circulation type is also studied depending on environmental condition.)
Water River or deep well (Seawater desalination system is also considered.)
Environmental Equipment
Flue gas denitrification equipment, flue gas desulfurization equipment, electrostatic precipitator
Source: The Survey team
The USC (Ultra Super Critical) steam condition is selected for applied technology type.
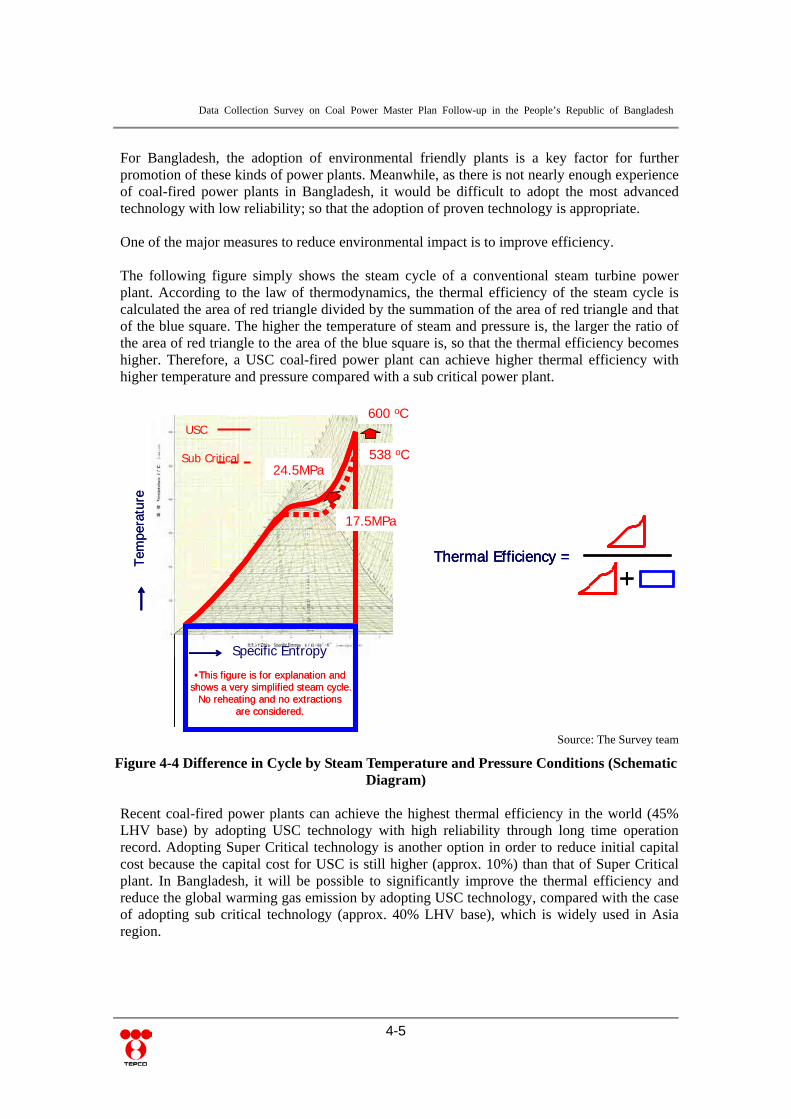
Data Collection Survey on Coal Power Master Plan Follow-up in the People’s Republic of Bangladesh
4-5
For Bangladesh, the adoption of environmental friendly plants is a key factor for further promotion of these kinds of power plants. Meanwhile, as there is not nearly enough experience of coal-fired power plants in Bangladesh, it would be difficult to adopt the most advanced technology with low reliability; so that the adoption of proven technology is appropriate.
One of the major measures to reduce environmental impact is to improve efficiency.
The following figure simply shows the steam cycle of a conventional steam turbine power plant. According to the law of thermodynamics, the thermal efficiency of the steam cycle is calculated the area of red triangle divided by the summation of the area of red triangle and that of the blue square. The higher the temperature of steam and pressure is, the larger the ratio of the area of red triangle to the area of the blue square is, so that the thermal efficiency becomes higher. Therefore, a USC coal-fired power plant can achieve higher thermal efficiency with higher temperature and pressure compared with a sub critical power plant.
17.5MPa
24.5MPa538 oC
600 oC
•This figure is for explanation and shows a very simplified steam cycle.
No reheating and no extractions are considered.
Tem
pera
ture
Specific Entropy
USC
Sub Critical
Thermal Efficiency =
+
17.5MPa
24.5MPa538 oC
600 oC
•This figure is for explanation and shows a very simplified steam cycle.
No reheating and no extractions are considered.
Tem
pera
ture
Specific Entropy
USC
Sub Critical
Thermal Efficiency =
+Thermal Efficiency =
+
Source: The Survey team
Figure 4-4 Difference in Cycle by Steam Temperature and Pressure Conditions (Schematic Diagram)
Recent coal-fired power plants can achieve the highest thermal efficiency in the world (45% LHV base) by adopting USC technology with high reliability through long time operation record. Adopting Super Critical technology is another option in order to reduce initial capital cost because the capital cost for USC is still higher (approx. 10%) than that of Super Critical plant. In Bangladesh, it will be possible to significantly improve the thermal efficiency and reduce the global warming gas emission by adopting USC technology, compared with the case of adopting sub critical technology (approx. 40% LHV base), which is widely used in Asia region.

Data Collection Survey on Coal Power Master Plan Follow-up in the People’s Republic of Bangladesh
4-6
Source: The Survey team
Figure 4-5 Development of Coal-fired Power Generation Technology Also, there are other environmental measures other than anti-global warming measures, such as denitrification, desulfurization, and dust collection technology and etc. As there are many invaluable natural environments in Bangladesh and it is important to take sentiments of local residents near power stations into account, these types of environmental measures are also essential.
4.3.3 Evaluation Result for Each Item
The evaluation result for each item per the site survey and the information collected from the relevant authorities is as follows.
1) Needs in Bangladesh (Government) The result of comparison of 4 potential sites from the view of needs in Bangladesh is as follows,
Table 4-2 Comparison of Needs in Bangladesh Items Chittagong Chittagong-South Matarbari Maheskhali
Needs in Bangladesh
After PSMP2010, GOB is preferentially conducting study for development. Currently JV with Chinese Company (China Huadian Hong Kong) is planned.
Low priority due to sedimentation speed in the Sangu estuary, necessity of resettlement and so on.
Recommended as a candidate site with deep sea in PSMP2010. GOB recognizes as one of the candidate sites with Maheskhali.
After PSMP2010, GOB is studying large scale energy terminal includingcoal and LNG port.
Source: The Survey team

Data Collection Survey on Coal Power Master Plan Follow-up in the People’s Republic of Bangladesh
4-7
The priority for the development of Chittagong and Maheskhali is high. However, considering the development by Japanese support, the priority of the Chittagong site is not so high enough because a joint development with a Chinese company is already planned. Meanwhile, Matarbari is recognized as a candidate site with deep sea as well as Maheskhali.
2) Land Acquisition The procedures for the land acquisition in Bangladesh are as follows according to GOB,
(1) Preparation of proposal for land acquisition --- approval (2) Collection of information about land (conducted mainly by BPDB) (3) Preparation of proposal and opinions for land acquisition by the local
government (4) Approval by the Ministry of Land (5) Land acquisition
Reportedly, the procedure generally takes about 6 months unless any interruptions occur. However, in case the resettlement is needed, it takes further time to negotiate with the local residents. The results of the confirmation from GOB concerning land acquisition are as follows. For Chittagong, there are some lands owned by local residents or some small villages, so land acquisition excluding these areas is required. According to GOB, the acquisition procedures of 2,000 acres was on going and is planned to be completed by Feb.7 2012, however only 15% of the land was acquired due to protests from some environmental communities. It is expected that it will take approximately another one year to acquire the whole lands as planned. For Maheskhali, according to GOB, the procedure for the acquisition for the land of 3,000 acres (which corresponds to the site of South-Maheskhali described later) has just started and is currently in its preparatory stages of abovementioned (1). GOB is assuming that the procedures will be smooth because the settlements are limited and most of the lands are consisted of salt farms. For Chittagong-South and Matarbari, no concrete action has been taken at this stage. As for Chittagong-South, there are some villages with local residents of approximately 40 families equal to 200 to 300 persons, and the villages have to be resettled. For Matarbari, since there are approximately 10,000 local residents lived in southern part of the site, the land acquisition requires the northern part of the land in order to avoid the residential area. Even so, it might be possible for some hundred of local residents to be resettled.
3) Port Facility The following shows the comparison of port facilities.

Data Collection Survey on Coal Power Master Plan Follow-up in the People’s Republic of Bangladesh
4-8
Table 4-3 Comparison of Port Facility Items Chittagong Chittagong-South Matarbari Maheskhali
Max. depth 9m 9m 20~30m 20~30m Class of vessels (DWT)
20,000 20,000 80,000 80,000
Berth Jetty Jetty Direct quay Direct quay
Breakwater No need
(use existing port)
Need Need
No need (Sandbanks can
be used as “natural
breakwater”) Source: The Survey team
The class of vessels is restricted depending on the maximum depth of the port. For Chittagong and Chittagong-South, there is no area with deep sea around the sites; the port with 9 meter depth could be constructed. Therefore the maximum vessel class is assumed to be 20,000 DWT. Meanwhile, as for Matarbari/Maheskhali, there are deep sea areas with 20 to 30 meter depth around the sites, by utilizing these areas, 80,000 DWT class vessel or larger Panamax or Cape class vessel could approach to the port facilities. About the type of berth, in case the depth near the quay is shallow, the berth should be prepared offshore and jetty with the unloading facility is needed. Such jetty facility will be needed for Chittagong and Chittagong-South. Especially in the case of Chittagong-South, since the sea is shallow for a good distance from the quay, the jetty with the length of 3 to 5km is needed. For reference, the following picture is the jetty of Kamiiso Factory, Taiheiyo Cement in Japan, which is 2km long.
Source: The Survey team
Figure 4-6 Example of Long Jetty (Kamiiso Factory, Taiheiyo Cement) Meanwhile, as for Matarbari and Maheskhali, as the construction method to secure necessary depth through the quay of the power station is examined, no jetty is needed and vessels will be accessed to the quay directly. The following photo shows the image of the direct quay.
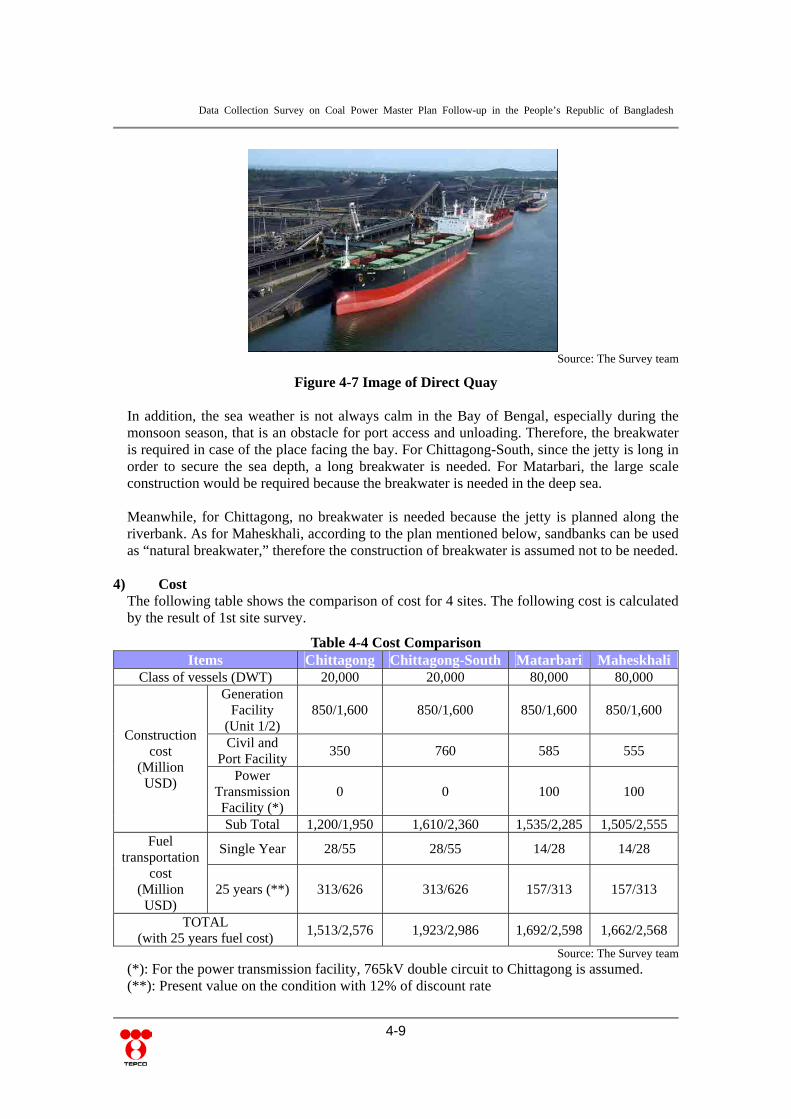
Data Collection Survey on Coal Power Master Plan Follow-up in the People’s Republic of Bangladesh
4-9
Source: The Survey team
Figure 4-7 Image of Direct Quay In addition, the sea weather is not always calm in the Bay of Bengal, especially during the monsoon season, that is an obstacle for port access and unloading. Therefore, the breakwater is required in case of the place facing the bay. For Chittagong-South, since the jetty is long in order to secure the sea depth, a long breakwater is needed. For Matarbari, the large scale construction would be required because the breakwater is needed in the deep sea. Meanwhile, for Chittagong, no breakwater is needed because the jetty is planned along the riverbank. As for Maheskhali, according to the plan mentioned below, sandbanks can be used as “natural breakwater,” therefore the construction of breakwater is assumed not to be needed.
4) Cost The following table shows the comparison of cost for 4 sites. The following cost is calculated by the result of 1st site survey.
Table 4-4 Cost Comparison Items Chittagong Chittagong-South Matarbari Maheskhali
Class of vessels (DWT) 20,000 20,000 80,000 80,000
Construction cost
(Million USD)
Generation Facility
(Unit 1/2) 850/1,600 850/1,600 850/1,600 850/1,600
Civil and Port Facility
350 760 585 555
Power Transmission Facility (*)
0 0 100 100
Sub Total 1,200/1,950 1,610/2,360 1,535/2,285 1,505/2,555Fuel
transportation cost
(Million USD)
Single Year 28/55 28/55 14/28 14/28
25 years (**) 313/626 313/626 157/313 157/313
TOTAL (with 25 years fuel cost)
1,513/2,576 1,923/2,986 1,692/2,598 1,662/2,568
Source: The Survey team (*): For the power transmission facility, 765kV double circuit to Chittagong is assumed. (**): Present value on the condition with 12% of discount rate

Data Collection Survey on Coal Power Master Plan Follow-up in the People’s Republic of Bangladesh
4-10
In the construction cost part, for the generation facility, the same values are set for each site as the same specification of the facility is applied. The value is determined from PSMP 2010 as a reference. For the civil and port facility, as mentioned above, a long jetty and breakwater is required for the Chittagong-South site so that its cost is the highest among 4 sites. For Maheskhali, the cost for the dredging and landfill is needed, however cheaper than Chittagong-South because there is no need of breakwater. The cost for Matarbari is higher than that for Maheskhali because of the necessity of the breakwater. For the power transmission facility, as the only line to Chittagong is concerned in this comparison, there is no need for the Chittagong and Chittagong-South site, however approximately 70km of line is needed for Matarbari and Maheskhali site (765kV double circuit is assumed). In conclusion for the construction part, the result of cost is following order from high to low; Chittagong-South > Matarbari > Maheskhali > Chittagong. Next, the fuel transportation cost is compared as a part of the operation costs. As other operation costs are assumed to be almost the same for each site, a comparison has not been conducted. To simplify, the fuel transportation cost is calculated by multiplying fuel consumption and the unit price (per ton) of transportation cost (transportation from Indonesia is assumed) which is researched based on the market classified by the class of vessels. The calculation is implemented not only for a single year but also for the present value discounted back for 25 years (12% of the discount rate is assumed). As the above table shows, both the construction cost and the summation of construction and the operational costs of the Chittagong-South site is the highest among the 4 sites. In the case of a comparison between Chittagong and Matarbari/Maheskhali, the cost of Chittagong is cheaper for only 1 unit, however, the total cost including the operational costs for 2 units of Maheskhali is slightly cheaper than that of Chittagong. It indicates that the more fuel is consumed, the more beneficial on the cost for long run, because of the scale merit of the large vessel.
5) Operational Risk One of the most important conditions for the stable operation of coal-fired power plants is the stable fuel supply. The difference among 4 sites regarding fuel supply is the class of vessels. The required numbers of shipment for coal per year for each site are as follows.
Table 4-5 Comparison of the Numbers of Shipment per Year Items Chittagong Chittagong-South Matarbari Maheskhali
Class of vessels (DWT)
20,000 20,000 80,000 80,000
Required numbers of
shipment per year
(600MWx2)
Approx. 175 Approx. 175 Approx. 45 Approx. 45
Source: The Survey team

Data Collection Survey on Coal Power Master Plan Follow-up in the People’s Republic of Bangladesh
4-11
As shown above, in the case of coal transportation of 20,000 DWT class vessels, roughly once every 2 days transportation is needed. Concerning the sea weather during the monsoon season and the hit of cyclones, it is judged to be very risky for the stable supply. In addition, regarding the coal shipment, as mentioned in Chapter 6, the depth of 9 meter may not be enough for 20,000DWT class vessels. In that case, it would be likely that the size of the vessels in real operation might be some thousand DWT class. This means that it would be very risky for the stable procurement of coal by using small size vessels so that there is very little chance to be realized.
6) Environment and Social Considerations Regarding the environment and social considerations, every site except Maheskhali was studied in the PSMP2010, especially for the Chittagong site, a more detailed study was conducted. In the Survey, in reviewing the results of PSMP2010 as a reference, a comprehensive study was conducted for 4 sites by collecting additional data and information for the characteristic issues. The following table shows the results of the study.

Data Collection Survey on Coal Power Master Plan Follow-up in the People’s Republic of Bangladesh
4-12
Table 4-6 Comparison of the Major Environment and Social Influences Items Chittagong Chittagong-South Matarbari Maheskhali
Natural environment
Area of natural environment is limited as the area is mostly agricultural land.
Area of natural environment is limited as the area is mostly agricultural land.
A good distance from precious natural environment such as ECA
Precious natural environment still remains in the area.-ECA* (Sonadia Island) -Mudflat/mangrove-Rare species (e.g. birds, sea turtles)
Social environment
-Large-scale resettlement and land acquisition required. -Difficulty of land acquisition (e.g. private land, opposition by local resident)
-Major alteration of existing land use required.(e.g. agriculture)
-Close to tourist beach. -Hindrance to airport navigation.
-Resettlement may be required. -Major alteration of existing land use required. (e.g. agriculture)
-Small scale resettlement maybe required. (There are villages with 10,000 of population in southern area close to the site, it needs to be concerned.)
-No resettlement is needed, or very small scale if it needs. -Minor alteration of existing land use. (e.g. salt farming, aquaculture)
Pollution
Accumulative impacts with neighboring industries are a concern.
No major impacts, if latest pollution prevention technologies are applied.
No major impacts, if latestpollution prevention technologies are applied.
No major impacts, If latest pollution prevention technologies are applied.
Summary
Natural: good Social: inferior Pollution: standard
Natural: good Social: standard Pollution: good
Natural: good Social: standard Pollution: good
Natural: inferior Social: good Pollution: good
Source: The Survey team (*): ECA = Environmental Critical Area As Maheskhali site is near ECA and it is pointed out that there is some possibility for rare species to be existed, consideration is required for the development.

Data Collection Survey on Coal Power Master Plan Follow-up in the People’s Republic of Bangladesh
4-13
4.3.4 Summary of Comprehensive Evaluation
The following table shows the summary of comprehensive evaluation.
Table 4-7 Summary of Evaluation Sites Items
Chittagong Chittagong-South Matarbari Maheskhali
Needs in Bangladesh △ × ○ ◎ Land acquisition △ × × △
Port facility △ △ ○ ◎ Cost ◎ △ ○ ○
Operation risk △ △ ◎ ◎
Environment and social
issues
Natural environment
○ ○ ○ ×
Social environment
× △ △ ○
Pollution △ ○ ○ ○ (◎: superior, ○: good, △: standard, ×: inferior)
Source: The Survey team The JICA Survey team gave weight to “Needs in Bangladesh” and “Operation risks”. In order to evaluate the issues which Japan should tackle, it is obvious that one of the necessary conditions should be the needs in Bangladesh. It should be compared by considering the progress of other issues in Bangladesh. It should be avoided the situation where the sustainability of the project is questionable in future due to operational issues. Therefore, when taking account of two points particularly, Matarbari and Maheskhali site would be judged as the most prioritized sites.
4.4 Result of Site Survey for the Prioritized Site
For the Matarbari/Maheskhali site which has been selected above as the prioritized site, a detailed survey was conducted in the 2nd mission.
4.4.1 Schedule of the Site Survey
The schedule of Maheskhali site survey in the2nd mission is as follows.
Table 4-8 Schedule of Maheskhali Site Survey Date Contents
Jan. 31, 2012 Move Dhaka --> Cox’s Bazar Feb. 1, 2012 Maheskhali site survey (sea side) Feb. 2, 2012 Maheskhali site survey (land side) Feb. 3, 2012 Move Cox’s Bazar --> Dhaka
Source: Survey team

Data Collection Survey on Coal Power Master Plan Follow-up in the People’s Republic of Bangladesh
4-14
Source: the Survey team
Figure 4-8 Route of Site Survey (Sea Side)
Source: the Survey team
Figure 4-9 Route of Site Survey (Land Side)

Data Collection Survey on Coal Power Master Plan Follow-up in the People’s Republic of Bangladesh
4-15
4.4.2 Contents of the Survey
1) Outline of Prioritized Site
As mentioned in the previous chapter, GOB is studying to develop large scale thermal power stations at Maheskhali. The following figure shows the land which is under process of acquisition for the construction.
Source: CEGIS Documents
Figure 4-10 Plan Being Studied by GOB This plan has some concerns such as the necessity of mangrove felling for the construction of navigation channel and closeness of the area to the Environment Critical Area (ECA) on the south side. Separated from this plan, the Survey team studied the following site in the same Maheskhali Island by concerning that 1) the navigation channel should be constructed by avoiding mangrove, 2) the site should be located on the north side for the environmental measures, and 3) 600MWx2 should be developed.
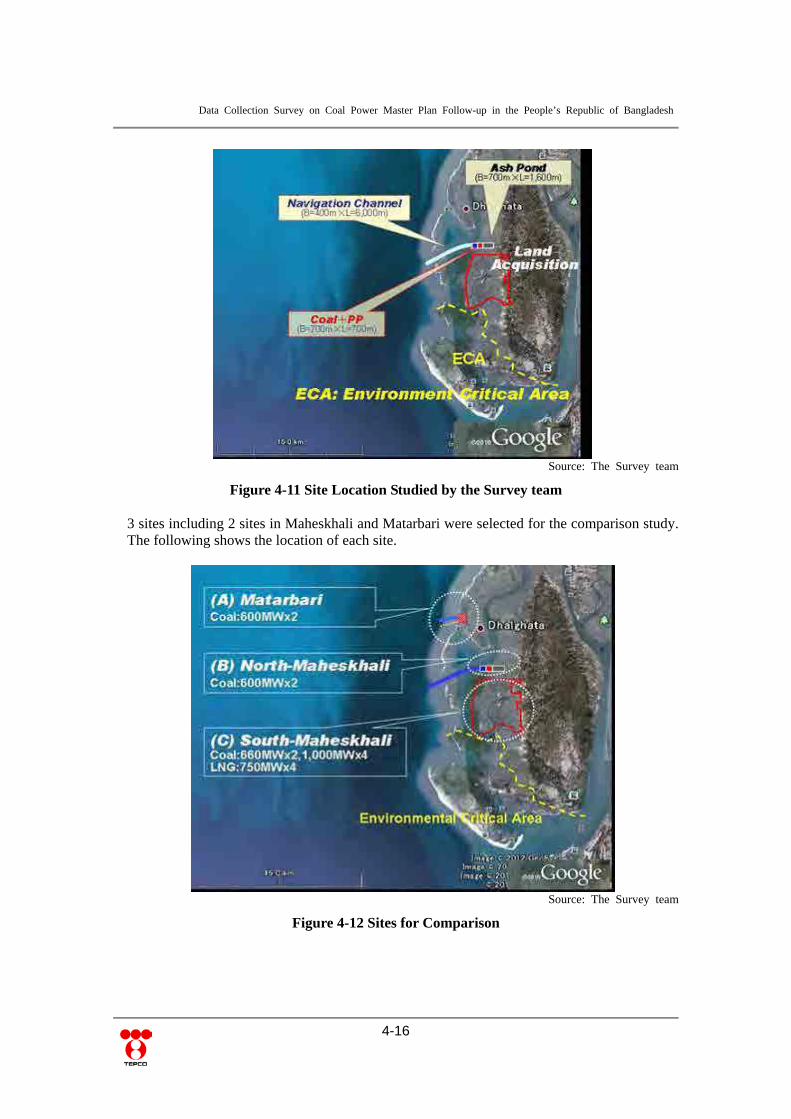
Data Collection Survey on Coal Power Master Plan Follow-up in the People’s Republic of Bangladesh
4-16
Source: The Survey team
Figure 4-11 Site Location Studied by the Survey team
3 sites including 2 sites in Maheskhali and Matarbari were selected for the comparison study. The following shows the location of each site.
Source: The Survey team
Figure 4-12 Sites for Comparison

Data Collection Survey on Coal Power Master Plan Follow-up in the People’s Republic of Bangladesh
4-17
2) Survey Result of Prioritized Sites
The following table is the comparison of prioritized sites based on the result of the site survey and data collection.
Table 4-9 Result of Site Comparison
Item for evaluation Matarbari
North
MaheskhaliSouth
Maheskhali Notes
Impacts on endangered species (e.g.: migratory birds, sea turtles, dolphins)
3 1 1 IEE/EIA is planned by BPDB
Recognition point where endangered
birds is existed near site
Recognition point where endangered
birds is existed near site
Impacts on ECA (Sonadia ECA)
3 2 1 IEE/EIA is planned by BPDB
5km from Sonadia ECA
10 km from Sonadia ECA
2km from Sonadia ECA
Impact for social environment (Land usage, resettlement, residents)
1 2 2 IEE/EIA is planned by BPDB
Some resident (salt field)
Less resident (salt field)
Less resident (salt field)
Construction cost (excluding port)
2 2 2
Construction cost of port (refer to Chap.5)
2 3
3
Breakwater Breakwater
required Maintenance of port (e.g.: dredging)
2 1 1
Difficulty of construction 2 3 3
Difficulty in procuring
stone material for the
breakwater
Operational efficiency (capability of large scale vessel to arrive in port)
3 3 3
Future extensibility (600MW x 2 units to 4 units)
3 3 3 IEE/EIA is planned by BPDB
Intention of GOB (relation to government’s study contents)
2 3 3 IEE/EIA is planned by BPDB
Remote to studied area
Adjacent to studied area
Within studied area
Source: The Survey team
As above, as far as current situation to the extent examined, each 3 site has no outstanding advantage. The final decision should be done after further detail study and weighting for the important items. For North-Maheskhali and Matarbari excluding South-Maheskhali which is studied by GOB, the concrete design is studied as follows.

Data Collection Survey on Coal Power Master Plan Follow-up in the People’s Republic of Bangladesh
4-18
3) Study for Maheskhali Site
The basic plan studied for North Maheskhali is shown as follows.
Source: The Survey team
Figure 4-13 Basic Plan for Maheskhali The navigation channel is constructed in order to obtain enough depth by dredging. The route should be carefully selected not to fell mangrove. In the future, the development toward south direction and the construction of 2nd navigation channel by selecting the route without mangrove felling could be preceded However, the land for North Maheskhali is outside of the area where GOB is planning so that the additional land acquisition should be required. If the land acquisition for North Maheskhali is difficult, the northern part of the area where GOB is studying could also be used. The following figures show the plane-view and the cross-section of the layout for the construction of this site.
New land to be required additionally

Data Collection Survey on Coal Power Master Plan Follow-up in the People’s Republic of Bangladesh
4-19
Maheskhali Island
MatarbariIsland
B=250m
Coal Storage Yard New Power Plant
Port
500m
Access RoadNavigationChannel
Sandbank
Sandbank
700m 1500m
2,700m
Ash Pond6,000m
Navigation Channel Cross sectionB=250m
H=15mSandbank
BayOf
Bengal High Hill AreaLow Hill Area (Tidal)
700m
Maheskhali IslandMatarbari
Island
B=250m
Coal Storage Yard New Power PlantCoal Storage Yard New Power Plant
Port
500m
Access RoadNavigationChannel
Sandbank
Sandbank
NavigationNavigationNavigationChannelChannelChannel
Sandbank
Sandbank
Sandbank
700m 1500m
2,700m
Ash Pond6,000m
Navigation Channel Cross sectionB=250m
H=15mSandbank
BBeennggaa
B
BBBe
BaO
en
ayOfng
yfgaaa
BayOf
Bengal High Hill AreaHigh Hill AreaHigh Hill AreaHigh Hill AreaHigh Hill AreaHigh Hill AreaHigh Hill AreaHigh Hill AreaHigh Hill AreaLow Hill Area (Tidal)Low Hill Area (Tidal)Low Hill Area (Tidal)Low Hill Area (Tidal)Low Hill Area (Tidal)Low Hill Area (Tidal)Low Hill Area (Tidal)Low Hill Area (Tidal)Low Hill Area (Tidal)Low Hill Area (Tidal)Low Hill Area (Tidal)Low Hill Area (Tidal)Low Hill Area (Tidal)Low Hill Area (Tidal)Low Hill Area (Tidal)Low Hill Area (Tidal)
700m
Source: The Survey team
Figure 4-14 Basic Design (Plane View)
Sheet PileDredging
New Power Plant
Coal Storage yard
Jetty(Direct)
Navigation Channel
Ash Pond
H=20mBack Fill
H=10~15m
Maheskhali Island
BayOf
Bengal
High Hill Area
Low Hill Area (Tidal)
Sheet PileDredging
New Power PlantNew Power Plant
Coal Storage yard
Jetty(Direct)
Navigation Channel
Ash Pond
H=20mBack Fill
H=10~15m
Maheskhali Island
BayOf
Bengal
BayOf
Bengal
High Hill AreaHigh Hill Area
Low Hill Area (Tidal)Low Hill Area (Tidal)
Source: The Survey team
Figure 4-15 Basic Design (Cross-Section)

Data Collection Survey on Coal Power Master Plan Follow-up in the People’s Republic of Bangladesh
4-20
The following shows the aerial photo of this area.
Source: The Survey team
Figure 4-16 Aerial Photo around North Maheskhali
The following figure shows the image of the development.
Source: The Survey team
Figure 4-17 Complete Image for the Planned Coal-fired Power Station (600MWx2)

Data Collection Survey on Coal Power Master Plan Follow-up in the People’s Republic of Bangladesh
4-21
Source: The Survey team
Figure 4-18 Future Image 4) Study of Alternative Sites in Matarbari
It is clear that there are some concerns regarding environmental issues such as endangered species and mangrove around Maheskhali area. Further environmental considerations will be required particularly for the south side of Maheskhali because there is Sonadia ECA area in the south side. On the contrary, Matarbari site seems to have an advantage in the environmental issues because it is located north of Maheskhali. The following figures show the result of the study for the development plan for Matarbari Island.

Data Collection Survey on Coal Power Master Plan Follow-up in the People’s Republic of Bangladesh
4-22
BayOf
Bengal
Maheskhali Island
Sandbank
Matarbari Island
Coal Storage Yard New Power PlantPort
Ash Pond
B=400m,L=2,000m
500m
NavigationChannel
700m 700m
1,900m
700m
Break Water
Matarbari Site
BayOf
Bengal
Maheskhali Island
Sandbank
Matarbari Island
Coal Storage Yard New Power PlantPort
Ash Pond
B=400m,L=2,000m
500m
NavigationChannel
700m 700m
1,900m
700m
Break Water
500m
NavigationChannel
700m 700m
1,900m
700m
Break Water
Matarbari Site
Source: The Survey team
Figure 4-19 Development Plan of Matarbari Island The following shows the aerial photos of Matarbari area.
Source: The Survey team
Figure 4-20 Aerial Photo around Matarbari

Data Collection Survey on Coal Power Master Plan Follow-up in the People’s Republic of Bangladesh
4-23
The construction of a 600MWx2 coal-fired power station in Matarbari site is also possible; however, the following points should be considered, The width of the island (east-west side) is only about 2 to 3 km, so that the land space for
the navigation channel is not long enough to slow down for vessels. In the future, the expansion to 600MW x 4units would be possible, however, the extensibility for the large-scale port facility is limited.
The breakwater is required as it is facing ocean, so that the construction cost would be higher.
There are villages with the population of around 10,000 people in the south side. It could be possible to develop the power plants (including above extension) away from such villages. Even so, the social consideration would be needed.
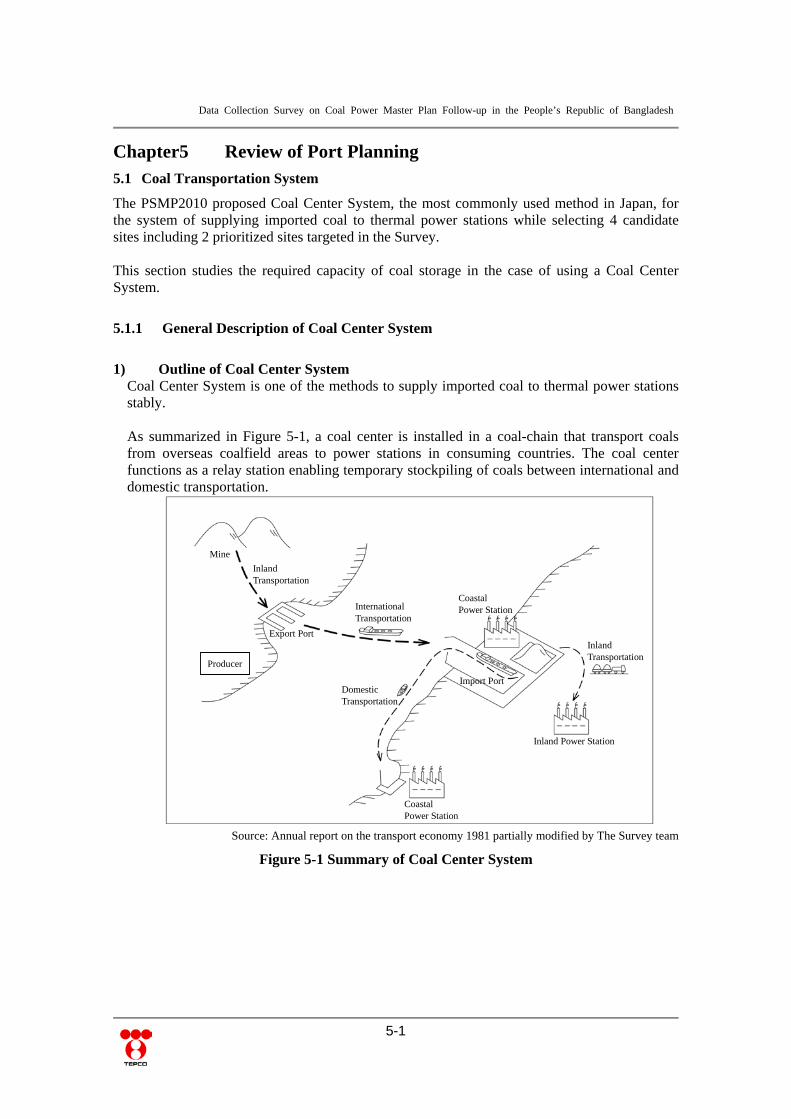
Data Collection Survey on Coal Power Master Plan Follow-up in the People’s Republic of Bangladesh
5-1
Chapter5 Review of Port Planning 5.1 Coal Transportation System
The PSMP2010 proposed Coal Center System, the most commonly used method in Japan, for the system of supplying imported coal to thermal power stations while selecting 4 candidate sites including 2 prioritized sites targeted in the Survey.
This section studies the required capacity of coal storage in the case of using a Coal Center System.
5.1.1 General Description of Coal Center System
1) Outline of Coal Center System
Coal Center System is one of the methods to supply imported coal to thermal power stations stably. As summarized in Figure 5-1, a coal center is installed in a coal-chain that transport coals from overseas coalfield areas to power stations in consuming countries. The coal center functions as a relay station enabling temporary stockpiling of coals between international and domestic transportation.
Mine
Inland Transportation
Producer
International Transportation
Coastal Power Station
Inland Power Station
Coastal Power Station
Export Port
Import Port Domestic Transportation
Inland Transportation
Source: Annual report on the transport economy 1981 partially modified by The Survey team
Figure 5-1 Summary of Coal Center System

Data Collection Survey on Coal Power Master Plan Follow-up in the People’s Republic of Bangladesh
5-2
2) Characteristics of Coal Center System
Coal Center System is characterized as a system that enables: Reduction of primary transport cost by benefitting from mass transit utilizing
large-scale coal ships and the stockpiling function of a coal center, Reduction of investment for the power station by integrating port facilities, coal stock
facilities and others, and Contribution to stable coal feeding provided by coal centers’ large capacity that
facilitates securing coal supply even in the case of supply fluctuation, caused by working stoppage in the overseas coal field areas and others.
3) Coal Center in Japan and Its Application in Bangladesh
Onahama Coal Center owned by Tokyo Electric Power Company is one of the major coal centers in Japan. Its purpose is to act as a relay station for supplying imported coal to Hirono Thermal Power Station. Since the exclusive-use port facilities of Hirono Thermal Power Station were initially constructed to accommodate domestic vessels of 10,000 DWT-class, its shallow waterway depth of D.L.-10.0m does not allow international coal ships with Panamax dimensions (60,000~80,000DWT) to arrive. Therefore, a coal center was constructed at Onahama Port, equipped with facilities to accommodate such international vessels, where imported coals are primarily unloaded, temporarily stockpiled and transshipped to 12,000DWT-class domestic vessels for secondary transfer to Hirono. Onahama Port is located 30km south of Hirono. Water depth is equal to 10m or less in the nearshore region of Bangladesh except the region of Maheskhali and southward. This restricts the possible dimension of coal vessels to 10,000 to 20,000DWT. Therefore, in order for economical and stable procurement of imported coal, it appears promising to adopt a Coal Center System as in the case of the Onahama Coal Center.
5.1.2 Required Capacity of Coal Storage
1) Procedure of Receiving Coal assumed in the PSMP2010
In the PSMP2010, seven (7) sites listed in Table 5-1 have been proposed as the candidate sites for an imported coal-fired power station. The assumed procedure of receiving coal to the candidate sites is as follows: Khulna: Secondary transfer from the Coal Center to be installed at adjacent Mongla
Port Chittagong: Secondary transfer from the Coal Center to be installed at
Chittagong-South utilizing Chittagong Port Chittagong-South and Matarbari: Secondary transfer from the Coal Center to be
installed onsite Meghnaghat, Maowa, Zajira: Secondary transfer by barge vessels from the Coal Center.
Khulna, Chittagong-South and Maheskhali will be equipped with Coal Centers. The following study is intended for Maheskhali which the PSMP2010 nominated as Matarbari Site and Bangladesh side is also aiming at.

Data Collection Survey on Coal Power Master Plan Follow-up in the People’s Republic of Bangladesh
5-3
Table 5-1 Candidate Sites for Imported Coal-fired Power Stations in PSMP2010 Sites Characteristics Capacity
1 Khulna Existing Mongla port + Coal center 2×600MW 2 Chittagong Existing Chittagong port 2×600MW 3 Chittagong-South Port facility for import vessels + Coal center 1×600MW 4 Matarbari Port facility for import vessels + Coal center 4×600MW 5 Meghnaghat Berge transportation from Coal center 1×600MW 6 Maowa Berge transportation from Coal center 2×600MW 7 Zajira Berge transportation from Coal center 1×600MW
Total 600MW×13unit=7,800MW Source: PSMP2010
2) Required Capacity of Coal Storage in Imported Coal-fired Power Stations
Considering the impact due to adverse sea conditions as well as working stoppage in production area, the capacity of coal storage is generally set to meet the amount consumed for 40 to 60 days in an imported coal-fired power station. On the other hand, shipping in the Bay of Bengal is affected by cyclones. According to Chittagong Port Authority, cyclones occur 6 to 7 times annually and each cyclone lasts at most 6 to 10 days. Consequently, the capacity of coal storage capacity equivalent to the amount consumed for 60 days in a thermal power station should be secured to prevent operation at power stations from being affected by the period with no coal supply due to cyclones. At the candidate imported coal-fired power station sites coupled with secondary coal transportation, most of the coal for onsite stockyards can be fed from the designated coal center. In this case, it is necessary to secure an appropriate amount of coal at an onsite stockyard considering the duration without feeding due to one cyclone. As with the case of domestic coal-fired power stations, the stockyard capacity is considered to be a requirement for 15 days. In line with the above assumption, the capacity of onsite stockyard at each imported coal-fired power station is estimated and summarized in Table 5-2. In the estimation, annual consumption of coal of 1,750,000t/600MW is assumed. Required amount of coal stock is set as follows: Required amount of coal stock at an imported coal-fired power station:
300,000t/600MW Required amount of coal stock at an imported coal-fired power station to be supplied by
secondary transfer from a coal center: 75,000t/600MW

Data Collection Survey on Coal Power Master Plan Follow-up in the People’s Republic of Bangladesh
5-4
Table 5-2 Required Amount of Coal Stock at Candidate Imported Coal-fired Power Stations
Sites Capacity
Capacity of stockyard
Total Onsite Coal
Center
1 Khulna A 2×600MW 150,000t 450,000t 600,000t
2 Chittagong B 2×600MW 150,000t 450,000t 600,000t
3 Chittagong-South A 1×600MW 300,000t - 300,000t
4 Matarbari/Maheskhali A 4×600MW 1200,000t - 1200,000t
5 Meghnaghat C 1×600MW 75,000t 225,000t 300,000t
6 Maowa C 2×600MW 150,000t 450,000t 600,000t
7 Zajira C 1×600MW 75,000t 225,000t 300,000t
Total 13×600MW 2,100,000t 1,800,000t 3,900,000t
Source: The Survey team
* A: Installed coal center、B: using existing port、C: secondary transfer from coal center * Coal center for Khulna to be installed at Mongla port and land transportation
5.1.3 Coal Transportation System at Imported Coal-fired Power Stations
1) Coal Transportation System of Imported Coal-fired Power Stations
Water depth is equal to 10m or less in the nearshore region of Bangladesh. This very shallow water depth restricts possible capacities of international coal vessels to 10,000 to 20,000 DWT for arrival at Mongla Port, Chittagong Port and Chittagong-South. Therefore, as described in 4.2, the number of international coal vessels would increase significantly for feeding required coal to the power stations. Coal transportation with Handymax vessels may be expensive in cost and disadvantageous for stable supply of coal. For this reason, adoption of a Coal Center System is proposed for the purpose of economical and stable procurement of overseas coal. The system needs construction of coal centers at the deep-sea area in the region of Maheskhali and southward in order to accommodate long international coal vessels. Imported coal is primarily unloaded and temporally stockpiled at coal center, followed by secondary transfer to domestic imported coal-fired power stations by small size vessels or verge vessels. Specific supply movements of the transportation system are as follows. Firstly, imported coal is transported by Panamax class long vessels to the primary coal
center at deep-sea port of Maheskhali. The secondary transfer is made by 20,000DWT class domestic vessels to the sub coal
centers in Khulna (Mongla Port) and Chittagong-South. Secondary transfer from the Coal Center to be installed at adjacent Mongla Port. The tertiary transfer feed coal from the coal center at Chittagong-South to Chittagong. Meghnaghat, Maowa and Zajira are fed by the secondary transfer with barge vessels
from the coal center at Maheskhali.

Data Collection Survey on Coal Power Master Plan Follow-up in the People’s Republic of Bangladesh
5-5
Figure 5-2 shows the basic concept of coal transportation system.
Source: The Survey team
Figure 5-2 Basic Concept of Coal Transportation System 2) Stockyard Area of Imported Coal-fired Power Stations and Coal Centers
Required area of stockyard at power stations and coal centers were estimated based on the aforesaid amount of coal stock required for the candidate sites. While coal produced at different sources are to be stocked separately and the stock area shall be determined considering such requirement, the Survey assumes that the area of 25,000 m2 is necessary for 100,000 tons of coal stockpiling based on past records. As Maheskhali Coal Center temporarily stocks coal only for transshipment to Khulna and Chittagong-South, the stockyard capacity is considered to have a requirement for 15 days as in the case of domestic coal-fired power stations. Table 5-3 shows the dimensions of coal stockyards and coal centers in the prioritized projects.
★★
★
Dhaka
Khulna
Zajira
Meghnaghat
Chittagong-South
Chittagong
Matarbari/ Maheskhali
Maowa
From Indonesia and Australia
★ :輸入炭火力発電所の優先案件 ---- :大型外航石炭船による石炭輸送 ・・・・・・・ :小型内航石炭船による石炭輸送 ・・・・・・・ :内航石炭バージによる石炭輸送 Export
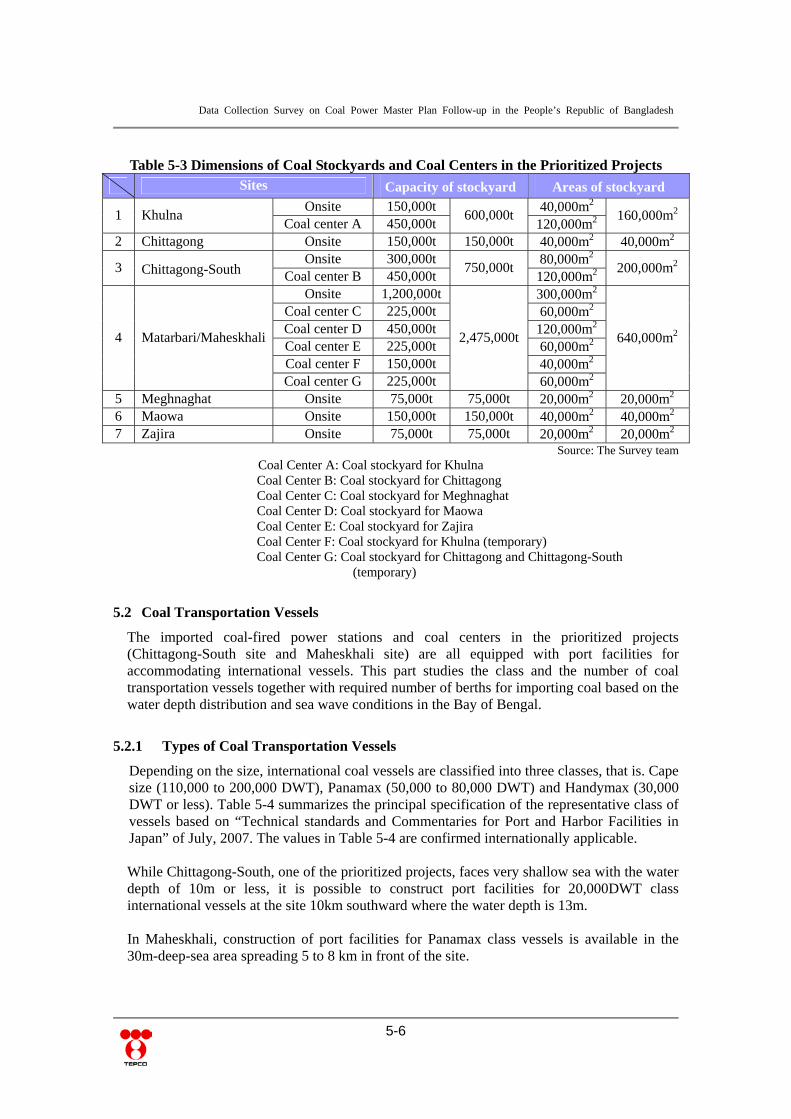
Data Collection Survey on Coal Power Master Plan Follow-up in the People’s Republic of Bangladesh
5-6
Table 5-3 Dimensions of Coal Stockyards and Coal Centers in the Prioritized Projects Sites Capacity of stockyard Areas of stockyard
1 Khulna Onsite 150,000t
600,000t 40,000m2
160,000m2
Coal center A 450,000t 120,000m2 2 Chittagong Onsite 150,000t 150,000t 40,000m2 40,000m2
3 Chittagong-South Onsite 300,000t
750,000t 80,000m2
200,000m2
Coal center B 450,000t 120,000m2
4 Matarbari/Maheskhali
Onsite 1,200,000t
2,475,000t
300,000m2
640,000m2
Coal center C 225,000t 60,000m2 Coal center D 450,000t 120,000m2 Coal center E 225,000t 60,000m2 Coal center F 150,000t 40,000m2 Coal center G 225,000t 60,000m2
5 Meghnaghat Onsite 75,000t 75,000t 20,000m2 20,000m2 6 Maowa Onsite 150,000t 150,000t 40,000m2 40,000m2 7 Zajira Onsite 75,000t 75,000t 20,000m2 20,000m2
Source: The Survey team Coal Center A: Coal stockyard for Khulna Coal Center B: Coal stockyard for Chittagong Coal Center C: Coal stockyard for Meghnaghat Coal Center D: Coal stockyard for Maowa Coal Center E: Coal stockyard for Zajira Coal Center F: Coal stockyard for Khulna (temporary) Coal Center G: Coal stockyard for Chittagong and Chittagong-South
(temporary)
5.2 Coal Transportation Vessels
The imported coal-fired power stations and coal centers in the prioritized projects (Chittagong-South site and Maheskhali site) are all equipped with port facilities for accommodating international vessels. This part studies the class and the number of coal transportation vessels together with required number of berths for importing coal based on the water depth distribution and sea wave conditions in the Bay of Bengal.
5.2.1 Types of Coal Transportation Vessels
Depending on the size, international coal vessels are classified into three classes, that is. Cape size (110,000 to 200,000 DWT), Panamax (50,000 to 80,000 DWT) and Handymax (30,000 DWT or less). Table 5-4 summarizes the principal specification of the representative class of vessels based on “Technical standards and Commentaries for Port and Harbor Facilities in Japan” of July, 2007. The values in Table 5-4 are confirmed internationally applicable. While Chittagong-South, one of the prioritized projects, faces very shallow sea with the water depth of 10m or less, it is possible to construct port facilities for 20,000DWT class international vessels at the site 10km southward where the water depth is 13m. In Maheskhali, construction of port facilities for Panamax class vessels is available in the 30m-deep-sea area spreading 5 to 8 km in front of the site.

Data Collection Survey on Coal Power Master Plan Follow-up in the People’s Republic of Bangladesh
5-7
Table 5-4 Principal Specification of the Representative Class of Coal Vessels
Deadweight tonnage
(DWT)
Length over all
Loa(m)
Length between perpendiculars
Lpp(m)
Molded breadth
B(m)
Full load draft
df(m)
2,000 82 75 13.1 4.8
5,000 107 99 17.0 6.4
12,000 139 130 21.8 8.6
20,000 161 152 25.2 10.2
70,000 233 222 32.3 13.8
150,000 292 279 44.7 17.7 Source: Technical Standards and Commentaries for Port and Harbor Facilities in Japan
(Ministry of Land, Infrastructure, Transport and Tourism)
5.2.2 Required Number of Vessels based on Coal Consumption
The required number of vessels is estimated based on the consumption in prioritized imported coal-fired power stations as well as the capacity of onsite stockyard at coal centers. In the estimation, annual coal consumption is assumed to be 1,750,000t/600MW and the vessel class is set as follows: At Maheskhali: 80,000DWT At Chittagong-South and Khulna: 20,000DWT At Chittagong, Meghnaghat, Maowa and Zajira: 5,000DWT class barge vessels
The estimated number of vessels required for receiving coal and the estimated number of vessels required for shipping coal to imported coal-fired power stations are shown in the following tables.
Table 5-5 Estimated Number of Vessels Required for Receiving Coal
Sites Coal
consumptionClass of coal
vessels Require number of
coal vessels
Matarbari/Maheskhali
Onsite 7,000,000t 80,000DWT 90
295 Coal center 1 5,250,000t 80,000DWT 70
Coal center 2 7,000,000t 80,000DWT 90
Coal center 3 3,500,000t 80,000DWT 45
Chittagong-South Onsite 1,750,000t 20,000DWT 90
265 Coal center 4 3,500,000t 20,000DWT 175
Source: The Survey team Coal center 1: Coal consumption for Chittagong and Chittagong-South Coal center 2: Coal consumption for Meghnaghat, Maowa, and Zajira Coal center 3: Coal consumption for Khulna Coal center 4: Coal consumption for Chittagong

Data Collection Survey on Coal Power Master Plan Follow-up in the People’s Republic of Bangladesh
5-8
Table 5-6 Estimated Number of Vessels Required for Shipping Coal to Power Stations
Site Coal
consumptionClass of
coal vesselsRequire number of
coal vessels
Matarbari/ Maheskhali
Coal center 1 5,250,000t 20,000DWT 265
1,840Coal center 2 7,000,000t 5,000DWT 1,400
Coal center 3 3,500,000t 20,000DWT 175
Chittagong-South Coal center 4 3,500,000t 5,000DWT 700 700
Source: The Survey team Coal center 1: Coal consumption for Chittagong and Chittagong-South Coal center 2: Coal consumption for Meghnaghat, Maowa, and Zajira Coal center 3: Coal consumption for Khulna Coal center 4: Coal consumption for Chittagong
5.2.3 Number of Berths for Coal Vessels in the Prioritized Projects
1) Calculation Method The number of berths is estimated using the following formula based on the number of receiving/shipping coal vessels at the imported coal-fired power stations and coal centers in the prioritized projects. Nb = (Nv × Ds)/(Da × R)
Where, Nb: number of berths Nv: number of vessels enter per year, refer to Tables 5-5 and 5-6 Ds: Standard duration in days a vessel occupy a berth 80,000 DWT: 3 days, 20,000 DWT: 1 day, 5,000 DWT: a half day Da: possible operating days of a berth per year 245 days (Cyclone: 70 days, Holyday: 50 days) R: target operating rate of a berth 60%
Source: Design of civil engineering structure for thermal and nuclear power station (Electric Power Civil Engineering Association)
2) Number of Berths for Coal Vessels in the Prioritized Projects
The estimated number of berths for receiving coal and shipping coal are shown in Tables 5-7 and 5-8 respectively
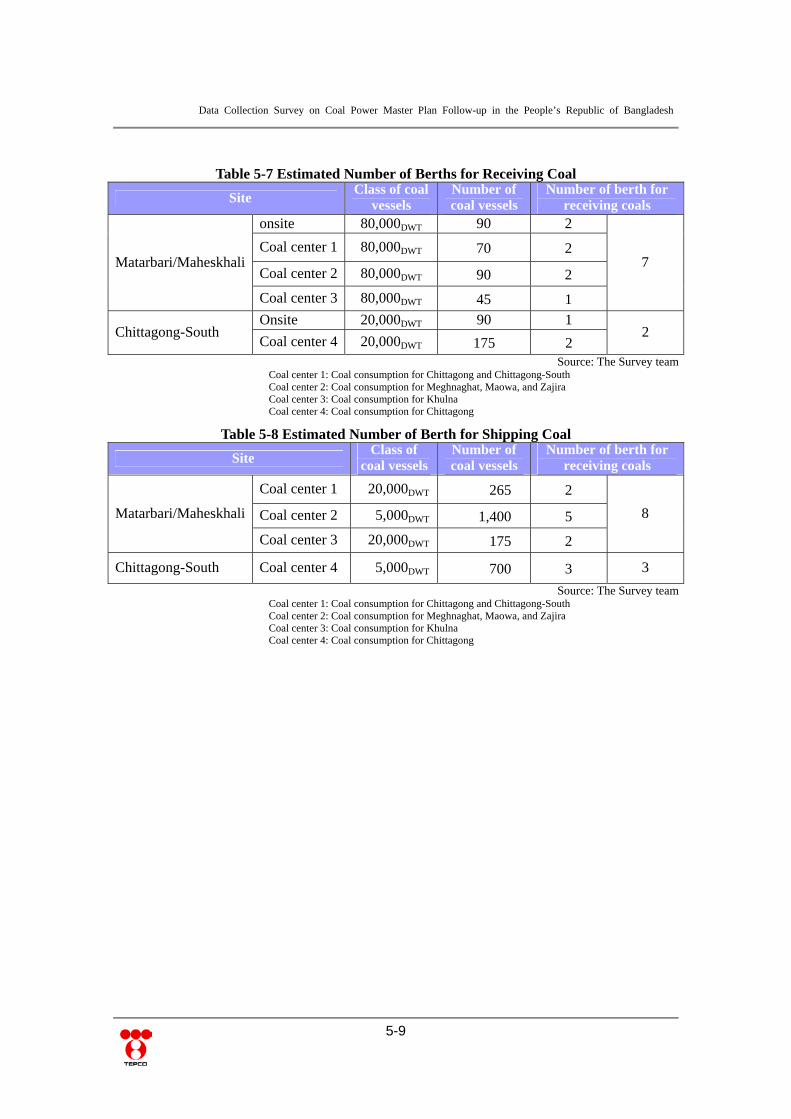
Data Collection Survey on Coal Power Master Plan Follow-up in the People’s Republic of Bangladesh
5-9
Table 5-7 Estimated Number of Berths for Receiving Coal
Site Class of coal
vessels Number of coal vessels
Number of berth for receiving coals
Matarbari/Maheskhali
onsite 80,000DWT 90 2
7 Coal center 1 80,000DWT 70 2
Coal center 2 80,000DWT 90 2
Coal center 3 80,000DWT 45 1
Chittagong-South Onsite 20,000DWT 90 1
2 Coal center 4 20,000DWT 175 2
Source: The Survey team Coal center 1: Coal consumption for Chittagong and Chittagong-South Coal center 2: Coal consumption for Meghnaghat, Maowa, and Zajira Coal center 3: Coal consumption for Khulna Coal center 4: Coal consumption for Chittagong
Table 5-8 Estimated Number of Berth for Shipping Coal
Site Class of
coal vesselsNumber of coal vessels
Number of berth for receiving coals
Matarbari/Maheskhali
Coal center 1 20,000DWT 265 2
8 Coal center 2 5,000DWT 1,400 5
Coal center 3 20,000DWT 175 2
Chittagong-South Coal center 4 5,000DWT 700 3 3
Source: The Survey team Coal center 1: Coal consumption for Chittagong and Chittagong-South Coal center 2: Coal consumption for Meghnaghat, Maowa, and Zajira Coal center 3: Coal consumption for Khulna Coal center 4: Coal consumption for Chittagong
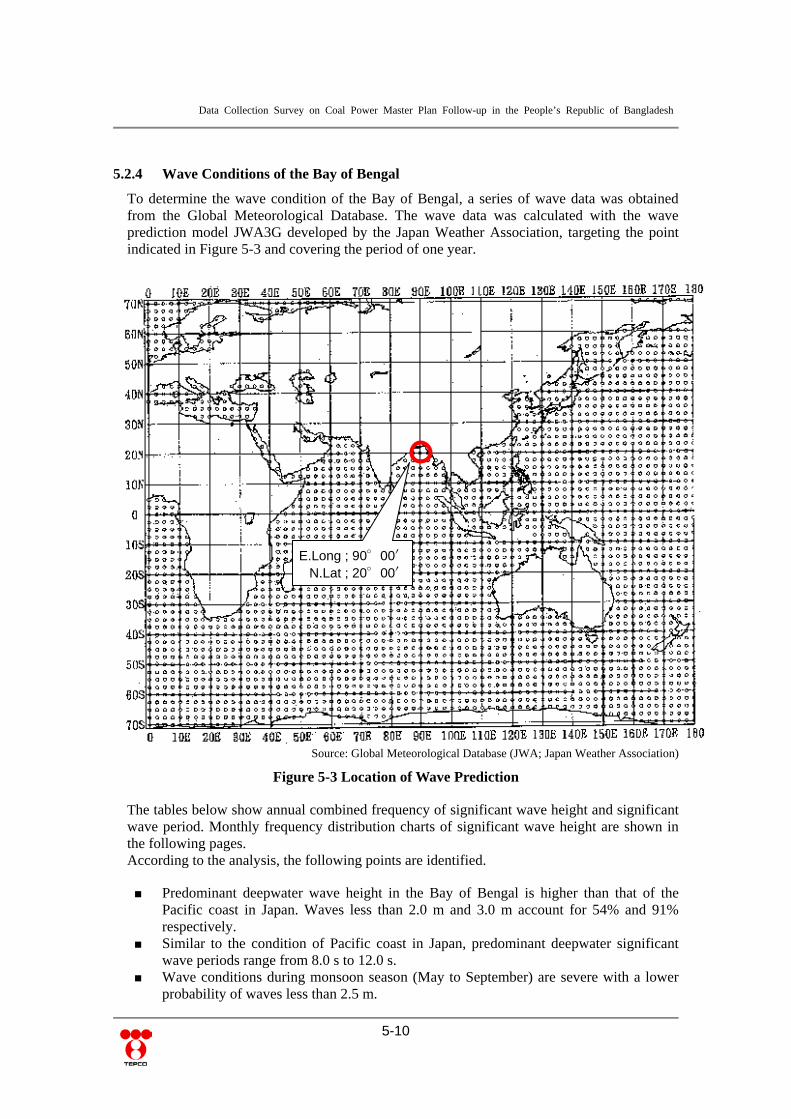
Data Collection Survey on Coal Power Master Plan Follow-up in the People’s Republic of Bangladesh
5-10
5.2.4 Wave Conditions of the Bay of Bengal
To determine the wave condition of the Bay of Bengal, a series of wave data was obtained from the Global Meteorological Database. The wave data was calculated with the wave prediction model JWA3G developed by the Japan Weather Association, targeting the point indicated in Figure 5-3 and covering the period of one year.
Source: Global Meteorological Database (JWA; Japan Weather Association)
Figure 5-3 Location of Wave Prediction The tables below show annual combined frequency of significant wave height and significant wave period. Monthly frequency distribution charts of significant wave height are shown in the following pages. According to the analysis, the following points are identified. Predominant deepwater wave height in the Bay of Bengal is higher than that of the
Pacific coast in Japan. Waves less than 2.0 m and 3.0 m account for 54% and 91% respectively.
Similar to the condition of Pacific coast in Japan, predominant deepwater significant wave periods range from 8.0 s to 12.0 s.
Wave conditions during monsoon season (May to September) are severe with a lower probability of waves less than 2.5 m.
E.Long ; 90°00′N.Lat ; 20°00′
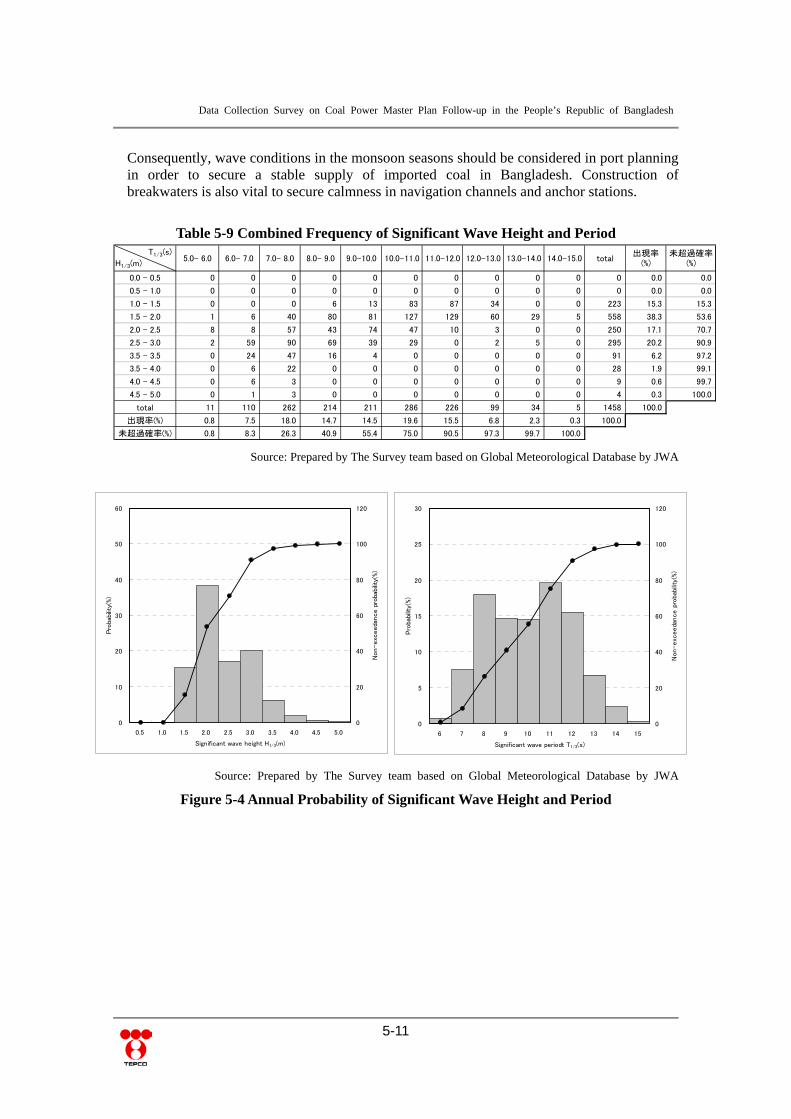
Data Collection Survey on Coal Power Master Plan Follow-up in the People’s Republic of Bangladesh
5-11
Consequently, wave conditions in the monsoon seasons should be considered in port planning in order to secure a stable supply of imported coal in Bangladesh. Construction of breakwaters is also vital to secure calmness in navigation channels and anchor stations.
Table 5-9 Combined Frequency of Significant Wave Height and Period
Source: Prepared by The Survey team based on Global Meteorological Database by JWA
Source: Prepared by The Survey team based on Global Meteorological Database by JWA
Figure 5-4 Annual Probability of Significant Wave Height and Period
T1/3(s)
H1/3(m)5.0- 6.0 6.0- 7.0 7.0- 8.0 8.0- 9.0 9.0-10.0 10.0-11.0 11.0-12.0 12.0-13.0 13.0-14.0 14.0-15.0 total
出現率(%)
未超過確率(%)
0.0 - 0.5 0 0 0 0 0 0 0 0 0 0 0 0.0 0.0
0.5 - 1.0 0 0 0 0 0 0 0 0 0 0 0 0.0 0.0
1.0 - 1.5 0 0 0 6 13 83 87 34 0 0 223 15.3 15.3
1.5 - 2.0 1 6 40 80 81 127 129 60 29 5 558 38.3 53.6
2.0 - 2.5 8 8 57 43 74 47 10 3 0 0 250 17.1 70.7
2.5 - 3.0 2 59 90 69 39 29 0 2 5 0 295 20.2 90.9
3.5 - 3.5 0 24 47 16 4 0 0 0 0 0 91 6.2 97.2
3.5 - 4.0 0 6 22 0 0 0 0 0 0 0 28 1.9 99.1
4.0 - 4.5 0 6 3 0 0 0 0 0 0 0 9 0.6 99.7
4.5 - 5.0 0 1 3 0 0 0 0 0 0 0 4 0.3 100.0
total 11 110 262 214 211 286 226 99 34 5 1458 100.0
出現率(%) 0.8 7.5 18.0 14.7 14.5 19.6 15.5 6.8 2.3 0.3 100.0
未超過確率(%) 0.8 8.3 26.3 40.9 55.4 75.0 90.5 97.3 99.7 100.0
0
10
20
30
40
50
60
0.5 1.0 1.5 2.0 2.5 3.0 3.5 4.0 4.5 5.0
Significant wave height H1/3(m)
Pro
babi
lity(
%)
0
20
40
60
80
100
120
Non-exc
eeda
nce p
roba
bilit
y(%)
0
5
10
15
20
25
30
6 7 8 9 10 11 12 13 14 15
Significant wave periodt T1/3(s)
Pro
babi
lity(
%)
0
20
40
60
80
100
120
Non-exc
eeda
nce p
roba
bilit
y(%)

Data Collection Survey on Coal Power Master Plan Follow-up in the People’s Republic of Bangladesh
5-12
Source: Prepared by The Survey team based on Global Meteorological Database by JWA
Figure 5-5 Monthly Probability of Significant Wave Height (1)
0
15
30
45
60
75
90
0.5 1.0 1.5 2.0 2.5 3.0 3.5 4.0 4.5 5.0
Significant wave height H1/3(m)
Pro
babi
lity(
%)
0
20
40
60
80
100
120
Non-exc
eeda
nce p
roba
bilit
y(%)
【January】
0
10
20
30
40
50
60
0.5 1.0 1.5 2.0 2.5 3.0 3.5 4.0 4.5 5.0
Significant wave height H1/3(m)
Pro
babi
lity(
%)
0
20
40
60
80
100
120
Non-exc
eeda
nce p
roba
bilit
y(%)
【February】
0
15
30
45
60
75
90
0.5 1.0 1.5 2.0 2.5 3.0 3.5 4.0 4.5 5.0
Significant wave height H1/3(m)
Pro
babi
lity(
%)
0
20
40
60
80
100
120
Non-exc
eeda
nce p
roba
bilit
y(%)
【March】
0
15
30
45
60
75
90
0.5 1.0 1.5 2.0 2.5 3.0 3.5 4.0 4.5 5.0
Significant wave height H1/3(m)
Pro
babi
lity(
%)
0
20
40
60
80
100
120
Non-exc
eeda
nce p
roba
bilit
y(%)
【April】
0
10
20
30
40
50
60
0.5 1.0 1.5 2.0 2.5 3.0 3.5 4.0 4.5 5.0
Significant wave height H1/3(m)
Pro
babi
lity(
%)
0
20
40
60
80
100
120
Non-exc
eeda
nce p
roba
bilit
y(%)
【May】
0
10
20
30
40
50
60
0.5 1.0 1.5 2.0 2.5 3.0 3.5 4.0 4.5 5.0
Significant wave height H1/3(m)
Pro
babi
lity(
%)
0
20
40
60
80
100
120
Non-exc
eeda
nce p
roba
bilit
y(%)
【June】

Data Collection Survey on Coal Power Master Plan Follow-up in the People’s Republic of Bangladesh
5-13
Source: The Survey team based on data from The Japan Weather Association
Figure 5-6 Monthly Probability of Significant Wave Height (2)
0
10
20
30
40
50
60
0.5 1.0 1.5 2.0 2.5 3.0 3.5 4.0 4.5 5.0
Significant wave height H1/3(m)
Pro
babi
lity(
%)
0
20
40
60
80
100
120
Non-exc
eeda
nce p
roba
bilit
y(%)
【July】
0
10
20
30
40
50
60
0.5 1.0 1.5 2.0 2.5 3.0 3.5 4.0 4.5 5.0
Significant wave height H1/3(m)Pro
babi
lity(
%)
0
20
40
60
80
100
120
Non-exc
eeda
nce p
roba
bilit
y(%)
【August】
0
10
20
30
40
50
60
0.5 1.0 1.5 2.0 2.5 3.0 3.5 4.0 4.5 5.0
Significant wave height H1/3(m)
Pro
babi
lity(
%)
0
20
40
60
80
100
120
Non-exc
eeda
nce p
roba
bilit
y(%)
【September】
0
10
20
30
40
50
60
0.5 1.0 1.5 2.0 2.5 3.0 3.5 4.0 4.5 5.0
Significant wave height H1/3(m)
Pro
babi
lity(
%)
0
20
40
60
80
100
120
Non-exc
eeda
nce p
roba
bilit
y(%)
【October】
0
15
30
45
60
75
90
0.5 1.0 1.5 2.0 2.5 3.0 3.5 4.0 4.5 5.0
Significant wave height H1/3(m)
Pro
babi
lity(
%)
0
20
40
60
80
100
120
Non-exc
eeda
nce p
roba
bilit
y(%)
【November】
0
15
30
45
60
75
90
0.5 1.0 1.5 2.0 2.5 3.0 3.5 4.0 4.5 5.0
Significant wave height H1/3(m)
Pro
babi
lity(
%)
0
20
40
60
80
100
120
Non-exc
eeda
nce p
roba
bilit
y(%)
【December】

Data Collection Survey on Coal Power Master Plan Follow-up in the People’s Republic of Bangladesh
5-14
5.3 Development Planning on Port Facilities This part studies the general layout plans of power station site, coal stockyard and the port facilities based on the results derived from the former studies and surveys on the prioritized project of Chittagong-South and Maheskhali following the two steps below. Step 1: Selection of advantageous site based on general comparison of port layout
between Chittagong-South, Matarbari and Maheskhali. Step 2: Determination of candidate power station site following the port facility layout
study based on the result of Second Site Survey on the advantageous site. In the Survey, it is assumed that: Power output capacity of each power station is 600 MW × 2, Coal vessels are of maximum possible class that each site can accommodate
(Maheskhali: 80,000 DWT, Chittagong-South: 20,000 DWT), and The intended imported coal-fired power stations are not equipped with coal centers.
5.3.1 Condition Setting
1) Parameters of Power Stations Table 5-10 shows the parameters of the power stations in the prioritized projects.
Table 5-10 Specification of Power Stations Item Specification of the power station
Capacity USC 600MW×2unit Area of site Generation
facility area 140,000 m2
490,000 m2 Coal stock and
handling area 150,000 m2
Other utility area
200,000 m2
Coal consumption
Annual consumption
1,750,000 t/year/unit 3,500,000 t/year
Capacity of stock
60 days 600,000 t
Ash production
Annual production
325,000 m3/year/unit (260,000 t/year/unit)
650,000 m3/year (520,000 t/year/unit)
Capacity of ash pond
25 years 16,250,000 m3
Source: The Survey team
2) Parameters of the Intended Vessels As shown in Table 5-10, the maximum possible vessels of Maheskhali and Chittagong-South are 80,000DWT and 20,000DWT respectively. Parameters of the 80,000DWT vessels are referred from those of the international coal vessel for Hitachinaka Port in Japan. Parameters of the 20,000DWT vessels are based on “Technical Standards and Commentaries for Port and Harbor Facilities in Japan.”

Data Collection Survey on Coal Power Master Plan Follow-up in the People’s Republic of Bangladesh
5-15
Table 5-11 Parameters of the Intended Vessels Specification Matarbari/Maheskhali Chittagong-South
Class (Deadweight
tonnage) 80,000DWT 20,000DWT
Length :L 220m 160m Breadth :B 36m 26m Draft :df 13.0m 10.0m
Source: The Survey team 3) Parameters of the Port Facilities
Parameters of the intended port facilities are set based on “Technical standards and Commentaries for Port and Harbor Facilities in Japan” and summarized in Table 5-11. The procedure described in 5.2.3 is used to set the number of berths.
Table 5-12 Parameters of the Port Facilities
Port facilities 80,000DWT 20,000DWT Basis of parameters
Navigation channel
Length 1,200m 850m over 5 × (Length of vessel)
Width 250m 180m over 1.5 × (Length of vessel)
Depth 15.0m 11.0m over 1.1 × (Draft of vessel)
Mooring basin
Width 500m 350m over 2 × (Length of vessel)
Depth 15.0m 11.0m over 1.1 × (Draft of vessel)
Number of berth 1 2 Source: The Survey team
4) Basic Layout of the Port Facilities
The following figure shows the basic layout of the port facilities for the Survey. Standard dimension of power station sites is 700 m × 700 m. In each site, a coal stock
yard is located seaward and power generating equipments are located landward. Direct-berthing-system or pier-type coal berths are installed on ocean side of the coal
stock yard. Turning basin with required area and depth is located in front of the coal berths. Navigation channel (stopping distance) is straight-shaped and is furnished with the
required length, width and depth. Navigation channel is to cover the extent starting from the landward edge of stopping
distance and reaching to the sea area with required water depth.

Data Collection Survey on Coal Power Master Plan Follow-up in the People’s Republic of Bangladesh
5-16
Source: The Survey team
Figure 5-7 Basic Layout of the Port Facilities
5) Bathymetric Condition The following marine charts are used for the bathymetric condition of the Survey. HATIA ISLAND TO ST. MARTIN'S ISLAND MATARBARI ISLAND TO ELEPHANT POINT APPROACHIES TO CHITTAGONG

Data Collection Survey on Coal Power Master Plan Follow-up in the People’s Republic of Bangladesh
5-17
5.3.2 General Comparison Study on Port Layout between Chittagong-South and Maheskhali
1) Layout Planning of the Chittagong-South Port The characteristics of Chittagong-South are as follows: As the Sangu River flows into southern region of this site, a substantial amount of
sediment discharge is expected in monsoon seasons. Nearshore region of this site is shallow to a considerable distance from the shore, that is.
0 m deep at 3 km away from the shore and 10m deep at 4.5km away from the shore. Taking account of above, the layout plan of Chittagong-South Port is proposed following the concept described below. Port facilities are planned at 3km south of the estuary to avoid the impact of sediment
load from Sangu River. Coal berth is located 4.5km seaward from the shoreline where appropriate water depth
is available for navigation channel and anchoring area. Detached breakwaters are installed off the berth to block sea waves. Coal transferring belt conveyers are also installed along an additional 4.5 km-long
access bridge connecting the coal berth and the location of the power station. A quay is set at the north edge of the power station site to which a 5 m-deep navigation
channel is connected. Proposed layout plan of Chittagong-South Port is shown in the following figure.
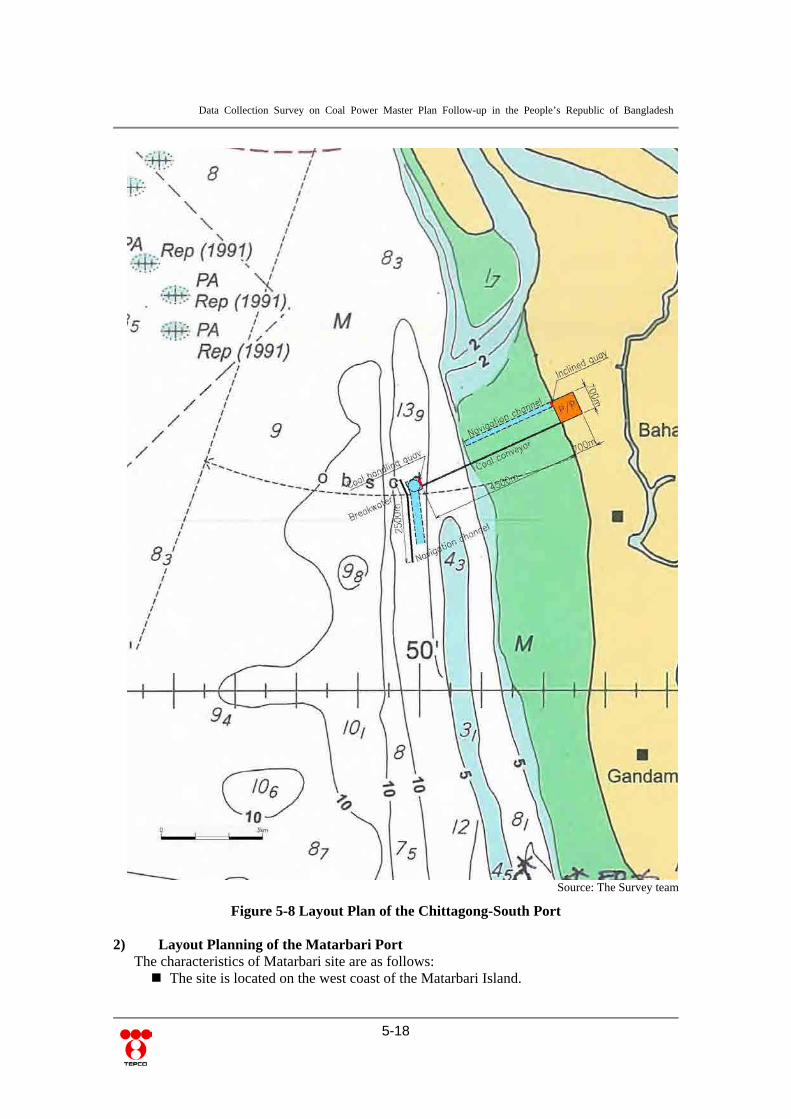
Data Collection Survey on Coal Power Master Plan Follow-up in the People’s Republic of Bangladesh
5-18
Source: The Survey team
Figure 5-8 Layout Plan of the Chittagong-South Port
2) Layout Planning of the Matarbari Port The characteristics of Matarbari site are as follows: The site is located on the west coast of the Matarbari Island.

Data Collection Survey on Coal Power Master Plan Follow-up in the People’s Republic of Bangladesh
5-19
In the west coast of the Matarbari Island, water depth reaches 15m approximately 2km
away from the shoreline. The Survey is intended for the area near the deep sea area on the west Matarbari Island. The
general port layout is planned based on the following concept. The port layout includes a coal berth on the shoreline, an anchoring basin behind the
berth and a dredged 3km-long navigation channel reaching to deepwater area. Location of navigation channel is determined considering that coal vessels approach
from south. Dredged sediment is to be utilized as landfilling material of the power station site with
elevation of 10.0m above sea level. When the amount of dredged sediment is insufficient for landfilling, purchase of landfill sand is necessary.
Detached breakwaters are installed off of the berth to block sea waves. The navigation channel for the coal vessels is also used for the quay to be installed
adjacent to the coal berth. Proposed layout plan of Matarbari is shown in the following figure.
3) Layout Planning of the Maheskhali Port The characteristics of the Maheskhali site are as follows: The site is located on the west coast of the Maheskhali Island. In the east coast of the Maheskhali Island, the nearby shore region, consisting at a
sand bar and mangroves is shallow with a water depth of 5m or less followed by a steep seabed reaching a water depth of approximately 20m at 8km away from the shoreline.
The Survey is intended for the area near Maheskhali Island, surrounded by the sand bar in the north and a mangrove island in the south. The general port layout is planned based on the following concept. The construction site of the port facilities is selected so as to minimize the distance
between the shoreline and deepwater area. The port layout locates a coal berth on the shoreline, an anchoring basin behind the
berth and a dredged 6km-long navigation channel reaching the deepwater area. The sand bars of 5km north and the mangrove island of 2km south are expected to
block the ocean waves eliminating the need for breakwaters. The navigation channel for the coal vessels is also used for the quay to be installed
adjacent to the coal berth. The proposed layout plan of Maheskhali is shown in the following figure.
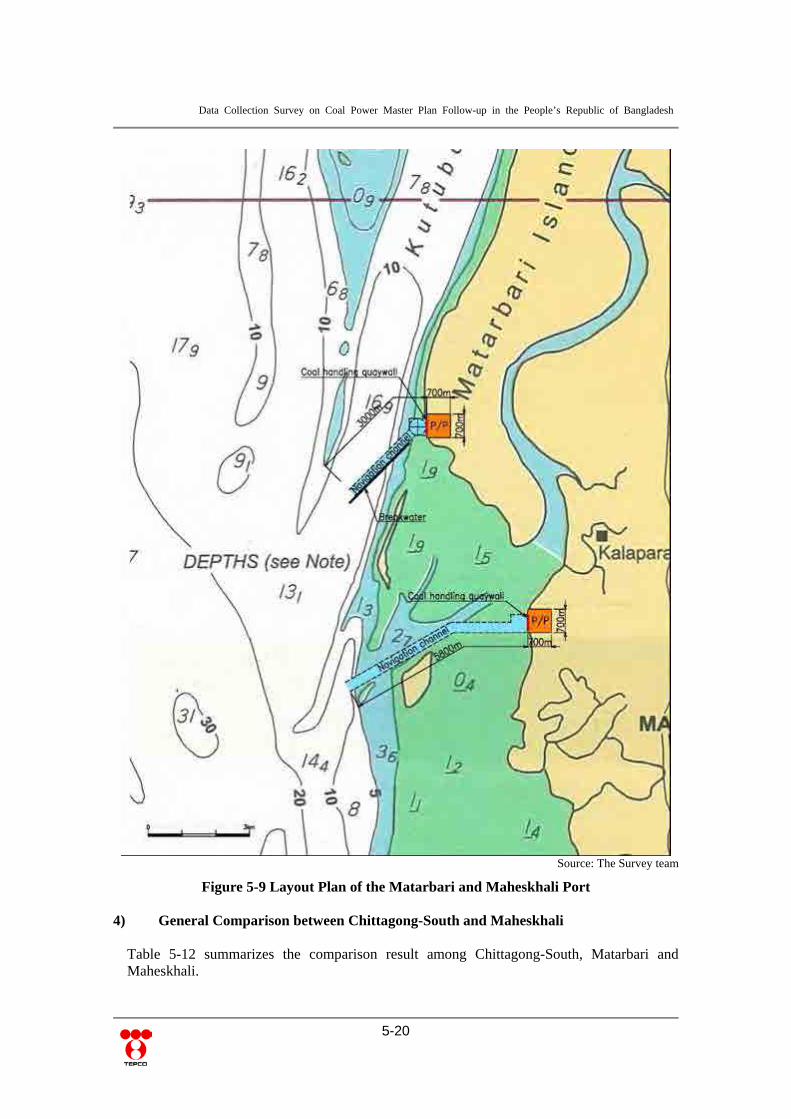
Data Collection Survey on Coal Power Master Plan Follow-up in the People’s Republic of Bangladesh
5-20
Source: The Survey team
Figure 5-9 Layout Plan of the Matarbari and Maheskhali Port 4) General Comparison between Chittagong-South and Maheskhali
Table 5-12 summarizes the comparison result among Chittagong-South, Matarbari and Maheskhali.
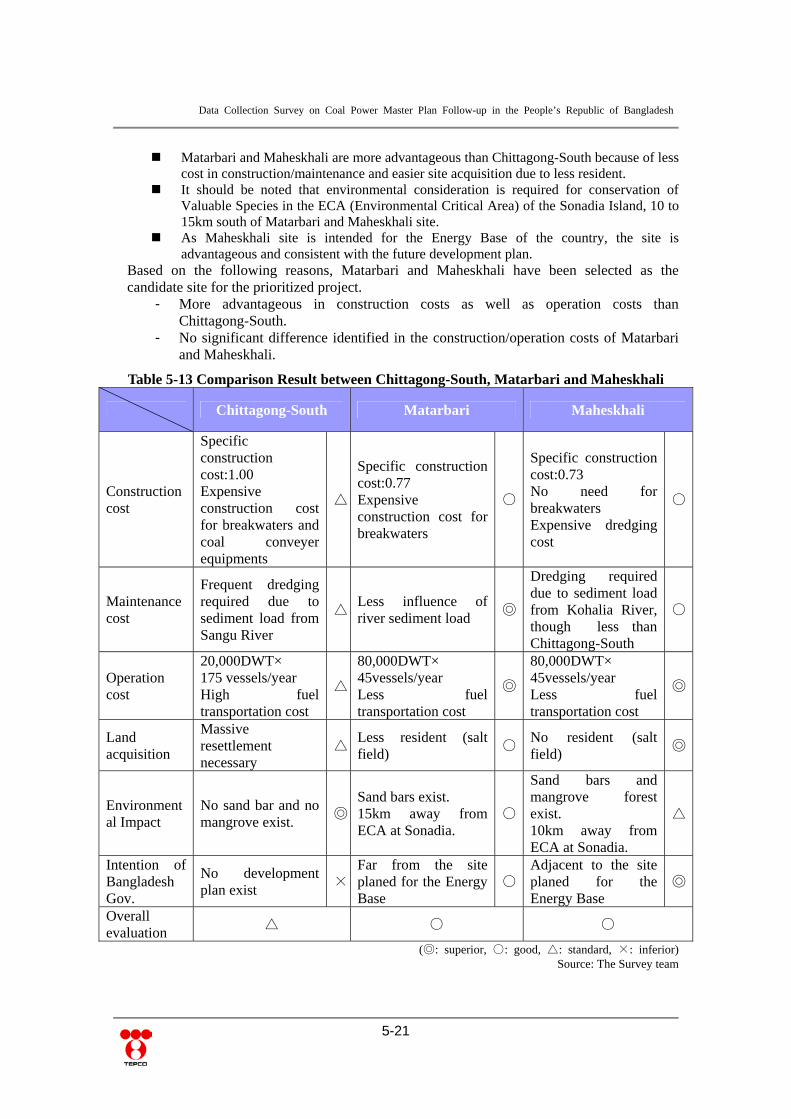
Data Collection Survey on Coal Power Master Plan Follow-up in the People’s Republic of Bangladesh
5-21
Matarbari and Maheskhali are more advantageous than Chittagong-South because of less
cost in construction/maintenance and easier site acquisition due to less resident. It should be noted that environmental consideration is required for conservation of
Valuable Species in the ECA (Environmental Critical Area) of the Sonadia Island, 10 to 15km south of Matarbari and Maheskhali site.
As Maheskhali site is intended for the Energy Base of the country, the site is advantageous and consistent with the future development plan.
Based on the following reasons, Matarbari and Maheskhali have been selected as the candidate site for the prioritized project.
- More advantageous in construction costs as well as operation costs than Chittagong-South.
- No significant difference identified in the construction/operation costs of Matarbari and Maheskhali.
Table 5-13 Comparison Result between Chittagong-South, Matarbari and Maheskhali
Chittagong-South Matarbari Maheskhali
Construction cost
Specific construction cost:1.00 Expensive construction cost for breakwaters and coal conveyer equipments
△
Specific construction cost:0.77 Expensive construction cost for breakwaters
○
Specific construction cost:0.73 No need for breakwaters Expensive dredging cost
○
Maintenance cost
Frequent dredging required due to sediment load from Sangu River
△Less influence of river sediment load
◎
Dredging required due to sediment load from Kohalia River, though less than Chittagong-South
○
Operation cost
20,000DWT× 175 vessels/year High fuel transportation cost
△
80,000DWT× 45vessels/year Less fuel transportation cost
◎
80,000DWT× 45vessels/year Less fuel transportation cost
◎
Land acquisition
Massive resettlement necessary
△Less resident (salt field)
○No resident (salt field)
◎
Environmental Impact
No sand bar and no mangrove exist.
◎Sand bars exist. 15km away from ECA at Sonadia.
○
Sand bars and mangrove forest exist. 10km away from ECA at Sonadia.
△
Intention of Bangladesh Gov.
No development plan exist
×Far from the site planed for the Energy Base
○Adjacent to the site planed for the Energy Base
◎
Overall evaluation
△ ○ ○
(◎: superior, ○: good, △: standard, ×: inferior) Source: The Survey team

Data Collection Survey on Coal Power Master Plan Follow-up in the People’s Republic of Bangladesh
5-22
5.3.3 Determination of the Candidate Power Station Site in Maheskhali
1) Selection of the Candidate Power Station Site The Second Site Survey was conducted on three sites, i.e. Matarbari and Maheskhali selected in the described comparison study as well as the site that the GOB is intending to develop. As a result of the Survey, the three specific sites shown in the following figures are nominated for the candidate power station site on the basis of the following concept. To select 15 m-deep sea areas in front to allow arrival of 80,000 DWT-class coal
vessels, To confirm the possibility to install port facilities (navigation channel and anchoring
basin) without affecting sand bars and mangrove forests based on site survey as well as satellite images provided by aerial photo,
To install facilities in the distant area from Valuable Species’ habitat in the Environment Critical Area of Sonadia Island, and
To put priority on consistency with the project by GOB.
Source: The Survey team
Figure 5-10 Selected Candidate Power Station Site
②North Maheskhali
①Matarbari
③South Maheskhali

Data Collection Survey on Coal Power Master Plan Follow-up in the People’s Republic of Bangladesh
5-23
2) Port Layout Plan in Matarbari
The following figure shows the port layout plan in Matarbari which has the characteristics of: Located in the remote area of 10 km away from the studied area of GOB. Nominated as
the alternative candidate site by GOB. 15 m deep-sea area is approximately 2 km away from the shoreline. Construction of
breakwaters required for securing calmness in the navigation channel. Less extensibility expected due to narrow east-west traverse section of the island with
only 3 km. Approximately 15 km away from Sonadia ECA. No surrounding mangrove/sandbar.
Less environmental issues anticipated without surrounding sand bars and mangrove forests.
3) Port Layout Plan in North Maheskhali
The following figure shows the port layout plan in North Maheskhali which has the characteristics of: Located on the north of and adjacent to the studied area of GOB. Possible to develop
integral with the power station planned in the studied area of GOB. Available to install the navigation channel and the anchoring basin in the area away
from sand bars and mangrove forests. Located in Kohalia River estuary. Need to grasp the impact due to sediment load in
monsoon season. 15m deep-sea area is approximately 6 km away from the shoreline. North sand bars and
south mangrove island are expected to act as breakwaters. Approximately 10 km away from Sonadia ECA. Less environmental issues anticipated.
4) Port Layout Plan in South Maheskhali
The following figure shows the port layout plan in South Maheskhali which has the characteristics of: Located within the studied area of GOB. Possible to develop integral with the power
station planned in the studied area of GOB. Available to install the navigation channel and the anchoring basin in the area away
from sand bars and mangrove forests. 15m deep-sea area is approximately 6 km away from the shoreline. North sand bars and
south mangrove island are expected to act as breakwaters. Approximately 2 km away from Sonadia ECA. Valuable Species’ habitat confirmed at
sand bars in the vicinity of the navigation channel.

Data Collection Survey on Coal Power Master Plan Follow-up in the People’s Republic of Bangladesh
5-24
Source: The Survey team
Figure 5-11 Port Layout Plan in Matarbari

Data Collection Survey on Coal Power Master Plan Follow-up in the People’s Republic of Bangladesh
5-25
Source: The Survey team
Figure 5-12 Port Layout Plan in North Maheskhali
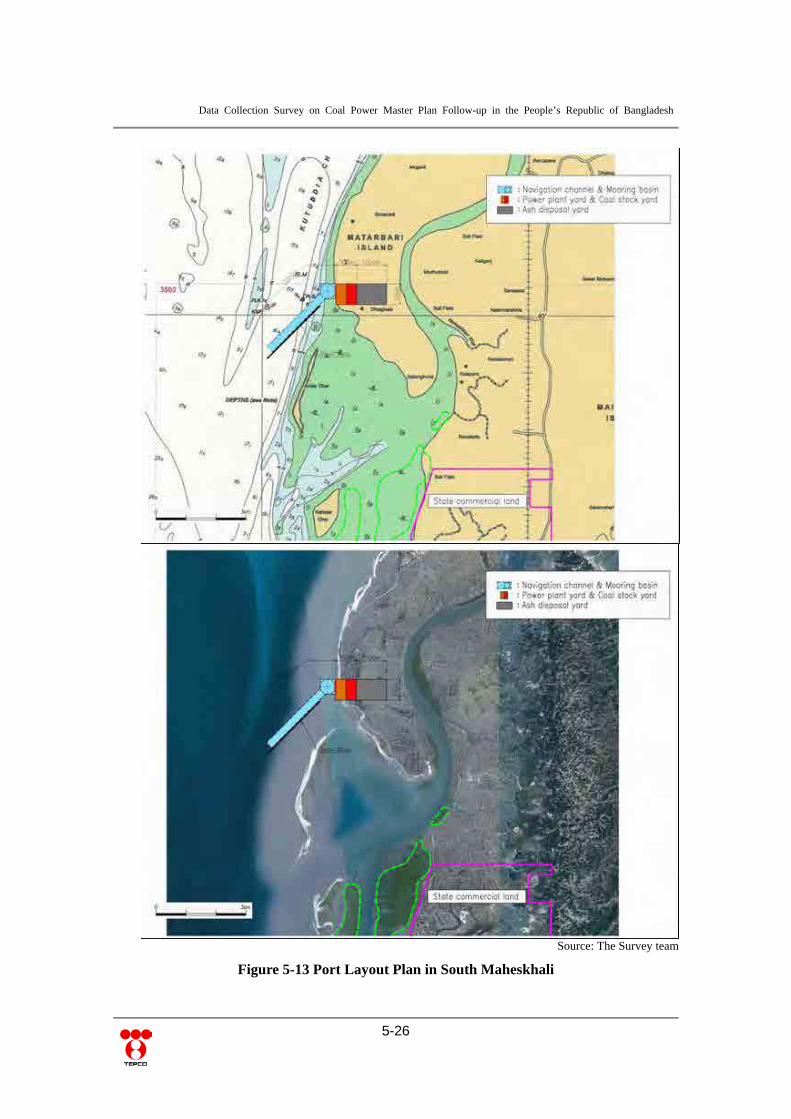
Data Collection Survey on Coal Power Master Plan Follow-up in the People’s Republic of Bangladesh
5-26
Source: The Survey team
Figure 5-13 Port Layout Plan in South Maheskhali

Data Collection Survey on Coal Power Master Plan Follow-up in the People’s Republic of Bangladesh
5-27
5) Comparison of Construction Cost of the Candidate Power Station Site
Construction costs of port facilities for three candidate power station sites are estimated in Table 5-14. The following results are obtained. As 15m-deep sea area for navigation channels are approximately 7km away from the
shoreline in North Maheskhali and South Maheskhali, dredging sand is required. Deep sea area in short distance reduces dredging amount in Matarbari.
In North Maheskhali and South Maheskhali, site development cost is less because dredged sediment is to be utilized as landfilling material of the power station site with elevation of 10.0m above sea level. In Matarbari, due to less dredged sediment, purchase of landfill sand is necessary and this makes the site development cost slightly higher.
In North Maheskhali and South Maheskhali, mangrove forests and sand bars on both sides of the navigation channel block ocean waves eliminating the need for breakwaters.
Consequently, while North Maheskhali and South Maheskhali are even in construction costs, the total construction cost of Matarbari is higher than the other two sites due to costly land filling and breakwaters.
Table 5-14 Construction Cost of Port Facilities (unit: Million USD)
Construction Matarbari North Maheskhali South Maheskhali
Dredging 70.0 270.0 270.0
Reclamation 50.0 35.0 35.0
Seawall 15.0 15.0 15.0
Breakwater/Training wall
260.0 45.0 45.0
Coal unloading berth 30.0 30.0 30.0
Total 425.0 395.0 395.0 Source: The Survey team
6) Determination of the Candidate Power Station Site in Maheskhali
Construction costs of port facilities for three candidate power station sites are estimated as the following table. As summarized in the following table, the following comparison results are obtained. North and South Maheskhali are superior to Matarbari in Construction cost as well as
Difficulty level of construction. Matarbari is superior to North and South Maheskhali in Maintenance cost (dredging
cost).
The comparison results indicate that it is difficult to order the superiority for the three candidate power station sites because each site has both merits and demerits. Therefore, it is desirable to proceed targeting North Maheskhali and Matarbari but excluding South Maheskhali which Bangladesh Government is intending to develop.

Data Collection Survey on Coal Power Master Plan Follow-up in the People’s Republic of Bangladesh
5-28
Table 5-15 Comparison Result of the Candidate Sites
site item Matarbari North Maheskhali South Maheskhali
Construction cost
Specific cost:1.08 Low dredging cost Breakwater necessary
Specific cost:1.00 High dredging cost No breakwater necessary
Specific cost:1.00 High dredging cost No breakwater necessary
△ ○ ○
Difficulty level of construction
Difficulty in stone material procurement
N/A N/A
△ ○ ○
Maintenance cost
Less dredging cost than others
Dredging required due to sediment load from Kohalia River
Less impact of sediment load than North Maheskhali
○ △ △
Operation efficiency
80,000DWT coal vessels 80,000DWT coal vessels 80,000DWT coal vessels
○ ○ ○ (◎: superior, ○: good, △: standard, ×: inferior)
Source: The Survey team
5.3.4 Issues to be Addressed in F/S of Matarbari and North Maheskhali
It is necessary to conduct the following two research activities before implementation of the F/S in Matarbari and North Maheskhali.
1) Sediment Load of Rivers In North Maheskhali, there is concern on the possibility of significant sedimentation in the navigation channel caused by the sediment load from the Kohalia River. While there is no river flowing into Matarbari site, sand bars spreading in front of the site could be a source of sediment transport. It is recommended to conducting the following surveys to estimate the impact of sediment load. Topography survey (bathymetry/acoustic profiling)
Survey area: Location:7 km×5 km covering the navigation channel Survey period: before and after monsoon season, after cyclone Survey items: seabed topography, thickness of sediment and foundation topography
Sediment and water quality survey Survey area: three points within proposed navigation channel and others Survey period: before and after monsoon season, after cyclone Survey items: grain size, suspended solid at middle/bottom layer
Wave, current and diffusion survey Survey items: recording wave/current during cyclone and diffusion after cyclone
with video cameras

Data Collection Survey on Coal Power Master Plan Follow-up in the People’s Republic of Bangladesh
5-29
2) Coal Loading Method
In Khulna site, imported coal are planned to be transferred by 80,000DWT class vessels and transshipped to barge vessels by offshore floating cranes (offshore loading system). This method is expected to reduce cost significantly because no large-scale dredging is required. For the adoption of this method, it is necessary to ensure its transshipping capability which might be affected by wave conditions. Hydrographic survey
Survey items: wave/wind data in the Bay of Bengal, cyclone record for 5 years (available from Japan Weather Association)
Actual conditions of offshore loading system Survey items: critical wave conditions for transshipping, transshipping capability
and availability factor Case study
Survey items: evaluation of transshipping capability based on wave/wind data at the site.
5.4 Operating and Maintenance System of Port Facilities In terms of operating and maintenance system of port facilities for berthing international coal vessels in imported coal-fired power stations, the related information on the existing international port of Chittagong is investigated as follows.
5.4.1 Operation Structure of Port Facilities
All the candidate sites in the prioritized projects are planned for coal-fired power stations equipped with port facilities that accommodate international coal vessels. The management system on the following is required in the operation of port facilities. Entrance into and leave from ports Loading operation of coal Maintenance of port facilities.
According to the hearing investigation on the operation of port facilities in the prioritized projects, the Chittagong Port Authority has no concern with out-of-bounds area of Chittagong Port. Therefore, management system of port facilities for the projects should be established by the organization belonging to the imported coal-fired power stations. In Japan, the management of port facilities in thermal power stations is conducted by: Specific section established inside the power station, or Special company organized separately only for operating port facilities.
As each prioritized project initially has the capacity of 600MWx2 and constructs no coal center, it is appropriate to establish an organization in CPGC to manage port facilities. In addition, in the case that number of vessels would increase due to future expansion of power stations as well as future installation of a coal center, it is desirable to establish a separate company for management of port facilities.
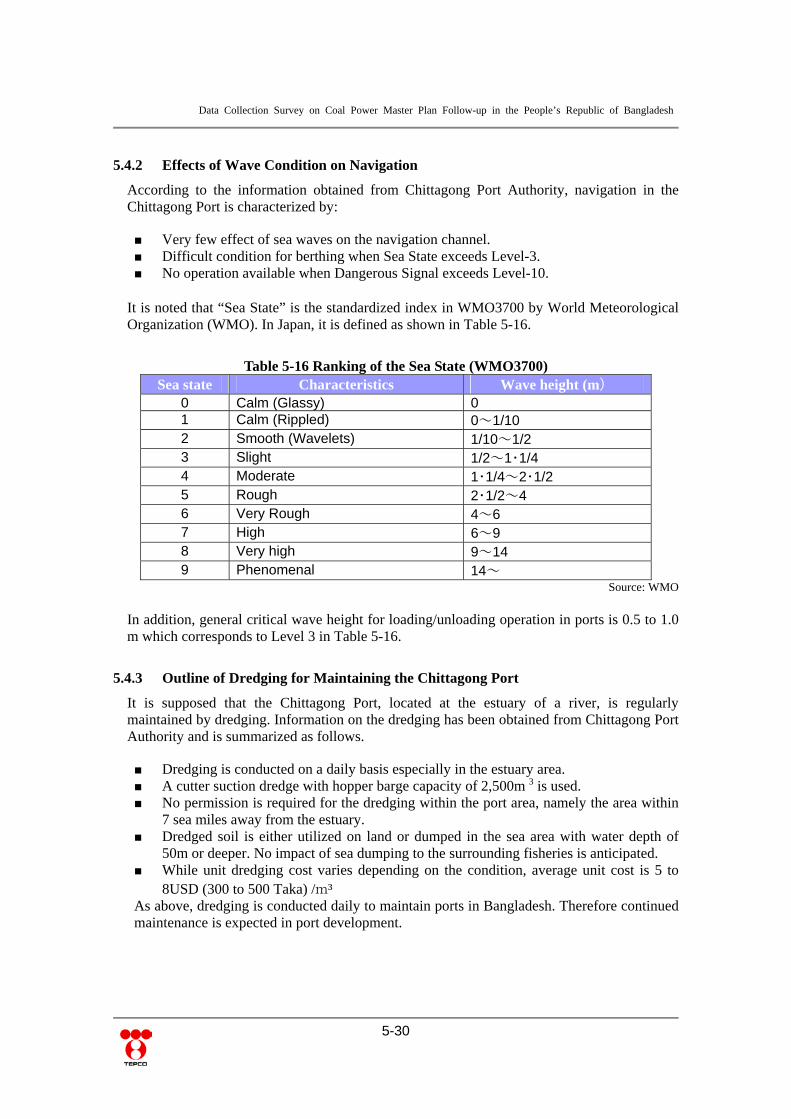
Data Collection Survey on Coal Power Master Plan Follow-up in the People’s Republic of Bangladesh
5-30
5.4.2 Effects of Wave Condition on Navigation
According to the information obtained from Chittagong Port Authority, navigation in the Chittagong Port is characterized by: Very few effect of sea waves on the navigation channel. Difficult condition for berthing when Sea State exceeds Level-3. No operation available when Dangerous Signal exceeds Level-10.
It is noted that “Sea State” is the standardized index in WMO3700 by World Meteorological Organization (WMO). In Japan, it is defined as shown in Table 5-16.
Table 5-16 Ranking of the Sea State (WMO3700) Sea state Characteristics Wave height (m)
0 Calm (Glassy) 0 1 Calm (Rippled) 0~1/10 2 Smooth (Wavelets) 1/10~1/2 3 Slight 1/2~1・1/4 4 Moderate 1・1/4~2・1/2 5 Rough 2・1/2~4 6 Very Rough 4~6 7 High 6~9 8 Very high 9~14 9 Phenomenal 14~
Source: WMO In addition, general critical wave height for loading/unloading operation in ports is 0.5 to 1.0 m which corresponds to Level 3 in Table 5-16.
5.4.3 Outline of Dredging for Maintaining the Chittagong Port
It is supposed that the Chittagong Port, located at the estuary of a river, is regularly maintained by dredging. Information on the dredging has been obtained from Chittagong Port Authority and is summarized as follows. Dredging is conducted on a daily basis especially in the estuary area. A cutter suction dredge with hopper barge capacity of 2,500m 3 is used. No permission is required for the dredging within the port area, namely the area within
7 sea miles away from the estuary. Dredged soil is either utilized on land or dumped in the sea area with water depth of
50m or deeper. No impact of sea dumping to the surrounding fisheries is anticipated. While unit dredging cost varies depending on the condition, average unit cost is 5 to
8USD (300 to 500 Taka) /m³ As above, dredging is conducted daily to maintain ports in Bangladesh. Therefore continued maintenance is expected in port development.
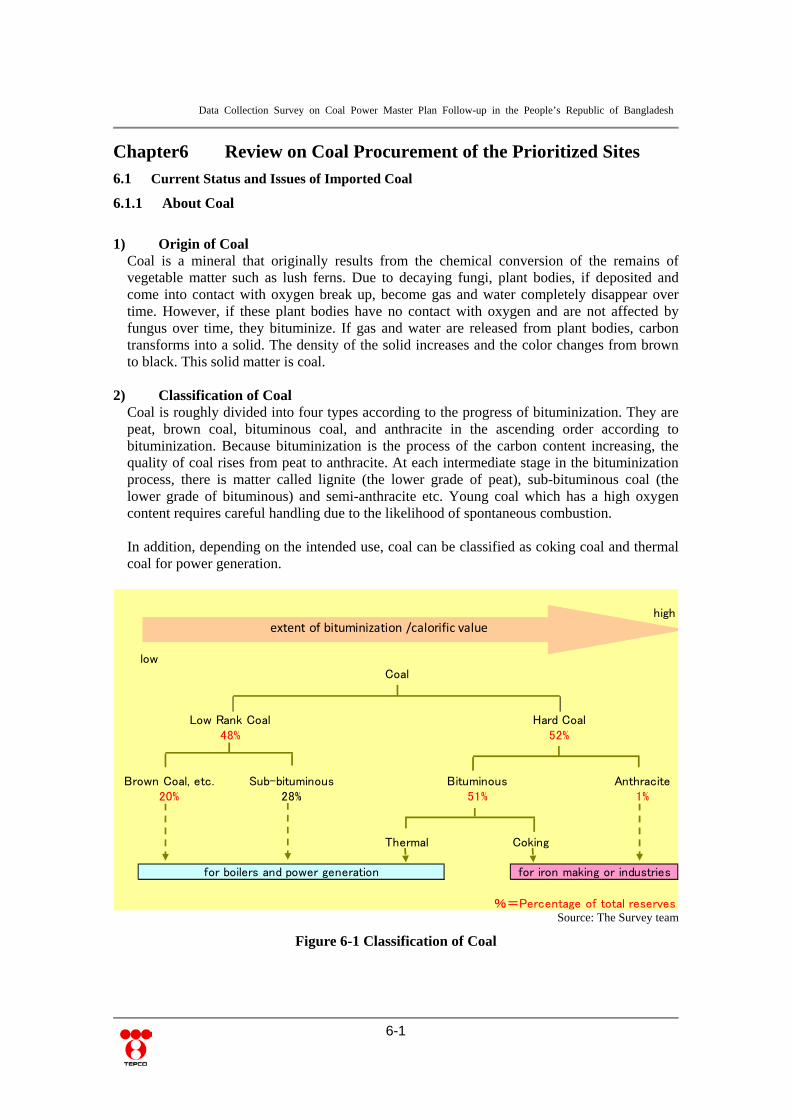
Data Collection Survey on Coal Power Master Plan Follow-up in the People’s Republic of Bangladesh
6-1
Chapter6 Review on Coal Procurement of the Prioritized Sites 6.1 Current Status and Issues of Imported Coal
6.1.1 About Coal
1) Origin of Coal
Coal is a mineral that originally results from the chemical conversion of the remains of vegetable matter such as lush ferns. Due to decaying fungi, plant bodies, if deposited and come into contact with oxygen break up, become gas and water completely disappear over time. However, if these plant bodies have no contact with oxygen and are not affected by fungus over time, they bituminize. If gas and water are released from plant bodies, carbon transforms into a solid. The density of the solid increases and the color changes from brown to black. This solid matter is coal.
2) Classification of Coal Coal is roughly divided into four types according to the progress of bituminization. They are peat, brown coal, bituminous coal, and anthracite in the ascending order according to bituminization. Because bituminization is the process of the carbon content increasing, the quality of coal rises from peat to anthracite. At each intermediate stage in the bituminization process, there is matter called lignite (the lower grade of peat), sub-bituminous coal (the lower grade of bituminous) and semi-anthracite etc. Young coal which has a high oxygen content requires careful handling due to the likelihood of spontaneous combustion. In addition, depending on the intended use, coal can be classified as coking coal and thermal coal for power generation.
high
lowCoal
Low Rank Coal Hard Coal48% 52%
Brown Coal, etc. Sub-bituminous Bituminous Anthracite20% 28% 51% 1%
Thermal Coking
%=Percentage of total reserves
for boilers and power generation for iron making or industries
extent of bituminization /calorific value
Source: The Survey team
Figure 6-1 Classification of Coal

Data Collection Survey on Coal Power Master Plan Follow-up in the People’s Republic of Bangladesh
6-2
3) Proven Reserves of Coal in the World
According to BP statistics, the world’s proven reserves of coal is 861 billion tonnes, reserve-production ratio is about 118 years. Coal has the longer R/P ratio than oil or gas, and has a wider global dispersion rate. The United States has the biggest reserves, Russia the second, and China the Third, followed by Australia, India and so on.
Table 6-1 Proven Reserves of Coal in the World (million tonnes)
Anthracite/ bituminous
Sub-bit uminous/
Brown Coal
Total
USA 1,085 1,288 2,373 Russia 491 1,079 1,570 China 622 523 1,145 Australia 371 393 764 India 561 45 606 Germany 1 406 407 Ukraine 154 185 339 Kazakhstan 215 121 336 South Africa 301 - 301 Columbia 64 4 67 Canada 35 31 66 Indonesia 15 40 55
Source: BP Statistical Review of World Energy 2011
6.1.2 Demand and Supply Situation of Imported Coal in the International Market
1) Global Coal Demand Figure 6-2 shows the result of world coal demand through 2010 and the IEA’ s prediction until 2035. Predicted scenario shows three national approaches towards climate change, which are Current Policies Scenario, New Policies Scenario, and the 450 Scenario. World coal production in 2009 is 6.8 billion tons as performed value and demand for coal should continue the current policy remains would reach 11.2 billion tons in 2035. However, it is said that it is possible to reduce the consumption of coal 8.5 billion tons in New Polices Scenario and 4.8 billion tons in the 450 Scenario. Coal demand has been increasing rapidly since 2002 and coal price has been rising as a result. The period of stable demand was of stable coal prices also but in situations where rapidly increasing coal demand in non-OECD countries in recent years, tight supply has caused coal prices to increase and uncompetitive coal resources will allow the mining of coal and an increase in coal supply as the result. Therefore, the future price of coal is expected to rise until stabilizing the balance between supply and demand.

Data Collection Survey on Coal Power Master Plan Follow-up in the People’s Republic of Bangladesh
6-3
0
1,000
2,000
3,000
4,000
5,000
6,000
7,000
8,0001980
1985
1990
1995
2000
2005
2010
2015
2020
2025
2030
2035
Performance Current Policies Scenario
New Policies Scenario 450 Scenario
7,742Mtce
(11,226Mt)
3,309Mtce
(4,798Mt)
5,859Mtce
(8,496Mt)
y20094,705Mtce(6,863Mt)
Mtce
Source: IEA World Energy Outlook 2011
Figure 6-2 World Coal Demand Forecast About 90% of world coal consumption is thermal coal, so global coal demand trends can basically be considered to be global thermal coal demand trends. According to the “World Energy Outlook 2011” by IEA, the global coal demand in 2009 was 4.7 billion tons and occupied a 27% share of primary energy demand. From 2000 to 2010, the estimated global coal demand growth was 4.4% per annum, and that figure was far more than a 1.1% growth in oil demand and a 2.7% of growth in natural gas demand. As a result, coal contributed to a little less than half the level of primary energy demand growth in the 10 years. The main use of coal is for power generation. About two-thirds of the demand for coal is for power generation, and 20% is for industrial purposes. In power generation, the proportion of coal is about less than half, so coal can be the main fuel. In terms of future demand trends, the global coal demand is expected to increase by 1.9% per annum growth rate from 4.7 billion tonnes in 2009 to 7.7 billion tonnes in 2035 under the current policy scenario. Even under the new policy scenario7, the demand is expected to remain unchanged since 2020, but reach 5.9 billion tonnes in 2035. Concerning regional demand growth, whereas OECD countries are almost flat, non-OECD countries especially China and India are expected to experience large demand growth. Under the current policy scenario, the growth in coal demand in China and India is expected to account for three quarters of global coal demand growth by 2035. So the growth of coal imports of both countries is projected to have a major impact on the coal trade.
7 New policy scenario is a scenario, which is considered the planning and pledge released by the countries for energy
security or no environment problems, and it is not a forecast.

Data Collection Survey on Coal Power Master Plan Follow-up in the People’s Republic of Bangladesh
6-4
Table 6-2 Coal Demand by Region and Scenario (Mtce)
1980 2009 Current Policies
Scenario New Policies
Scenario
2020 2035 2020 2035 OECD 1,380 1,476 1,609 1,588 1,494 1,146 United States 537 693 751 773 705 599 Europe 663 415 431 400 383 264 Japan 85 145 165 156 158 115 Non-OECD 1,179 3,229 4,699 6,154 4,339 4,713 China 446 2,179 3,069 3,709 2,863 2,820 India 75 399 699 1,148 619 883 Russia NA 136 173 203 166 168 World 2,560 4,705 6,308 7,742 5,833 5,859
Source: IEA World Energy Outlook 2011
2) Global Coal Production According to BP statistics, global coal production in 2010 was 7.3 billion tonnes, an increase of 6.3 percent. Per country, production in China is overwhelming in comparison to other countries and its volume accounts for more than 40% of the total world coal production followed by the United States, India, and Australia.
Table 6-3 Global Coal Production Country Production (Million t per year)
China 3,240 USA 985 India 570
Australia 424 Russia 317
Indonesia 306 South Africa 254
Germany 182 Poland 133
Kazakhstan 111 Source: BP Statistical Reviews of World Energy 2011
3) Seaborne Trade in Coal
The volume of global seaborne trade in coal is approximately just over 10% of global coal consumption, so most coal is consumed in the country of production. Whereas about 30% of the consumption of coking coal depends on trade, thermal coal trade in global coal consumption is just about 10%.
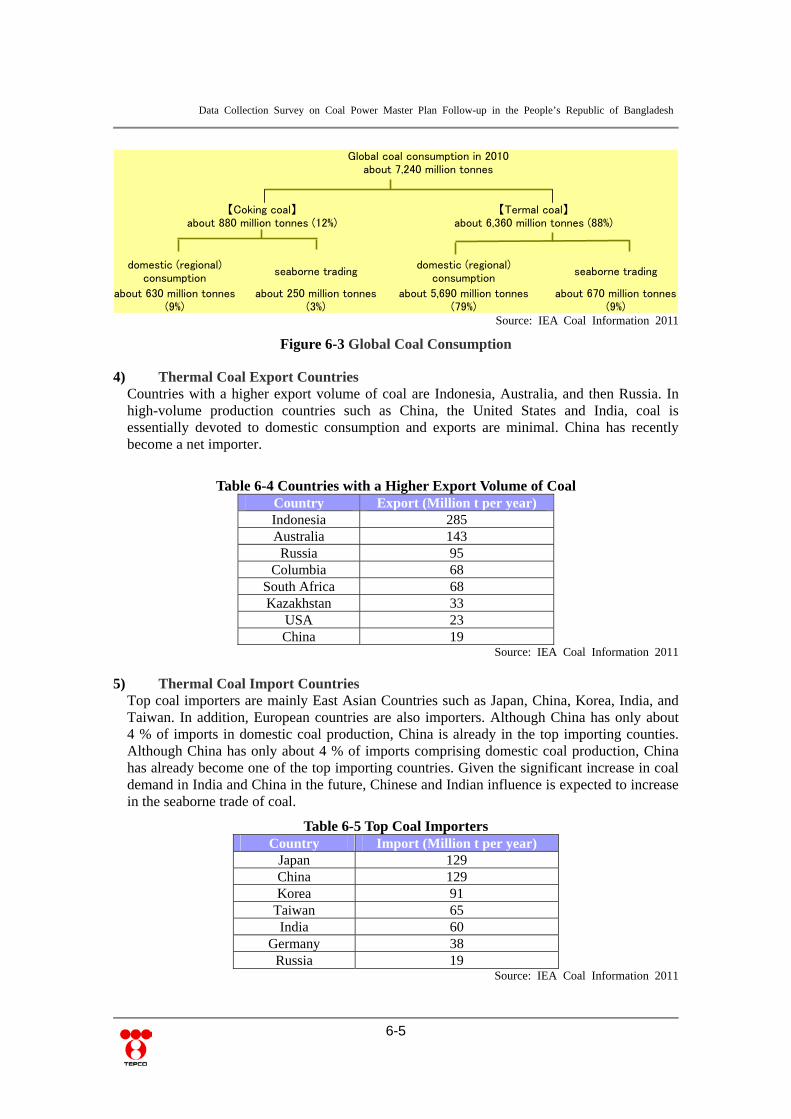
Data Collection Survey on Coal Power Master Plan Follow-up in the People’s Republic of Bangladesh
6-5
【Coking coal】 【Termal coal】about 880 million tonnes (12%) about 6,360 million tonnes (88%)
domestic (regional)consumption
seaborne tradingdomestic (regional)
consumptionseaborne trading
about 630 million tonnes about 250 million tonnes about 5,690 million tonnes about 670 million tonnes(9%) (3%) (79%) (9%)
Global coal consumption in 2010about 7,240 million tonnes
Source: IEA Coal Information 2011
Figure 6-3 Global Coal Consumption 4) Thermal Coal Export Countries
Countries with a higher export volume of coal are Indonesia, Australia, and then Russia. In high-volume production countries such as China, the United States and India, coal is essentially devoted to domestic consumption and exports are minimal. China has recently become a net importer.
Table 6-4 Countries with a Higher Export Volume of Coal Country Export (Million t per year) Indonesia 285 Australia 143 Russia 95
Columbia 68 South Africa 68 Kazakhstan 33
USA 23 China 19
Source: IEA Coal Information 2011
5) Thermal Coal Import Countries Top coal importers are mainly East Asian Countries such as Japan, China, Korea, India, and Taiwan. In addition, European countries are also importers. Although China has only about 4 % of imports in domestic coal production, China is already in the top importing counties. Although China has only about 4 % of imports comprising domestic coal production, China has already become one of the top importing countries. Given the significant increase in coal demand in India and China in the future, Chinese and Indian influence is expected to increase in the seaborne trade of coal.
Table 6-5 Top Coal Importers Country Import (Million t per year)
Japan 129 China 129 Korea 91
Taiwan 65 India 60
Germany 38 Russia 19
Source: IEA Coal Information 2011

Data Collection Survey on Coal Power Master Plan Follow-up in the People’s Republic of Bangladesh
6-6
For coal supply and demand forecasts of countries that can export to Bangladesh, coal production was examined country by country. In order to study the coal supply and demand forecast for 2030, Indonesia, Australia, South Africa and Mozambique will be considered due to possible coal-producing country and sea transport distances for Bangladesh. In addition, in terms of coal reserves and future production possibilities, as the neighboring countries of Bangladesh, Myanmar and Laos are considered. But stable export would still take time. Thailand has also been producing coal but their coal with high sulfur content is not able to expect, considering the fact that domestic consumption is limited. Since China becomes import coal country, it is excluded from the listed country.
6) The World Coal Demand and Topics of Major Countries
For coal supply and demand forecasts of countries that can export to Bangladesh, coal production was examined country by country. In order to study the coal supply and demand forecast for 2030, Indonesia, Australia, South Africa, and Mozambique will be considered as possible coal-producing countries and sea transport distances for Bangladesh. In addition, in terms of coal reserves and future production possibilities, as the neighboring countries of Bangladesh, Myanmar, and Laos are considered. But stable export would still take time. Thailand has also been producing coal but their coal with high sulfur content is not able to expect, considering the fact that domestic consumption is limited. Since China becomes import coal country, that is out of the question. a. Indonesia According to BP statistics, the proven reserves of coal in Indonesia were approximately 5.5 billion tonnes by the end 2010; the production volume is approximately 300 million metric tonnes. Among countries with higher production volume, Indonesia has relatively lower proven reserves; the reserve-production ratio is about 18 years. Meanwhile, according to the Ministry of Energy and Mineral Resources of Indonesia, Indonesia has 21.1 billion tonnes of proven and probable reserves, 104.9 billion tonnes of resources, and is considered to have abundant coal resources. The coal prospect area is Kalimantan and Sumatra.
Table 6-6 Indonesian Coal Production 1973 1980 1985 1990 1995 2000 2005 2007 2008 2009 2010e
Hard Coal 149 152 959 5,161 20,914 40,870 94,180 140,359 128,641 150,347 173,451Brown coal --- 152 949 5,069 20,914 38,507 76,361 108,473 120,125 140,900 162,551Total 2,122 2,284 3,893 12,220 43,823 81,377 172,546 250,839 250,774 293,256 336,002
Source: IEA Coal Information 2011
(1) Hard Coal represents higher grade coal and includes coking coal, anthracite and bituminous coal.
Lignight: non-agglomerating coals with a gross calorific value between 4,165kcal/kg and 5,700 kcal/kg on an ash-free but moist basis.
(2) Brown coal represents lower grade coal and includes lignite.
Lower grade coal (Sub-bituminus coal): non-agglomerating coals with a gross calorific value between 4,165kcal/kg and 5,700 kcal/kg on an ash-free but moist basis.
The quality of coal is generally lower than that in Australia. In part of Kalimantan, coal with high-calorific value is produced, but most coal is mid-low grade coal with about a 5,000kcal/kg calorific value. The coal in Sumatra is often more low-grade coal. In addition, the growth in the coal production volume which grew from 132 million tonnes in 2004 to 275 million tonnes in 2010 shows a marked rise. For Indonesian coal, the largest export counterpart has been in Japan until 2008. However, in 2009 China is first (33 million), India is second (32 million), Japan is third (25 million), South Korea is fourth (18million), and Taiwan is fifth (17million). Indonesia's coal exports in 2010 were 240 million tonnes and increased 19% from 201 million tonnes in 2009. In 2010,

Data Collection Survey on Coal Power Master Plan Follow-up in the People’s Republic of Bangladesh
6-7
the largest export market was China (61 million tonnes) which nearly doubled from 33 tonnes last year. The second was India (37 million tonnes). Japan has remained at around 30 million tons, but in Indonesia, the proportion of coal exports to Japan has continued to decrease due to the growth of Asian countries' demand for Indonesian coal. In 2006, the Indonesian government released the first plan of coal-fired power plant expansion of 10million kW (which is called the Crash Program). In addition, the second power plant expansion plan of 10million kW (second crash program) was announced in 2010. For the second crash program, which also includes enhanced geothermal power plants and hydro power plants, the coal-fired plants have been incorporated to comprise about one-third of increase of power generation capacity. Such an increase in coal-fired generation is planned to be used for domestic low-grade coal. In 2010, the Indonesian national power company PLN against this background urged the government to ban the exports of lower-grade coal. Meanwhile, the Indonesian government has demonstrated its intention to promulgate a ban on low-grade coal exports in 2014, the export of low-grade coal has needed upgrading. This story is not realistic because this upgrading technology was not commercially established and to absorb the growth of supply of lower-grade coal in Indonesia without exports is considered impossible in the short term. However, if you intend to procure Indonesia's low grade coal in the medium to long term the above information should be taken into account.
(Million tonnes)
Source: APBI-ICMA
Figure 6-4 Forecast of Indonesian Coal Production, Export, Domestic Sales 2005-2025 The main regulatory in the coal industry in Indonesia under the new mining law which was promulgated in January 2009, is the domestic supply obligation (DMO = Domestic Market Obligation) or minimum export price index.
○ Domestic Production

Data Collection Survey on Coal Power Master Plan Follow-up in the People’s Republic of Bangladesh
6-8
The DMO is the program, in which the Indonesian government manages the amount of domestic production and demand forecast and imposes the ratio of the mandatory domestic supply amount to the suppliers, but is said to be unclear in terms of operations such as in the area of the monitoring system or penalties. The minimum export price index is published monthly as a Reference Price of the price of coal sales (exports) which is calculated using the monthly average of the four international indices. It is said that the aim of the minimum export price is to prevent leakage of national assets or stabilize the revenue from royalties, etc. but this is also unclear in the area of operations. As mentioned above, it should be noted that although Indonesia's coal production and the export volume has increased, new regulations or increased use of domestic amounts might affect the importers in the medium to long term.
Table 6-7 Price Indices of November 2011
Source: APBI-ICMA
Production Production has jumped by about four times in the past decade. Major foreign producers of the first generation started mining high-grade bituminous
coal. After more than 10 years, high-grade coal reserves decreased gradually. Future development of new coal mines will move to poor mining conditions in inland areas. Despite the expected increase in production of about 70 million tons in five years, major production will occupy low-grade coal.
The production will increase further after 2010 by steadily increasing demand in Indonesia with some domestic coal utilization policy of the government. In the long term, increase of domestic demand could pressurize coal export.
Response to rising international oil prices by reducing the fuel subsidy has been concern about increased production costs.
Export Situation Indonesian coal exporter has more than 30 countries and the share of coal in Indonesia
has been rapidly increasing in the past decade. Figure 6-5 shows the total export volume of Indonesian steam coal in the past five years,
non-OECD countries export volume is shown for comparison with countries outside the OECD. Increase in exports can be seen from this figure that contributed to the increase in the country, especially non-OECD.

Data Collection Survey on Coal Power Master Plan Follow-up in the People’s Republic of Bangladesh
6-9
Figure 6-6 shows a breakdown of the non-OECD. Taking advantage of the close ratio
for Australia, three countries in the Far East namely Taiwan, Japan, and Korea have become accepted as an alternative to an increase in China’s coal supply instability. It is one of the reasons for increasing export to ASEAN countries that they have been further increased by the new IPP power plant designed to sub-bituminous coal and cheaper.
As Indonesian coal is low sulfur sub-bituminous coal with low ash characteristics of the world’s only good for the environment, Indonesia’s coal market is expanding into the Atlantic and volume has increased in recent years for Europe. Indonesian coal is also one of the few sources capable of supplying the demand for coal in India and China, which are likely to achieve further growth.
High-grade coal is limited in order in terms of production and reserves, and increasingly polarized between the prices of low-grade coal and high-grade coal. Although low-grade coal has a capacity of production due to strong demand from India and China in recent years can be seen somewhat overshadowed competitive than before.
On the other hand, Indonesian coal with the characteristics of good for the environment is evaluated establishing in its own market. Shippers are willing to increase production in response because of the strong export and it is possible to negotiate flexible terms than even the Australian coal. However, as shown in Figure 6-7, steam coal export volumes in the future could continue to decline due to increased domestic demand in Indonesia.
Indonesia’s transport infrastructure is less loading facility and rail transport terminals compared to Australia and China and many offshore barge transports are major. The relative merits of each supplier’s management skills are becoming more clear.
0
2 0 , 0 0 0
4 0 , 0 0 0
6 0 , 0 0 0
8 0 , 0 0 0
1 0 0 , 0 0 0
1 2 0 , 0 0 0
1 4 0 , 0 0 0
1 6 0 , 0 0 0
1 8 0 , 0 0 0
1 9 9 5 2 0 0 0 2 0 0 5 2 0 0 8 2 0 0 9 2 0 1 0 e
T o t a l E x p o r t
O E C D T o t a l
N o n ‐ O E C D T
1 , 0 0 0 t / y
Source: IEA Coal information 2011
Figure 6-5 Total Export Volume of Indonesian Steam Coal, Non OECD-country Comparison of OECD Countries
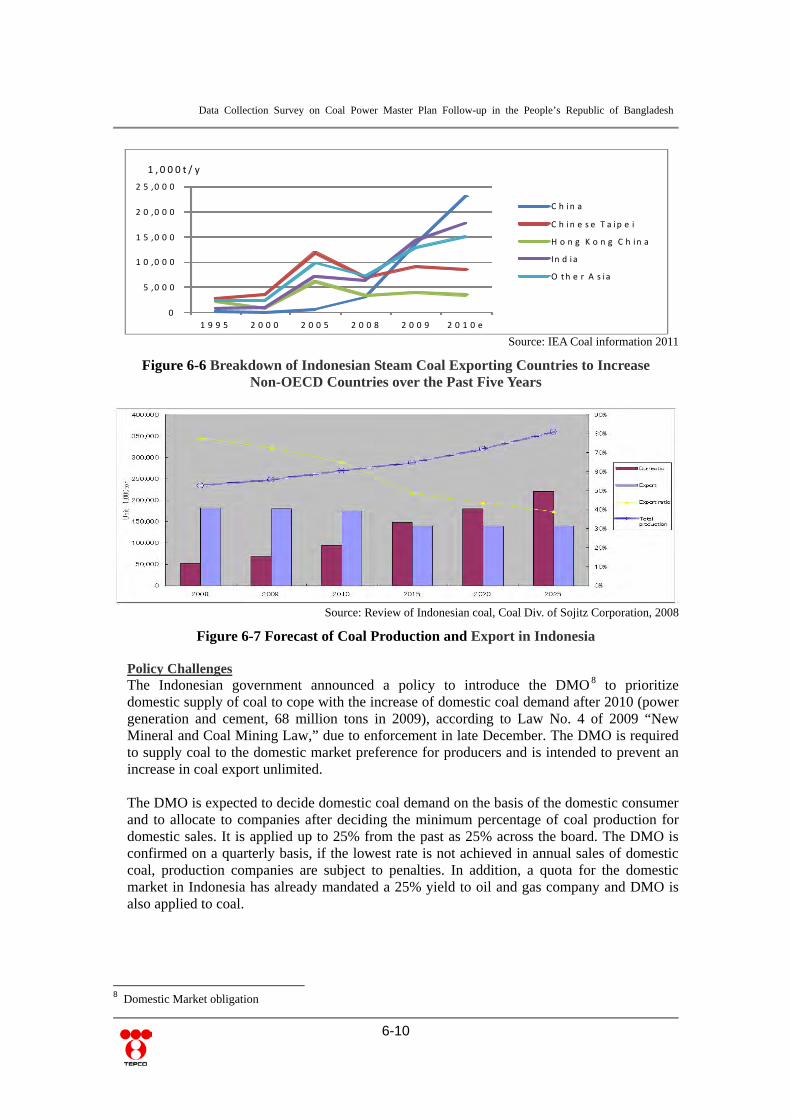
Data Collection Survey on Coal Power Master Plan Follow-up in the People’s Republic of Bangladesh
6-10
0
5 ,0 0 0
1 0 ,0 0 0
1 5 ,0 0 0
2 0 ,0 0 0
2 5 ,0 0 0
1 9 9 5 2 0 0 0 2 0 0 5 2 0 0 8 2 0 0 9 2 0 1 0 e
C h in a
C h in e s e T a ip e i
H o n g K o n g C h in a
In d ia
O th e r A s ia
1 , 0 0 0 t / y
Source: IEA Coal information 2011
Figure 6-6 Breakdown of Indonesian Steam Coal Exporting Countries to Increase Non-OECD Countries over the Past Five Years
Source: Review of Indonesian coal, Coal Div. of Sojitz Corporation, 2008
Figure 6-7 Forecast of Coal Production and Export in Indonesia
Policy Challenges The Indonesian government announced a policy to introduce the DMO 8 to prioritize domestic supply of coal to cope with the increase of domestic coal demand after 2010 (power generation and cement, 68 million tons in 2009), according to Law No. 4 of 2009 “New Mineral and Coal Mining Law,” due to enforcement in late December. The DMO is required to supply coal to the domestic market preference for producers and is intended to prevent an increase in coal export unlimited. The DMO is expected to decide domestic coal demand on the basis of the domestic consumer and to allocate to companies after deciding the minimum percentage of coal production for domestic sales. It is applied up to 25% from the past as 25% across the board. The DMO is confirmed on a quarterly basis, if the lowest rate is not achieved in annual sales of domestic coal, production companies are subject to penalties. In addition, a quota for the domestic market in Indonesia has already mandated a 25% yield to oil and gas company and DMO is also applied to coal.
8 Domestic Market obligation

Data Collection Survey on Coal Power Master Plan Follow-up in the People’s Republic of Bangladesh
6-11
The new Mineral and Coal Law has clearly stated that add value to mineral resources and low-grade coal export restrictions have emerged as a part of it in coal fields. This is that low-grade coal without coal processing such as upgrading quality should not be exported. Its impact is great for medium and small size mines that have profited by the increasing export of low-grade coal to China and India. Currently, it is critical issues that the calorific value of low-grade coal is to delineate where the amount of calorific value, such as 5,100 kcal/kg or 5,500 kcal/kg for example, should be. Meanwhile, although the details of coal processing technologies to add value are unknown, whether improved coal technologies are going well in commercial base is hard to say in the current situation. How it is embodied in this bill really has been questioned. b. Australia Australia’s coal reserves were approximately 76.4 billion tons by the end of 2010, the fourth highest in the world. Coal prospects are skewed, mostly in eastern Queensland state (QLD) and New South Wales state (NSW). The Australian coal industry plays an important role in the supply of inexpensive fuel for electricity, the creation of jobs, and export revenue. Furthermore, at the same time it also plays an important role in supplying high-quality coal to the global coal market. According to “Coal Information 2011” by IEA, in 2010 the production of coking coal was 152 million tonnes and the production of thermal coal (including brown coal) was 268 million tonnes. There are no statistics yet for 2011. The rains in northeastern Australia in January 2011 were forced to temporarily shut down many mines because the open pit mines were submerged, or the rail network stopped. The total export volume of coal is ranked first and has exported over 290 million tons of coking coal and thermal coal. The coking coal and thermal coal export ratio is roughly half and half, and coal exports from QLD is about 60% and the rest is roughly from NSW. Coal Exports from QLD are coking coal nearly half and thermal coal nearly half. Meanwhile 80% of coal exports from NSW are thermal coal. The main thermal coal for exports is bituminous coal and has high calorific value. About half of coal is exported to Japan. The East Asian countries such as South Korea, Taiwan and China have become major export destinations.
Table 6-8 Australian Coal Production 1973 1980 1985 1990 1995 2000 2005 2007 2008 2009 2010e
Hard Coal 55,483 71,610 122,346 158,572 191,055 239,429 300,190 324,571 325,375 334,630 253,034Brown coal 24,121 32,894 38,380 45,990 50,752 67,293 67,152 65,613 66,033 68,252 67,225Total 81,577 106,484 162,711 206,552 243,802 308,722 369,347 392,191 393,416 404,891 320,259
Source: IEA Coal Information 2011
(1) Hard Coal represents higher grade coal and includes coking coal, anthracite and bituminous coal.
Lignight: non-agglomerating coals with a gross calorific value between 4,165kcal/kg and 5,700 kcal/kg on an ash-free but moist basis.
(2) Brown coal represents lower grade coal and includes lignite.
Lower grade coal (Sub-bituminus coal): non-agglomerating coals with a gross calorific value between 4,165kcal/kg and 5,700 kcal/kg on an ash-free but moist basis.

Data Collection Survey on Coal Power Master Plan Follow-up in the People’s Republic of Bangladesh
6-12
Source: IEA Coal information 2011
Figure 6-8 Australian Coal Export Volume Export Situation Australian Bureau of Statistics Agricultural and Resource Economics (ABARE) has formulated plans for future production stating that it will increase depending on needs. For example, the export outlook for 2015 is forecast at 390 million tons. (183 million tons of coking coal, 207 million tons of steam coal). Figure 6-9 shows that Australian export increases steadily to OECD and non-OECD countries. In the future, increases of low rank coal export are expected to non-OECD countries.
0
2 0 ,0 0 0
4 0 ,0 0 0
6 0 ,0 0 0
8 0 ,0 0 0
1 0 0 ,0 0 0
1 2 0 ,0 0 0
1 4 0 ,0 0 0
1 6 0 ,0 0 0
1 9 9 5 2 0 0 0 2 0 0 5 2 0 0 8 2 0 0 9 2 0 1 0 e
T o t a l E x p o r t
O E C D T o t a l
N o n ‐O E C D T
1 , 0 0 0 t / y
Source: IEA Coal information 2011
Figure 6-9 Comparison of Exports of Non-OECD Countries and OECD Countries in Total Exports of Australian Steam Coal

Data Collection Survey on Coal Power Master Plan Follow-up in the People’s Republic of Bangladesh
6-13
It can be seen that China and India are increasing rapidly in non-OECD countries as shown in Figure 6-10. This is one of the factors that increase of their import is caused by more interest in getting of coal mines in Australia.
0
5 0 0 0
1 0 0 0 0
1 5 0 0 0
2 0 0 0 0
2 5 0 0 0
1 9 9 5 2 0 0 0 2 0 0 5 2 0 0 8 2 0 0 9 2 0 1 0 e
C h in a
C h in e s e T a ip e i
In d i a
O t h e r A s i a
1 , 0 0 0 t / y
Source: IEA Coal information 2011
Figure 6-10 Breakdown of Australian Steam Coal Exporting Countries has Increased over the Past Five Years in Non-OECD Countries
Source: IEA Coal information 2011
Figure 6-11 Export Countries for Australian Coal Although both NSW and QLD planned a very large number of new development projects, QLD has the especially larger projects (which plans to produce 20~30milllion tonnes per one year). The growth of coal exports from QLD is assumed.

Data Collection Survey on Coal Power Master Plan Follow-up in the People’s Republic of Bangladesh
6-14
In Australia the major mode of domestic transportation for exported coal export is railways. Coal is transported by railway to the port of shipment and unloaded into the shipment. The lack of capacity in the port and railway may be the bottleneck, it is necessary to pay attention to not only the situation with the expansion plans of coal mines but also with the expansion plans of the infrastructure. In QLD, the Northern Missing Link Railway (about 70 km), linking the Bowen Basin with the Abbot Point port, has just started operations, the Surat Basin Railway project (210km approx), linking Surat Basin with Surat Basin and the Port of Gladstone, is also in progress (scheduled to begin construction in 2012).

Data Collection Survey on Coal Power Master Plan Follow-up in the People’s Republic of Bangladesh
6-15
Source: Government of QLD
Figure 6-12 Railways in QLD

Data Collection Survey on Coal Power Master Plan Follow-up in the People’s Republic of Bangladesh
6-16
In Australia, for coal exports, there are four major ports in QLD and two major ports in NSW. In the port of Newcastle in NSW, the largest port for coal exports are in Australia, or in Dalymple Bay Coal Terminal in QLD, due to rail transport constraints etc., demurrage9 occurs constantly. It should be noted that demurrage causes such risks as delivery delays, risk of increase of number of vessels required, and increased costs. Furthermore, the Port of Newcastle is so crowded, because it may impose conditions on the ships in terms of efficient operations, it is necessary to pay attention to the port regulations10. The current total coal output capacity is about 400 million tonnes per year, and a delivery capacity expansion plan is underway at major coal ports, the port capacity around 2012-2013 will be significantly enhanced. However, if the railway transportation capacity is unable to keep up with the expansion of production capacity and port capacity, railway transportation capacity may become bottlenecked. c. South Africa Production Seen from the coal reserves and production capacity in Table 6-9, it is understood that South African coal export potential is high. Reserves in the table indicate the amount of recoverable reserves of anthracite and bituminous coal only, not including sub-bituminous and lignite. Be aware that some countries have become significantly less R/P accordingly and this table is a comparison of high-grade coal only. South Africa is the sixth coal resources power in the world following the U.S., China, India, Russia, and Australia and has 7.4% of the world’s recoverable reserves of coal. South Africa has no recoverable reserves of sub-bituminous and lignite and has become the world’s eighth rate to 3.7% in the world of coal resources of 82.6 billion tons including these coals. South Africa is the fifth in world production with 251 million tons, accounting for 4.2% of world output. For sales, while exports are significantly higher than the domestic sales volume, export volume is 64 million tons (world’s fifth largest) and market share is 8.1%.
9 In December 2011 about 60 coal vessels are waiting in front of the port of Newcastle. 10 In the Port of Newcastle, for example, ship's capacity of discharging ballast water is needed to be at least the equal
level to port's capacity of loading coal. The reason is that operational efficiency is reduced, due to the waiting time for discharging ballast water, if the capacity of discharging ballast water is less than the capacity of loading coal. The capacity of de-ballast-water of 20,000-30,000 tonnes-vessel is generally well below the loading ability, so these small vessels is difficult to load coal in the port of Newcastle. Similar cases have also been observed at other countries' ports. It should be recognized the possibility that the port impose such regulation if the port get to be crowded in the future. It is noted that the port of the power station where only small vessels can berth possibly prevents flexible procurement.

Data Collection Survey on Coal Power Master Plan Follow-up in the People’s Republic of Bangladesh
6-17
Table 6-9 Position in the World of South African Coal Industry Country Reserve11 Ranking Production
in 2008 Ranking Export in
2008 Ranking R/P12
(Billion t) (Million t) (Million t) (Year)
USA 109.0 1 1,007 2 43 6 108China 62.2 2 2761 1 --- 23India 54.0 3 489 3 --- 110Russia 49.1 4 247 7 76 3 199Australia 36.8 5 325 4 251 1 113South Africa 30.4 6 251 5 64 5 121Kazakhstan 28.2 7 104 8 2 7 271Ukraine 15.4 8 n.a n.a n.aColumbia 6.4 9 79 10 74 4 81Poland 6.0 10 84 9 --- 71Indonesia 1.7 11 246 6 203 2 7Others 12.1 252 55 Total 411.3 5845 793 70
Source: Mining Association of South Africa annual report 2009 (source WEC, BP, IEA)
Table 6-10 shows South African coal productions. The data of the IEA said that South African does not produce brown coal, but only hard coal.13 But also it seems to include high-ash coal called middling coal after coal washing during the coal has been exported to countries outside the OECD in recent years.
Table 6-10 South African Coal Production 1973 1980 1985 1990 1995 2000 2005 2007 2008 2009 2010e
Hard Coal 62,352 115,120 173,500 174,800 206,211 224,200 244,986 247,666 252,213 250,582 254,727Brown coal 0 0 0 0 0 0 0 0 0 0 0Total 64,325 117,100 175,485 176,790 208,206 226,200 246,991 249,673 254,221 252,591 254,727
Source: IEA Coal Information 2011
(1) Hard Coal represents higher grade coal and includes coking coal, anthracite and bituminous coal.
Lignight: non-agglomerating coals with a gross calorific value between 4,165kcal/kg and 5,700 kcal/kg on an ash-free but moist basis.
(2) Brown coal represents lower grade coal and includes lignite.
Lower grade coal (Sub-bituminus coal): non-agglomerating coals with a gross calorific value between 4,165kcal/kg and 5,700 kcal/kg on an ash-free but moist basis.
Export Situation South African coal is mainly steam coal. In 2008, about 75% of coal, which is 64 million tons, was exported and the remaining 25% was consumed domestically. It accounts for 8% of world exports. South Africa is the world’s fifth largest exporter of coal almost on par with Colombia next to Australia, Indonesia, and Russia. Exports of coal are leading Europe such as the Netherlands, Germany, Spain, and Italy in 2008 and accounted for about two-thirds of the volume of exports. On the other hand, it has been rapidly increasing exports to India in 2008, and 7.7 million tons of exports have become second only to the Netherlands. Coal terminal Richards Bay (RBCT) will export most of the South African coal and is in the increase to 91 million tons from 72 export capacity to address the shortage of coal demand internationally and expected to be completed in the second quarter of 2010. At the end of 2009, a shipment of the RBCT capacity was expected to be 81 million tons. RBCT’s annual shipment amount was reduced to a peak of 69.2 million tons in 2005 and 2008 was nearly 62
11 Reserves is the end of 2007 12 R/P: Reserve and Production As this table has been divided the production of 2008, the mine life shows in a
production-based mining in 2008 13 Hard coal; Anthracite and Bituminous coal, gross calorific value not less than 5,700kcal/kg, Brown coal;
Sub-bituminous coal and Lignite, gross calorific value less than 5,700kcal/kg
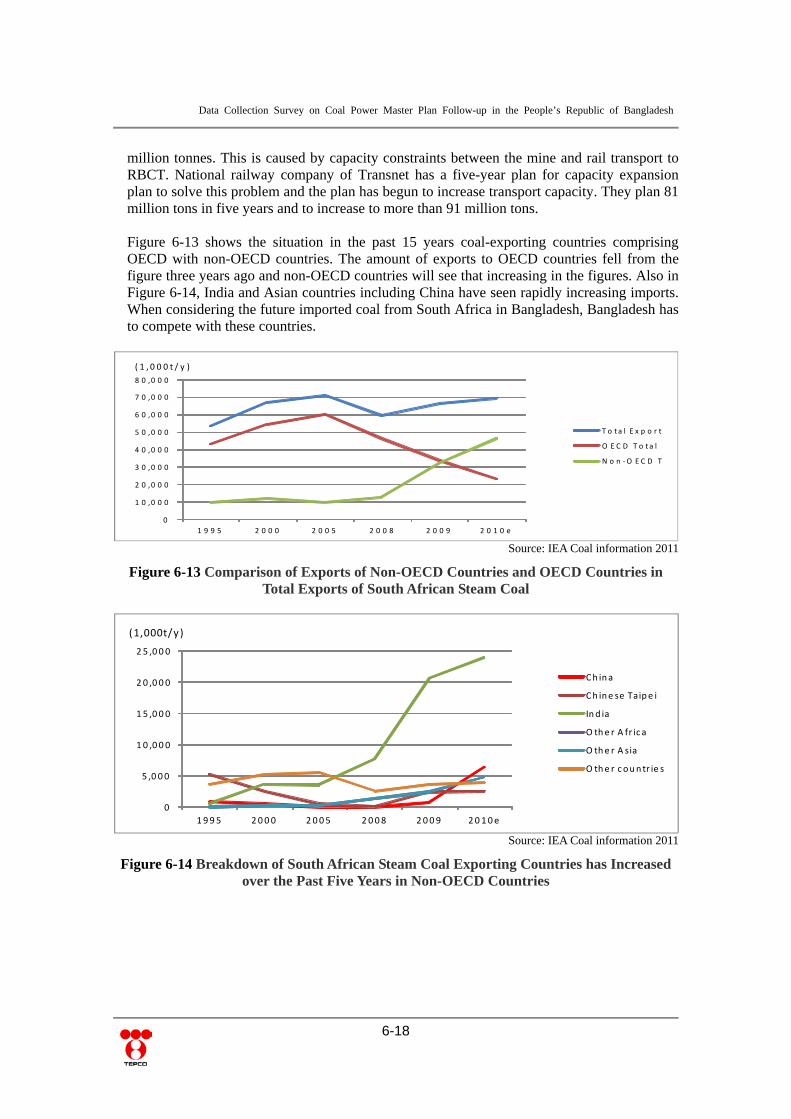
Data Collection Survey on Coal Power Master Plan Follow-up in the People’s Republic of Bangladesh
6-18
million tonnes. This is caused by capacity constraints between the mine and rail transport to RBCT. National railway company of Transnet has a five-year plan for capacity expansion plan to solve this problem and the plan has begun to increase transport capacity. They plan 81 million tons in five years and to increase to more than 91 million tons. Figure 6-13 shows the situation in the past 15 years coal-exporting countries comprising OECD with non-OECD countries. The amount of exports to OECD countries fell from the figure three years ago and non-OECD countries will see that increasing in the figures. Also in Figure 6-14, India and Asian countries including China have seen rapidly increasing imports. When considering the future imported coal from South Africa in Bangladesh, Bangladesh has to compete with these countries.
0
1 0 ,0 0 0
2 0 ,0 0 0
3 0 ,0 0 0
4 0 ,0 0 0
5 0 ,0 0 0
6 0 ,0 0 0
7 0 ,0 0 0
8 0 ,0 0 0
1 9 9 5 2 0 0 0 2 0 0 5 2 0 0 8 2 0 0 9 2 0 1 0 e
T o t a l E x p o r t
O E C D T o t a l
N o n ‐O E C D T
( 1 , 0 0 0 t / y )
Source: IEA Coal information 2011
Figure 6-13 Comparison of Exports of Non-OECD Countries and OECD Countries in Total Exports of South African Steam Coal
0
5 ,0 00
1 0 ,0 0 0
1 5 ,0 0 0
2 0 ,0 0 0
2 5 ,0 0 0
1995 200 0 2 005 2 008 200 9 20 10e
Ch ina
Ch ine se Taipe i
Ind ia
O the r A fr ic a
O the r A sia
O the r coun tr ie s
(1,000t/y )
Source: IEA Coal information 2011
Figure 6-14 Breakdown of South African Steam Coal Exporting Countries has Increased over the Past Five Years in Non-OECD Countries

Data Collection Survey on Coal Power Master Plan Follow-up in the People’s Republic of Bangladesh
6-19
Policy Challenges Mining Charter enacted in 2004 is the action and commitment to provide real benefits arising from human and economic resources and mining of all South Africans. This authorization Charter (Empowerment Charter) is as stated in the vision to create the industry and to reflect the non-racial South Africa pledge, blacks who have been historically disadvantaged (HDSA14) are intended to participate in industrial management. As we can see the future, the domestic production activities will be issued a policy to improve the future earnings of blacks and there are no regulations that affect the export of coal. d. Mozambique Production and Planning Though the current production is 40,000–50,000 tons, since the discovery of coking coal, the foreign investment has been extremely active. Table 6-11 summarizes their production plans. In the short term of five years, 3.3 million tons of steam coal will be exported and in the medium term of 10 years, the export capacity of 7.3 million tons is expected. Along with other domestic transportation infrastructure, it is expected to accelerate further development of coal mines and export volume also increased.
Table 6-11 Current Coal Production Plans in Mozambique (million tonnes) Moatize coal mine, Vale Co. Ltd15
Reserve Phase 1
(second half 2011) Phase 216
870
Total 12Coking coal: 9Thermal coal:3
Total 22Coking coal:16.5 Thermal coal:5.5
Benga coal mine, Riversdale & Tata Co.Ltd17
Reserve Step 1
(second half 2011) Step 218 Step 3
273 Total 2
Coking coal: 1.7Thermal coal:0.3
Total 5.3 Coking coal:4.5
Thermal coal:0.8
Total 12Coking coal:10.2 Thermal coal:1.8
Total 1,143 14 27.3 34Source: The Survey team
Transport Infrastructure Vale and Riversdale’s two major companies are allowed to proceed to large-scale development of coking coal mines. Restoration work of Senna’s rail line linking the port of Beira and Moatize completed 665 km area in late January 2010. It is expected to begin new construction of a coal terminal in the port of Beira also in 2010. Meanwhile, the ability of annual coal transportation is up to 6–8 million tons and must increase transport capacity further. CFM companies of private investment are considering expansion plan tons per year of 18 million but it is difficult to raise funds. Benga coal mine has considered barges in the Zambezi River without the use of the Senna line. About the new coal terminal of Port Beira, the expansion plan of 6 million tons/year in Phase 1, 12 million/year in Phase 2, and 20 million/year in Phase 3 is also considered but the required 36 million/year is not supported. Only Panamax vessels can get to the shore due to shallow water at the coal terminal.
14 HDSA : Historically Disadvantaged South Africans 15 Brazilian company 16 The percentage of coking coal and thermal coal of the Phase 2 estimates from Phase 1 17 This project is Australia's Riversdale Mining Limited (65%) Tata Steel Limited in India (35%) joint venture 18 The percentage of Coking Coal and Thermal Coal from Step 2 estimate from step 1

Data Collection Survey on Coal Power Master Plan Follow-up in the People’s Republic of Bangladesh
6-20
For other large Cape size vessels, offshore loading facilities are required and the construction of this facility is under consideration and still has a problem. Coal Quality The quality of Benga steam coal is 6,390 kcal/kg gross calorific value, ash content of 22% air dried basis, 20% volatile matter, GI80, 1425°C melting point of ash, 7% total moisture content. As high ash middling product is also produced after coal washing of coking coal to get low ash content, it will be consumed as domestic fuel and exported as well.
6.1.3 Trends in Coal Prices of Steam Coal
1) Price Trends
Australian thermal coal price index, until around 2003, had remained at about $20-30/MT, but began to rise from around 2004 with similar trends in other energy prices, and reached around $180/MT before the financial crisis in 2008. After that, the coal price index fell to about $60/MT due to weak demand, and then recovered due to the expansion of China’s coal imports. Coal prices in 2010 due to a slowdown in production caused by heavy rain in Australia in January have risen to $120/MT.
2) Thermal Coal Pricing in the Term Contract Many power companies in Japan often have one-year-term contracts, and often adopt a fixed price. Japanese major coal users and Australian major suppliers negotiate the contract price and that price serves as a reference price for other contracts. This reference price is considered to be one indicator in the contracts between other Asian consumers such as South Korea, Taiwan and China and suppliers. Per the chart below, because Indonesian coal price trends have a similar trend with the Australian coal price, the reference price is also considered to be an indicator in the negotiation of contracts of Indonesian coal exports. The Indonesian coal price seems to have remained at a constant difference to the Australian coal price due to a quality gap. But it should be noted that China and India has increased the import of less middle or low-grade coal and so the Indonesian coal price advantage may be affected by trends in such importers. There are examples of power companies located in South Korea, Taiwan or India procuring coal via a bidding process. Given that required specifications can be wide and varied; this bidding process is considered to be quite effective.

Data Collection Survey on Coal Power Master Plan Follow-up in the People’s Republic of Bangladesh
6-21
Source: The Survey team
Figure 6-15 Australian Spot Price Index and Prices of Term Contracts CIF19 Unit Price of Fuel that Japan's Import Figure 6-16 shows CIF unit price of fuel over the past 10 years for reference, which Japan has imported crude oil, fuel oil crank, steam coal, and LPG. It will be helpful in comparing the fuel price fluctuations and shows that coal is overwhelmingly cheap compared with other energy sources in this.
0.00
1.00
2.00
3.00
4.00
5.00
6.00
7.00
8.00
9.00
2001.03 2002.03 2003.03 2004.03 2005.03 2006.03 2007.03 2008.03 2009.03 2010.03 2011.03
Crude Oil Bunker C Thermal Coal LPG LNG
¢/1,000kcal/kg
Source: Based on the JCOAL World Call Report (cited in Ministry of Finance statistics) the Survey team
Figure 6-16 CIF unit price of imported fuel in Japan
19 CIF: Cost, insurance and Freight

Data Collection Survey on Coal Power Master Plan Follow-up in the People’s Republic of Bangladesh
6-22
FOB Price Fluctuations in the Calorific Value of Indonesian coal Figure 6-17 shows the fluctuation of the FOB20 price of Indonesian coal calorific value. The coal price per calorific value in Indonesia is only data from August 2008 but this is good information for price reference.
$0.00
$20.00
$40.00
$60.00
$80.00
$100.00
$120.00
$140.00
$160.00
2008/10/03
2009/01/03
2009/04/03
2009/07/03
2009/10/03
2010/01/03
2010/04/03
2010/07/03
2010/10/03
2011/01/03
2011/04/03
2011/07/03
2011/10/03
6500 Kcal
5800Kcal
5000Kcal
4200Kcal
FOB US$/t
Source: The Survey team based on Indonesian Coal Index Report
Figure 6-17 FOB Price Fluctuations in the Calorific Value per Each Indonesian Coal Figure 6-18 shows coal price per 1,000 kcal/kg based on Figure 6-17. The price of 1,000 kcal/kg is generally thought to be similar regardless of total calorific value; however, in fact, Figure 6-18 indicates that the price of 1,000 kcal/kg of high-grade coal is found higher than low-grade coal. An average unit of 5,000 kcal/kg as compared with the 6,500 kcal/kg is 85% calculated from these data.
Source: The Survey team based on Indonesian Coal Index Report
Figure 6-18 Price Fluctuations of 1,000 kcal / kg Calorific Value per Each Indonesian Coal
20 FOB: Free On Board

Data Collection Survey on Coal Power Master Plan Follow-up in the People’s Republic of Bangladesh
6-23
Figure 6-19 shows the FOB price with each 1,000 kcal/kg at Port of Newcastle in Australia used to report PSMP201021 and the FOB price per 1,000 kcal/kg of Indonesian coal of 5,000 kcal/kg indicated in Figure 6-18, is also shown. It is clear that price fluctuations are aligned. As Newcastle unit is based on the 6,700 kcal/kg, the unit is slightly higher than Indonesian coal unit.
0.00
0.50
1.00
1.50
2.00
2.50
3.00
3.50
Jan‐01 Nov‐01 Sep‐02 Jun‐03 Apr‐04 Feb‐05 Dec‐05 Oct‐06 Aug‐07 Jun‐08 Mar‐09 Jan‐10 Nov‐10 Sep‐11 Jul‐12
FOB New Castle by API6 FOB Indonesian Coal of 5,000kcal/kg
US¢/t, 1,000kcal/kg
Source: The Survey team based on Argus/McCloskey’s Coal Price Index report APl6
Figure 6-19 Price Fluctuations of 1,000 kcal / kg of FOB Newcastle, Australia and FOB Indonesian Coal
6.1.4 The Forecast of Total Amount of Imported Coal Price
Long-term coal price scenario of IEA in World Energy Outlook 2011 said that the current policy scenario assumes 110 US$/ton of coal import price of the OECD. Moreover, in the long-term coal price forecast financial institutions are assumed to be approximately from 80 to 100 US$/ton units in general.
Table 6-12 Long-term Coal Price Scenario for OECD Countries Real terms (2010 prices) ($/t)
Current Policies Scenario New Policies Scenario
2010 2015 2020 2025 2030 2035 2015 2020 2025 2030 2035
99.2 104.6 109.0 112.8 115.9 118.4 103.7 106.3 108.1 109.3 110.0 Source: IEA World Energy Outlook 2011
Looking at price trends over the past 10 years 1,000 kcal/kg in Figure 6-21, the above price forecasts of the IEA are fairly inexpensive. When considering the needs of low-grade coal in countries other than OECD, expected when using the IEA, price seems to be risky. The Survey team conducted price forecasts in accordance with the following way.
1) Methodology of Imported Coal Price Forecasts
The price forecast using the following methodology in PSMP2010 conducted in 2010 was subsequently revised based on the information obtained in the Survey.
FOB coal price prediction per 1,000 kcal/kg in 2030 based on actual data for the past 10
years of FOB coal price per 1,000 kcal/kg at Port of Newcastle in Australia shown in Figure 6-19
21 PSMP2010: Power System Master Plan 2010, JICA

Data Collection Survey on Coal Power Master Plan Follow-up in the People’s Republic of Bangladesh
6-24
Determination of calorific value of imported coal Determination of FOB price based on the calorific value Determination of the total amount of imported coal until power stations including CIF
and domestic handling charge
2) Prediction of FOB Price per 1,000 kcal / kg until 2030 Figure 6-20 shows correlation curve to determine FOB price trends in per 1,000 kcal/kg at Newcastle Port in Australia. The rapid rise in price data that appeared from January to October 2008 in the FOB price of the trends in Figure 6-18 is considered inappropriate in order to predict 2030 and Figure 6-22 shows the data excluded the data of January to October 2008 and obtained correlation curve. Since the FOB price per 1,000 kcal/kg of Newcastle is calculated based on 6,700 kcal/kg, considering a low-grade coal being imported in Bangladesh, the FOB price has lowered the cost per 1,000 kcal/kg by the difference in Indonesian coal price in Figure 6-18. High Case is 85% of the FOB price obtained from Figure 6-22 and Base Case is 85% of the High Case. Each case is shown in Figure 6-21.
y = 16.423ln(x) ‐ 172.61
R² = 0.6643
0.00
0.50
1.00
1.50
2.00
2.50
3.00
Jun‐01
Nov‐01
Apr‐02
Sep‐02
Jan‐03
Jun‐03
Nov‐03
Apr‐04
Sep‐04
Feb‐05
Jul‐05
Dec‐05
May‐06
Oct‐06
Mar‐07
Aug‐07
Jan‐08
Jun‐08
Oct‐08
Mar‐09
Aug‐09
Jan‐10
Jun‐10
Nov‐10
Apr‐11
Sep‐11
Feb‐12
Jul‐12
FOB New Castle by API6
US¢/t, 1,000kcal/kg
Source: The Survey team based on Argus/McCloskey’s Coal Price Index report APl6
Figure 6-20 FOB Price Fluctuations and Correlation Curve per 1,000 kcal / kg at Port of Newcastle in Australia
y = 14.989ln(x) ‐ 157.53
R² = 0.8535
0.00
0.50
1.00
1.50
2.00
2.50
3.00
Jun‐01
Nov‐01
Apr‐02
Sep‐02
Jan‐03
Jun‐03
Nov‐03
Apr‐04
Sep‐04
Feb‐05
Jul‐05
Dec‐05
May‐06
Oct‐06
Mar‐07
Aug‐07
Jan‐08
Jun‐08
Oct‐08
Mar‐09
Aug‐09
Jan‐10
Jun‐10
Nov‐10
Apr‐11
Sep‐11
Feb‐12
Jul‐12
FOB New Castle by API6
Source: The Survey team based on Argus/McCloskey’s Coal Price Index report APl6
Figure 6-21 Ccorrelation Curve Excluded the Data of Jan. to Oct. 2008 in Figure 6-20

Data Collection Survey on Coal Power Master Plan Follow-up in the People’s Republic of Bangladesh
6-25
y = 14.989ln(x) ‐ 157.53R² = 0.8535
0.00
0.50
1.00
1.50
2.00
2.50
3.00
3.50
4.00
4.50
Jan‐01
Feb‐02
Mar‐03
Apr‐04
May‐05
Jun‐06
Jul‐07
Sep‐08
Oct‐09
Nov‐10
Dec‐11
Jan‐13
Feb‐14
Mar‐15
May‐16
Jun‐17
Jul‐18
Aug‐19
Sep‐20
Oct‐21
Nov‐22
Jan‐24
Feb‐25
Mar‐26
Apr‐27
May‐28
Jun‐29
Jul‐30
Sep‐31
Oct‐32
FOB New Castle by API6 FOB Indonesian Coal of 5,000kcal/kg High Case Base Case
Source: The Survey team based on Argus/McCloskey’s Coal Price Index report APl6
Figure 6-22 Eestimation of the High Case and Base Case of FOB Prices until 2030 Based on FOB Unit Price of Coal per 1,000 kcal / kg at Port of Newcastle
3) Determination of the Calorific Value of Imported Coal
When the calorific value of coal imported by Bangladesh is considered from the viewpoint of the importation of coal available in the future stability, the circumstances described below are examined. An extra 6,000 kcal/kg for the average demand has already been decided in developed
countries, the new market of Bangladesh is difficult. For boiler design, to use the higher caloric value becomes smaller investment amount
and better efficient combustion but when calorific value is below the design specifications of imported coal from supply problems in the future, it will cause significant operational problems. It is often seen in cases of new power plants in developing countries. Conversely, if the calorific value greater than the design specification, it is a minor problem.
As an example of the current power plant in Korea in Figure 6-23, existing power station also tends to lower the calorific value of coal in terms of securing stable supply of coal.
Consider the range and amount of heat to 5,100 kcal/kg ~ 5,000 kcal/kg from the above situation, the average calorific value of imported coal of 5,100 kcal/kg studied in PSMP 2010 is reasonable and determined.
Source: Presentation of KOSEP at APEC2010
Figure 6-23 Actual Use of Low-grade Coal at Coal-fired Power Stations in South Korea
Samphunpo Boryung Yeounghung Taean Hadong Dangjin

Data Collection Survey on Coal Power Master Plan Follow-up in the People’s Republic of Bangladesh
6-26
4) FOB Price Based on Calorific Value
Table 6-13 shows the result of predicted price of 1,000 kcal/kg based on Table 6-23 and converted figures to calorific value of 5,100 kcal/kg until year 2030. As FOB price of low-grade coal has just been on the market in recent years, prediction is difficult due to less data. Figure 6-24 shows the predicted price and actual price of 5,000 kcal/kg in Indonesia for reference.
Table 6-13 FOB Price of 5,100 kcal / kg Year
High Case Base Case High Case Base Case
(Note 1) (Note 2)
2010 1.16 0.99 59.4 50.5
2011 1.28 1.09 65.3 55.5
2012 1.39 1.18 71.1 60.4
2013 1.51 1.28 76.9 65.3
2014 1.62 1.38 82.6 70.2
2015 1.73 1.47 88.3 75.0
2016 1.84 1.56 93.9 79.8
2017 1.95 1.66 99.5 84.6
2018 2.06 1.75 105.0 89.2
2019 2.17 1.84 110.5 93.9
2020 2.27 1.93 115.9 98.5
2021 2.38 2.02 121.3 103.1
2022 2.48 2.11 126.7 107.7
2023 2.59 2.20 132.0 112.2
2024 2.69 2.29 137.2 116.6
2025 2.79 2.37 142.4 121.1
2026 2.89 2.46 147.6 125.5
2027 3.00 2.55 152.8 129.8
2028 3.10 2.63 157.8 134.2
2029 3.19 2.72 162.9 138.5
2030 3.29 2.80 167.9 142.7
Note 1: =(14.989ln(x)-157.53) x 0.85
Note 2: =(High Case) x 0.85
US¢/t, 1,000kcal/kg US$/t, 5,100kcal/kg
Source: The Survey team
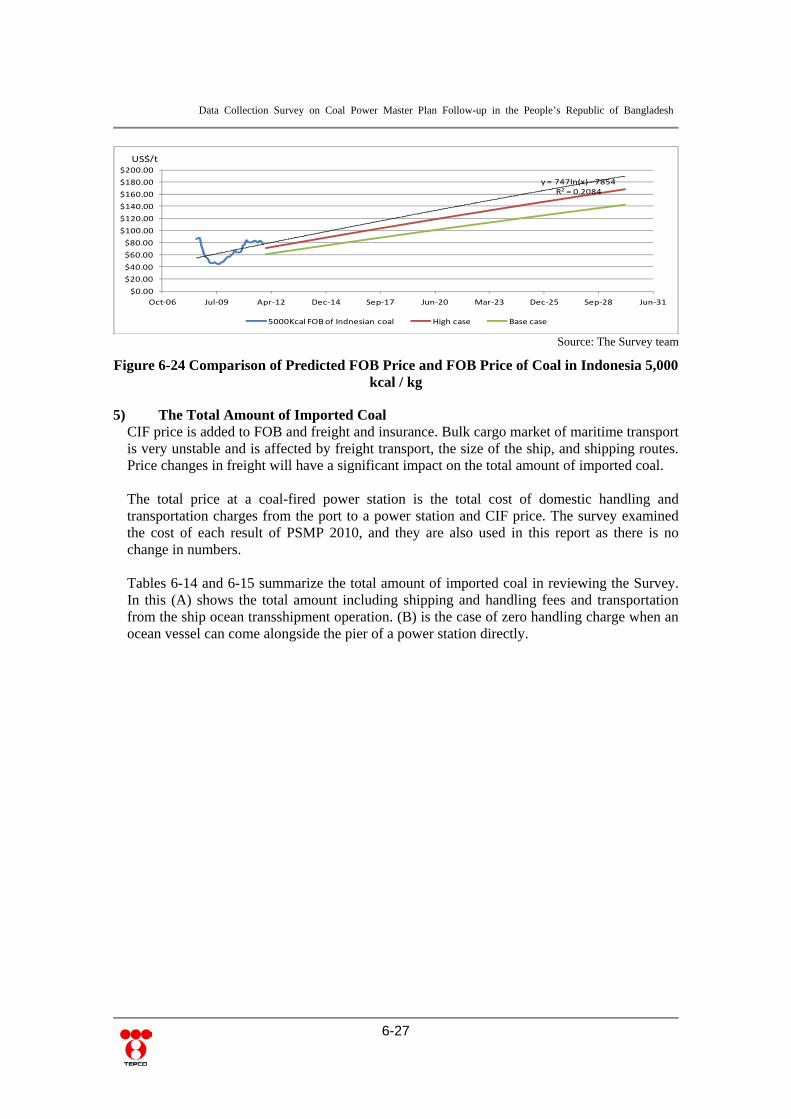
Data Collection Survey on Coal Power Master Plan Follow-up in the People’s Republic of Bangladesh
6-27
y = 747ln(x) ‐ 7854R² = 0.2084
$0.00
$20.00
$40.00
$60.00
$80.00
$100.00
$120.00
$140.00
$160.00
$180.00
$200.00
Oct‐06 Jul‐09 Apr‐12 Dec‐14 Sep‐17 Jun‐20 Mar‐23 Dec‐25 Sep‐28 Jun‐31
5000Kcal FOB of Indnesian coal High case Base case
US$/t
Source: The Survey team
Figure 6-24 Comparison of Predicted FOB Price and FOB Price of Coal in Indonesia 5,000 kcal / kg
5) The Total Amount of Imported Coal
CIF price is added to FOB and freight and insurance. Bulk cargo market of maritime transport is very unstable and is affected by freight transport, the size of the ship, and shipping routes. Price changes in freight will have a significant impact on the total amount of imported coal. The total price at a coal-fired power station is the total cost of domestic handling and transportation charges from the port to a power station and CIF price. The survey examined the cost of each result of PSMP 2010, and they are also used in this report as there is no change in numbers. Tables 6-14 and 6-15 summarize the total amount of imported coal in reviewing the Survey. In this (A) shows the total amount including shipping and handling fees and transportation from the ship ocean transshipment operation. (B) is the case of zero handling charge when an ocean vessel can come alongside the pier of a power station directly.

Data Collection Survey on Coal Power Master Plan Follow-up in the People’s Republic of Bangladesh
6-28
Table 6-14 Total Amount of Imported coal (20,000DWT)
Year
FOB Price ( 5,100kcal/kg)
Freight & Insurance (20,000
DWT class)
(A) Handling Cost
(A) Grand Total of Coal Price at
Thermal Power Station
(B) Handling Cost
(B) Grand Total of Coal Price at
Thermal Power Station
(US$/t) (US$/t) (US$/t) (US$/t) (US$/t) (US$/t)
High Case
Base case
High Case
Base case
High Case
Base case
High Case
Base case
2010 59.4 50.5 15.0 15.0 12.0 86.4 77.5 0.0 74.4 65.5
2011 65.3 55.5 15.9 15.8 12.7 93.9 84.0 0.0 81.2 71.3
2012 71.1 60.4 16.9 16.5 13.5 101.4 90.4 0.0 87.9 77.0
2013 76.9 65.3 17.8 17.3 14.3 108.9 96.9 0.0 94.6 82.6
2014 82.6 70.2 18.7 18.0 15.1 116.4 103.4 0.0 101.3 88.2
2015 88.3 75.0 19.6 18.7 16.1 123.9 109.8 0.0 107.8 93.7
2016 93.9 79.8 20.4 19.4 17.0 131.4 116.2 0.0 114.3 99.2
2017 99.5 84.6 21.3 20.1 18.0 138.8 122.7 0.0 120.8 104.6
2018 105.0 89.2 22.2 20.7 19.1 146.3 129.1 0.0 127.2 110.0
2019 110.5 93.9 23.1 21.4 20.3 153.8 135.6 0.0 133.5 115.3
2020 115.9 98.5 23.9 22.0 21.5 161.3 142.0 0.0 139.8 120.5
2021 121.3 103.1 24.8 22.6 22.8 168.9 148.5 0.0 146.1 125.8
2022 126.7 107.7 25.6 23.3 24.1 176.4 155.1 0.0 152.3 130.9
2023 132.0 112.2 26.5 23.9 25.6 184.0 161.6 0.0 158.4 136.0
2024 137.2 116.6 27.3 24.5 27.1 191.7 168.2 0.0 164.5 141.1
2025 142.4 121.1 28.2 25.1 28.8 199.4 174.9 0.0 170.6 146.1
2026 147.6 125.5 29.0 25.7 30.5 207.1 181.6 0.0 176.6 151.1
2027 152.8 129.8 29.8 26.2 32.3 214.9 188.4 0.0 182.6 156.1
2028 157.8 134.2 30.7 26.8 34.3 222.8 195.2 0.0 188.5 161.0
2029 162.9 138.5 31.5 27.4 36.3 230.7 202.1 0.0 194.4 165.8
2030 167.9 142.7 32.3 27.9 38.5 238.7 209.1 0.0 200.2 170.7
Source: The Survey team
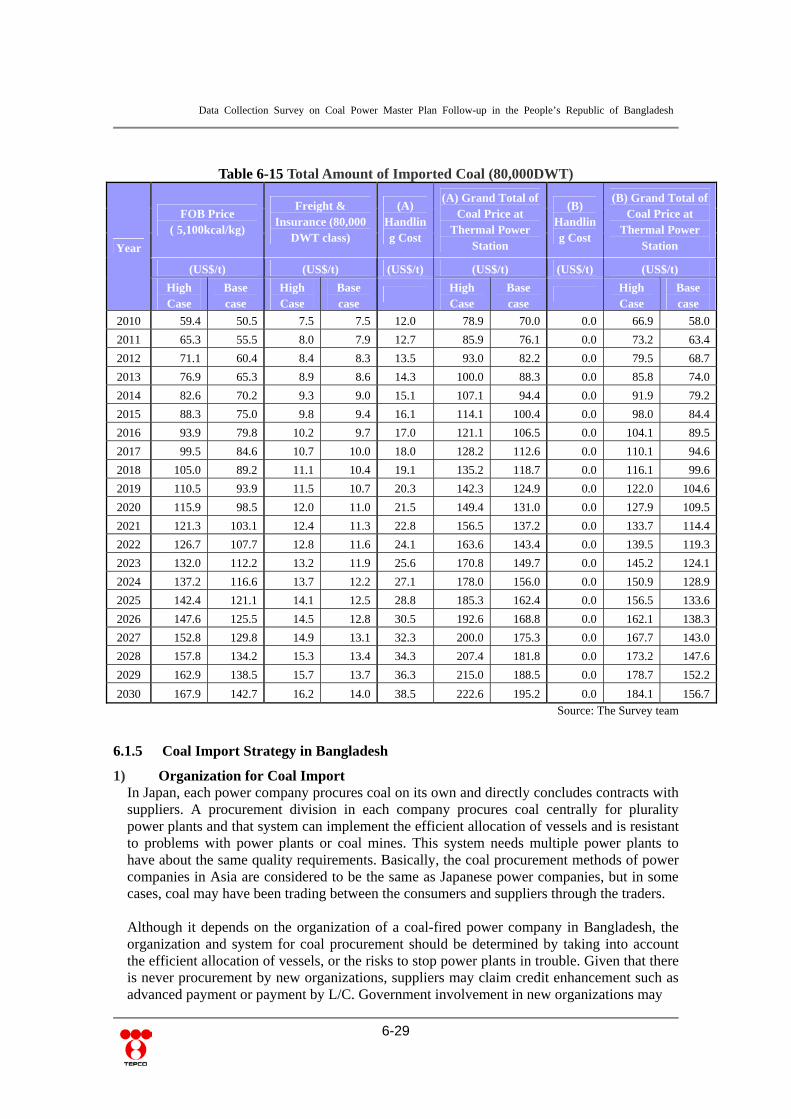
Data Collection Survey on Coal Power Master Plan Follow-up in the People’s Republic of Bangladesh
6-29
Table 6-15 Total Amount of Imported Coal (80,000DWT)
Year
FOB Price ( 5,100kcal/kg)
Freight & Insurance (80,000
DWT class)
(A) Handling Cost
(A) Grand Total of Coal Price at
Thermal Power Station
(B) Handling Cost
(B) Grand Total of Coal Price at
Thermal Power Station
(US$/t) (US$/t) (US$/t) (US$/t) (US$/t) (US$/t)
High Case
Base case
High Case
Base case
High Case
Base case
High Case
Base case
2010 59.4 50.5 7.5 7.5 12.0 78.9 70.0 0.0 66.9 58.0
2011 65.3 55.5 8.0 7.9 12.7 85.9 76.1 0.0 73.2 63.4
2012 71.1 60.4 8.4 8.3 13.5 93.0 82.2 0.0 79.5 68.7
2013 76.9 65.3 8.9 8.6 14.3 100.0 88.3 0.0 85.8 74.0
2014 82.6 70.2 9.3 9.0 15.1 107.1 94.4 0.0 91.9 79.2
2015 88.3 75.0 9.8 9.4 16.1 114.1 100.4 0.0 98.0 84.4
2016 93.9 79.8 10.2 9.7 17.0 121.1 106.5 0.0 104.1 89.5
2017 99.5 84.6 10.7 10.0 18.0 128.2 112.6 0.0 110.1 94.6
2018 105.0 89.2 11.1 10.4 19.1 135.2 118.7 0.0 116.1 99.6
2019 110.5 93.9 11.5 10.7 20.3 142.3 124.9 0.0 122.0 104.6
2020 115.9 98.5 12.0 11.0 21.5 149.4 131.0 0.0 127.9 109.5
2021 121.3 103.1 12.4 11.3 22.8 156.5 137.2 0.0 133.7 114.4
2022 126.7 107.7 12.8 11.6 24.1 163.6 143.4 0.0 139.5 119.3
2023 132.0 112.2 13.2 11.9 25.6 170.8 149.7 0.0 145.2 124.1
2024 137.2 116.6 13.7 12.2 27.1 178.0 156.0 0.0 150.9 128.9
2025 142.4 121.1 14.1 12.5 28.8 185.3 162.4 0.0 156.5 133.6
2026 147.6 125.5 14.5 12.8 30.5 192.6 168.8 0.0 162.1 138.3
2027 152.8 129.8 14.9 13.1 32.3 200.0 175.3 0.0 167.7 143.0
2028 157.8 134.2 15.3 13.4 34.3 207.4 181.8 0.0 173.2 147.6
2029 162.9 138.5 15.7 13.7 36.3 215.0 188.5 0.0 178.7 152.2
2030 167.9 142.7 16.2 14.0 38.5 222.6 195.2 0.0 184.1 156.7
Source: The Survey team
6.1.5 Coal Import Strategy in Bangladesh
1) Organization for Coal Import In Japan, each power company procures coal on its own and directly concludes contracts with suppliers. A procurement division in each company procures coal centrally for plurality power plants and that system can implement the efficient allocation of vessels and is resistant to problems with power plants or coal mines. This system needs multiple power plants to have about the same quality requirements. Basically, the coal procurement methods of power companies in Asia are considered to be the same as Japanese power companies, but in some cases, coal may have been trading between the consumers and suppliers through the traders. Although it depends on the organization of a coal-fired power company in Bangladesh, the organization and system for coal procurement should be determined by taking into account the efficient allocation of vessels, or the risks to stop power plants in trouble. Given that there is never procurement by new organizations, suppliers may claim credit enhancement such as advanced payment or payment by L/C. Government involvement in new organizations may

Data Collection Survey on Coal Power Master Plan Follow-up in the People’s Republic of Bangladesh
6-30
enhance credit. From a more micro perspective, it is a common practice to make personal contracts for imported coal, contracts for shipment, coordinating the delivery schedule, and accepting coal at the power station.
2) Form of Contract for Coal Imports The contract form of imported coal in Japan is mainly about a one-year term contract. In the term contract the quantity and price is settled, and the power company conducts the necessary adjustments among the sellers or the shipping company concerning the timing of deliveries to the power station. Taking into consideration the risk of fluctuating requirements for each year due to the operational plans of the power plants or the maintenance schedule, the risk of a power plant shutdown over the long term due to trouble and the risk of change in the quality of coal, it is considered to be a bigger risk to commit to long-term contracts. Because it is essential for power companies to ensure a stable supply, you should determine the portfolio with due consideration of the risks and merits of both long-term and short-term contracts. In addition, as mentioned earlier, the selection of coal must take into consideration the risks of coal procurement in only the same region because coal production is influenced by weather conditions. In Japan, due to the boiler characteristics and environmental regulations, or from the viewpoint of long-term stable procurement, high-quality coal in Australia especially with a certain amount of reserves is preferential. The power companies in East Asia sometimes conduct bids for short or medium term contracts. If the specification requirements of a power plant are flexible, the bid is considered to be very effective.
3) Form of contract for shipping
In Japan, the main contract form is the FOB contract, and it is necessary for the buyers to arrange vessels and insurance. In consideration of the efficient allocation of vessels and the risks of production trouble with sellers, it is believed to favor the FOB contract in which the buyers can control the vessels on their own. To secure vessels for long-term stable procurement is important, so many of Japan’s power companies usually have some dedicated vessel contracts with shipping companies. You should determine the combination with long-term contracts (such as dedicated vessels) and short-term contracts (such as COA or spot charters) to ensure transport capability, in consideration of the risk that coal demand may change.
6.1.6 Coal Transport System
1) Required Quantity of Coal The following table shows the annual required quantity of coal in a 600 MW coal-fired power plant. The required quantity of coal is changed per the thermal efficiency of the plant, the utilization rate, and the calorific value of coal. Furthermore, it is noted that based on these assumptions, the required number of vessels is changeable.
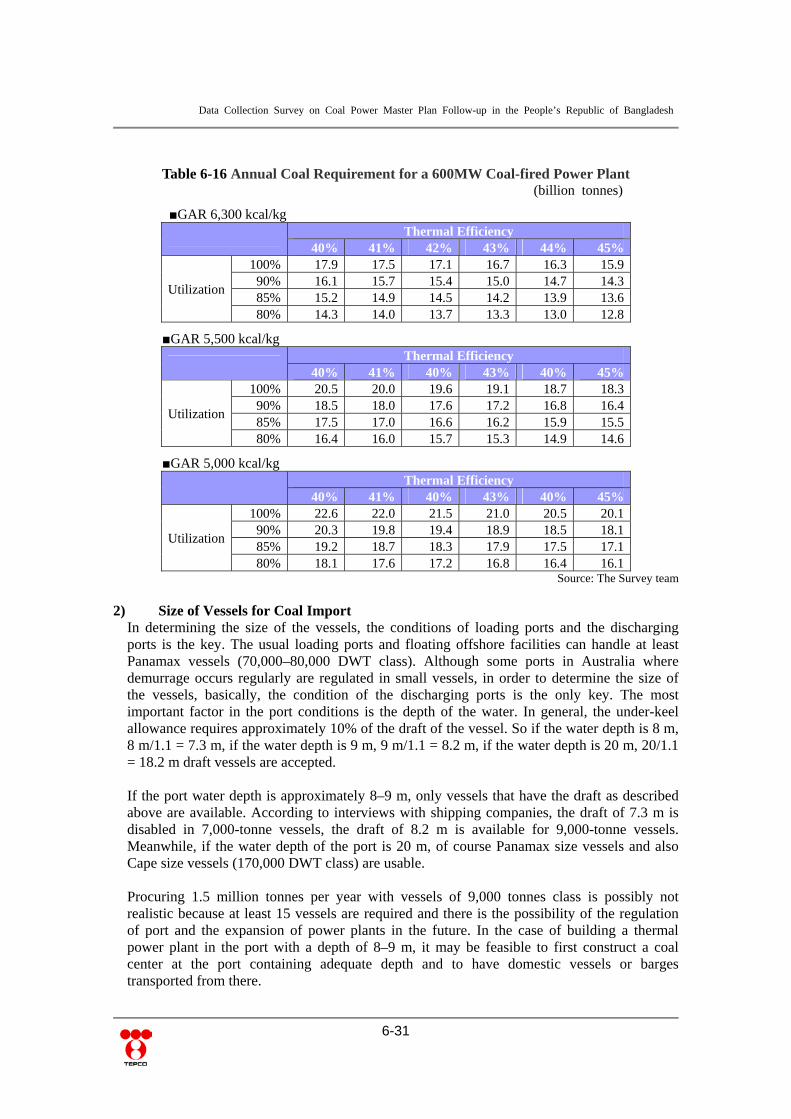
Data Collection Survey on Coal Power Master Plan Follow-up in the People’s Republic of Bangladesh
6-31
Table 6-16 Annual Coal Requirement for a 600MW Coal-fired Power Plant (billion tonnes)
■GAR 6,300 kcal/kg
Thermal Efficiency
40% 41% 42% 43% 44% 45%
Utilization
100% 17.9 17.5 17.1 16.7 16.3 15.9 90% 16.1 15.7 15.4 15.0 14.7 14.3 85% 15.2 14.9 14.5 14.2 13.9 13.6 80% 14.3 14.0 13.7 13.3 13.0 12.8
■GAR 5,500 kcal/kg
Thermal Efficiency
40% 41% 40% 43% 40% 45%
Utilization
100% 20.5 20.0 19.6 19.1 18.7 18.3 90% 18.5 18.0 17.6 17.2 16.8 16.4 85% 17.5 17.0 16.6 16.2 15.9 15.5 80% 16.4 16.0 15.7 15.3 14.9 14.6
■GAR 5,000 kcal/kg
Thermal Efficiency
40% 41% 40% 43% 40% 45%
Utilization
100% 22.6 22.0 21.5 21.0 20.5 20.1 90% 20.3 19.8 19.4 18.9 18.5 18.1 85% 19.2 18.7 18.3 17.9 17.5 17.1 80% 18.1 17.6 17.2 16.8 16.4 16.1
Source: The Survey team 2) Size of Vessels for Coal Import
In determining the size of the vessels, the conditions of loading ports and the discharging ports is the key. The usual loading ports and floating offshore facilities can handle at least Panamax vessels (70,000–80,000 DWT class). Although some ports in Australia where demurrage occurs regularly are regulated in small vessels, in order to determine the size of the vessels, basically, the condition of the discharging ports is the only key. The most important factor in the port conditions is the depth of the water. In general, the under-keel allowance requires approximately 10% of the draft of the vessel. So if the water depth is 8 m, 8 m/1.1 = 7.3 m, if the water depth is 9 m, 9 m/1.1 = 8.2 m, if the water depth is 20 m, 20/1.1 = 18.2 m draft vessels are accepted. If the port water depth is approximately 8–9 m, only vessels that have the draft as described above are available. According to interviews with shipping companies, the draft of 7.3 m is disabled in 7,000-tonne vessels, the draft of 8.2 m is available for 9,000-tonne vessels. Meanwhile, if the water depth of the port is 20 m, of course Panamax size vessels and also Cape size vessels (170,000 DWT class) are usable. Procuring 1.5 million tonnes per year with vessels of 9,000 tonnes class is possibly not realistic because at least 15 vessels are required and there is the possibility of the regulation of port and the expansion of power plants in the future. In the case of building a thermal power plant in the port with a depth of 8–9 m, it may be feasible to first construct a coal center at the port containing adequate depth and to have domestic vessels or barges transported from there.

Data Collection Survey on Coal Power Master Plan Follow-up in the People’s Republic of Bangladesh
6-32
Then, to assume procurement of Indonesian coal with Panamax vessels; if it is assumed to take 30 days in 1 voyage (sailing from the discharging port, loading coal in the loading port, and returning to the discharging port), including demurrage, about 2 vessels are needed. The size of coal vessels should be determined finally by taking into consideration the future expansion plans of thermal power plants, the use of coal centers as transit points for inland coal-fired plants, and regulation in the loading ports. As described above, from the viewpoint of coal procurement, it is considered necessary to build coal centers in the port with enough water depth to handle at least Panamax vessels.
3) Trends in Vessels Charter Rate
The market trend of charted dry bulk vessels prior to the onset of the financial crisis was experiencing exponential growth. However, following the Lehman shock, the cargo movement of iron ore stagnated resulting in a steep drop of primarily cape-sized vessels delivering dry bulk goods. Around the same time, the market for Panamax vessels was sluggish but thereafter has recovered in sync with the global economic recovery.
【Freight Market】
0
50,000
100,000
150,000
200,000
250,000
300,000
2007
/1
2008
/1
2009
/1
2010
/1
2011
/1
(ドル/日)
Cape size
Panamax
Handymax
Source: The Survey team
Figure 6-25 Freight Market

Data Collection Survey on Coal Power Master Plan Follow-up in the People’s Republic of Bangladesh
7-1
Chapter7 Power Network System Plan 7.1 Purposes of Power Network System Plan
The purposes of the power network system plan of this project are to confirm the adequacy of the relevant main specifications of the power transmission lines required for power transmission of the candidates of the imported coal-fired power plants and to identify the points to be considered for conducting their Feasibility Studies. The study of the required power transmission lines considered the power outputs of generators, power generation plan around Chittagong and the power demand forecast where the candidates of the imported coal-fired power plants will be located.
7.2 The Follow-up Situations of Power Transmission Plan of PSMP 2010
PGCB has made a plan of power network system of Bangladesh up to 2015. The plan of power transmission lines around the candidate sites and the transmission lines from Dhaka to Chittagong has been made by following PSMP2010. Figure 7-1 shows the current plan of 400 kV and 230 kV transmission lines from Dhaka to Chittagong. A dotted line shows the border between the northern part and southern part of Hathazari. The amount of power flow passing through this border becomes a clue to determination of the scales of the transmission line.
Source: The Survey team
Figure 7-1 Current Plan of 400 kV and 230 kV Transmission Lines from Dhaka to Chittagong in 2020
The 400 kV Anwara substation shown in Figure 7-1 is located around Chittagong. The Meghnaghat substation is located at the east of Dhaka city. The World Bank is currently preparing the Feasibility Study of 400 kV Anwara-Meghnaghat double circuit transmission line. However, the World Bank’s funding for the construction of this planned 400 kV double circuit transmission line is uncertain because the World Bank is now reluctant to fund the project related to the development of coal-fired power plants and this planned 400 kV double circuit transmission line is related to power transmission from the Chittagong coal-fired power plant.
Cox’s Bazar
Anwara(Chittagong)
Sikalbaha
Raozan
Hathazari
Myanmar
Comilla Meghnaghat
Comilla 3
Maheskhali
Aminbazar
400 kV
230 kV
Sikalbaha

Data Collection Survey on Coal Power Master Plan Follow-up in the People’s Republic of Bangladesh
7-2
7.3 Specific Individual Candidates of the Projects and Their Related Transmission Lines
7.3.1 Specific Individual Candidates of the Projects
The candidates of the Projects of imported coal-fired power plants up to 2020 are located in the three sites as shown below. Chittagong 600 MW 2 units Chittagong-South 600 MW 2 units Maheskhali 600 MW 2 units
The methodologies of the connection to Anwara substation from the abovementioned sites are not yet determined.
7.3.2 Planned Transmission Lines
1) Planned Transmission Lines to Anwara Substation All the abovementioned three candidates of the Projects of imported coal-fired power plants are located at Chittagong area 200–300 km far from Dhaka in the southeast direction. The surplus power unconsumed in the neighboring areas has to be transmitted to Dhaka. As mentioned before, the 400 kV Anwara–Meghnaghat transmission line with double circuits has been already planned and its Feasibility Study is about to be conducted. Thus, the study has been carried out on the presumption that this 400 kV double circuit transmission line, 400 kV Anwara substation, and 400 kV Meghnaghat substation will be constructed before the start to operation of the Project of the coal-fired power plant. (Hereafter, this transmission line is called “Preplanned 400 kV Anwara–Meghnaghat double circuit transmission line.”) Figure 7-2 shows the locations of Anwara substation, Chittagong substation, Chittagong-South Substation, and Maheskhali substation. It seems reasonable to connect all the abovementioned three candidates of the Projects of coal-fired power plants to 400 kV Anwara substation because their generation power outputs will reach 1,200 MW. The methodology of the connection to Anwara substation is considered as shown in Table 7-1 while the scale of power output becomes 1,200 MW. The details should be examined regarding the location of Anwara substation and the methodology of power transmission to Anwara substation from each power station.
Table 7-1 Methodology of Power Transmission to Anwara Substation when the Power Output is around 1,200 MW
Maheskhali Power Station–Anwara Substation
400 kV double circuits can be considered. However, details should be examined regarding the route of transmission line.
Chittagong-South Power Station - Anwara substation or Chittagong Power Station–Anwara Substation
400 kV double circuits can be considered. However, because its distance is not so large, application of 230 kV can be also considered. Selection of transmission voltage (400 kV, 230 kV) and the route of the transmission line should be examined.
Source: The Survey team

Data Collection Survey on Coal Power Master Plan Follow-up in the People’s Republic of Bangladesh
7-3
Source: The Survey team
Figure 7-2 Locations of Chittagong Power Station, Chittagong-South Power Station and Maheskhali Power Station
Source: The Survey team
Figure 7-3 Transmission Lines from Chittagong-South Power Station and Maheskhali Power Station to Anwara Substation
2) Planned Transmission Line between Chittagong and Dhaka
The limitation of the amount of power transmission from 400 kV Anwara to Meghnaghat is considered as below 2,000 MW from the viewpoint of system stability even if 230 kV double circuit line is operated parallel. On the other hand, even though the power consumption is considered, the power flow passing through the border of Hathazari shown in Figure 7-1 going to Dhaka exceeds 2,000 MW in 2020. In 2020, 500 MW will be imported from Myanmar, 600 MW 2 units will be installed in Chittagong power station, and the further 2,600 MW 2 units will be added in the surrounding areas as discussed in the later sections.
15 km
65 km
To Meghnaghat 260 km
Anwara S/S Chittagong P/S
Chittagong-South P/S
Maheskhali P/S
400kV 2cct 80 km
To Meghnaghat 260 km
Anwara S/S
Maheskhali P/S 600 MW x2 or 3
400kV 2cct 15 km
To Meghnaghat 260 km
Anwara S/S
Chittagong-South P/S
The transmission voltage, number of circuits and the route of the transmission line has to be reexamined at the FS stage.
The route of the transmission line from Maheskhali P/S to Anwara S/S has to be examined at the FS stages.

Data Collection Survey on Coal Power Master Plan Follow-up in the People’s Republic of Bangladesh
7-4
Thus, it becomes not enough to develop only the preplanned 400 kV Anwara–Meghnaghat double circuits transmission line as the transmission line from Dhaka to Chittagong when further 600 MW 2 units will be developed at the candidate sites. Multi circuits 400 kV lines or 765 kV transmission lines would be required. However, the adoption of 765 kV transmission lines should be carefully examined including its economic viability.
7.4 Confirmation of Basic Presumption for Examining the Specific Individual Project
1) Power Generation Plan Table 7-2 shows the power generation plan in 2020 located south of Hathazari in the southeastern part of Bangladesh following PSMP 2010 listing the installation of 600 MW 2 units in Chittagong and the 600 MW 1 unit in Chittagong-South. The Survey set out the case of replacing the 600 MW 1 unit in Chittagong-South listed in Table 7-2 by the 600 MW 2 units installed in Chittagong or Maheskhali as shown in the following table.
Case A 600 MW 1 unit installed at Chittagong, Chittagong-South or Maheskhali Case B 600 MW 2 units installed at Chittagong, Chittagong-South or Maheskhali
In addition, the installation of the 600 MW 2 units in Chittagong was basically considered for all the cases. Both peak load and light load period of times were examined on the assumption that all the units are fully operated during the peak load time, and the peaking plants shown below are stopped and other plants are fully operated during the light load time. Hathazari Peaking Plant Sikalbaha 150 MW Peaking Plant Dohazari Peaking Plant
Table 7-2 Power Generation Plan in 2020 located South of Hathazari Hathazari Peaking Plant GEFO-New 100
Raozan 2 210 STGas-Ex 350
Myanmar to Bangladesh 500
Kaptai Power Plant (Solar) SP Hydro/RE-New 5
Sikalbaha 150 MW Peaking Plant, U/CCT Gas-New 149
Sikalbaha 225 MW Dual Fuel, CCCCGas-New 225
Chittagong 600 MW ST #1 ST Coal-New-I 600
Chittagong 600 MW ST #2 ST Coal-New-I 600
Chittagong-South 600MW #1 ST Coal-New-I 600
Dohazari Peaking Plant GEFO-New 100
Karnafuli hydropower plant HY Hydro/RE-Ex 230
Narayanganj 30MW GEFO-New 30
Patenga Offshore, Chittagong(Wind) WP Hydro/RE-New 100
3,589 Source: PSMP2010

Data Collection Survey on Coal Power Master Plan Follow-up in the People’s Republic of Bangladesh
7-5
2) Power Demand
Table 7-3 shows the peak power demand of 130 kV substations in 2020 supplied from the system south of Hathazari located in the southeastern part of Bangladesh. The total of the power demand in this area is approximately 1,800 MW. The power demand in the light load condition was set out as 40% of its peak values.
Table 7-3 Peak Power Demand of 130 kV Substations in 2020 Supplied from the System South of Hathazari
Substation 2020 Peak Substation 2020 Peak
Chandraghona 70.9 Abul Khair Steel Mills 69.2
Hathazari 93.8 Baraulia 104.6
Baroirhat, Ctg 112.1 Bakulia 129
Madunaghat 147.9 Julda 46.9
Sikalbaha 113.9 Shahmirpur 52.6
Dohazari 87.6 Rangamati 72.9
Cox’s Bazar 101 Feni 98.6
Halishahar 81.8 Chowmuhani 68.5
Agrabad 94.5 Khagrachari 108.5
Kulsi 106.1 Kaptai 24.4
Total 1784.8 Source: PSMP2010
3) Criteria of Power Network System Planning Criteria of Power Network System Planning were set out based on the condition applied for the PSMP2010. The system was examined on the presumption that the system should secure its reliability without any restrictions of power generation and power supply interruptions even when a single circuit fault occurs.
a. Specifications of Transmission Lines Table 7.4 shows the applied impedance and the capacities of the transmission lines.
Table 7-4 Impedance and Capacities of Transmission Lines
R1
[pu/km] X1
[pu/km] B1
[pu/km] Capacity
[MVA/cct]
400kV 0.000019 0.000171 0.007 2347.2
230kV 0.00008 0.00055 0.0021 597.6
132kV 0.00058 0.0022 0.00052 150.9
Source: The Survey team
b. Power Flow The power flow should not exceed the capacity of the remaining circuits when a single circuit fault occurs.
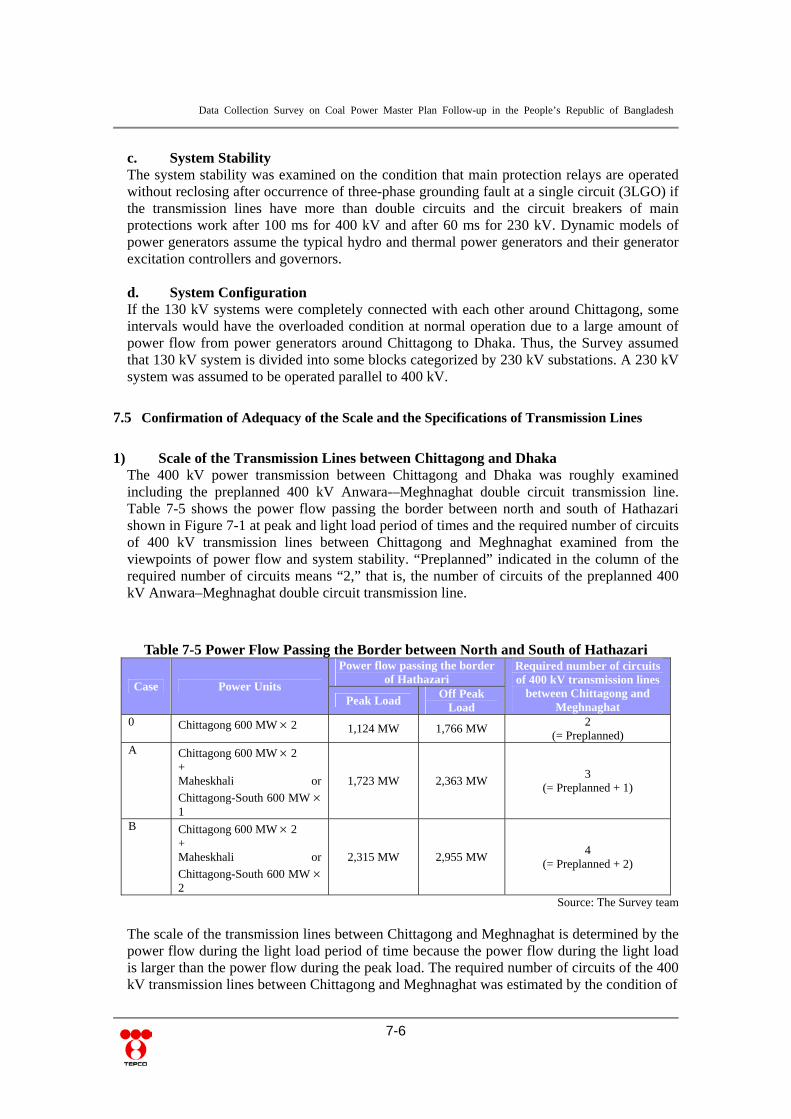
Data Collection Survey on Coal Power Master Plan Follow-up in the People’s Republic of Bangladesh
7-6
c. System Stability The system stability was examined on the condition that main protection relays are operated without reclosing after occurrence of three-phase grounding fault at a single circuit (3LGO) if the transmission lines have more than double circuits and the circuit breakers of main protections work after 100 ms for 400 kV and after 60 ms for 230 kV. Dynamic models of power generators assume the typical hydro and thermal power generators and their generator excitation controllers and governors. d. System Configuration If the 130 kV systems were completely connected with each other around Chittagong, some intervals would have the overloaded condition at normal operation due to a large amount of power flow from power generators around Chittagong to Dhaka. Thus, the Survey assumed that 130 kV system is divided into some blocks categorized by 230 kV substations. A 230 kV system was assumed to be operated parallel to 400 kV.
7.5 Confirmation of Adequacy of the Scale and the Specifications of Transmission Lines
1) Scale of the Transmission Lines between Chittagong and Dhaka
The 400 kV power transmission between Chittagong and Dhaka was roughly examined including the preplanned 400 kV Anwara-–Meghnaghat double circuit transmission line. Table 7-5 shows the power flow passing the border between north and south of Hathazari shown in Figure 7-1 at peak and light load period of times and the required number of circuits of 400 kV transmission lines between Chittagong and Meghnaghat examined from the viewpoints of power flow and system stability. “Preplanned” indicated in the column of the required number of circuits means “2,” that is, the number of circuits of the preplanned 400 kV Anwara–Meghnaghat double circuit transmission line.
Table 7-5 Power Flow Passing the Border between North and South of Hathazari
Case Power Units
Power flow passing the border of Hathazari
Required number of circuits of 400 kV transmission lines
between Chittagong and Meghnaghat Peak Load
Off Peak Load
0 Chittagong 600 MW 2 1,124 MW 1,766 MW 2
(= Preplanned) A Chittagong 600 MW 2
+ Maheskhali or
Chittagong-South 600 MW 1
1,723 MW 2,363 MW 3
(= Preplanned + 1)
B Chittagong 600 MW 2 + Maheskhali or
Chittagong-South 600 MW 2
2,315 MW 2,955 MW 4
(= Preplanned + 2)
Source: The Survey team
The scale of the transmission lines between Chittagong and Meghnaghat is determined by the power flow during the light load period of time because the power flow during the light load is larger than the power flow during the peak load. The required number of circuits of the 400 kV transmission lines between Chittagong and Meghnaghat was estimated by the condition of

Data Collection Survey on Coal Power Master Plan Follow-up in the People’s Republic of Bangladesh
7-7
system stability described in section 7-4 while confirming the power flow did not exceed the capacity of the remaining circuits when a single circuit fault occurs. In case of installation of Chittagong 1,200 MW with no power units in Maheskhali and Chittagong-South (Case 0 in Table 7-5), the required number of circuits of 400 kV transmission lines are two for the interval between Chittagong and Meghnaghat. In this case, the 400 kV system with only preplanned 400 kV Anwara–Meghnaghat double circuit transmission line can transmit the required amount of power. However, in case of adding Maheskhali 600 MW 1 or Chittagong-South 600 MW 1, the double circuits of 400 kV transmission lines would not be enough and three circuits would be required due to the system instability with occurrence of a three phase grounding fault during the light load. (Case A) In case of adding Maheskhali 600 MW 2 or Chittagong-South 600 MW 2, the triple circuits of 400 kV transmission lines would not be enough and four circuits would be required due to the system instability with occurrence of a three phase grounding fault during the light load. (Case B) Figures 7-4 to 7-7 show the power flow of peak load and light load and the system stability swing-curves of power outputs of generators in 2020. From the abovementioned results, it can be found out that the four circuits of 400 kV transmission lines between Chittagong and Meghnaghat would be required in case of installation of 600 MW 2 units in Chittagong, in Chittagong-South, or in Maheskhali in addition to Chittagong 600 MW 2 units.
2) Cost of 400 kV System between Chittagong and Dhaka In case of installation of 600 MW 2 units in Chittagong, Chittagong-South or Maheskhali added to Chittagong 600 MW 2 units, additional 400 kV double circuits transmission line would be required between Anwara and Meghnaghat apart from the preplanned 400 kV Anwara - Meghnaghat double circuit transmission line. The incremental cost of this line is shown in Table 7-6 on the condition that the cost of 400 kV transmission line is 0.643 million USD and the cost of the bays at 400 kV substation is 5 million USD/2cct.
Table 7-6 Incremental Cost of Transmission Lines when 400 kV Power Transmission System Applied for Operation of 600 MW 2 Units (Excluding Preplanned 400 kV Double
Circuits Transmission Lines) Unit: million USD
Location of 600 MW 2 units Chittagong-South Maheskhali Transmission line to Anwara substation 10 51 Bays at Anwara substation for 4 cct 10 10 Anwara substation – Meghnaghat substation 167 167 Bays at Meghnaghat substation for 2 cct 5 5 Total 192 233
Source: The Survey team
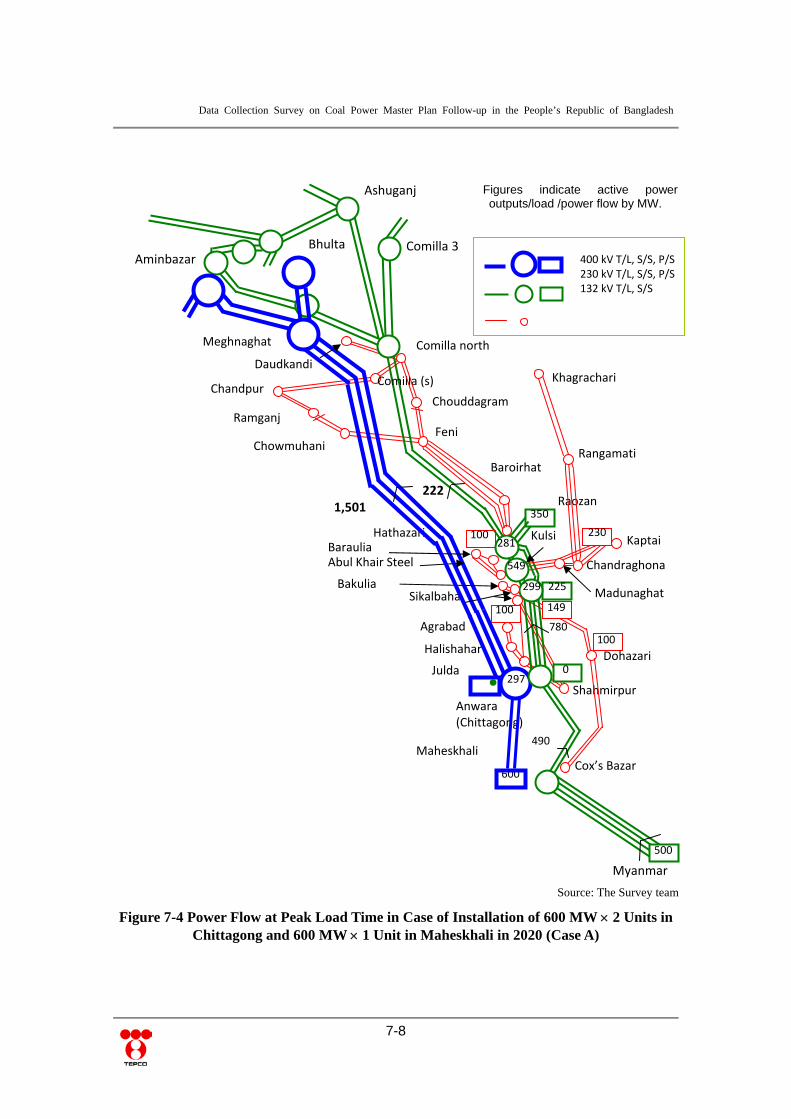
Data Collection Survey on Coal Power Master Plan Follow-up in the People’s Republic of Bangladesh
7-8
Source: The Survey team
Figure 7-4 Power Flow at Peak Load Time in Case of Installation of 600 MW 2 Units in Chittagong and 600 MW 1 Unit in Maheskhali in 2020 (Case A)
Cox’s Bazar
Anwara(Chittagong)
Sikalbaha
Raozan
Hathazari
Myanmar
Comilla northMeghnaghat
Ashuganj
Comilla 3
Maheskhali
Aminbazar
Kulsi
0 297
490
780
1,501
225
281
350
222
500
100 230 Kaptai
149 100
299
100
Dohazari
Shahmirpur
Julda
Halishahar
Chandraghona
Madunaghat
Agrabad
Abul Khair SteelBaraulia
Bakulia
Rangamati
Comilla (s)
FeniChowmuhani
Khagrachari
Ramganj Chouddagram
Chandpur
Daudkandi
Baroirhat
549
600
400 kV T/L, S/S, P/S 230 kV T/L, S/S, P/S 132 kV T/L, S/S
Bhulta
●
Figures indicate active power outputs/load /power flow by MW.

Data Collection Survey on Coal Power Master Plan Follow-up in the People’s Republic of Bangladesh
7-9
Source: The Survey team
Figure 7-5 Stability Swing Curve after 3LGO at 400 kV Anwara- Meghnaghat and Power Flow at Light Load Time in Case of Installation of 600 MW 2 units in Chittagong and
600 MW 1 unit in Maheskhali in 2020 (Case A)
Cox’s Bazar
Myanmar
500
Kaptai
Dohazari
Chandraghona
Madunaghat
Rangamati
400 kV T/L, S/S, P/S 230 kV T/L, S/S, P/S 132 kV T/L, S/S
Anwara(Chittagong)
Sikalbaha
Raozan
Hathazari
Comilla north Meghnaghat
Ashuganj
Comilla 3
Maheskhali
Aminbazar
Kulsi
12000
‐110
372
372
1,907
225
151
350
456
0 230
0 100
206
0
Shahmirpur
Julda
Halishahar
Agrabad
Abul Khair SteelBaraulia
Bakulia
Comilla (s)
FeniChowmuhani
Khagrachari
Ramganj Chouddagram
Chandpur
Daudkandi
Baroirhat
133
600
400kV Anwara‐Meghnaghat 3LGO Chittagong/ Raozan /Maheskhali Power Output
Bhulta
Figures indicate active power outputs/load/power flow by MW.
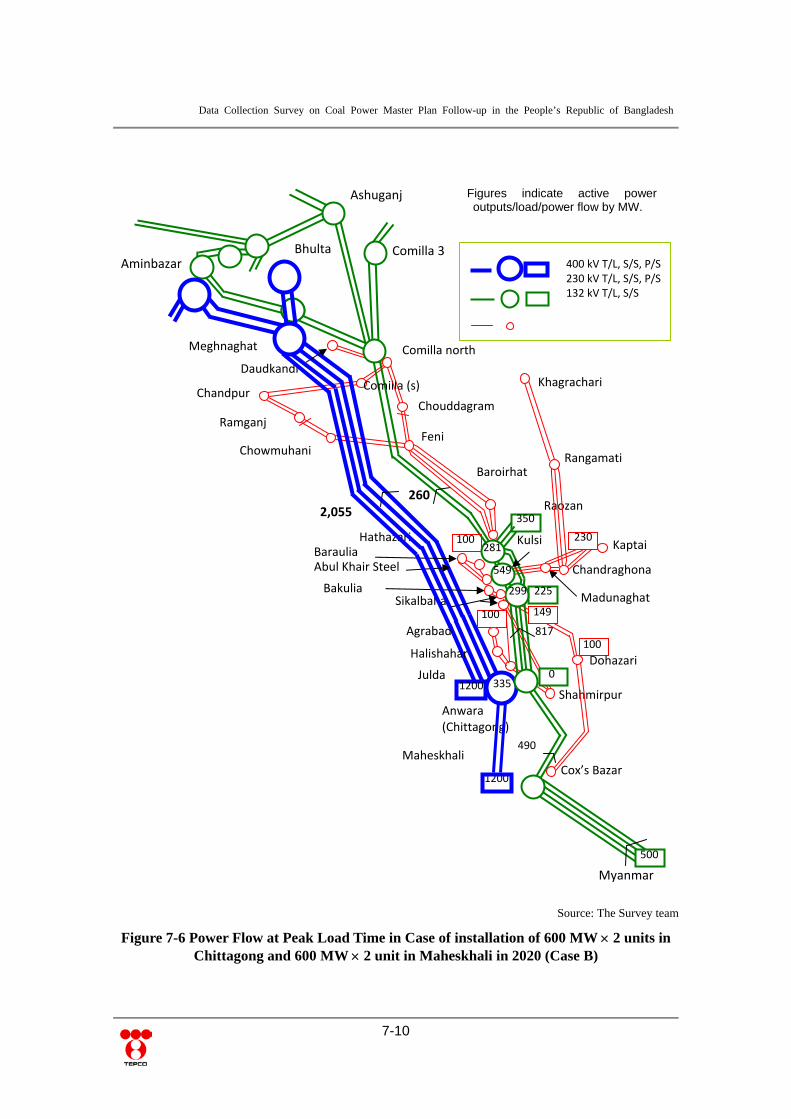
Data Collection Survey on Coal Power Master Plan Follow-up in the People’s Republic of Bangladesh
7-10
Source: The Survey team
Figure 7-6 Power Flow at Peak Load Time in Case of installation of 600 MW 2 units in Chittagong and 600 MW 2 unit in Maheskhali in 2020 (Case B)
Cox’s Bazar
Anwara(Chittagong)
Sikalbaha
Raozan
Hathazari
Myanmar
Comilla north Meghnaghat
Ashuganj
Comilla 3
Maheskhali
Aminbazar
Kulsi
0335
490
817
2,055
225
281
350
260
500
100 230 Kaptai
149100
299
100
Dohazari
Shahmirpur
Julda
Halishahar
Chandraghona
Madunaghat
Agrabad
Abul Khair SteelBaraulia
Bakulia
Rangamati
Comilla (s)
Feni Chowmuhani
Khagrachari
Ramganj Chouddagram
Chandpur
Daudkandi
Baroirhat
549
1200
400 kV T/L, S/S, P/S 230 kV T/L, S/S, P/S 132 kV T/L, S/S
Bhulta
1200
Figures indicate active power outputs/load/power flow by MW.

Data Collection Survey on Coal Power Master Plan Follow-up in the People’s Republic of Bangladesh
7-11
Source: The Survey team
Figure 7-7 Stability Swing Curve after 3LGO at 400 kV Anwara- Meghnaghat and Power Flow at Light Load Time in Case of Installation of 600 MW 2 units in Chittagong and
600 MW 2 unit in Maheskhali in 2020 (Case B)
Cox’s Bazar
Anwara(Chittagong)
Sikalbaha
Raozan
Hathazari
Myanmar
Comilla north Meghnaghat
Ashuganj
Comilla 3
Maheskhali
Aminbazar
Kulsi
0 ‐89
490
393
2,479
225
281
350
476
500
0 230 Kaptai
0 100
299
0
Dohazari
Shahmirpur
Julda
Halishahar
Chandraghona
Madunaghat
Agrabad
Abul Khair SteelBaraulia
Bakulia
Rangamati
Comilla (s)
FeniChowmuhani
Khagrachari
Ramganj Chouddagram
Chandpur
Daudkandi
Baroirhat
549
1200
400 kV T/L, S/S, P/S 230 kV T/L, S/S, P/S 132 kV T/L, S/S
Bhulta
1200
400kV Anwara‐Meghnaghat 3LGO Chittagong/ Raozan /Maheskhali Power Output
Figures indicate active power outputs/load/power flow by MW.
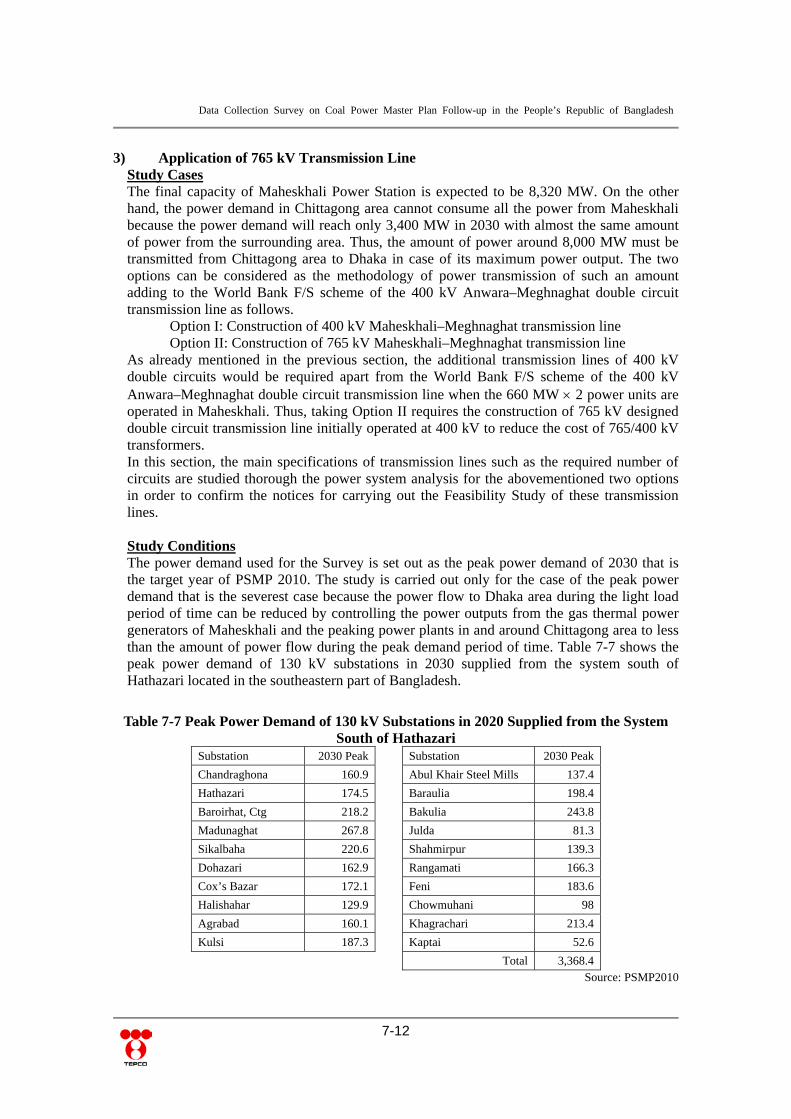
Data Collection Survey on Coal Power Master Plan Follow-up in the People’s Republic of Bangladesh
7-12
3) Application of 765 kV Transmission Line
Study Cases The final capacity of Maheskhali Power Station is expected to be 8,320 MW. On the other hand, the power demand in Chittagong area cannot consume all the power from Maheskhali because the power demand will reach only 3,400 MW in 2030 with almost the same amount of power from the surrounding area. Thus, the amount of power around 8,000 MW must be transmitted from Chittagong area to Dhaka in case of its maximum power output. The two options can be considered as the methodology of power transmission of such an amount adding to the World Bank F/S scheme of the 400 kV Anwara–Meghnaghat double circuit transmission line as follows.
Option I: Construction of 400 kV Maheskhali–Meghnaghat transmission line Option II: Construction of 765 kV Maheskhali–Meghnaghat transmission line
As already mentioned in the previous section, the additional transmission lines of 400 kV double circuits would be required apart from the World Bank F/S scheme of the 400 kV Anwara–Meghnaghat double circuit transmission line when the 660 MW 2 power units are operated in Maheskhali. Thus, taking Option II requires the construction of 765 kV designed double circuit transmission line initially operated at 400 kV to reduce the cost of 765/400 kV transformers. In this section, the main specifications of transmission lines such as the required number of circuits are studied thorough the power system analysis for the abovementioned two options in order to confirm the notices for carrying out the Feasibility Study of these transmission lines. Study Conditions The power demand used for the Survey is set out as the peak power demand of 2030 that is the target year of PSMP 2010. The study is carried out only for the case of the peak power demand that is the severest case because the power flow to Dhaka area during the light load period of time can be reduced by controlling the power outputs from the gas thermal power generators of Maheskhali and the peaking power plants in and around Chittagong area to less than the amount of power flow during the peak demand period of time. Table 7-7 shows the peak power demand of 130 kV substations in 2030 supplied from the system south of Hathazari located in the southeastern part of Bangladesh.
Table 7-7 Peak Power Demand of 130 kV Substations in 2020 Supplied from the System South of Hathazari
Substation 2030 Peak Substation 2030 Peak
Chandraghona 160.9 Abul Khair Steel Mills 137.4
Hathazari 174.5 Baraulia 198.4
Baroirhat, Ctg 218.2 Bakulia 243.8
Madunaghat 267.8 Julda 81.3
Sikalbaha 220.6 Shahmirpur 139.3
Dohazari 162.9 Rangamati 166.3
Cox’s Bazar 172.1 Feni 183.6
Halishahar 129.9 Chowmuhani 98
Agrabad 160.1 Khagrachari 213.4
Kulsi 187.3 Kaptai 52.6
Total 3,368.4 Source: PSMP2010

Data Collection Survey on Coal Power Master Plan Follow-up in the People’s Republic of Bangladesh
7-13
Table 7-8 shows the plan of power plants around Chittagong area up to 2030 apart from Maheskhali 8,320 MW (Coal-fired: 660 MW x 2, 750 MW x 4, LNG 1,000 MW x 4) that is considered as one of the conditions of the Survey.
Table 7-8 Power Generation Plan in 2030 Located South of Hathazari (excluding Maheskhali)
HathazariPeakingPlantGEFO-New 100
Myanmmer toBangladesh(shouldreferfromPGCICHydro/RE-New 500
KaptaiPowerPlant(Solar)SPHydro/RE-New 5
Sikalbaha150MWPeakingPlant,U/CCTGas-New 149
Sikalbaha225MWDualFuel,CCCCGas-New 225
Chittagong600MWST#1STCoal-New-I 600
Chittagong600MWST#2STCoal-New-I 600
Chittagong-South600MW#1STCoal-New-I 600
DohazariPeakingPlantGEFO-New 100
HalishaharPeakingGEFO-New 100
Karnafulihydropowerplant HYHydro/RE-Ex 230
KarnafuliHydro(#6&7,250 MW)HYHydro/RE-New 100
PatengaOffshore,Chittagong(Wind)WPHydro/RE-New 100
HalishaharPeakingGEFO-New 100
3509
Source: PSMP 2011
The Survey assumes that the 400 kV double circuits transmission line between Anwara–Meghnaghat shown in Figure 7-8 will be commissioned before the operation of Maheskhali. Its F/S would be carried out by the World Bank.
Source: The Survey team
Figure 7-8 400 kV Double Circuit Transmission Line between Anwara–Meghnaghat
Anwara
Meghnaghat
Chittagong
1200

Data Collection Survey on Coal Power Master Plan Follow-up in the People’s Republic of Bangladesh
7-14
The 400 kV Sikalbaha substation is assumed to be constructed that was planned in PSMP 2010 for both Options I and II in and around Chittagong area. The 230 kV system is assumed to be separated by dividing it into Comilla north and Hathazari system in order to suppress its large power flow from south to north. The line parameters of 765 kV transmission lines are used as shown below. The temperature of resistance is set out as 55ºC.
Table 7-9 Line Parameters of 765 kV Transmission Line (100MVA Base, Unit:pu) R1 (20oC) R1(55oC) X1 B1
6 ACSR480 0.0000018090 0.0000020261 0.0000471520 0.0243821390
Source: The Survey team The construction cost of the 765 kV transmission lines is set as the following table referred to the example of the past investigation.
Table 7-10 Construction Cost of 765 kV Transmission Lines 765 kV Transmission Lines 1.38 million USD/km/2cct 765 kV Substations (Equivalent to 2,000 MVA x4)
496 million USD/2 stations
Source: The Survey team
The impedance and the capacity of three phase bank of 765/400 kV transformers is set as 15% and 1,000 MVA for three phases respectively and the required number of the banks is assumed for each substation. The cost of 0.08 US$/kWh and the loss factor of 0.5 are assumed for cost estimation of the loss of transmission lines. The allowable fault currents for both 765 kV and 400 kV systems are set out as 63 kA in accordance with PSMP 2010. The criteria that should be met from the viewpoints of power flow and system stability are set out in the same manner as described in the previous section.
Results of the Survey Both Options I and II require the multi circuits of the transmission lines from Chittagong to Dhaka for maintaining system stability. Option I finally requires the circuits of the transmission lines as follows. Maheskhali–Anwara 400 kV 4 circuits Anwara–Sikalbaha 400 kV 4 circuits Maheskhali–Sikalbaha 400 kV 4 circuits Sikalbaha–Meghnaghat 400 kV 10 circuits
Figure 7-9 shows the system configuration in the Options.
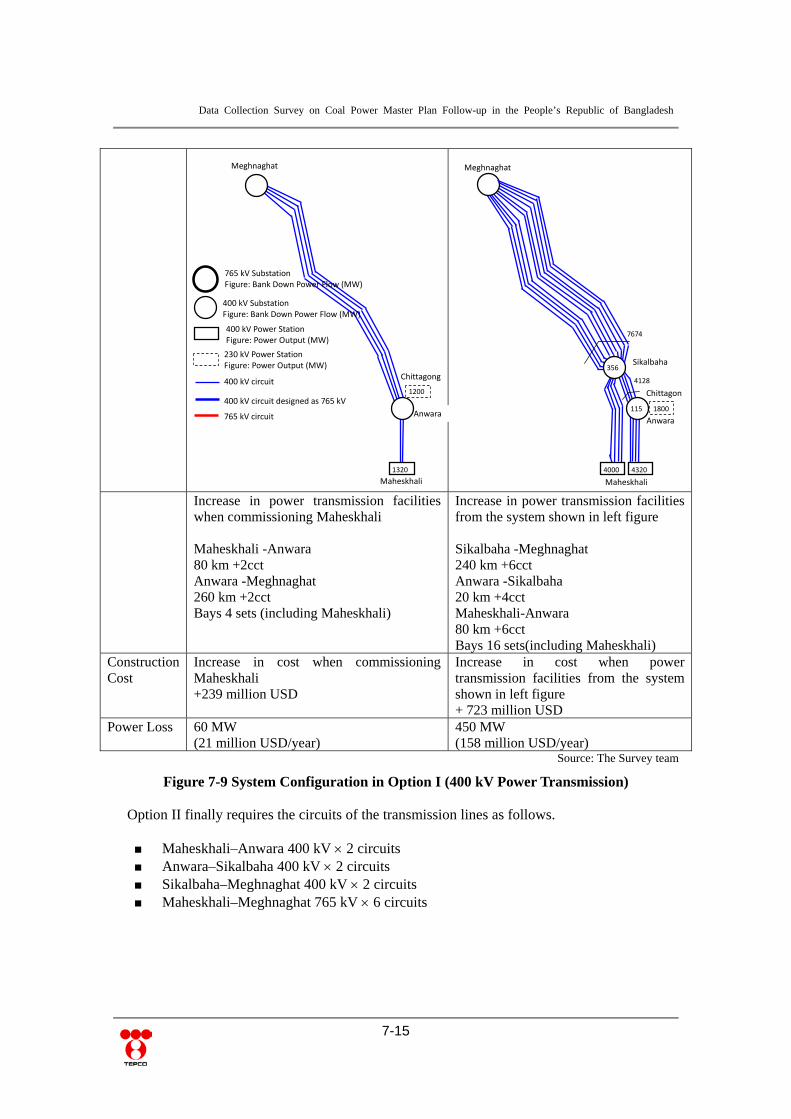
Data Collection Survey on Coal Power Master Plan Follow-up in the People’s Republic of Bangladesh
7-15
Increase in power transmission facilities when commissioning Maheskhali Maheskhali -Anwara 80 km +2cct Anwara -Meghnaghat 260 km +2cct Bays 4 sets (including Maheskhali)
Increase in power transmission facilities from the system shown in left figure Sikalbaha -Meghnaghat 240 km +6cct Anwara -Sikalbaha 20 km +4cct Maheskhali-Anwara 80 km +6cct Bays 16 sets(including Maheskhali)
Construction Cost
Increase in cost when commissioning Maheskhali +239 million USD
Increase in cost when power transmission facilities from the system shown in left figure + 723 million USD
Power Loss 60 MW (21 million USD/year)
450 MW (158 million USD/year)
Source: The Survey team
Figure 7-9 System Configuration in Option I (400 kV Power Transmission)
Option II finally requires the circuits of the transmission lines as follows.
Maheskhali–Anwara 400 kV 2 circuits Anwara–Sikalbaha 400 kV 2 circuits Sikalbaha–Meghnaghat 400 kV 2 circuits Maheskhali–Meghnaghat 765 kV 6 circuits
Anwara
Meghnaghat
Chittagong
Maheskhali
1200
1320
Anwara
Meghnaghat
Chittagon
Sikalbaha
Maheskhali
4000 4320
356
115
4128
7674
1800
400 kV Substation Figure: Bank Down Power Flow (MW)
400 kV Power Station Figure: Power Output (MW)
230 kV Power Station Figure: Power Output (MW)
765 kV Substation Figure: Bank Down Power Flow (MW)
400 kV circuit
400 kV circuit designed as 765 kV
765 kV circuit

Data Collection Survey on Coal Power Master Plan Follow-up in the People’s Republic of Bangladesh
7-16
Source: The Survey team
Figure 7-10 System Configuration in Option II (400 kV Power Transmission)
The total cost of facilities for Option I, 962 million USD, is less than that for Option II, 2,042 million USD. On the other hand, the peak loss of transmission lines at final stage for Option II, 450 MW, is less than that for Option I, 114 MW. The difference of loss of the transmission lines in Option I and Option II is equivalent to 110 million USD per year.
Increase in power transmission facilities when commissioning Maheskhali Maheskhali-Anwara 400 kV 80 km +2 cct Anwara-Meghnaghat 765 kV designed 260 km +2 cct Bays 4 sets(including Maheskhali)
Increase in power transmission facilities from the system shown in left figure Sikalbaha-Meghnaghat 765 kV 240 km +4cct Maheskhali -Anwara 765 kV 100 km +6cct Two substations 496 Bays 765 kV 4 sets(including Maheskhali )
Construction Cost
Increase in cost when commissioning Maheskhali + 430 million USD
Increase in cost when power transmission facilities from the system shown in left figure + 1,612 million USD
Power Loss 45 MW (16 million USD/year)
114 MW(decrease from Option I by 336 MW) (40 million USD/year) (decrease from Option I by 118 million USD/year)
400 kV Substation Figure: Bank Down Power Flow (MW)
400 kV Power Station Figure: Power Output (MW)
230 kV Power Station Figure: Power Output (MW)
765 kV Substation Figure: Bank Down Power Flow (MW)
400 kV circuit
400 kV circuit designed as 765 kV
765 kV circuit
Anwara
Meghnaghat
Chittagong
Maheskhali
1200
1320
Anwara
Meghnaghat
Chittagong
Maheskhali
Sikalbaha
3000 2,070
1,800 62
3250
▲3250
▲3000
6703
▲453
1617
378
1532
1150
6647

Data Collection Survey on Coal Power Master Plan Follow-up in the People’s Republic of Bangladesh
7-17
The above-mentioned results are obtained through the rough estimations. The studies of the selection of those options should be carried out at F/S stages through the detailed economic calculation in consideration with the disbursement of the cost of the transmission facilities in accordance with the development of Maheskhali units and the value of loss reduction. Notices for Expected Feasibility Study of Transmission Lines Notices for the expected Feasibility Study regarding the main specifications of transmission facilities and their costs are described as follows. Option I “Construction of 400 kV Maheskhali–Meghnaghat transmission line” and
Option II “Construction of 765 kV Maheskhali–Meghnaghat transmission line” both require “the 400 kV double circuit transmission line between Maheskhali and Anwara” when Maheskhali 660 MW 2 is commissioned in addition to the Meghnaghat–Anwara 400 kV double circuit transmission line with its Feasibility Study under preparation. The study of “the 400 kV double circuit transmission line between Maheskhali and Anwara” should be urgently carried out regarding its route, environmental impact assessment, methodology of securing right of way, and its detailed design.
The above-mentioned transmission line between Maheskhali–Anwara–Meghnaghat needed at the operation of Maheskhali 660 MW 2 units is designed as 400 kV for Option I; however, as 765 kV for Option II. Thus, the detailed comparison between Options I and II should be made at the F/S stage. The total cost of facilities in Option I is lower than in Option II. On the other hand, the power transmission loss in Option I is larger than in Option II. The costs of Options I and II should be compared in consideration with the pattern of development of the transmission lines in accordance with the speed of the development of Maheskhali power units and the value of loss reduction.
The cost data of the transmission facilities used for the Survey is based on the results of PSMP 2010. The transmission line would pass the locations with mal conditions or crossing over the rivers. The actual cost has the possibility of having large difference from the result of the Survey mentioned in this section. The route and its geological features should be studied in detail.
Source: The Survey team
Figure 7-11 System Configuration around Maheskhali and Chittagong
Anwara
Maheskhalii
Chittagong
Chittagong South
To Meghnaghat

Data Collection Survey on Coal Power Master Plan Follow-up in the People’s Republic of Bangladesh
7-18
Both options require the large reactive power compensation for the large charge
capacity of the transmission lines with its large distance and multi circuits. The required capacity of shunt reactors, their installation methodology, and notices for their operations should be studied.
The reason why the system requires the multi circuits of 400 kV or 765 kV transmission lines between Maheskhali and Meghnaghat is to maintain the system stability of large power transmission with its large distance. Some countermeasures against its many circuits and large costs are considered such as the installation of series capacitors or installation of middle point switching station. Thus, those kinds of options should be studied and compared in the study of the methodology of the power transmission of Maheskhali units at its final unit configuration. The technical constraints such as increase in losses due to a smaller number of circuits of transmission lines and sub-synchronous oscillations of power generators caused by installation of series capacitors should be examined.
Concentrating generator units in one place, Maheskhali, produces large fault currents in a 400 kV system. Dividing the groups of the generator units and splitting the 400 kV bus bars of Maheskhali power station is required for reducing the fault current levels in both Options I and II to the allowable range (63 kA). Thus, the system configuration of its switching station should be examined in the study of the methodology of power transmission for the final unit configuration of Maheskhali power plant.
The other technical requirements such as the impedance of 765/400 kV transformers, the requirements of the phase twisting of the transmission lines should be studied at F/S stages.
The project should be implemented step by step according to the realistic plans because the rapid development of new power generation with its capacity over 8,000 MW in Maheskhali island whose study is being proceeding by Bangladesh side would require a huge amount of transmission lines to avoid the instability of a whole of the power system that is feared at least from the short-term point of view.

Data Collection Survey on Coal Power Master Plan Follow-up in the People’s Republic of Bangladesh
8-1
Chapter8 Schedule and Cost of the Prioritized Projects 8.1 Schedule of the Prioritized Project
The assumed entire schedule of the prioritized project is as follows.
F/S
IEE/EIA
Land Acquisition
Technical Consultants
Selection
Engineering
Port Facility
Detail Design
Bid Tender
Civil Work / Construction
Coal Handling / Stockyard
Detail Design
Bid Tender
Civil Work / Construction
Generation Facility
Detail Design
PQ/Bid
Civil Work
Construction (Unit 1)
Construction (Unit 2)
Transmission Line
Detail Design
Bid Tender
Land Acquisition
Construction
Calendar Year 20202016 2017 2018 20192012 2013 2014 2015
Source: The Survey team
Figure 8-1 Assumed Schedule of the Project
At the moment of February 2012, BPDB has ordered IEE/EIA to the local consultant. GOB is planning to formulate the PSMP2010 of the development of Maheskhali after that. For the next step, F/S should be conducted by considering the procedure of the study of GOB.
8.2 Cost of the Prioritized Project
The following table shows the fiscal expansion of the project costs for the construction on Matarbari and Maheskhali. The following are the preconditions. The payment amount of generation facility and transmission facility is, 15% for 1st year,
30% for 2nd year, 35% for 3rd year, and 20% for 4th year. The part of port facility, Chapter 5 (the detailed study based on the site survey) is
referred to. The construction period of civil and port facility is 2 years; the payment amount is 70%
for 1st year, 30% for 2nd year. Regarding transmission line, 400 kV double circuit to Dhaka (270 km) is constructed.

Data Collection Survey on Coal Power Master Plan Follow-up in the People’s Republic of Bangladesh
8-2
Table 8-1 Fiscal Expansion of Required Cost for Matarbari TOTAL Year 1 Year 2 Year 3 Year 4 Year 5
Generation Facility
Unit 1 850 0 127.5 255 297.5 170 Unit 2 750 0 112.5 225 262.5 150
Civil Works 170 119 51 0 0 0 Port Facility 425 297.5 127.5 0 0 0
Power Transmission Facility 224 0 33.6 67.2 78.4 44.8 Sub Total 2,419 417 452 547 638 365
Tax & Insurance(20%) 483.8 83.3 90.42 109.44 127.68 72.96 TOTAL 2,903 500 543 657 766 438
Source: The Survey team
Table 8-2 Fiscal Expansion of Required Cost for Maheskhali TOTAL Year 1 Year 2 Year 3 Year 4 Year 5
Generation Facility
Unit 1 850 0 127.5 255 297.5 170 Unit 2 750 0 112.5 225 262.5 150
Civil Works 170 119 51 0 0 0 Port Facility 395 276.5 118.5 0 0 0
Power Transmission Facility 233 0 34.95 69.9 81.55 46.6 Sub Total 2,398 396 444 550 642 367
Tax & Insurance(20%) 479.6 79.1 88.89 109.98 128.31 73.32 TOTAL 2,878 475 533 660 770 440
Source: The Survey team

Data Collection Survey on Coal Power Master Plan Follow-up in the People’s Republic of Bangladesh
9-1
Chapter9 Review on Implementation Framework of the Prioritized projects 9.1 History of the Power Sector Reform
Since the independence of the People’s Republic of Bangladesh in 1972, BPDB had owned power generation, transmission, and distribution system in Bangladesh. Structural reforms of the power sector started from 1990s. The Power Sector Reform Commission prepared a report in 1993 that stipulates 1) Unbundling of BPDB (organizational segmentation among functions), 2) Corporatization of BPDB, and 3) Establishment of Bangladesh Energy Regulatory Commission (BERC). Based on the report, the framework of BPDB unbundling and promotion of private participation in the power sector was outlined. Furthermore, the introduction of IPPs in power generation business was institutionalized in 1996 for promoting private sector investment. In 2000, the overall policy framework of the power sector reform and its basic principles were made public as “Vision and Policy Statement on Power Sector Reforms”. Its main points are as follows: To provide cheap and reliable electricity to all citizens by 2020 To promote economic development while ensuring profitability of power sector To improve efficiency of power sector To introduce a new corporate culture in power companies To improve supply stability To utilize primary fuel for power generation and natural gas To Encourage private participation To achieve reasonable and affordable electricity rate To promote competition among power companies
With the assistance from international development agencies to support this movement, BPDB’s organization was segmented into generation, transmission, and distribution functions in 1994. In the next step, BPDB has carried out its organizational restructuring by establishing subsidiaries and Strategic Business Units (SBUs) as follows:
Table 9-1 Corporatization and SBU(As of 2009)
Source: The Survey team Note: Establishing SBU is a way to endow managerial discretion to BPDB’s power stations so that their management can be as autonomous as possible from BPDB Headquarters. This intends to provide incentives to their staff for rationalizing their business procedures, improving operational efficiency, and grasping profitability. Japan has also provided supports to these reforms since 1999.
Year Business Types Names of established companies 1996 Transmission
Distribution Corporatization Power Grid Co. of Bangladesh (PGCB)
Dhaka Electric Supply Co. (DESCO) (Support by ADB) 2000 Generation Corporatization Ashuganj Power Station Co. Ltd. (APSCL) 2002 Generation SBU establishment Haripur power generation station 2003 Generation
Distribution SBU establishment Corporatization
Baghabali power generation station West Zone Power Distribution Co. Ltd.(WZPDCL)
2004 Generation Corporatization Electricity Generation Co. of Bangladesh (EGCB) 2006 Distribution Corporatization Dhaka Power Distribution Co. Ltd. (DPDC) 2007 Generation Corporatization North West Power Generation Co. Ltd. (NWPGCL)

Data Collection Survey on Coal Power Master Plan Follow-up in the People’s Republic of Bangladesh
9-2
9.2 Increasing Efficiency through Power Sector Reform
9.2.1 Current Status of the Corporatization (2009-2011)
According to the evaluation study conducted by ADB in 2009 and the Survey team’s observations referring to each subsidiary company’s and SBU’s annual reports, the results of their reform vary from successfully improved cases to stagnated cases, i.e. companies and SBU’s that are still under strong influence of BPDB’s management. The status of these companies and SBU’s are summarized as follows: PGCB has assumed the operation and construction of transmission facilities nationwide
in cooperation with BPDB. Since 2003, PGCB has owned all transmission facilities including the central dispatching center. Initially PGCB’s shares were owned 100% by BPDB but its ownership has reduced to 76%. The remaining shares of PGCB are listed in the stock exchange market of Bangladesh and are owned by minority shareholders.
DESCO is the most successful example of corporatization. DESCO has remarkably improved its customer services and reduced its accounts receivable rate and distribution loss rate. It was highly praised in the evaluation study report published by ADB. The Survey team’s evaluation of DESCO will be discussed in detail in the next section.
In the meanwhile, there also exist other distribution companies like DTDC, REB, BPDB, and WZPDCL, which, according to some sources, are not operating as efficient as DESCO.
Many of the power plants used to be under the ownership or control of BPDB, and they had to follow BPDB’s instruction to continue operation without regular maintenance period. Their separation from BPDB Headquarters makes them free from the instruction from BPDB Headquarters and allows them to operate the power plants optimally by themselves. Furthermore, providing them with incentives for improving their operational efficiency helps power plants to contribute to stable power supply. Abating unreasonable instruction from BPDB Headquarters to continue operation without regular maintenance helps reducing unexpected shutdown of power plants and improving stability of power supply, though it may not mitigate the problem of securing adequate volume of power supply to meet the rapidly increasing demand.
NWPGCL was established in 2007 by separating from BPDB and their gas-fired power plant projects are currently underway (Sirajganj 150 MW, Khulna 150 MW, Bheramara 360 MW CCPP Development project). These projects have been making good progress, thanks also to the assistance from ADB and JICA. The success of NWPGCL may lie on its management because most of its original board members came from BPDB when it was established, and even today BPDB influence appears to remain strongly. At this moment the business of NWPGCL mainly focuses on the construction of three power plants and it’s still too early to judge whether the structural reform of NWPGCL will work well. More details about NWPGCL will be discussed I this report.
9.2.2 Evaluation of the Corporatization of Power Division (as of February 2012)
Officials for power sector policymaking in Bangladesh Government are evaluating the status of power sector reforms as follows:
1) Evaluation of Corporatization of DESCO and PGCB The corporatization of the above two companies has been successful to some extent. Its downside is the increase of their management cost (note: no quantitative data to
support this argument was available).

Data Collection Survey on Coal Power Master Plan Follow-up in the People’s Republic of Bangladesh
9-3
Their procurement costs have increased after they separated from BPDB (note: no
quantitative data to support this argument was available either). The upside of corporatization is that the business process and managerial
decision-making became smoother and faster. Operational efficiency of these companies became higher than before.
2) Evaluation of the Service from DESCO and PGCB
Customer services of these two companies have improved after their corporatization. Companies like DESCO have outsourced many of their tasks after corporatization. The ratio of metered billing has been increased for these companies, and their
consumers also accept this positively. However, it does not mean that they may be the best way of corporatization, and the
discussion for further reform is still underway.
3) Evaluation of the Status of Introducing IPPs in Bangladesh Recently many IPPs have been established in Bangladesh, and the percentage of IPP and the government-owned power companies in power supply in 2011 was 40% and 60% respectively. This ratio is expected to become 50%:50% in 2012.
4) Regarding the Implementation Status of ADB’ s Report "Corporatization of BPDB"
Full compliance with this report is difficult for BPDP because the report’s concepts of corporatization are different from BPDB’s own idea.
Power sector reforms proposed by the report cannot be fully implemented from the viewpoint of national energy security policy.
Specific procedures for enhance the efficiency of BPDB are provided in the report. Currently BPDB is considering its own idea for improving its efficiency called
“Strategic Profit Center” (SPC). The concept of SPC is to divide BPDB’ business into several groups such as
distribution, power generation, and so on. Each SPC is obliged to make efforts for improving its own efficiency. BPDB is now in negotiation with the World Bank on establishing SPC for power distribution division. However, the details of this negotiation were not available at the moment of February 2012.
Through the introduction of SPC, the efficiency of BPDB’s distribution division is expected to improve without increasing management costs.
5) Regarding Future Incentives to Power Sector
The Government has issued the “Performance Target Agreement” of the power sector. It consists of target-setting of loss reduction, increasing efficiencies and so on, and some incentives like bonus will be given to companies in accordance with the achievement of targets. On the other hand, penalties are imposed to non-complying companies.
6) Incentives for Foreign Investors Incentive schemes for promoting foreign investment have already been presented by the government. Documents for reference have also been provided.
Data Collection Survey on Coal Power Master Plan Follow-up in the People’s Republic of Bangladesh
9-4
9.2.3 Roles of BERC (as of February 20 )12
1) Establishment of BERC (Bangladesh Energy Regulatory Commission) and its staffing
Based on the Bangladesh Energy Regulatory Commission Act 2003, BERC was established for supporting the privatization of power sector and promoting private sector participation. Its organization consists of one chairperson, two board members, five secretary directors, three deputy directors, eight assistant directors, and 30 other members as of February 2012, that is, 49 persons in total. All the members are assigned from government officials.
2) Roles of BERC BERC has a role to provide appropriate circumstances for protecting the interests of consumers and the sustainable development of the energy sector such as fair trading through reasonable cost. More specifically, its responsibility is to promote business opportunities based on an equal footing between public and private sectors, to ensure the transparency of all energy sectors, and to promote efficiency through incentives, and to set standards for various business operations.
3) Oil, Gas and Coal Prices Gas and oil prices in the upstream are set by Petrobangla. BERC regulates the consumer
prices of gas and oil products. The price of natural gas is set for each category, i.e. that for power generation use, for
fertilizer use, for captive power generation use, for industrial use, for tea cultivation use, for commercial use, and the fixed prices for one burner and two burners. Gas prices are set specifically for different types of usage, likewise the case of power tariffs.
Oil products prices (in the downstream) are regulated by BERC. Oil products prices are the same rate regardless of the types of usage.
Petrobangla also holds responsibility for domestic coal production. Coal price is the same rate regardless of the types of usage.
4) Power Tariff
BERC is responsible for regulating all types of electric power tariffs, such as wholesale, retail, and bulk power tariff.
When determining the power tariff, there is a rule that BERC has to decide after hearing the opinions of all stakeholders.
BERC is calculating the benchmark of power tariffs as the reference. When calculating the benchmarks, different types of power generation costs are taken into account such as “using private sector power generation”, “using different types of fuel,” and “power usage in rural areas”.
Different power tariffs are set for different power voltage such as 132 kV and 33 kV, and for different distribution companies.
The prices of power generation using imported coal are applied proportionally to power distribution companies. This rule will also be applied for Matarbari/Maheskhali power stations from which BPDB will also procure generated electricity.
Though BPDB chronically has a problem of heavy debt, BERC is apt to lower the rate of tariff increase from BPDB’s original application.

Data Collection Survey on Coal Power Master Plan Follow-up in the People’s Republic of Bangladesh
9-5
5) Required Procedures for Constructing Power Plants
Construction of Matarbari/Maheskhali power station requires the approval of BERC. When the power plant is planning to use imported equipment or software, it also
requires the approval of the National Board of Revenue (NBR) in Bangladesh, which an agency under the Ministry of Finance.
9.2.4 Evaluation of the Effectiveness of DESCO Corporatization (as of February )2012
CEO (Chairman, Managing Director) of DESCO is recruited openly from the public. At present, the Chairman is Mr. Shahjahan Siddiqui and the Managing Director is Mr. Monazur Rahman. Among the total nine Board members, seven are from external organization, namely BDPB, Power Division, Ministry of Law, BUET (Bangladesh University of Engineering and Technology), DESA, Regal enterprise, and DPDC.
After DESCO was established in 1996, the company became able to improve its operation and services on its own discretion. Before the establishment of DESCO, works were done following the requests made by the Government to BPDB. Now the operational improvements of DESCO can be implemented on its own will. It contributes to improving employees’ motivation, which is witnessed remarkably in the improvement of customer services. Repair and maintenance of the customers’ meters are made more frequently than before, and tariff collection rate is increased. Currently DESCO’ s collection rate is 99% whereas the rate of other distribution companies (REB, DPDC, and BPDB) is still around 90% and is lower than DESCO’ s.
The Government is supposed to retain the majority of the shares of split companies. BPDB and other companies like CPGC, EGCP, NWPGCL, EGCB, PGCB, DESCO, and DTDC are positioned horizontally under the government’s control, but the Government may not intervene directly in their management. Currently 75% of DESCO’s share is held by the Government. The remaining of 25% belongs to minority shareholders. The number of its shareholders in 2011 is 6,600 persons/corporations. Five thousand shareholders own less than 500 shares each. In the future, the Government’s share will be reduced to 51% and the percentage of private shareholders is expected to increase. Here, the “Government” is not confined to BPDB, but defines the entire GOB.
The electricity prices are determined by BERC (tariff table is available from BERC). DESCO is preparing to adopt tariff collection through the Internet in near future. The system will use credit cards of the customers for payment. The power procurement cost of DESCO from BPDB is 3.6 taka/kWh (4.5 cent/kWh), and the transmission fee paid to PGCB is 0.2291 taka/kWh (0.275 cent/kWh) in 2011. The ratio of shareholder equity (excluding retained earnings) to the total assets is 20%.
The number of DESCO’s employees when it was established in 1996 was 16, and then increased to 84 in 1998, 124 persons in 2002, 700 in 2004, 1,000 persons in 2009, and 1,500 in 2011. DESCO is planning to increase the number to 1,600 persons. All personnel are recruited openly from the public.
DESCO’ s accounts receivables rate has improved significantly over the past six years. The improvement of staff services improves the customers’ willingness to pay the power tariff. DESCO gives bonuses to good-performing employees. The distribution losses rate of DESCO in 2005 was 16.6%, but in 2011 it was reduced to 8.8%, i.e. around the half (thanks to anti-theft activities and the increased of metered billing)

Data Collection Survey on Coal Power Master Plan Follow-up in the People’s Republic of Bangladesh
9-6
9.2.5 Evaluation of Effectiveness of NWPGCL Corporatization (as of January )2012
1) Overview of NWPCGL
NWPCPL was founded in 2007. NWPCPL’ s power plants are Sirajganj 150 MW Peaking Power Plant, Khulna 150 MW Peaking Power Plant, and Bheramara 360 MW Combined Cycle Power Plant (Upcoming). The number of employees is 80 as of the end of 2011, and including project staffs, it’s 112 persons. As there hasn’t been many years since the formation of NWPGCL, it is too early to evaluate the improvement of its operational efficiency, but the Survey team heard an opinion pointing out that the corporate culture in BPDB era still remains in NWPGCL.
2) The Roles of ADB and JICA
ADB provides financial support for the development of Khulna 150 MW and Sirajganj 150 MW power stations, which were the projects transferred from BPDB to NWPGCL. In addition, ADB has been supporting for the corporatization of NWPGCL. JICA is providing assistance for the development of Bheramara 360 MW combined cycle project.
3) Shareholders of NWPGCL The main shareholder of NWPGCL is BPDB, and other companies in energy sector have stakes in it, namely DESCO, PGCB, PGCB, Jamuna Oil Company, Meghna Petroleum Company, and Titas Gas Transmission & Distribution Company. NWPGCL shares are listed in the stock exchange market. NWPGCL can also issue new shares for raising new capital funds. Through this process, not only the public sector but also the development partners (private sector) will become the major shareholders of NWPGCL in future.
4) Selection of Chairman and Managing Director The 10 board members are selected based on its corporate rules. The existing board members have been in service since September 2011. The chairman is Mr. Khizir Khan (Pre-chairman of BPDB). Its corporate rules stipulate that CEO (especially Managing Director) is selected by the board meeting after open-recruitment.
5) Long-term Loans GOB provides long-term loans to NWPGCL through ODA funds. Loan agreement was concluded between ADB and GOB in June 2007 to finance the Khulna 150 MW Peaking Power Plant Projects and Sirajganj 150 MW. JICA provided loans for the implementation of Bheramara 360 MW Combined Cycle Power Development Project.
9.3 Support to Coal-fired Power Development from Other Development Partners
9.3.1 Current Status of International development agencies’ support to power sector reform and coal-fired power development
World Bank (WB) proposed to MOPEMR recommendations on power sector reforms in the study report of “Power sector Financial Restructuring Recovery Plan” in August 2006. ADB made the study report of “Corporatization of BPDB” in July 2008 and urged MOPEMR to carry out reforms in policies and organizations in power sector. However, as of December 2011, both Banks consider that the progress of power sector reforms is not satisfactory compared to what their study reports expected.

Data Collection Survey on Coal Power Master Plan Follow-up in the People’s Republic of Bangladesh
9-7
1) World Bank
WB’s evaluation of the current status of power sector reforms BPDB has carried out separation of some of its functions, but the financing and accounting of the split companies may still belong to BPDB. WB evaluates the power sector reforms as follows:
BPDB does not transfer their managing power to the separated companies and still has the managing power over them. The power sector reform in Bangladesh is still far from completed.
A WB officer in charge of power sector reforms in Bangladesh visits from Washington D.C. every three or four months has meetings with BPDB, but sees the progress of reforms very slow.
WB has implemented capacity building training for BERC several times in Washington D.C., which helps moving forward the reforms little by little.
WB’s position on coal-fired power development WB understands the current status of coal-fired power development as follows:
Among the coal-fired projects, WB understands that two projects, one by Orion Group in Mongla (600 MW) and another by Lanco International (600 MW), are in progress. However, WB was not aware of the joint venture project of NTPC and BPDB in Khulna.
BPDB has separated some of their functions, but their financing and accounting are still under BPDB’s control.
WB’s Headquarters has a policy confining its involvement in developing coal-fired power generation.
Current status of WB projects for developing transmission lines in Bangladesh WB takes a sensitive position in supporting projects for developing transmission lines related to coal-fired power for the following reasons:
When the planned transmission lines are expected to connect to coal-fired power plants, it becomes difficult for WB to support the project. The judgment whether to support the project or not is made by the Headquarters.
WB is currently preparing the Feasibility Study of 400 kV Anwara–Maowa–Mongla and Chittagong (Anwara)–Meghnaghat double circuit transmission line, and currently the selection of consultants is underway. The project term is supposed to be four months.
2) Asian Development Bank
ADB’s evaluation of the current status of power sector reforms ADB evaluates the current status of power sector reforms as follows:
ADB recommended the five-stage progress of BPDB reforms in “Corporatization of BPDB” in 2008. ADB recognizes that the current situation of BPDB is still at the Stage 0 (same situation in 2008). It means that BPDB has not made any significant progress in the reforms.
IPP and JV investment are the reforms of business framework of BPDB, but not the structural reform of BPDB. ADB requires that the structural reform of BPDB be put in place.
Establishment of “Coal power generation Co. (CPGC)” is not regarded as structural reform, but is a type of business reforms. It is not projected that CPGC will be transformed into a holding company.

Data Collection Survey on Coal Power Master Plan Follow-up in the People’s Republic of Bangladesh
9-8
Along with the recent structural reforms of the power sector, EGCB (Electricity
Generation Company of Bangladesh) and three distribution companies were established, but this did not lead to the drastic restructuring of BPDB.
ADB’ s position on coal-fired power development ADB understands the current status of coal-fired power development as follows:
Regarding coal-fired power plants and related transmission lines, ADB takes cautious stances on whether it supports or not it, because it touches on the issue of climate changes. ADB has no plan to support any coal-fired power generation projects, regardless of whether they use imported coal or domestic coal.
ADB recognizes that there are environmental (deep coal mines, near residential area) problems concerning domestic coal production in Bangladesh. It is considered that a balance should be made between coal development and environment protection.
ADB is focusing its cooperation for energy development in Bangladesh on the introduction of clean energies (natural gas, renewable energies and so on).
ADB nevertheless has no intention to oppose to the JICA studies on coal-fired power development
Anyway ADB cannot say clearly at this moment whether it’s ready to cooperate with JICA for coal-fired power generation projects in Bangladesh.
ADB position on base-load power generation in Bangladesh The study report of “Power System Master Plan Update” (Chapter 6) prepared by ADB in 2006 (PSMP2006) recommends using coal-fired and natural gas power generation as base-load power generation. However, following the ADB’ s new policy to focus more on promoting climate change measures, ADB gave up supporting coal-fired power plants in Bangladesh. The possibility that ADB supports base-load power generation is confined to power generation using imported LNG or power import from neighboring countries (note: there exists a plan of power import from India according to a consultant whom the Survey team met at PGCB office). ADB emphasizes that cleaner energies (natural gas and renewable energy) have to be developed and used in Bangladesh.
9.4 Key Considerations for Power Sector Reforms in the Future
9.4.1 Balancing between Power Tariff and Natural Gas Price
Natural gas production has seen its increase by about 70% from 2001 to 2008, and the power sector accounts for 60% of total consumption of natural gas. Recently, the consumption of natural gas for other purposes has been increasing rapidly, such as residential consumption, captive power generation in industrial sector, and processing of industrial raw materials, and the supply of natural gas for new power generation plants is facing with shortage. It is observed that many industrial companies switch the power supply from grid power to inexpensive captive power generation using natural gas, which may be one of the reasons why natural gas consumption increases in the industrial sector. The shortage of natural gas is particularly serious around Chittagong area. According to the information obtained from Petrobangla (oil and gas supply company), they have a plan to build a LNG acceptance base (floating island or jetty) on the ocean near Maheskhali. The natural gas will be sent to Chittagong city area from 91 km distance. The operation of the plant will start in the summer of 2013 (supported by World Bank). There’s a trade-off of

Data Collection Survey on Coal Power Master Plan Follow-up in the People’s Republic of Bangladesh
9-9
energy supply between power and natural gas in Bangladesh, hence the balance of power tariff and natural gas prices needs careful considerations. The responsibility of BERC is expected to be more important.
9.4.2 Fuel Procurement in the Power Sector
It is projected that the LNG import planned by Petrobangla from 2013 will be used mainly for residential consumption and industrial consumers, not for power generation. That means that if more supply of natural gas is needed for power generation in future, power companies will have to import LNG by themselves. There exists Power Division’s plan of Maheskhali LNG import terminal is for power generation, but considering the shortage of domestic natural gas supply for power sector, more efforts for LNG import on power sector’s own initiative may be needed. The situation is basically the same with coal-fired power generation.
9.4.3 Distribution Companies in Urban and Rural Area
Distribution companies in urban areas like DESCO have seen improved revenue recovery by 2008 due to the increasing power tariff adopted since 2001. However, the performance of distribution companies in rural areas is still far lagging behind. In other words, tariff increase has created a strong contrast in the performance between urban and rural power distribution companies. This issue may affect the policy corporatizing power distribution companies in future.
Table 9-2 Power Tariffs (33kV) of the Distribution Companies (as of February 2012) Company DPDC REB DESCO WZPDCL BPDB NWPDCL Other
Taka/kWh 4.25 3.17 4.24 3.47 3.98 3.98 3.98 Source: The Survey team
9.4.4 Introduction of Incentives to Corporatized Companies
ADB has provided support to Bangladesh power sector with the studies “PSMP2006” and “Corporatization of BPDB in 2008”. World Bank has carried out “Power sector Financial Restructuring Recovery Plan in 2006” and “Capacity building BERC”, and JICA has provided assistance such as “Support the business of the corporatized companies” and PSMP2010. These supports are eyeing for the promotion of power sector structural reforms through privatization, managerial transparency, and corporatization. It does not only help improving the efficiency of operation, but also helps undertaking reforms on the companies’ own initiative as symbolically observed in DESCO’s case, securing human resources with high motivation, and providing better customer services. Corporatization and companies’ incentive systems have been proven to be effective both in existing and in newly established companies. It can be considered that such system has to be introduced to the companies that need better performances and the introduction of such system can promoted with the support from international development agencies. However, GOB considers that the power sector will become more efficient with the planned “Performance Target Agreement”, even without corporatization. It may depend on the framework of Performance Target Agreement that is currently under negotiation between World Bank and BPDB whether this plan will yield effectiveness.

Data Collection Survey on Coal Power Master Plan Follow-up in the People’s Republic of Bangladesh
9-10
9.4.5 IPP Participation by Promoting Privatization
Based on the power sector reforms proposed by ADB and World Bank, the development of Bangladesh power sector would be enhanced by IPP power projects with private investment in the 2000’s. However following the Asian monetary crisis that took place from 1997, IPP business has stagnated in Bangladesh since 2002. For this reason, dependence on rental power generation business has increased, which has led to further increase of BPDB’s debt and GOB’s. ADB’s study report described that BPDB has reacted as the “resistance” against the power sector reforms suggested by World Bank and ADB. For making the sector reforms on the right track, expansion of IPPs financed by foreign investment is crucial. According to the information obtained from the BPDB, some companies from China, Thailand, and Malaysia have shown interest in power generation business in Chittagong. In addition, if IPP business in Maheskhali is put in place with the investment form Japanese companies, this can be a good example of proving the effectiveness of privatization and foreign investment participation in Bangladesh.
9.4.6 Independence of CPGC
According to the Articles of Incorporation of CPGC, CPGC was established to undertake power generation using imported coal and its business is supervised by the government, namely Power Division. In addition, the Articles describes that Managing Director of CPGC should be recruited openly from the public. The process is the same as in the establishment of DESCO. If the influence of BPDB over CPGC is limited, it may secure discretion on its management. However, based on the stipulation of the Articles of Incorporation, CPGC has already decided it chairman is assumed by the chairman of BPDB concurrently, and the open recruitment of the Managing Director is yet to be determined. This process is taking a similar track to the establishment of NWPGCL, and gives uncertainty whether CPGC can secure its managerial independence from BPDB or not.
NWPGCL CPGC other powergeneration company
BPDB single PGCB
Distribution X Distribution Y Distribution Z
Power flow Money flow
Power consumers
Source: The Survey team
Figure 9-1 Power and Money Flows from Power Generation to Consumption

Data Collection Survey on Coal Power Master Plan Follow-up in the People’s Republic of Bangladesh
9-11
9.5 Recommendations on the Implementation of Coal-fired Power Generation
Currently, coal-fired power generation development has promoted mainly by Coal Power Generation Company (CPGC); the company has to be continuously in charge of the operation and maintenance of the plants. Because CPGC was just inaugurated, there are still a lot of uncertainties about this company, but the recommendations for CPGC based on the Survey team’s current observations are as follows:
9.5.1 Organizational Setup for Operating a Coal-fired Power Generation Company
The corporate organizations of the newly established company should be designed optimally for promoting power generation business, and the divisions responsible for plant operation, fuel procurement (coal import), environmental protection, and power plant construction need to be prepared to meet this requirement. The following list is the requirement for setting up the administration and maintenance of CPGC. 1) Organizational description: Organizational chart, definitions of each division’s
responsibilities and job description of the power stations. 2) Personnel management: wage system, welfare programs and human development
programs 3) Accounting: Financial accounting system, investment planning, and budgetary planning 4) IT system: plant operation system and investment planning system using IT 5) Operation and maintenance management of the power station 6) Contracting: PPA, fuel procurement, operation and maintenance contract etc. 7) Long and mid-term planning: projection of sale and costs, financing plan, and staffing
plan Since Bangladesh has no experience in the operation of power plant using imported coal, clear definition of responsibilities and job description will be the key to success. Upon the completion of the power plant and the commencement of its operation, the main issue of its business will be the operation and maintenance of the power plants, but it also needs to take into account that port management and environmental management also affects significantly its operation. The following is the Survey team’s proposal with regard to these issues: <Port Management> Currently, the operation, management, and maintenance of international ports in Bangladesh (Mongla in the west and Chittagong in the east) are the responsibility of Port Authorities that were established under the Ministry of Shipping. The necessary volume of coal procurement for the planned coal-fired power plant is estimated at 1.75 million tons per year for sourcing one unit of 600 MW power plant, and assuming to use 80,000 t-class vessels for importing coal from Indonesia, twice shipping per month is estimated. Large-scale vessel like 80,000 DWT-class is assumed for transporting coal thus considerable level of capability is also needed for port management. Through the discussion with the Ministry of Shipping, experts in port management needs to be selected, who will be assigned to a newly established division within CPGC, by the time the power plant starts operation. In the future when the vessels using ports with the expansion of power plants and so on, spinning off a company specialized in port management is desired.
Data Collection Survey on Coal Power Master Plan Follow-up in the People’s Republic of Bangladesh
9-12
<Environmental Management> After the completion of the power plant and the commencement of its operation, a department responsible for environmental management needs be established to serve for the purposes of 1) air pollution management surrounding the plant, 2) water quality management, 3) biogeocenosis monitoring, and 4) health management of the employees. Likewise the port management, experts in environmental management need to be selected, who will be assigned to a newly established division within CPGC, by the time the power plant starts operation. In the future when the tasks related to environmental monitoring increases, spinning off a company specialized in environmental management is desired, which is also favorable from the aspect of assuring neutrality.
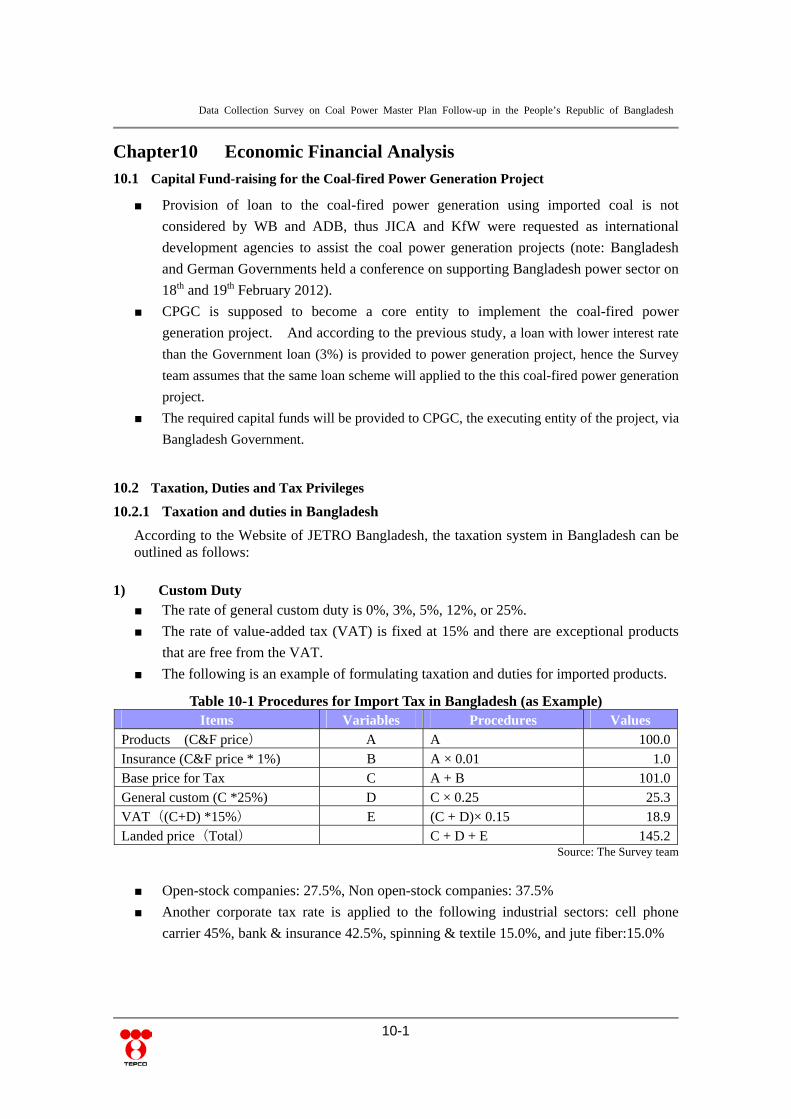
Data Collection Survey on Coal Power Master Plan Follow-up in the People’s Republic of Bangladesh
10-1
Chapter10 Economic Financial Analysis 10.1 Capital Fund-raising for the Coal-fired Power Generation Project
Provision of loan to the coal-fired power generation using imported coal is not
considered by WB and ADB, thus JICA and KfW were requested as international
development agencies to assist the coal power generation projects (note: Bangladesh
and German Governments held a conference on supporting Bangladesh power sector on
18th and 19th February 2012).
CPGC is supposed to become a core entity to implement the coal-fired power
generation project. And according to the previous study, a loan with lower interest rate
than the Government loan (3%) is provided to power generation project, hence the Survey
team assumes that the same loan scheme will applied to the this coal-fired power generation
project.
The required capital funds will be provided to CPGC, the executing entity of the project, via
Bangladesh Government.
10.2 Taxation, Duties and Tax Privileges
10.2.1 Taxation and duties in Bangladesh
According to the Website of JETRO Bangladesh, the taxation system in Bangladesh can be outlined as follows:
1) Custom Duty The rate of general custom duty is 0%, 3%, 5%, 12%, or 25%.
The rate of value-added tax (VAT) is fixed at 15% and there are exceptional products
that are free from the VAT.
The following is an example of formulating taxation and duties for imported products.
Table 10-1 Procedures for Import Tax in Bangladesh (as Example) Items Variables Procedures Values
Products (C&F price) A A 100.0Insurance (C&F price * 1%) B A × 0.01 1.0Base price for Tax C A + B 101.0General custom (C *25%) D C × 0.25 25.3VAT((C+D) *15%) E (C + D)× 0.15 18.9Landed price(Total) C + D + E 145.2
Source: The Survey team
Open-stock companies: 27.5%, Non open-stock companies: 37.5%
Another corporate tax rate is applied to the following industrial sectors: cell phone
carrier 45%, bank & insurance 42.5%, spinning & textile 15.0%, and jute fiber:15.0%
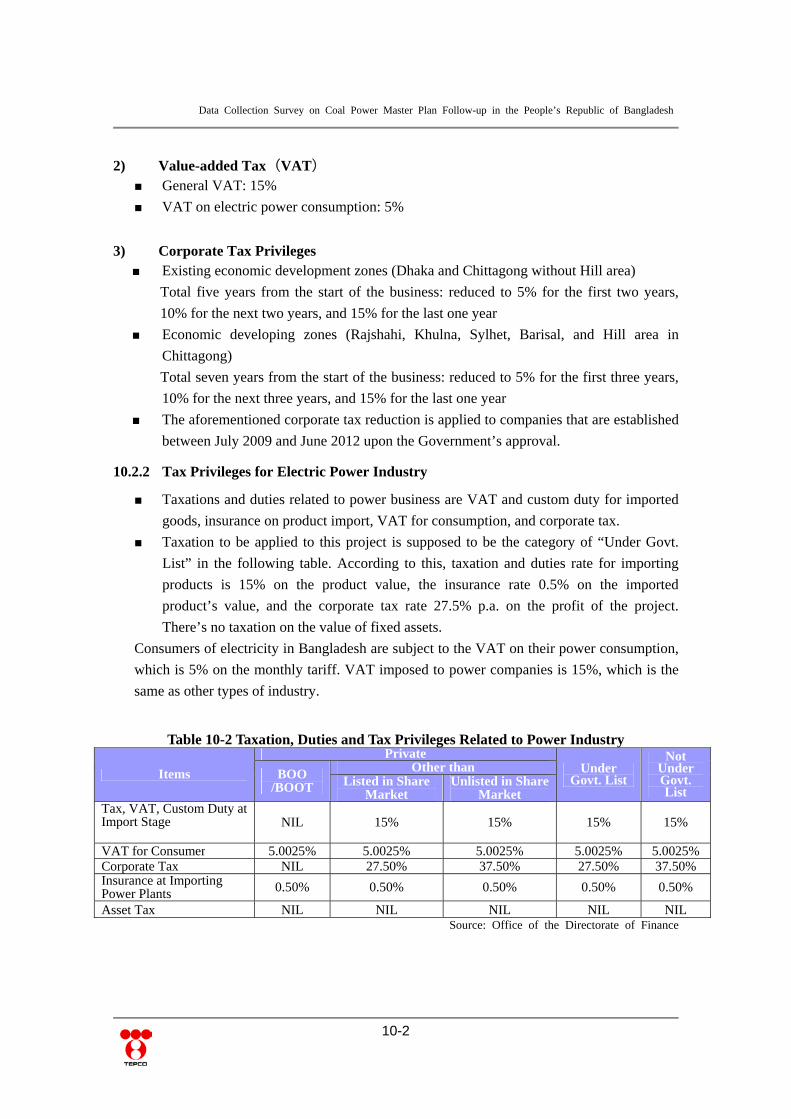
Data Collection Survey on Coal Power Master Plan Follow-up in the People’s Republic of Bangladesh
10-2
2) Value-added Tax(VAT) General VAT: 15%
VAT on electric power consumption: 5%
3) Corporate Tax Privileges Existing economic development zones (Dhaka and Chittagong without Hill area)
Total five years from the start of the business: reduced to 5% for the first two years,
10% for the next two years, and 15% for the last one year
Economic developing zones (Rajshahi, Khulna, Sylhet, Barisal, and Hill area in
Chittagong)
Total seven years from the start of the business: reduced to 5% for the first three years,
10% for the next three years, and 15% for the last one year
The aforementioned corporate tax reduction is applied to companies that are established
between July 2009 and June 2012 upon the Government’s approval.
10.2.2 Tax Privileges for Electric Power Industry
Taxations and duties related to power business are VAT and custom duty for imported
goods, insurance on product import, VAT for consumption, and corporate tax.
Taxation to be applied to this project is supposed to be the category of “Under Govt.
List” in the following table. According to this, taxation and duties rate for importing
products is 15% on the product value, the insurance rate 0.5% on the imported
product’s value, and the corporate tax rate 27.5% p.a. on the profit of the project.
There’s no taxation on the value of fixed assets.
Consumers of electricity in Bangladesh are subject to the VAT on their power consumption,
which is 5% on the monthly tariff. VAT imposed to power companies is 15%, which is the
same as other types of industry.
Table 10-2 Taxation, Duties and Tax Privileges Related to Power Industry
Items
PrivateUnder
Govt. List
Not Under Govt. List
BOO /BOOT
Other thanListed in Share
MarketUnlisted in Share
MarketTax, VAT, Custom Duty at Import Stage NIL 15% 15% 15% 15%
VAT for Consumer 5.0025% 5.0025% 5.0025% 5.0025% 5.0025%Corporate Tax NIL 27.50% 37.50% 27.50% 37.50%Insurance at Importing Power Plants 0.50% 0.50% 0.50% 0.50% 0.50%
Asset Tax NIL NIL NIL NIL NIL Source: Office of the Directorate of Finance
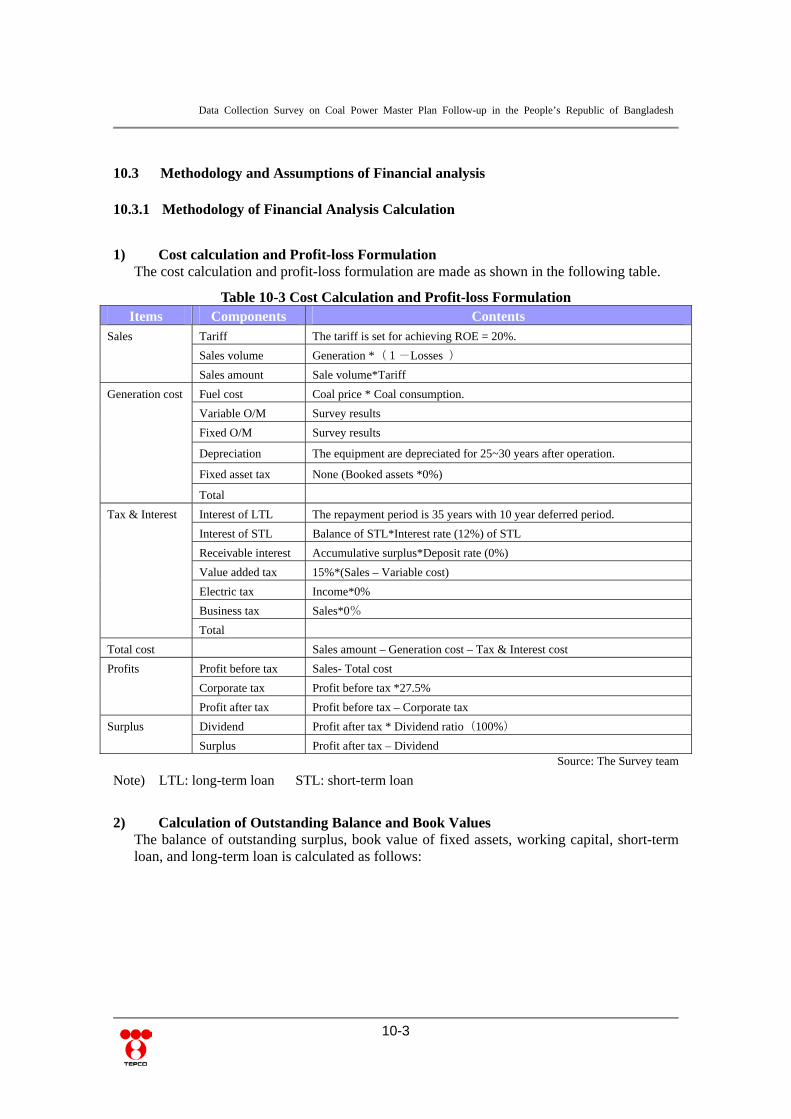
Data Collection Survey on Coal Power Master Plan Follow-up in the People’s Republic of Bangladesh
10-3
10.3 Methodology and Assumptions of Financial analysis
10.3.1 Methodology of Financial Analysis Calculation
1) Cost calculation and Profit-loss Formulation The cost calculation and profit-loss formulation are made as shown in the following table.
Table 10-3 Cost Calculation and Profit-loss Formulation Items Components Contents
Sales Tariff The tariff is set for achieving ROE = 20%.
Sales volume Generation *(1-Losses )
Sales amount Sale volume*Tariff
Generation cost Fuel cost Coal price * Coal consumption.
Variable O/M Survey results
Fixed O/M Survey results
Depreciation The equipment are depreciated for 25~30 years after operation.
Fixed asset tax None (Booked assets *0%)
Total
Tax & Interest Interest of LTL The repayment period is 35 years with 10 year deferred period.
Interest of STL Balance of STL*Interest rate (12%) of STL
Receivable interest Accumulative surplus*Deposit rate (0%)
Value added tax 15%*(Sales – Variable cost)
Electric tax Income*0%
Business tax Sales*0%
Total
Total cost Sales amount – Generation cost – Tax & Interest cost
Profits Profit before tax Sales- Total cost
Corporate tax Profit before tax *27.5%
Profit after tax Profit before tax – Corporate tax
Surplus Dividend Profit after tax * Dividend ratio(100%)
Surplus Profit after tax – Dividend Source: The Survey team
Note) LTL: long-term loan STL: short-term loan
2) Calculation of Outstanding Balance and Book Values The balance of outstanding surplus, book value of fixed assets, working capital, short-term loan, and long-term loan is calculated as follows:

Data Collection Survey on Coal Power Master Plan Follow-up in the People’s Republic of Bangladesh
10-4
Table 10-4 Calculation of Outstanding Balance and Book Values
Source: The Survey team
3) Cash Flow (C/F) after Commencement of Operation The main components of cash-ins and -outs after commencement of operation are as follows.
Table 10-5 Components of Cash Sources and Use
Source: The Survey team
4) Performance Indicators for Financial Analysis Main performance indicators for financial analysis are return on equity (ROE), per-unit cost & revenue, financial internal rate of return (FIRR), pay-back period (PBP), benefit-and-cost ratio (B&C ratio) and loan life coverage ratio (LLCR) are used. The evaluation criteria of these performance indicators are as follows:
Table 10-6 Evaluation Criteria of Performance Indicators for Financial Analysis
Source: The Survey team
5) Calculation Methodology of Performance Indicators If the evaluation of a project is biased depending on the source of capital fund raising, the evaluation may be affected by the way of fund raising. Essentially, the evaluation of project profitability should be made apart from the source of capital procurement. To serve for this, performance indicators such as financial internal rate of return (FIRR), benefit-and-cost Ratio (B&C ratio), and net present value (NPV) are devised and used widely now.
Items Calculation methods Outstanding surplus Outstanding surplus is reserved as cash and is used for interest revenue. Book value of fixed assets
Book value of fixed assets is subject to depreciation, and is usually referred to as the basis for taxation on fixed assets value.
Working capital Working capital is the necessary cash for daily operation and is usually funded
by the short-term loans from commercial banks. Based on this concept, the
interest payment on short-term loan is estimated.
Short-term loan Short-term loan is the source of working capital. If there’s a surplus, it should
be used for repayment of short-term loan.
Long-term loan It is used for calculating interest on long-term loan.
Cash-ins Cash-outs Cash balance Profit before tax Depreciation Working capital decrease
Corporate tax Dividend Repayment of long-term loan Working capital increase
Short-term loan (in case of cash shortage) Bank deposit (in case of cash surplus)
Evaluation indicators Evaluation criteria ROE 20% Unit cost & revenue Unit cost < Power tariff FIRR More than double of WACC (Weighted-average of the cost of capital) PBP No longer than repayment term of long term loan B&C ratio More than 1.0 LLCR LLCR > 1.5

Data Collection Survey on Coal Power Master Plan Follow-up in the People’s Republic of Bangladesh
10-5
Table 10-7 Benefits & Costs Ratio and Net Benefit Value
Source: The Survey team Internal Rate of Return
Cost / Benefit Ratio
Net Present Value
Pay-back Period
Length of period (years) when the accumulative cash return covers the initial investment.
Loan Life Coverage Ratio (LLCR)
LLCR= Present value of CF before repayment of principal and interest / Loan principal
10.3.2 Fund Raising and Interest rate
1) Fund Raising
There are two kinds of fund sources for the project, i.e. equity capital provided by the
Government long-term loan from JICA.
There are three types of loan scheme provided by JICA, namely “General scheme,”
“Preferential scheme,” and “Climate change scheme”. For Bangladesh, JICA provides
preferential scheme with the following loan conditions, interest rate 0.01% per year,
maximum repayment period 40 years, and grace period 10 years. This is an “Untied”
loan.
Items Expressions
Benefit (Bt) Sales amount each years
Cost (Ct) Investment + Working capital + Fuel cost + O&M expenses + Wages
+ Fixed asset tax + Corporate tax
Net benefit value Benefit (Bt) - Cost (Ct)
Data Collection Survey on Coal Power Master Plan Follow-up in the People’s Republic of Bangladesh
10-6
Sometimes the loans from international development agencies impose conditions that
need to be cleared by the borrower, and in the case of power sector loan, promotion of
sector reforms to enhance development, safety, and reliability may be required along
with other general conditions for financing. A sample of loan conditions is presented in
“Appendix 1” at the end of this Chapter.
2) Sublending Loan When the Government sublends the loan to the project’s executing agency, the interest
on the loan sublet may be accrued. Loan sublending can be made either in foreign
currency or domestic currency.
In Bangladesh, the interest rate of sublending loan is usually set depending on the
project profitability, and in general it is decided thorough the negotiation between the
donor agency and the Government.
According to the “Lending and Relending of Local Currency Loans 2004” provided by
MOF, the interest rate in foreign currency for NWPGCL, EGCB and PGCB is 4% and
the interest rate in domestic currency 3%. However, in the loan sublending for Haripur
project of EGCB, the interest rate in foreign currency (from JICA) was set at 2% and
the interest rate in domestic currency (from the Government) at 1.5%.
In this project, considering the low power tariff in Bangladesh, interest rate for fund
raising needs to be low for sustaining the project. Therefore, the Survey team considers
that the sublending loan interest rate from GOB should be as low as around 2%.
An officer at the Finance Division of the Ministry of Finance told the Survey team
during the meeting on 8th February that the sublending loan interest rate to the power
sector is basically 4% per year in Bangladesh in the financial analysis in pre-feasibility
study, the Finance Division officer expressed agreeing on lowering the sublending loan
interest rate to 1.99% per year, but it needs to be discussed again in the stage of
feasibility study.
3) Discount Rate Discount rate is a measure to convert the nominal value of cash generated in the future into the value at present. The discount rate becomes higher in proportion with project risk and the general interest rate of the country. Generally loan and bank deposit interest rates of the country are referred to in setting discount rate. Discount rate for this analysis is set at 12% considering the loan and deposit interest rates in Bangladesh show in the following table.

Data Collection Survey on Coal Power Master Plan Follow-up in the People’s Republic of Bangladesh
10-7
Table 10-8 Benefits & Costs Ratio and Net Benefit Value
2005 2006 2007 2008 2009 2010 Average
Discount rate 5.00 5.00 5.00 5.00 5.00 5.00 5.00
Deposit rate 8.09 9.11 9.18 9.65 8.21 7.14 8.56
Lending rate 14.00 15.33 16.00 16.38 14.60 13.00 14.89
Inflation rate 5.04 5.20 6.74 8.82 6.56 6.45 6.47
Effective deposit rate 4.05 3.91 2.44 0.83 1.65 0.69 2.26
Effective lending rate 8.96 10.13 9.26 7.56 8.04 6.77 8.45 Source: International Financial Statistics, IMF
Note: Effective deposit Effective lending rate is calculated by Nominal interest rate – inflation rate.
Table 10-9 Calculation Methods for Discount Rates
Note: Twice of the interest rates may be appropriate for hedging risk for each indicator. Source: The Survey team
10.3.3 Parameters for Financial Analysis
1) Parameters of Economic Indicators and International Energy Prices Parameters of economic indicators for financial analysis are GDP growth rate, inflation rate, and coal price. The following table shows the methodology for setting the parameters from 2011 to 2050.
Table 10-10 Economic Preconditions
Items Methods of Setting the Preconditions Values
GDP growth rate The average GDP growth rate was 6.2% from 2004 to 2009. IMF predicts the growth rates with 6% from 2011 to 2012 and the average 7% after 2013. Therefore, it is 6% up to 2015 under the conditions of recent world monetary crisis. After the year 2030, the GDP growth rates are gradually decreased.
2011-15 6.0% 2015-20 7.0% 2020-30 7.0% 2030-40 6.0% 2040-50 5.0%
Inflation rate The past average inflation rate in Bangladesh from 2005 to 2010 was 6.7%. The inflation range of Bangladesh has been moved from 6% to 8% in the past. The same inflation rate can be assumed in future.
2011-15 6.0% 2015-20 6.5% 2020-30 6.5% 2030-40 6.0% 2040-50 6.0%
Source: The Survey team
Calculation methods Values
International Development Bank Rate + Risk factor (x 0.5)
Commercial bank interest rate + Risk factor (x 0.5)
Overseas Development Administration announcement
10.50% (7.0%+3.50%)
12.67% (8.45%+4.22%)
10.0%
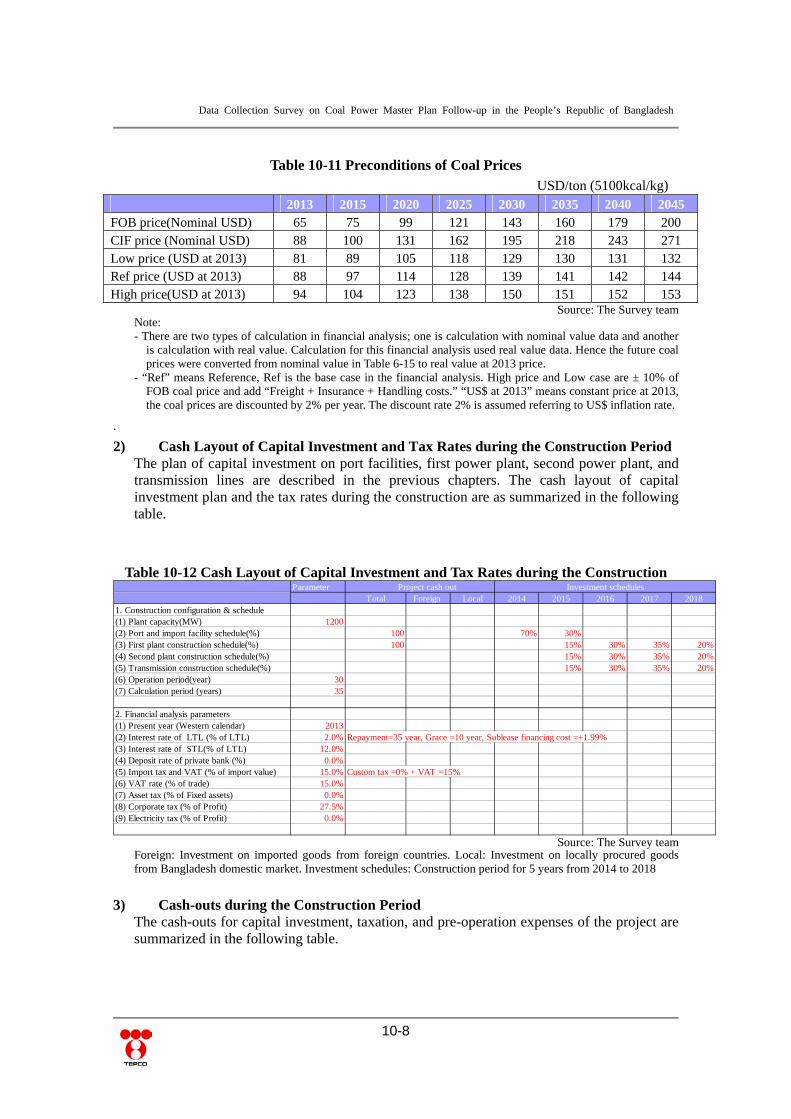
Data Collection Survey on Coal Power Master Plan Follow-up in the People’s Republic of Bangladesh
10-8
Table 10-11 Preconditions of Coal Prices USD/ton (5100kcal/kg)
2013 2015 2020 2025 2030 2035 2040 2045 FOB price(Nominal USD) 65 75 99 121 143 160 179 200 CIF price (Nominal USD) 88 100 131 162 195 218 243 271 Low price (USD at 2013) 81 89 105 118 129 130 131 132 Ref price (USD at 2013) 88 97 114 128 139 141 142 144 High price(USD at 2013) 94 104 123 138 150 151 152 153
Source: The Survey team Note: - There are two types of calculation in financial analysis; one is calculation with nominal value data and another
is calculation with real value. Calculation for this financial analysis used real value data. Hence the future coal prices were converted from nominal value in Table 6-15 to real value at 2013 price.
- “Ref” means Reference, Ref is the base case in the financial analysis. High price and Low case are ± 10% of FOB coal price and add “Freight + Insurance + Handling costs.” “US$ at 2013” means constant price at 2013, the coal prices are discounted by 2% per year. The discount rate 2% is assumed referring to US$ inflation rate.
.
2) Cash Layout of Capital Investment and Tax Rates during the Construction Period The plan of capital investment on port facilities, first power plant, second power plant, and transmission lines are described in the previous chapters. The cash layout of capital investment plan and the tax rates during the construction are as summarized in the following table.
Table 10-12 Cash Layout of Capital Investment and Tax Rates during the Construction Parameter Project cash out
Total Foreign Local 2014 2015 2016 2017 20181. Construction configuration & schedule(1) Plant capacity(MW) 1200(2) Port and import facility schedule(%) 100 70% 30%(3) First plant construction schedule(%) 100 15% 30% 35% 20%(4) Second plant construction schedule(%) 15% 30% 35% 20%(5) Transmission construction schedule(%) 15% 30% 35% 20%(6) Operation period(year) 30(7) Calculation period (years) 35
2. Financial analysis parameters (1) Present year (Western calendar) 2013(2) Interest rate of LTL (% of LTL) 2.0% Repayment=35 year, Grace =10 year, Sublease financing cost =+1.99% (3) Interest rate of STL(% of LTL) 12.0%(4) Deposit rate of private bank (%) 0.0%(5) Import tax and VAT (% of import value) 15.0% Custom tax =0% + VAT =15%(6) VAT rate (% of trade) 15.0%(7) Asset tax (% of Fixed assets) 0.0%(8) Corporate tax (% of Profit) 27.5%(9) Electricity tax (% of Profit) 0.0%
Investment schedules
Source: The Survey team
Foreign: Investment on imported goods from foreign countries. Local: Investment on locally procured goods from Bangladesh domestic market. Investment schedules: Construction period for 5 years from 2014 to 2018
3) Cash-outs during the Construction Period The cash-outs for capital investment, taxation, and pre-operation expenses of the project are summarized in the following table.

Data Collection Survey on Coal Power Master Plan Follow-up in the People’s Republic of Bangladesh
10-9
Table 10-13 Cash out during Construction Period Parameter Project cash out
Total Foreign Local 2014 2015 2016 2017 20181. Construction costs (1000USD) 2,373,000 2,164,400 208,600 378,000 436,950 549,900 641,550 366,600(1) Port and import facility schedule(%) 540,000 378,000 162,000 378,000 162,000 0 0 0(2) First plant construction schedule(%) 850,000 850,000 0 0 127,500 255,000 297,500 170,000(3) Second plant construction schedule(%) 750,000 750,000 0 0 112,500 225,000 262,500 150,000(4) Transmission construction schedule(%) 233,000 186,400 46,600 0 34,950 69,900 81,550 46,600
2. Insurance (1000USD) 10,822 10,822 1,323 1,907 2,680 3,126 1,786(1) Port and import facility schedule(%) 0.5% 1,890 1,890 1,323 567 0 0 0(2) First plant construction schedule(%) 0.5% 4,250 4,250 0 638 1,275 1,488 850(3) Second plant construction schedule(%) 0.5% 3,750 3,750 0 563 1,125 1,313 750(4) Transmission construction schedule(%) 0.5% 932 932 0 140 280 326 186
3. Consulting service (1000USD) 118,650 118,650 18,900 21,848 27,495 32,078 18,330(1) Port and import facility schedule(%) 5% 27,000 27,000 18,900 8,100 0 0 0(2) First plant construction schedule(%) 5% 42,500 42,500 0 6,375 12,750 14,875 8,500(3) Second plant construction schedule(%) 5% 37,500 37,500 0 5,625 11,250 13,125 7,500(4) Transmission construction schedule(%) 5% 11,650 11,650 0 1,748 3,495 4,078 2,330
4. Custom & Taxes (1000USD) 324,660 324,660 39,690 57,204 80,388 93,786 53,592(1) Port and import facility schedule(%) 15.0% 56,700 56,700 39,690 17,010 0 0 0(2) First plant construction schedule(%) 15.0% 127,500 127,500 0 19,125 38,250 44,625 25,500(3) Second plant construction schedule(%) 15.0% 112,500 112,500 0 16,875 33,750 39,375 22,500(4) Transmission construction schedule(%) 15.0% 27,960 27,960 0 4,194 8,388 9,786 5,592
5. VAT (1000USD) 31,290 31,290 17,010 8,339 2,097 2,447 1,398(1) Port (% of D-trade) 15.0% 24,300 24,300 17,010 7,290 0 0 0(2) First plant (% of D-trade) 15.0% 0 0 0 0 0 0 0(3) Second plant (% of D-trade) 15.0% 0 0 0 0 0 0 0(4) Transmission (% of D-trade) 15.0% 6,990 6,990 0 1,049 2,097 2,447 1,398
6. Total (1+2+3+4+5) (1000USD) 2,858,422 2,175,222 683,200 454,923 526,247 662,560 772,986 441,706(1) Port and import facility schedule(%) 649,890 379,890 270,000 454,923 194,967 0 0 0(2) First plant construction schedule(%) 1,024,250 854,250 170,000 0 153,638 307,275 358,488 204,850(3) Second plant construction schedule(%) 903,750 753,750 150,000 0 135,563 271,125 316,313 180,750(4) Transmission construction schedule(%) 280,532 187,332 93,200 0 42,080 84,160 98,186 56,106
5. Preoperation interest (1000USD) 130,785 130,785 4,549 14,361 26,249 40,604 45,022(1) Preoperation interest 1st LTL 2.0% 40,943 40,943 4,549 9,098 9,098 9,098 9,098(2) Preoperation interest 2nd LTL 2.0% 36,837 36,837 5,262 10,525 10,525 10,525(3) Preoperation interest 3rd LTL 2.0% 33,128 33,128 6,626 13,251 13,251(4) Preoperation interest 4th LTL 2.0% 15,460 15,460 7,730 7,730(5) Preoperation interest 5th LTL 2.0% 4,417 4,417 4,417
6. Preoperation expense (1000USD) 26,798 0 26,798 26,798 0 0 0 0(1) Front end fee (% of Loan) 1.0% 21,438 0 21,438 21,438(2) Commitment fee (% of Loan) 0.25% 5,360 0 5,360 5,360
7. Total investment (1000USD) 3,016,005 2,306,007 709,998 486,270 540,608 688,809 813,591 486,728100% 76% 24%
Investment schedules
Source: Financial Analysis calculation sheet of the Survey team
4) Equity-financing for Capital Investment Though the concept of capital composition may not be identical between project finance and corporate finance, the ratio of equity to total capital observed in the balance sheet, DESCO and NWPGCL, which is around 20% at present, can be referred to as benchmark in considering project financing for power sector in Bangladesh. The general practice of capital composition in project finance is” 30% equity and 70% loan”, and expected capital composition for NTPC and BPDB’s Khulna projects is also 30%:70%. For this project, the expected ratio of Government funds and JICA loans in capital fund raising is 25%:75%, thus the Survey team adopts “25%” as the ratio of equity to total capital for this financial analysis. The ratio of 25%:75% was formulated in accordance with the expected expenditure necessary for procuring goods and services in local market and that for procuring imported products, considering the capital expenditure plan, taxation, and

Data Collection Survey on Coal Power Master Plan Follow-up in the People’s Republic of Bangladesh
10-10
pre-operation expenses as explained before. The necessary equity funds and loans are shown in the following table. However, it also has to be noted that all the funding from GOB doesn’t need to be equities, but they can be Government loans
Table 10-14 Investment and Equity Ratio Parameter Project cash out
Total Foreign Local 2014 2015 2016 2017 2018Capital funds (1000USD) 3,016,005 486,270 540,608 688,809 813,591 486,728Equity ( % of total investment) 25% 754,001 754,001 121,567 135,152 172,202 203,398 121,682Loan ( % of total investment) 75% 2,262,004 2,262,004 364,702 405,456 516,606 610,193 365,046
Investment schedules
Source: The Survey team
5) Operational Conditions of the Power Plants Operational conditions of the power plants in the project and the expected operational costs are shown in the following table.
Table 10-15 Operational Conditions of the Power Plants Items Values and conditions
Construction period Five years from 2014 to 2018 Operation years 30 years from 2019 to 2048 Capacity 600MW × 2 sets Coal price 5,100kcal/kg、three kinds of FOB price (81USD/t、88USD/t、94USD/t)USC heat efficiency 44.5% to input heat Variable O/M cost 3USD/MWh Fixed O/M cost 53USD/kW Operation load 75% to the capacity Transmission loss 3% from the power station to the neighboring transmission line
Source: The Survey team
6) Tariff Calculation The financial analysis of the project uses ROE, not FIRR, as the performance indicator
for financial evaluation of this project, because the long-term loan with low interest rate
is provided to this project. ROE shows profitability on equity fund, not profitability on
the total capital investment. The tariff is calculated in the financial model so that it
satisfies ROE 20%.
Normally the hurdle rate of FIRR is set around at 15% when the interest rate of the loan
is 7%, which then yields ROE 20%. If the target FIRR is set at constant level, ROE
becomes higher with lowered interest rate. This project assumes 2% interest rate on
long-term loans, and sets the target ROE at 20%. Based on this, the FIRR of this project
is expected to come between 4% and 10%, which is around twice of the interest rate.
10.4 Results of the Financial Analysis
10.4.1 Generation Unit Cost and Tariff
The expected unit cost and tariff, based on the conditions that coal price as of 2013 be
88 USD/ton (5,100kcal/kg)and target ROE be 20%, are shown in the following figure

Data Collection Survey on Coal Power Master Plan Follow-up in the People’s Republic of Bangladesh
10-11
Initial Tariff Ave Tariff Average cost
5100kcal/kg Cent/kWh Cent/kWh Cent/kWh
Coal : $81/t ($58/t, $23/t) 9.9 10.1 7.6
Coal : $88/t ($65/t, $23/t) 10.2 10.5 8.0
Coal : $94/t ($71/t, $23/t) 10.5 10.9 8.4
The average tariff is 10.5 cent/kWh (8.4 Taka/kWh) and the average unit cost is 8.0
cent/kWh (6.4 Taka/kWh) between 2019 and 2048.
The main factors that affect the fluctuation of power tariff and unit cost from 2019 to
2048 are as follows;
The dip in the trend of tariff and the unit cost after 2024 is due to the expired
amortization of pre-operation expenses.
The gradually increasing trend of the tariff and unit cost from 2032 is due to the
increase of coal prices.
The gradually decreasing trend of tariff and unit cost from 2033 to 2044 is due
to the decrease of the interest payments.
The drop of tariff and unit cost from 2044 is due to the expired depreciation of
power generation facilities.
Source: The Survey team
Figure 10-1 Generation Unit Cost and Tariff
The coal price used in the financial analysis is CIF 88 USD/ton with 5,100kcal/kg at
2013 price. Trial of sensitive analysis assuming the coal price ranging from CIF 94
USD/ton (plus 10% on FOB price) to CIF 81 USD/ton (minus 10% on FOB price). The
results are shown in the following figure.
If the coal price fluctuates within the range of ±10%, the tariff is affected within the
range of ±0.4 cent/kWh. The unit cost of generation also changes within the range of
±0.4 cent/kWh.
Table 10-16 Sensitive Analysis on Coal Price Fluctuation
Source: The Survey team
Note: Coal price: CIF price (Coal price + Freight + Handling costs), Initial tariff: power tariff at the start of operation, Average Tariff: average power tariff during the calculation period, Average cost: average unit cost during the calculation period

Data Collection Survey on Coal Power Master Plan Follow-up in the People’s Republic of Bangladesh
10-12
10.4.2 ROE and FIRR
Regardless of the difference in CIF coal price among Ref scenario (88USD/ton), high
price scenario (94 USD/ton) and low price scenario (81 USD/ton), the all cases
achieves FIRRs 7.0% under the condition of ROE 20%.
WACC (Weighted Average Capital Cost), which is the weighted average of
equity-funding cost and loan-funding cost, is 2.25% in the financial analysis of the
project. This project is proven to be feasible, if the FIRR becomes more than twice of
WACC, that is “around 5% or more”. The expected FIRR of this project is 7.0% as
shown in the following table, which proves the feasibility of this project.
Table 10-17 ROE and FIRR by Coal Price Ave Tariff Average cost ROE FIRR
5100kcal/kg Cent/kWh Cent/kWh % %
Coal : $81/t ($58/t, $23/t) 10.1 7.6 20.0% 7.0%
Coal : $88/t ($65/t, $23/t) 10.5 8.0 20.0% 7.0%
Coal : $94/t ($71/t, $23/t) 10.9 8.4 20.0% 7.0%
Source: The Survey team
10.4.3 Testing the Possibility of Cash Shortage
The following table is the cash flow for the ten years from the start of operation, which shows there is no concern of cash shortage during this period.
Table 10-18 Cash Flow for the 10 Years after the Start of Operation 2019 2020 2021 2022 2023 2024 2025 2026 2027 2028 2029
7 8 9 10 11 12 13 14 15 16 17Working capital Additional W/C ( 1 month of Rec & Pay) 66054 -414 1040 997 950 908 -2737 637 600 568 539
Accumulative W/C 66054 65640 66680 67677 68627 69535 66797 67434 68034 68603 69142Cash In Equity 0 0 0 0 0 0 0 0 0 0 0
Long Term Loan 0 0 0 0 0 0 0 0 0 0 0Depreciation 103680 103680 103680 103680 103680 103680 103680 103680 103680 103680 103680Amortization 32078 32078 32078 32078 32078 0 0 0 0 0 0Surplus 0 0 0 0 0 0 0 0 0 0 0Cash in total 135759 135759 135759 135759 135759 103680 103680 103680 103680 103680 103680
Cash out Investment 0 0 0 0 0 0 0 0 0 0 0LTL repayment 0 0 0 0 0 91467 91467 91467 91467 91467 91467Additional W/C 66054 -414 1040 997 950 908 -2737 637 600 568 539Cash out total 66054 -414 1040 997 950 92375 88730 92104 92067 92036 92006
Net cash flow Cash balance 69705 136172 134719 134762 134809 11305 14951 11576 11613 11645 11674Accumulative 69705 205877 340596 475357 610166 621471 636422 647998 659611 671256 682929
Cash balance Short term loan 0 0 0 0 0 0 0 0 0 0 0 Deposit 3651 140237 273916 407680 541540 551936 569624 580564 591577 602653 613787
Source: The Survey team
10.4.4 Dividend Yield
The rate of dividend yield (= Dividends / Equity) is expected to be 10.3% for the targeted period. Considering that the cost of equity that is sourced from Bangladesh Government is 3% per year, the company will secure profitability to meet this requirement.
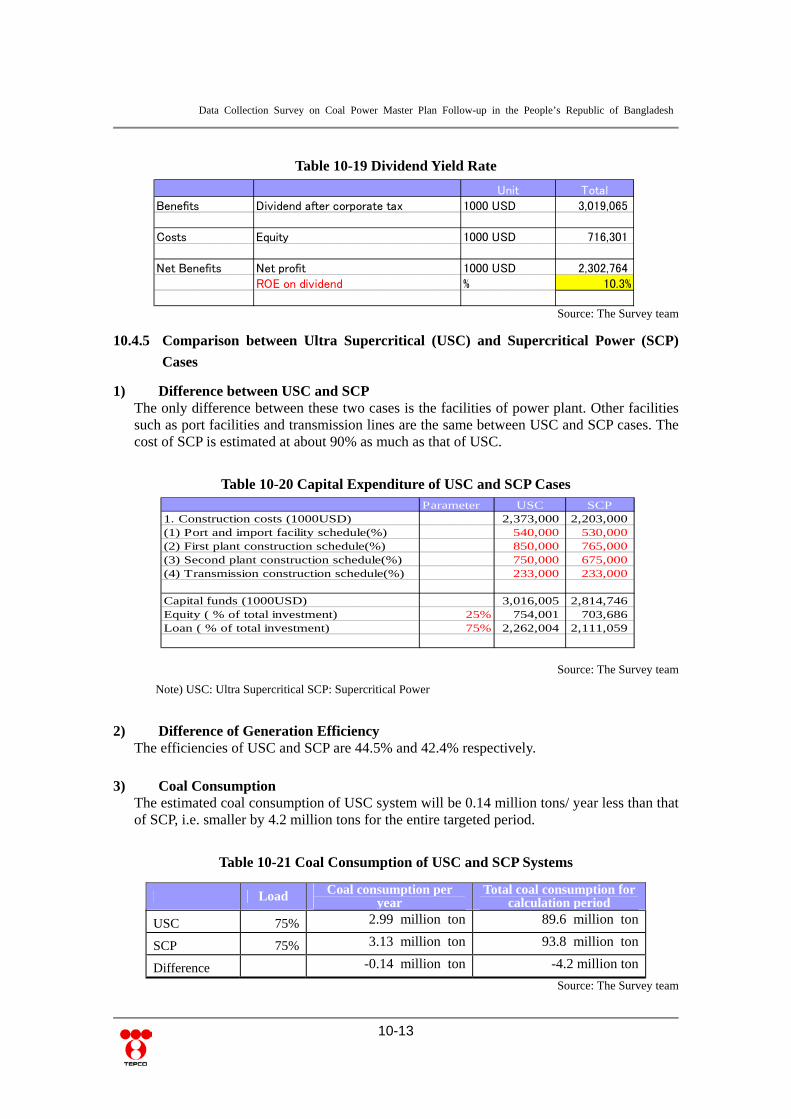
Data Collection Survey on Coal Power Master Plan Follow-up in the People’s Republic of Bangladesh
10-13
Unit TotalBenefits Dividend after corporate tax 1000 USD 3,019,065
Costs Equity 1000 USD 716,301
Net Benefits Net profit 1000 USD 2,302,764ROE on dividend % 10.3%
Parameter USC SCP1. Construction costs (1000USD) 2,373,000 2,203,000(1) Port and import facility schedule(%) 540,000 530,000(2) First plant construction schedule(%) 850,000 765,000(3) Second plant construction schedule(%) 750,000 675,000(4) Transmission construction schedule(%) 233,000 233,000
Capital funds (1000USD) 3,016,005 2,814,746Equity ( % of total investment) 25% 754,001 703,686Loan ( % of total investment) 75% 2,262,004 2,111,059
Table 10-19 Dividend Yield Rate
Source: The Survey team
10.4.5 Comparison between Ultra Supercritical (USC) and Supercritical Power (SCP)
Cases
1) Difference between USC and SCP The only difference between these two cases is the facilities of power plant. Other facilities such as port facilities and transmission lines are the same between USC and SCP cases. The cost of SCP is estimated at about 90% as much as that of USC.
Table 10-20 Capital Expenditure of USC and SCP Cases
Source: The Survey team
Note) USC: Ultra Supercritical SCP: Supercritical Power
2) Difference of Generation Efficiency The efficiencies of USC and SCP are 44.5% and 42.4% respectively.
3) Coal Consumption The estimated coal consumption of USC system will be 0.14 million tons/ year less than that of SCP, i.e. smaller by 4.2 million tons for the entire targeted period.
Table 10-21 Coal Consumption of USC and SCP Systems
Source: The Survey team
Load Coal consumption per year
Total coal consumption for calculation period
USC 75% 2.99 million ton 89.6 million ton
SCP 75% 3.13 million ton 93.8 million ton
Difference -0.14 million ton -4.2 million ton

Data Collection Survey on Coal Power Master Plan Follow-up in the People’s Republic of Bangladesh
10-14
4) Difference in Capital Expenditure and Coal Consumption Costs The difference in capital expenditure on power plant and that in coal consumption costs between USC and SCP are shown in the following table. The difference in total costs between these two systems may not be very big.
Table 10-22 Cost Difference of Power Generation Plant and Coal Consumption
Million USD
Discount rate
Power plant capital expenditure
Coal consumption costs (for 30 years )
Total difference
USC 12% 1,600 1,733 3,333
SCP 12% 1,440 1,815 3,255
Difference +160 -82 -78
Source: The Survey team
5) Impact on Power Tariff and Unit Cost The unit cost of power generation using USC system is smaller than that of SCP system and this difference becomes large in “High price scenario”. The calculation of tariff shows the same characteristics, though the difference is small compared to that of unit costs.
Table 10-23 Difference of Tariff and Unit Cost
Cent/kWh
Coal price Low price scenario Ref scenario High price scenario
Unit cost of USC 7.7 8.1 8.4
Unit cost of SCP 7.8 8.2 8.6
Tariff of USC 10.2 10.6 11.0
Tariff of SCP 10.2 10.7 11.1
Source: The Survey team Note) Coal price as of 2013 is 81 USD/ton in Low price scenario,
88 USD/ton in Ref scenario, and 94 USD/ton in High price scenario.
For reference, the actual wholesale power tariffs and average power generation costs in Bangladesh in the recent years are shown as follows. BERC explains that BPDB will be able to set the wholesale power tariff in the future as the weighted average of all procured power costs, taking into account that power generation costs using imported fuels are apt to be higher than that using domestic fuels.
Table 10-24 Wholesale Tariffs and Average Power Generation Costs 1st May 2007 1st Oct 2008 1st Feb 2011 1st Aug 2011
Wholesale tariffs 2.84 2.37 2.63 2.80 Average power generation costs
2.77 2.5-3.5
Source: Wholesale tariffs by BERC Average power generation costs: project report of “Bheramara Gas Turbine Power Generation Design and Construction Development Plan in Bangladesh” for 2007-2008 data. The 2011 data is the average power unit cost of the state-owned power generation companies in 2011 referring to the newspaper article from “The daily Star” on 29th February 2012.
Data Collection Survey on Coal Power Master Plan Follow-up in the People’s Republic of Bangladesh
10-15
Chapter Appendix 1: Examples for Loan Conditions in Bangladesh 1.Regarding Loan Conditioning Generally, loan conditions are agreed and signed between MOF and international donor agencies. These loan conditions are notified to executing agencies of the project along with additional conditions imposed the Government. Project executing agencies such as BPDB have no right of intervening in the negotiation on loan conditions with the donor agency. Therefore donor agencies are apt to impose loan conditions to be cleared by the Government rather than by the project executing agencies. The loan conditions of the projects are to be discussed between JICA and MOF. Hence PD, BPDB, and CPGC do not have a right to become acquainted with loan conditions in advance. 2. Example of Loan Conditions: “Power System Efficiency Improvement Project” Agreed between Bangladesh Government and ADB In the report, there are descriptions that the companies that received the loan from ADB (APSCL and BPDB in this case) must comply with the following obligations: The Borrower and each Project Executing Agency shall comply with ADB’s
Anticorruption Policy Obligation to comply with the necessary modifications in the middle of construction by
ADB Obligation on external audit acceptance Obligation on setting goals and reporting to ADB Obligation on securing of human resources and capacity development Obligation to resolve resettlement issues Confirm that there are no negative impacts on residents Periodic reporting requirements for each half of the year Reporting obligation on unexpected environmental problems in the construction,
operational issues, and public issues Obligation on cooperation to investigation of independent experts Obligation on cooperation to project monitoring and reporting that are implemented by
independent experts The Borrower shall ensure that the loan is not used for any activities included in the
prohibited investments. Obligation on implementing gender action plan (employing female staff in construction) Obligation on complying with all applicable labor laws
3.Example of Loan Conditions: ADB’s “Proposed Sector Development Program Loan in Bangladesh” The GOB (and NWPGCL as the executing body of the project) that receives the loan from ADB is obliged to fulfill the following conditions.
NWPGCL is registered with the Registrar of the Joint Stock Companies in Bangladesh. All the authorities on the management, operations, and financing of BPDB’s Sirajganj
Peaking Power Station and Khulna Peaking Power Station are transferred to NWPGCL. Sublending loan agreements must be executed between the Government and each of the
companies split from BPDB, i.e. NWPGC, DESCO, DPDC, and PGCB (indicating that the execution of the agreements has to be done directly between the government and the companies, not via BPDB).
Data Collection Survey on Coal Power Master Plan Follow-up in the People’s Republic of Bangladesh
10-16
4.Example of Loan Conditions: “Siddhirganj Peaking Power Project” Agreed between International Development Association and EGCB The outline of the agreement between IDA and EGCB to promote the project is as follows: EGCB shall establish the project management structure to carry out the project until
completion. EGCB shall maintain its accounts receivables not exceeding the equivalent of three
months’ costs of energy procurement. EGCB shall form a coordinating committee with PGCB and GTCL (Gas Transportation
Company Limited) . EGCB shall entrust to a contractor comprehensive maintenance works of the power plant
within six years from the commencement of commercial operation. EGCB shall implement the EMP (Environmental Management Plan). EGCB is obliged to conduct monitoring and evaluating on the progress of the project and
to prepare reporting. EGCB is obliged to prepare financial reporting to be audited by independent auditors.
5. Power Sector Reforms as the Loan Conditions for WB’s “Proposed Power Sector Development Credit 2008” This WB report stipulates that the Government shall implement the following items for promoting power sector reforms in Bangladesh and that the cooperation and collaboration of international development agencies will also play an important role to achieve that. To motivate the power sector to work in a financially rational way to meet the country’s
economic growth To enhance the sector’s efficiency To introduce commercialized approaches in the sector To improve the reliability and the quality of electricity supply To encourage private sector participation in financing To promote competition among any stakeholders To set reasonable and affordable electricity tariff to help poverty reduction
The report also lists the following items as the basic principles of the power sector reform programs: Unbundling of the power sector among power generation, transmission, and
distribution functions Establishment of power trading market under regulations Enhancement of the participation of private entities and private investment in the sector Development of alternative/renewable energy resources
World Bank has asked GOB to make any efforts for implementing the abovementioned items. In addition to these references, the Survey team also considers that “managerial framework to assure scheduled construction works”, “setting performance indicators for enhancing efficiency”, “managerial framework to secure coal imports for reasonable prices”, “preparation and implementation of EMP” etc. are the key factors in implementing this project.
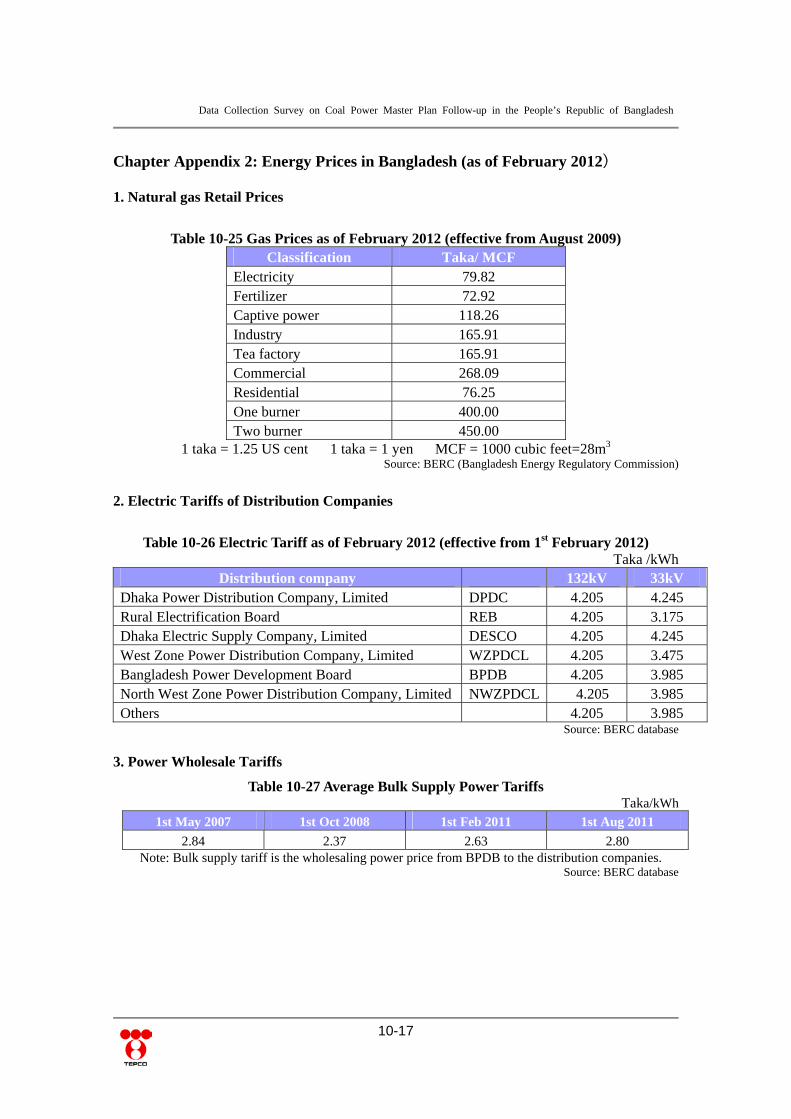
Data Collection Survey on Coal Power Master Plan Follow-up in the People’s Republic of Bangladesh
10-17
Chapter Appendix 2: Energy Prices in Bangladesh (as of February 2012)
1. Natural gas Retail Prices
Table 10-25 Gas Prices as of February 2012 (effective from August 2009) Classification Taka/ MCF
Electricity 79.82 Fertilizer 72.92 Captive power 118.26 Industry 165.91 Tea factory 165.91 Commercial 268.09 Residential 76.25 One burner 400.00 Two burner 450.00
1 taka = 1.25 US cent 1 taka = 1 yen MCF = 1000 cubic feet=28m3 Source: BERC (Bangladesh Energy Regulatory Commission)
2. Electric Tariffs of Distribution Companies
Table 10-26 Electric Tariff as of February 2012 (effective from 1st February 2012) Taka /kWh
Distribution company 132kV 33kV Dhaka Power Distribution Company, Limited DPDC 4.205 4.245 Rural Electrification Board REB 4.205 3.175 Dhaka Electric Supply Company, Limited DESCO 4.205 4.245 West Zone Power Distribution Company, Limited WZPDCL 4.205 3.475 Bangladesh Power Development Board BPDB 4.205 3.985 North West Zone Power Distribution Company, Limited NWZPDCL 4.205 3.985 Others 4.205 3.985
Source: BERC database
3. Power Wholesale Tariffs
Table 10-27 Average Bulk Supply Power Tariffs Taka/kWh
1st May 2007 1st Oct 2008 1st Feb 2011 1st Aug 2011
2.84 2.37 2.63 2.80 Note: Bulk supply tariff is the wholesaling power price from BPDB to the distribution companies.
Source: BERC database
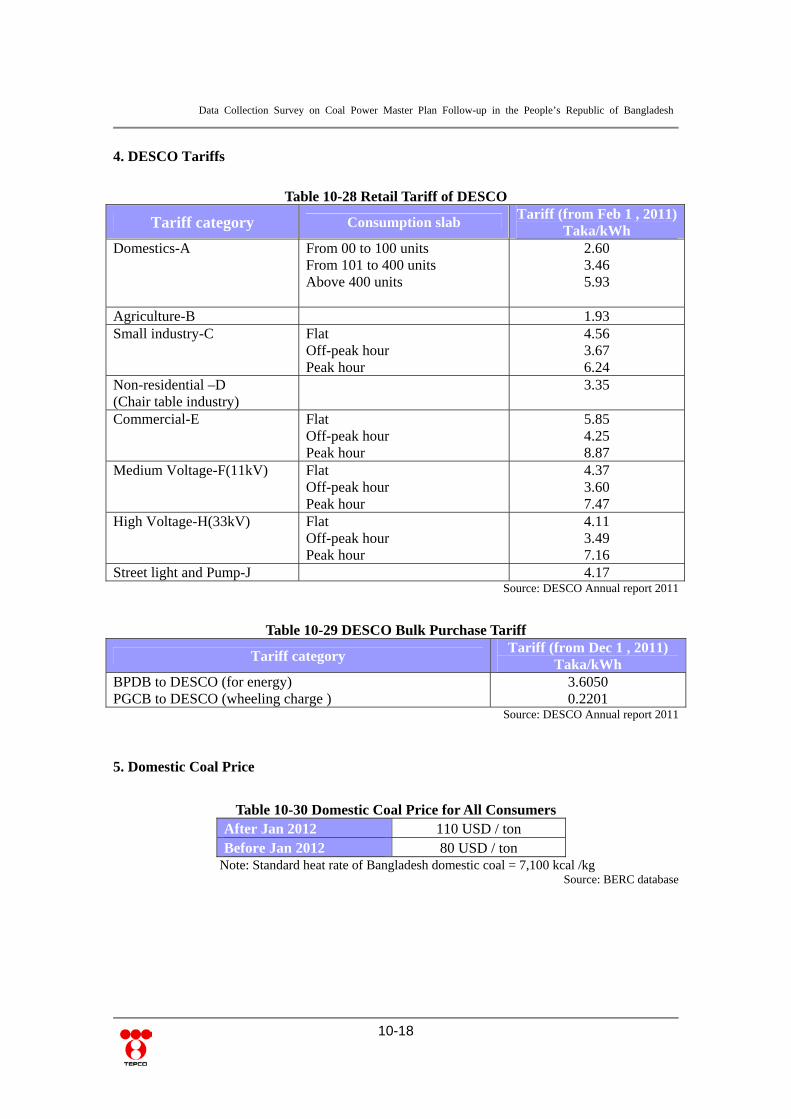
Data Collection Survey on Coal Power Master Plan Follow-up in the People’s Republic of Bangladesh
10-18
4. DESCO Tariffs
Table 10-28 Retail Tariff of DESCO
Tariff category Consumption slab Tariff (from Feb 1 , 2011)
Taka/kWh Domestics-A From 00 to 100 units
From 101 to 400 units Above 400 units
2.60 3.46 5.93
Agriculture-B 1.93 Small industry-C Flat
Off-peak hour Peak hour
4.56 3.67 6.24
Non-residential –D (Chair table industry)
3.35
Commercial-E Flat Off-peak hour Peak hour
5.85 4.25 8.87
Medium Voltage-F(11kV) Flat Off-peak hour Peak hour
4.37 3.60 7.47
High Voltage-H(33kV) Flat Off-peak hour Peak hour
4.11 3.49 7.16
Street light and Pump-J 4.17 Source: DESCO Annual report 2011
Table 10-29 DESCO Bulk Purchase Tariff
Tariff category Tariff (from Dec 1 , 2011)
Taka/kWh BPDB to DESCO (for energy) PGCB to DESCO (wheeling charge )
3.6050 0.2201
Source: DESCO Annual report 2011
5. Domestic Coal Price
Table 10-30 Domestic Coal Price for All Consumers After Jan 2012 110 USD / ton Before Jan 2012 80 USD / ton
Note: Standard heat rate of Bangladesh domestic coal = 7,100 kcal /kg Source: BERC database

Data Collection Survey on Coal Power Master Plan Follow-up in the People’s Republic of Bangladesh
10-19
6. Retail Prices of Fuel Oil and LPG
Table 10-31 Retail Prices of Fuel Oil and LPG Date Fuel oil (Taka/liter) LPG (Taka/liter)
14th Aug 2000 6.50 250.0
27th Dec 2001 9.0 275.0
1st Jun 2002 9.0 275.0
6th Jan 2003 10.0 335.0
23rd Dec 2004 10.0 450.0
25th May 2005 10.0 450.0
20th Jun 2005 10.0 450.0
4th Sep 2005 14.0 475.0
1st Jan 2006 14.0 475.0
9th Jun 2006 14.0 475.0
26th Jun 2006 20.0 500.0
2nd Apr 2007 20.0 600.0
1st Jun 2008 30.0 1000.0
27th Oct 2008 30.0 1000.0
22nd Dec 2008 30.0 1000.0
13th Jan 2009 30.0 1000.0
1st May 2009 26.0 850.0
1st Jun 2009 26.0 700.0
25th Jan 2011 35.0 700.0
6th May 2011 42.0 700.0
19th Sep 2011 50.0 700.0
30th Dec 2011 60.0
Source: BERC database

Data Collection Survey on Coal Power Master Plan Follow-up in the People’s Republic of Bangladesh
11-1
Chapter11 Environment and Social Consideration 11.1 EIA System of Bangladesh
The Bangladesh Environment Conservation Act, 1995 stipulates that no development projects shall be established or undertaken without obtaining environmental clearance from the Department of Environment (DOE). The process for obtaining environmental clearance is described in Environment Conservation Rules, 1997. Under these Rules, power plant projects are classified as “Red Category,” which means that environmental clearance is acquired only after obtaining two types of certificates, namely in the order of Location Clearance Certificate (LCC) and Environmental Clearance Certificate (ECC). The requirements and processes for obtaining LCC and ECC are described below. Figure 9-1 shows the general flow for obtaining LCC and ECC. Location Clearance Certificate (LCC): LCC allows land and infrastructure development at the project site. The following documents must be submitted to obtain LCC.
Initial Environmental Examination (IEE) report No Objection Certificate (NOC) of the local authority TOR of EIA Providing there are no significant issues, LCC will be issued within 60 working days
after submission of the necessary documents. Environmental Clearance Certificate (ECC): After obtaining LCC, the proponent may implement/submit EIA based on the approved TOR. The DOE will approve the EIA within 60 working days providing there are no significant issues. After the EIA approval, the proponent may apply for ECC, and providing there are no significant issues, ECC will be issued within 30 working days. Upon this, the project is allowed to commence operation. The following are necessary documents for obtaining ECC (note that some of the documents may be required upon submission of IEE): Environmental Impact Assessment (EIA) report Feasibility Study report Process Flow Diagram Layout Plan including Effluent Treatment Plant Other necessary documents such as Resettlement Action Plan (RAP)

Data Collection Survey on Coal Power Master Plan Follow-up in the People’s Republic of Bangladesh
11-2
Source: Environment Conservation Rules, 1997
Figure 11-1 General Flow for Obtaining LCC and ECC DOE has issued “EIA Guidelines for Industries, 1997,” which describes in detail the requirements of IEE and EIA.
11.2 Environmental Status around the Priority Project Site
11.2.1 Natural Environment
1) Nature Protected Areas Nature protected areas are designated under the Bangladesh Environment Conservation Act, 1995 and Wildlife (Preservation) Act, 1974. Also the Forest Act, 1927, designates areas of Reserve Forest. There are two Ramsar wetland sites in Bangladesh, one in Khulna District and the other in Sunamganj District, which are all outside the project site. The status of the nature protected areas and Reserve Forest around the project site are described below. a. Nature Protected Areas Designated under the Bangladesh Environment Conservation Act, 1995 Sonadia Island and the adjacent areas, which are located approximately 10 km south from North Maheskhali (approximately 15 km south of Matarbari) are designated under the Bangladesh Environment Conservation Act, 1995 as “Sonadia Island Ecologically Critical Area (ECA).” The area is managed by DOE and has established “Sonadia Island ECA Conservation Management Plan” with the assistance of UNDP/GEF. According to this Plan, the Sonadia Island ECA is comprised of mangroves, salt marsh, mudflats, sandy dune/beaches, and near and in-shore waters; providing habitats for wide variety of animals including mammals, birds, reptiles, amphibians, fish, invertebrates, and so on. Threatened species are also found in the area (see 11.2.1(2) for more details on flora/fauna of the area). Figure 11-2 shows the area of Sonadia Island ECA. There are no ECA between the potential transmission line route between Maheskhali Island and Chittagong City.
Implementation/submission of IEE
Issuance of LCC (within 60 working days)
Implementation/submission of EIA
Application for ECC
Approval of EIA (within 60 working days)
Issuance of ECC (within 30 working days)

Data Collection Survey on Coal Power Master Plan Follow-up in the People’s Republic of Bangladesh
11-3
Source: Sonadia Island ECA Conservation Management Plan-Draft (2006)
Figure 11-2 Area of Sonadia Island ECA (the dotted line is the boundary) b. Nature Protected Areas Designated under the Wildlife (Preservation) Act, 1974 There are basically two types of protected areas designated under the Wildlife (Preservation) Act, 1974 namely, National Park and Wildlife Sanctuary. Neither of these protected areas is present in Maheskhali Island. While there are several National Park and Wildlife Sanctuary between Maheskhali Island and Chittagong City, the transmission lines can be installed without overlapping these protected areas. Table 11-1 lists the National Park and Wildlife Sanctuary in Bangladesh. Figure 11-3 shows the location of the National Park and Wildlife Sanctuary.

Data Collection Survey on Coal Power Master Plan Follow-up in the People’s Republic of Bangladesh
11-4
Table 11-1 List of National Parks and Wildlife Sanctuary in Bangladesh
Category Name Location Surface
area (ha)
Established date
National Park
1 Bhawal National Park Gazipur 5022.00 11-05-1982
2 Modhupur National Park Tangail/ Mymensingh
8436.00 24-02-1982
3 Ramsagar National Park Dinajpur 27.75 30-04-2001
4 Himchari National Park Cox’s Bazar 1729.00 15-02-1980
5 Lawachara National Park Moulavibazar 1250.00 07-07-1996
6 Kaptai National Park Chittagong Hill Tracts
5464.00 09-09-1999
7 Nijhum Dweep National Park Noakhali 16352.23 08-04-2001
8 Medha Kachhapia National Park Cox’s Bazar 395.92 08-08-2008
9 Satchari National Park Habigonj 242.91 15-10-2005
10 Khadim Nagar National Park Sylhet 678.80 13-04-2006
11 Baraiyadhala National Park Chittagong 2933.61 06-04-2010
12 Kuakata National Park Patuakhali 1613.00 24-10-2010
13 Nababgonj National Park Dinajpur 517.61 24-10-2010
14 Shingra National Park Dinajpur 305.69 24-10-2010
15 Kadigarh National Park Mymensingh 344.13 24-10-2010
Wildlife Sanctuary
1 Rema-Kalenga Wildlife Sanctuary Hobigonj 1795.54 07-07-1996
2 Char Kukri-Mukri Wildlife Sanctuary Bhola 40.00 19-12-1981
3 Sundarban (East) Wildlife Sanctuary Bagerhat 31226.94 06-04-1996
4 Sundarban (West) Wildlife Sanctuary Satkhira 71502.10 06-04-1996
5 Sundarban (South) Wildlife Sanctuary Khulna 36970.45 06-04-1996
6 Pablakhali Wildlife Sanctuary Chittagong Hill Tracts
42087.00 20-09-1983
7 Chunati Wildlife Sanctuary Chittagong 7763.97 18-03-1986
8 Fashiakhali Wildlife Sanctuary Cox’s Bazar 1302.43 11-04-2007
9 Dudh Pukuria-Dhopachari Wildlife Sanctuary
Chittagong 4716.57 06-04-2010
10 Hazarikhil Wildlife Sanctuary Chittagong 1177.53 06-04-2010
11 Sangu Wildlife Sanctuary Bandarban 2331.98 06-04-2010
12 Teknaf Wildlife Sanctuary Cox’s Bazar 11615.00 24-03-2010
13 Tengragiri Wildlife Sanctuary Barguna 4048.58 24-10-2010
Note: The protected areas indicated in bold are located between Maheskhali Island and Chittagong City Source: Bangladesh Forest Department (http://www.bforest.gov.bd/conservation.php)

Data Collection Survey on Coal Power Master Plan Follow-up in the People’s Republic of Bangladesh
11-5
Source: Bangladesh Forest Department
Figure 11-3 Location of National Park and Wildlife Sanctuary in Bangladesh
c. Reserve Forest Designated under the Forest Act, 1927 Approximately 18,000 acres of forest land in the hilly area of Maheskhali Island was designated in 1933 as Reserve Forest under the Forest Act, 1927. Figure 9-4 shows the approximate boundary of the Reserve Forest. According to the Forest Department, the aims of Reserve Forest are forest protection, prevention of illegal logging, disaster prevention, wildlife protection, and so on. Intrusion and all other activities are prohibited in the Reserve

Data Collection Survey on Coal Power Master Plan Follow-up in the People’s Republic of Bangladesh
11-6
Forest without permission. Clearing of any forest in the Reserve Forest will require permission from the Bangladesh Forest Department (DOF). The mangrove forest on the west coast of Maheskhali is planned to be designated as Reserve Forest in the near future.
Source: Bangladesh Forest Department
Figure 11-4 Boundary of Reserve Forest in Maheskhali 2) Flora and Fauna
a. Flora Mangrove forests are distributed around the project site, which were initially planted in the 1960s mainly for coastal protection purposes. The area now consists of planted and naturally regenerated mangroves. b. Fauna Fauna species that inhabit Sonadia Island ECA are likely to be present around the project site, as both areas are comprised of similar habitat types such as mangrove and mudflats. According to existing literatures, certain mammals, birds and reptiles found in Sonadia Island and adjacent areas are classified as threatened species under the IUCN Red List. Further details are described below. Mammals: According to the “Sonadia Island ECA Conservation Management Plan,” two endangered marine mammal species, finless porpoise (Neophocaena phocaenoides) and Irrawaddy dolphin (Orcaella brevirostris) are found along the canal and coasts of Sonadia Island. Both species are classified as Vulnerable (VU) under the IUCN Red List.

Data Collection Survey on Coal Power Master Plan Follow-up in the People’s Republic of Bangladesh
11-7
Birds: According to the “Sonadia Island ECA Conservation Management Plan,” around 70 bird species rest, feed, and winter around Sonadia Island, which include threatened species. Sonadia is also certified under the “Partnership for the East Asian-Australasian Flyway/Flyway Site Network22” as an important habitat for migratory birds. According to the field survey conducted in year 2010 by J.P. Bird et al. (2010)23, the threatened species listed in Table 9-2 were identified in Sonadia and Maheskhali Islands.
Table 11-2 Threatened Bird Species Identified around Sonadia and Maheskhali Islands Common name Species name IUCN category
Spoon-billed sandpiper Eurynorhynchus pygmeus Critically Endangered (CR) Nordmann’s greenshank Tringa guttifer Endangered (EN) Great Knot Calidris tenuirostris Vulnerable (VU)
Source: J.P. Bird et al. (2010) Within the above-threatened species, impact on Spoon-billed sandpiper is of most concern as it is classified as Critically Endangered (CR) under the IUCN Red List. Spoon-billed sandpipers are known to breed in the Russian Far East, and migrate to the mudflat areas of southeast Asia and south Asia region to winter, which includes Bangladesh. According to J.P. Bird et al. (2010), the current global population of Spoon-billed sandpipers is estimated to have reduced to 500–800 individuals (120–250 breeding pairs). During the field survey conducted by J.P. Bird et al. (2010), 25 Spoon-billed sandpiper individuals were identified in the mudflats of western coast of Maheskhali, namely at Kaladia and Halodia survey sites. In the same survey, 24 and 4 Nordmann’s greenshank individuals were identified at Hasher Char and Kaladia survey sites respectively. Also approximately 200 Great knot individuals were identified at Hasher Char, Kaladia, and Belekadia survey sites. Figure 9-5 shows the location of the areas where the above-threatened species were identified and the main mudflat/mangrove areas.
22 An informal and voluntary initiative, aimed at protecting migratory waterbirds, their habitat and the livelihoods of
people dependent upon them 23 J.P.Bird et al. (2010) A survey of the Critically Endangered Spoon-billed Sandpiper Eurynorhynchus pygmeus in
Bangladesh and key future research and conservation recommendations, Forktail 26 (2010): 1-8.

Data Collection Survey on Coal Power Master Plan Follow-up in the People’s Republic of Bangladesh
11-8
Source: J.P. Bird et al. (2010)
Figure 11-5 Locations of Areas where Threatened Bird Species were Identified Reptiles: According to the “Sonadia Island ECA Conservation Management Plan,” two threatened marine turtle species, Olive Ridley turtle (Lepidochelys olivacea) and Green turtle (Chelonia mydas) nest along the sandy beach of Sonadia Island. The survey conducted by Marine Life Alliance (NGO) in 2006–2007 recorded 60 and 3 nesting events of Olive Ridley turtle and Green turtle respectively in Sonadia Island. According to DOE staff, sea turtles also nest in the offshore sandbars of west coast of Maheskhali.
11.2.2 Social Environment
1) Land Use The lowlands of west Maheskhali is mainly comprised of saltpans, agricultural land, and aquaculture ponds. The main residential area is located in the southeastern area and along the main road that runs north–south of the center of the island. Therefore, no large-scale resettlement should be required through this project. Commercial area is concentrated in southeastern area.
2) Economic Activities
The main industry in Maheskhali is salt and shrimp farming. According to the local residents, salt farming is conducted in the dry season and shrimp farming in the wet season. Agriculture and fishing are also conducted but on a small scale. Main agriculture products are rice, vegetables, and coconuts. Fishing is conducted in the inlets and mudflats using methods such as beach seine, gill net, cast net, and set net.
Data Collection Survey on Coal Power Master Plan Follow-up in the People’s Republic of Bangladesh
11-9
11.3 Environmental Issues and Draft TOR of EIA
11.3.1 Environmental Issues
A wide range of environmental impacts is likely to occur, as the project includes both power plant and port development. The main issues are describes below.
1) TOR of IEE/EIA
BPDB is planning to construct 8,320 MW coal- and LNG-based power plant complex (4 units of 1,000 MW coal power plant, 2 units of 660 MW coal power plant, 4 units of 750 MW LNG power plant, coal unloading, transporting and storing facilities, LNG terminal, and 800 KV grid sub-station) in Maheskhali. The required land area is 5,000 acres. BPDB has contracted CEGIS for the IEE/EIA and natural condition survey of this project (contract signed on December 27th, 2011). However, since the project is still in the preliminary planning stage with no specific layout, the IEE/EIA has not been implemented yet. The TOR for the IEE/EIA was reviewed by the Survey team and the following issues were consequently identified (see Appendix1). Obtainment of environmental clearance certificate may be difficult as the 8,320 MW
project is likely to have significant environmental impacts. The location of the alternative development sites is unclear. Since the 8,320 MW project does not include the components of the port (-15 m
approach channel and unloading berth) and transmission line, the TOR does not cover environmental and natural condition surveys for the above components.
Deducing from the EIA report deadline (3.5 months after signing of contract), there seems to be insufficient time to conduct a thorough environmental baseline survey.
The TOR does not specify survey on threatened species. Based on the above findings, the Survey team submitted a letter of recommendation to BPDB regarding the TOR of the IEE/EIA (see Appendix 2). The following are the main recommendations: Since the 8,320 MW project will be a project of unprecedented magnitude, the project
should be implemented in several phases. The Survey team recommends to start initially from 600 MW 2 coal-based power plants, and amending the scope of the IEE/EIA accordingly.
The project site should be determined after a comprehensive analysis of potential alternative sites. The Survey team recommends north Maheskhali, south Maheskhali, and Matarbari as potential sites. Factors such as environmental impacts, cost, and maintenance dredging requirements should be considered in the analysis.
The environmental baseline survey should cover the marine area, including water quality, sediment quality, and flora/fauna surveys.
Environmental baseline survey should be conducted during both wet and dry seasons, in particular for items that have seasonal variation (e.g. water quality, fauna).
A detailed survey should be conducted specifically for threatened species. BPDB submitted the Survey team’s letter of recommendation to CEGIS, and received a reply through a letter dated on February 20, 2012 (see Appendix for the reply letter). The following are the main points of the reply letter: Information such as project layout, design and implementation schedule is necessary to
implement IEE/EIA, which is currently unavailable.
Data Collection Survey on Coal Power Master Plan Follow-up in the People’s Republic of Bangladesh
11-10
Require a formal decision to include Matarbari as an alternative site. Implementation of water quality, sediment quality and flora/fauna surveys in the marine
area will be considered. Since the duration of the study is for a total of 6 months, it will not be possible to
implement the environmental baseline and natural condition surveys for both wet and dry seasons under the current contract.
Survey on endangered species will be considered.
Based on the above correspondence, there is no mentioning of altering the scope of the IEE/EIA from 8,320 MW to 600MWx2. As such is the case, in the ensuing JICA feasibility study, it may be necessary to make another contract with CEGIS specifically for the IEE/EIA of the 600MWx2 project. In such a case, the TOR of the IEE/EIA should be determined via thorough discussion between the JICA feasibility Survey team and the project proponent.
2) Impacts on Natural Environment
Impacts on natural environment will likely be significant as the Maheskhali area is surrounded by important marine habitats such mangroves, mudflats, sandbars, and nature protected areas. The area is also inhabited by threatened bird, sea turtle, and dolphin species. Therefore, a detailed baseline survey and environmental assessment should be conducted in the EIA. Effective mitigation measures and monitoring program must also be considered. In principal, cutting of mangroves should be avoided as the current mangrove area is planned to be designated as Reserve Forest soon. The mangroves also have important coastal protection function. The following are impacts of particular concern: Impacts on marine organisms and nature protected areas through dredging activities Impacts on birds through loss of mudflats Impacts on sea turtles through marine construction works and power plant operation Impacts on ecosystem through discharge of cooling water Impacts on birds through construction and operation noises.
3) Impacts on Social Environment
Salt or shrimp farming are common in and around all the candidate project sites. While the farms located inside the project area will inevitably be lost, the surrounding farms may also be affected through dust dispersion from the coal stockyard/ash pond and through water pollution. Since salt and shrimp farming are the major industries in the region, many local residents may be forced to relocate their farming area or change their livelihood. Therefore, in the ensuing JICA feasibility study, a detailed socio-economic survey and impact assessment on salt and shrimp farmers should be conducted. Based on the impact assessment, an appropriate compensation and livelihood recovery program (i.e. abbreviated Resettlement Action Plan (RAP)) should be established; through consultation with the project affected people. The abbreviated RAP should include the following information: Required land acquisition and resettlement Results of population census and asset/land survey of all the occupants in the project
area Survey results on the livelihood and living standard of at least 20% of the occupants in
the project area Eligibility criteria for receiving compensation for assets lost and living standard
recovery measures Compensation procedures for lost assets

Data Collection Survey on Coal Power Master Plan Follow-up in the People’s Republic of Bangladesh
11-11
Measures to recover the livelihood and living standard of occupants to at least
pre-resettlement levels, which should be based on the recovery needs survey. Grievance procedures, responsible organization and its authority Responsible organizations for resettlement (implementation body, local government,
consultant, NGOs etc) and obligations. Implementation schedule of resettlement after payment of compensation for lost assets. Cost and budget sources Organizational structure of the implementation body and monitoring form Results of the public consultation regarding alternative livelihood recovery measures
and the preliminary project design 4) Schedule of IEE/EIA The IEE/EIA should be conducted in line with the ensuing JICA feasibility study. The IEE/EIA should take approximately 1 year to complete providing that the baseline surveys are conducted for both dry and wet seasons. Figure 11-6 shows the tentative schedule of IEE/EIA.
1 2 3 4 5 6 7 8 9 10 11 12Data collection (secondary data)Analysis of alternativesPublic consultationPreparation/submission of IEE reportEvaluation of IEE by DOEField survey (primary data)Impact assessmentPublic consultationPreparation of EMP/RAPPreparation/submission of EIA reportEvaluation of EIA by DOE
IEE
EIA
Source: The Survey team
Figure 11-6 Tentative Schedule of IEE/EIA 5) Others
According to the Bangladesh Forest Department, some sea areas of Maheskhali will be designated as Marine Protected Area (MPA), which is currently in the process of finalization. The Survey team, through local consultant, requested the Bangladesh Forest Department for further information on the MPA (e.g. boundary of MPA), but information could not be obtained within the study period. The entire region of Matarbari and Maheskhali lie under the Indo-Burma Biodiversity Hotspot designated by Conservation International (CI). There are two strict criteria for a region to qualify as a hotspot: The region must contain at least 1,500 species of vascular plants (> 0.5 percent of the
world’s total) as endemics The region has to have lost at least 70 percent of its original habitat.
Since the terrestrial area around both Matarbari and Maheskhali-North project sites are comprised of salt and aquaculture farms, it is unlikely that there are any hotspot relevant endemic vascular plants or primary vegetation around the project sites (the mangroves near the project sites are neither endemic nor primary vegetation). Nevertheless, the ensuing JICA feasibility study should study the reason behind the designation of Matarbari and Maheskhali. Field survey and impact assessment should be conducted, if there any species within the project impact area that requires protection from the perspective of hotspot conservation.

Data Collection Survey on Coal Power Master Plan Follow-up in the People’s Republic of Bangladesh
11-12
11.3.2 Draft TOR of EIA
The IEE/EIA of this Project will likely be conducted by CEGIS. However, technical assistance will be required from the ensuing JICA feasibility study, so that the IEE/EIA satisfies the requirements of “JICA Guidelines for Environmental and Social Consideration”. The following are the necessary survey items: Baseline status of the natural and social environment (land use, natural environment,
living area of indigenous people, socio-economic status, etc.) Environmental laws/regulations (EIA, information disclosure), environmental standards
and relevant organizations Identification of gaps with JICA Guidelines for Environmental and Social
Consideration (April 2010) Responsibility of relevant organizations Scoping of environmental impacts Prediction of impacts (including quantitative prediction) Impact assessment and comparison of alternatives (including no development option) Countermeasures (avoidance, minimization, mitigation) Environmental management plan and monitoring plan (organizational structure, method,
cost etc.) Clarification of organizational structure, budget and budget sources Stakeholder meetings
The required technical assistance will depend on the contents of the contract between the project proponent and consultant (CEGIS) such as, project scale (8,320 MW or 600 MW x 2), project components (whether a transmission line is included), survey contents and survey period. Nevertheless, the following surveys should at least be conducted in the ensuing JICA feasibility study due to their importance. Apart from the transmission line component, the study area should encompass an area of at least a 10 km radius from the project site.
1) Baseline Environmental Survey
Water quality survey (marine area) Parameter: Water temperature, pH, TSS, oil content, residual chlorine, total chromium, copper, iron, zinc, lead, cadmium, mercury, arsenic Frequency: Once each in dry and wet seasons Sediment quality survey (marine area) Parameter: Specific gravity, water content, particle size distribution, total chromium, copper, iron, zinc, lead, cadmium, mercury, arsenic Frequency: Once Fauna survey (marine area) Parameter: Benthic organisms (species type and abundance), fish (species type, spawning area, nursery area), dolphins (no. of individuals, main habitat), sea turtles (nesting area/season and no. of individuals) Frequency: Benthic organisms, fish, and dolphins: Field survey should be conducted once each in dry and wet seasons and supplemented with interview surveys. Sea turtles: Field survey should be conducted in the nesting season and supplemented with interview surveys.

Data Collection Survey on Coal Power Master Plan Follow-up in the People’s Republic of Bangladesh
11-13
Bird survey (threatened species) Parameter: Identification of migration/wintering season and important habitats of Spoon-billed sand piper, Nordmann’s greenshank, Great Knot, and other threatened species. Frequency: 5 days 3 in the migration/wintering season Socioeconomic survey Parameter: Status of salt and shrimp farming (e.g., no. of farmers, production volume, revenue, employment structure), status of fisheries (e.g., no. of fishermen, fishing ground, fishing method, fish catch, main target species).
2) Impact Prediction and Assessment Estimate the area of mudflats/sandbars that will be lost through the project, and assess
how the loss will affect threatened species, the ecosystem and biodiversity. Provide examples of existing power plant projects that successfully coexist with a sensitive natural environment.
Assess the impacts of dredging activities on protected areas, threatened species, ecosystem, biodiversity and fisheries through conducting SS dispersion simulation (wet and dry seasons)
Assess the impacts of air pollutant emissions on the local residents by conducting NOx/SOx/PM10 dispersion simulation (wet and dry seasons)
Assess the impacts of cooling water discharge on threatened species, the ecosystem and biodiversity by conducting a dispersion simulation (wet and dry seasons)
Assess the impacts of power plant noise/vibration on threatened species, ecosystem, biodiversity and local residents by conducting noise/vibration simulation
Assess the impacts of dust dispersion from the coal stockyard and ash pond on salt/aquaculture farms by conducting dust dispersion simulation (wet and dry seasons)
3) Environmental Management Plan
Consideration of mitigation and monitoring plan Mitigation and monitoring plan for threatened species Compensation and livelihood recovery program Implementation structure
4) Stakeholder Meeting Stakeholder meeting should be held three times, namely during the alternative analysis, scoping and draft final phases. Local residents and people that have limited access in the decision-making process should also be thoroughly consulted. Local NGOs and researchers should also be invited to the meetings.
11.4 Estimation of GHG Reduction
The CO2 reduction effect of the Ultra Supercritical (USC) power plant was estimated by comparing it with the sub critical power plant. CO2 emissions were estimated by using the formula of the Ministry of Environment (Japan). Formula: CO2 emissions = fuel consumption x heat generation per consumption x carbon emission per consumption x 44/12

Data Collection Survey on Coal Power Master Plan Follow-up in the People’s Republic of Bangladesh
11-14
Fuel consumption of USC and sub critical power plants was estimated by setting their heat efficiency at 45% and 40% respectively. Heat generation per unit consumption was set at 5,100 kcal/kg. Carbon emissions per unit consumption was set by using the value (0.0247 tC/GJ) of Ministry of Environment (Japan). Table 11-3 shows the estimated CO2 emissions from USC and sub critical power plants.
Table 11-3 Estimated CO2 Emission from USC and Sub critical Power Plants (600MWx1, Operation Rate 85%)
USC Sub
critical Note
Fuel consumption (ten-thousand t/year)
175 200 Heat efficiency of USC: 45% Heat efficiency of sub critical: 40%
Heat generation per unit consumption (GJ/t)
21.369 21.369 Set at 5,100 kcal/kg
Carbon emission per unit consumption (tC/GJ)
0.0247 0.0247 Value of Ministry of Environment (Japan)
CO2 emission (million tCO2/year) 3.39 3.87 CO2 emission (t/CO2/MWh) 0.759 0.866
Source: The Survey team According to the estimation, the annual CO2 emissions of the USC power plant will be 480,000 tons less compared to the sub critical power plant. According to the statistics of the Japan Center for Climate Change Actions, the annual CO2 emissions from a Japanese household is approximately 4.852 tons/household (in 2009). Therefore, the CO2 emissions reduction effect of the USC power plant will be equivalent to the annual CO2 emissions of approximately 99,000 households.

Appendix

Table of Contents
Appendix 1 Draft TOR of EIA
Appendix 2 Original Letter to BPDB
Appendix 3 Response from CEGIS

Appendix 1
Draft TOR of EIA

Section 6. Terms of Reference
TERMS OF REFERENCEFOR
CONSULTING SERVICES ONINITIAL ENVIRONMENTAL EXAMINATION AND ENVIRONMENTAL IMPACT
ASSESSMENT OF PROPOSED 8,32OMW COAL BASED AND LNG BASED THERMALPOWER PLANT AT MAHESHKHALI
A. Background
With the objective of sustainable power generation and rel iable electr icity supply'Bangladesh Power Development Board has planned to instal l a new Coal based and LNGbased thermal power plant of B320MW capacity at the location of Maheshkhali . The Project
site is located in Hoanok union of Maheshkhali upazila covering Hoanok, Panir Chhorra,
Hetalia and Amabassaya mouza. The project components include 5320 MW coal based
thermal power plant (four units of 1000MW each and two units of 660 MW each), 3000MWLNG based combined cycle power plant (four units of 750 MW each), coal unloading,transport ing and storing faci l i t ies, LNG terminal, 800KV grid sub-station. A total of 5,000acreland wil l be required for this project. The Power Plant shall be of most eff icient technologiesand minimum pollut ion level. With the purpose of obtaining Site Clearance andEnvironmental Clearance Certi f icates from Department of Environment of Bangladesh it isrequired to carry out Init ial Environmental examination ( lEE) and Environmental lmpactAssessment (ElA) studies.
B. Objective
The objectives of this consultancy service are to carried out Init ial EnvironmentaiExamination ( lEE) and Environmental lmpact Assessment (ElA) studies for the proposed8,320 MW coal based (5,320MW) and LNG based (3000MW) thermai power plant atMoheshkhali . The specif ic oblectives are:
i . Conduct lnit ial Environmental Examination to identify possible Environmental andSocio-economic lmpacts with possible mitigation measures and a tentativeEnvironmental Management Plan
ii .Conduct Environmental lmoact Assessment with detai l environmental and socio-economic baseline survey, predict ion and evaluation of possible environmentaland socio-economic impacts, and detai l Environmental Management Plan
iii.Topographical survey of 5,000 acre land of tentative site at ftf rf'"".f'ff,"f i
iv.Geotechnical Investioation of the oroposed site.
73

C. Scope of Services
The scope of works includes mainly execution of IEE, ElA, topographical survey and geotechnical
investigation. The scope of the services is detailed below:
C1 Ini t ia l Environmental Examinat ion
The scope of services under the IEE study is as follows:1. Selection of 2 possible alternative sites [Parki Beach, Anwara and Matarbari, Moheshkhali]
and recommend one site which involves minimum agricultural land, minimum habitats to be
displaced, minimum/avoiding hi l ly area, use maximum Government land ( i f avai lable) anddevelop suitable layouts.
2. Land acquisition plan from the office of the Deputy Commissioner's office.3, Land use/ Land cover including ecologically critical area, national parK, forest, orchard,
cultural heritage site etc., if any, in the site selected for the power plant.
4. Topographical survey of the selected project site,
5. Meteorological data collection of the site from Bangladesh Meteorological Department (BMD).
6, Hydrological and morphological data collection from BWDB and BIWTA.7. Agro-ecological zones data collection from AEZ report.B, Agricultural data collection from BBS and DAE,9. Water resources and soil salinity data collection from BWDB and SRDL10. Collection of data on access to port/railway/road from Poft Authority, Bangladesh Railway and
Roads and Highway Department,11. Soil investigation of the selected site,12, Seismici ty analysis.13. Sources of water during construction and operation.14. Effluent disposal point(s),15. Data on water qual i ty, air qual i ty and noise level.16, Transoortation of raw material and fuel.17. Prel iminary planning, design and drawing of power plants.18. Specif ic statutory requirements appl icable in Bangladesh.19. Establishment of the environmental and soclal baseline condition in resoect of water
resources, air quality, noise level, land resources including land use/land cover, agriculture,fisheries, ecosystems and socio-economic condition.
20. Public consultation and disclosure21, Identification of Important Envlronmental and Social Components (IESC),22. Assessment of impacts of the proposed power plant on the environmental and social
componenrs.23. Prel iminary Environmental Management Plan (EMP),24. Risk and hazard analysls.25, Terms of Reference (TOR) for the Environmental Impact Assessment (EIA) study for approval
by DOE,26. Produce an IEE report, which shall form the basis of obtaining location/ site clearance from
the DOE.
C2 Environmental and Social Impact assessment
The scope of services under the EIA study is as follows:
74

1. Carry out environmentai and social impact assessment identifying the maximum generatlon
capacity capable of being installed 5320 MW coal based thermal power plant (four units of
1000MW each and two unrts of 660 MW each), 3000MW LNG based combined cycle power
plant (four units of 750 MW each) that will satisfy the applicable environmental requirements,
including the laws and bylaws of Bangladesh and World Bank Group's health and safety
guidel ines.2" Carry out hydrological investigation; evaluate the necessary LNG and coal supplying system.
3. Elaborate project description and design and the activities at pre-construction, construction
and post-construction Phases,4. Establish environmental and social baseline condition in respect of water resources, land
resources, agriculture, fi sheries, ecology and socio-economic condition'
5, Carry out meteorological, noise level and air quality investigations for the proposed power
plants and the necessary additional transmission lines'6" Select environmental and social components likely to be impacts by the proposed coal-fired
nnr^ ror n lan tqy v r r v , H , v , , L J t
7, Identify suitable control measures to mrnimize ash, CO, CO2, SO,, NO, etc. emission from the
power plants, if any, that should be required the developer under the request of proposals,
B. Identify exhaust stack requirements (275 Meters as per DOE rules) applicable to each plant
so that concentration of SOz and particulate matter in the surrounding area is uniform and
min imum.9. Thermal plume modelling will be completed considering the proposed power plant including
nearby industr ial instal lat ions ( i f any).10, Ability for the developers of the power generation projects to satisfy all national regulatory
requirements and international obligations related to health and human safety and the
environment in the construction, operation, and maintenance of imported coal projects of the
anticipated size at the rdentified sites,11. Ability to dispose efficiently and in a manner that complies with all national regulatory
requirements and international obligations related to the ash generation by the powergeneration facilities (and the development of a recommended plan for doing so).
12, Social/infrastructure facilities to be requrred,13. Assess and evaluate the ability of each of the projects (and any expansion projects at the
site) ro comply with all nealth and safety and environmental laws of Bangladesh and therequirements of the World Bank group, Identlfy any restriction that should reasonably beimposed on the developers of the power generation projects to ensure that expansionpro;ects can be designed, constructed and operated in compliance with all such laws,regulations and requirements and also international obligations.
14, Evaluate the impact on environment in line with Bangladesh andlor World Bank requirementfor the coal power plant and transmission line to ensure that the power generation facilitiesand transmission facilities can be designed, constructed and operated in compliance with allappl icable environmental requirements,
15. Preparat ion of Environmental Management Plan (EMP), which shal l include mtt igat ionmeasures, enhancement and contingency measures and compensation,
16, As per TOR approved by the DOE, produce an EIA repoft which shall form the basis ofobtaining environmental clearance from the DOE for implementation of the coal-fired steampower generation facilities.
17. Carry out the test for dust particles from coal to the air.18. Study of siltration problem and migration of soil/sand in the proposed area.19. Study of the township development of the area,20, Study of salinity of the area,
7^
C3. Topographical and Engineering Survey
i. Carry out Benchmark pi l lar from nearest established Benchmark Pil lar
i i . Establishment of 5 numbers of Benchmark and '10 numbers of Reference Pil lars (2reference pillars for each BM)
iii. Total station survey on 5000 acres area
iv. Producing maps of topographical information and features
v. Detail contour survey by taking spot levels at 20 Meter intervals constructing Benchmark, reference pillars and grid pillars of approved specifications at 100 meter gridpoints of the area surveyed.
C4. Geotechnicallnvestigation
i . Execution of minimum 20 numbers of exploratory borings depth up to 40 meters,recording of sub-soil stratification and position of ground water table.
i i . Execution of standard penetration test (SPT) at an interval of 1.5 m depth withcollection of disturbed soil samples up to the f inal depth of exploration of each boring.
i. Carried out laboratory test of required engineering propert ies of sub soil .
D. Responsibi l i t iesofconsultants
The consultant shall carry outthe services as detailed in "Scope of Works" inthe best interestof theBPDB with the reasonable care, skill and diligence with sound engineering administrative andfinancial practices and shall be responsible to the executive agency (BPDB) for discharge ofresponsibilities.E. Responsibility of the Clients
The client. Bangladesh Pori,'er Development Board u'il l provide all necessary information on projectdesign, process and data as per requirement of Department of Environment. ln addition, the client willfacilitate the study with necessary support and references in collecting data from differentGovemment Departments.
F. ResourcesRequirement/QualificationofProfessionals
All Experts must have graduate with 10 years job experience in relevant field except Junior specialistsand surveyors and field researchers. rvhose job experience shall be at least 3 years.
G. Deliverables
The following reports are to be delivered by the consultants to BPDB:
. An lnception Report shall be submitted within 15 (fifteen) days from the commencement ofthe assignment
o The Draft Final IEE Report shall be submitted at the end of 1.25 months from the date ofsisnins contract:
76

r The Final IEE Report shali be submitted within 07 days after receiving comments on draft
final report;. Draft Topographical survey reports and maps, and geotechnical investigation report shall be
submitted at the end of 4 months from the date of signing contract
. Draft Topographical survey reports and maps, and geotechnical investigation report shall be
submitted at the end of 4 months from tire date of signing contract
. The Draft Final EIA Report shall be submitted at the end of 3.5 months from the date of
signing contract;. The Final EIA Report shall be submitted within 15 days after receiving comments on draft
hnal report;o All report shall be submitted to BPBD in (five) hard copies and soft copy on CD'
H" Staffing
sl.No.
Discipl ine Number Person-Months
IEEstudv
EIA study Total
1 Environmental Expert/Team Leader 1 1 3 4
2 Water Resources Enqineer I 1 2 3J Electrical Enoineer 1 I 1 24 Moroholooist 1 1 1 z
5 Mechanical enoineer 1 1 1 26 Ecoloqist 1 1 1 27 Fisheries Soecialist 1 1 1 2B Soil and Aoriculture Soecialist I 1 I
I 29 Socio-Economist 1 1 I 210 Environmental Law Specialist 1 1 I 21 1 Junior Environmental Enoineer 1 1 2 ?
12 Field Researcher z 2 2 413 13 L7 30
I. Tentative Report Format of EIA
The EIA report should be prepared following the Format of DoE where the following items shallhave to be included. The IEE repor-t has to be completed following the DoE's guideline.
Tentative TOR that shall be follorved in formatting the EIA Report
l. The TOR of the EIA shall incorporate the follorving components/items :
I. Executive Summary
II. Introduction
11.1 . Background11.2. Purpose of the Study11.3. Need of the Project11.4. lmportance of the Project11 .5 . Scope o f E IA Study
77

ilI.
11.6. EIA Team
Legal and Legislative Framework, Regulations and Policy Considerations(including inter alia Environment Policy, National Energy Policy, IndustryPolicy, National Forest Policy, National Water Policy, Coastal ZoneManagement Policy, National Land use Policy, National Agriculture Policy.Fisheries policy, National coal policy. etc. )
IV. Project Data Sheet
|V.1. Project Proponent|V.2. Project location and area1V.3. Nature and Size of the Project|V.4. Project Concept|V.5. Project ComponentslV.6. Project Activities|V.7. Project schedule|V.8. Resources and uti l i t ies demand1V.9. Sources of Primary Fuels (Quality and Country of Origin)lV. '10. Transportation of primary Fuel
V. Process Description
V.1, Project SiteV.2. Project LayoutV.3. Land RequirementV.4. Fuel RequirementV.5. Water RequirementV.6. Technology Selection and Process Descript ionV.7. Descript ion of Major SystemsV.B. Material BalanceV.9 Pollut ion Mit igation Measures (Units & Devices)
VI. Analysis of Suitability for Different Alternatives (this analysis shall beperformed, among other approaches, in a GIS based Spatial Decision SupportSystem (SDSS) presenting the suitability of different options for both theinterventions)
VII. Detail description of the land cover/land use (with all the existing resourceclasses along rvith area coverages shall be shown in the respective mapsderived from updated image of proper spatial and spectral resolution. Basicinformation (name of satellite, date and time of acquisition with atmosphericcondition, spatial resolution, color composite etc.) of the image data to be usedfor making landuse/landcover maps shall be mentioned)
VIII. Description of Environment
Vll l .1 Study Area (10 Km. radius), Period, Component and methodology(Seasonal Variation should be covered)
Vll l ,2 Coal availabi l i ty, including distance to "mine mouth", the non-sterilisation coal reserves and the feasibilitv of distance between stationano coal
7B

Vll l .3 Water availabi l i tYVll l .4 Sorbent availabi l i tYVll l .5 HydrogeologyVll l .6 MeteorologyVl l l .7 Ambient A i r Qual i tYVll l .8 Ambient Noise QualityVll l .9 Surface & Ground Water QualityVll l .1 0 Aquatic MonitoringVl l l . '11 Soi l Qual i tyVl l l .12 Ecology
Vl l l .12.1 ForestsV l l l . 12 .2 F lo raV l l l . 12 .3 Fauna
Vll l .13 Demography Profi le and Occupational PatternVll l .14 Land use and Cropping PatternVll l .1 5 Socio-economic ScenarioVll l .16 Distance to urban and rural communit ies (proximity to sensit ive
receptors)Vll l"17 Transmission capacity/options for l inking to gridVll l .18 Distance to exist ing infrastructure such as roads, etc"Vll l .19 Current and surrounding land use and associated communit ies
IX. Environmental Impacts
lX.1 ldentif ication of lmpactlx.z Sustainabil i ty of Quality of Coal and Continuity of Supply
lX.3 Construction Stage lmpact
|X.3.1 lmpact on Landform1X.3.2 lmoact on Natural Resources|X.3,3 lmpact on Eco-systems1X.3.4 lmpact on Ambient Air1X.3.5 lmpact on Ambient Noise|X.3.6 lmpact on Water Bodies|X.3.7 lmpact on Soi l1X.3.8 lmpact on Workers Health, Sanitation and Safety1X.3.9 lmpact on Key Point Instal lat ions & others|X.3.10 Solid Waste Disposal|X.3.1'1 Social lmpact due to industrial set up and harnessing of coal
and other resources locally (if any)|'X.3.12 lmpact due to transportation of raw materials
lX.4 Operation Stage lmpact
1X"4.1 impact on Natural Resource1X.4.2 lmpact on eco-systems1X.4.3 lmoact due to collection of Resources from Local Sources within
the Country (if any)1X.4.4 lmoact on Ambient Air1X.4.5 lmpact on Ambient Noise1X.4.6 lmpact on Water Bodies (both surface & ground)1X.4.7 Solid Waste Disposal1X.4.8 Soil and Agriculture1X.4.9 lmpact on Ground Water
I Y

1X.4.10 lmpact due to Ash Disposal1X.4.11 Ecology (Flora and Fauna)1X.4.12 lmpact on Occupat ional Health1X.4.13 lmpact on Publ ic Health and Safety1X.4.14lmoact on Traff ic Movement1X.4 .15 Soc ia l lmoact1X.4 ,16 lmpact on Tour ism1X.4.16 lmpact due to transportat ion of pr imary fuels
X. Evaluation of Impacts
The impacts should be evaluated in terms of their local, regional and nationalimportance, The impact should be assessed in terms of the magnitude,significance. frequency of the occurrence, duration and probability. Theconfidence level in the prediction must be stated. The judgment of significanceof impacts can be based on one or more of the following. depending on theenvironmental factor being evaluated. These are :i. comparison with laws, regulation or accepted national or international standards
ii. reference to pre-set criteria such as conservation or protected status of a site,feature or species
iii. consistency with pre-set policy objectivesit,. consultation and acceptability rvith the relevant decision makers, civil society,
local community or the generai public.
XI. Mitigation Of Impacts
Mitigation measures which may be of the following categories and coverages:i. changing project layout, transport routes, disposal routes or locations, timing or
engineering designii. introducing pollution controls. waste treatment, phased implementation and
construction, engineering measllres. monitoring. landscaping. social services orpublic education;
iii. rehabilitation. compensation to restore. relocate or provision of concession fordamage
XII. Environmental Management Plan
Xl l .1 EMP during Construct ion PhaseXl l .1 .1 S i te Prepara t ionXll.1 .2 Infrastructure ServicesXl l . ' 1 .3 Const ruc t ion Equ ipmentXl l . '1 .4 Safety Measures
Xll.z EMP during Operation PhaseXll.2.1 Air Pollut ion Management
X||.2.1.1 transportaion and handling of raw materialsX|l.2.1.2 Operation Stage
Xll.2.2 Waste Water ManagementXl l .2 .3 Noise ManagementXll.2.4 Solid Waste Management
X||.2.4.1 Fly Ash Uti l izationX||.2.4.2 Ash Uti l ization
Xl l .2 .5 House Keeoinq
BO

Xll.2.6 Safety and Occupational Health
Xll.3 Greenbelt DevelopmentXll.4 Rain Water Harvesting PlanXll.5 Rehabil i tat ion and Resett lement PlanXll.6 Thermal pollut ion managementXl l .7 CoalWasheryXl l .8 CoalYard MgtXl l .9 CDM lntentXl l .10 Budget for EMPXl l .11 Cont ingency PlansThe project authority shall:a) Provide a conceptual contingency plan that considers environmental
effects associated with operational upset conditions such as seriousmalfunctions or accidents;
b) Describe the f lexibi l i ty buil t into the plant design and layout toaccommodate future modif ications required by any change inemission standards, l imits and guidelines.
XIIL Risk Assessment
Xl l l .1 Consequence Analys isXll l .2 Emergency Response PlanXll l .3 Risk Mit igation Measures
XIV. Environment Monitoring Plan
XlV.1 Monitoring PlanXlV.1.1 Stack Emiss ion Moni tor ingXlV.1.2 Ambient Air MonitoringXlV,1 .3 Meteorological MonitoringXlV.1.4 Equipment and Ambient NoiseXlV.1.5 Surface Water & Waste Water MonitoringXlV.1.5 Ground Water Moni tor ingXlV.1.6 Solid & Hazardous Waste MonitoringXlV.1.7 F lora and Fauna Moni tor ingXlV.1.8 Workers Health and Safety MonitoringXlV.1 .9 Community Health MonitoringX|V.1.10 Moni tor ing of DMPXIV.1.11 Moni tor ing and CSR Act iv i t ies
XlV.2 Action During Abnormal Operating condit ionsXlV.3 Budgets for MonitoringXlV.4 Reporting
XV. Work Plan
XVI. Project Benefits with Benefit-Cost analysis that covers among others,Environmental and Social Cost
XVI. PublicConsultation
Public Consultation both in Local and National Level should be carried out. Thepublic participation process is critical in ensuring public review and input into theEIA process. Some of the authorities to be engaged include: Department of
81

Environment, Forest Depaftment, Water Development Board, BIWTA, ChittagongPort Authority, RHD, PWD, DPHE, Bangladesh Parjatan Corporation, Department ofFisheries, LGED, other nationai/local departments where deemed necessary, LocalAdministrations (DC, LNO, UP Chairman & Members), Community BasedOrganisations, Non-Govemmental Organisations, Business Unions, Farmers' Unions,
The project authoriq' must provide a detailed Public Participation Plan, which shallinclude. but not be limited to the following: A timetable for communication, detailingwho will be consulted and why; as a minimum, one public meeting should be heldduring the Scoping phase and one public meeting during the impact assessment phase(although this number might be increased due to the width of the study area). Thetiming of these meetings would be decided upon in conjunction with relevantstakeholders; ensure that the public participation process complies with the relevantEIA regulations; compile minutes of the meetings and send to all participants andorganise appropriate feedback mechanisms for public comment.
6 Z

Appendix 2
Original letter to BPDB

1
February 5, 2012 Bangladesh Power Development Board (BPDB) Coal Power Generation Company (CPGC) Subject: Recommendations on the TOR of IEE/EIA of proposed 8,320 MW coal based and LNG based thermal power plant at Maheskhali Dear Mr. Azizur Rahman
JICA Study Team for “Data Collection Survey on Coal Power Master Plan Follow-up in the People’s Republic in Bangladesh” would like to make the following recommendations regarding the TOR of IEE/EIA of proposed 8,320 MW coal based and LNG based thermal power plant at Maheskhali: 1. Scope of the Project (1) Since the 8,320 MW project is a long-term and large-scale plan and may have significant
environmental impacts, the project should be implemented in phases. Hence, the JICA Study Team would like to recommend to start from 600 MW x 2 coal-based power plant, and adjust the scope of the IEE/EIA accordingly. The basic components of the 600 MW x 2 coal-based power plant are: 600 MW x 2 coal power plant (400 x 700 m) Coal stockyard (400 x 700 m) Ash pond (1,000 x 500 m) Coal unloading berth for 80,000 DWT ships Navigational channel (-15 m) Transmission line (400 kV to Chittagong)
2. Analysis of alternative sites (1) The project site should be determined after a comprehensive analysis of potential
alternative sites. The Study Team recommends north Maheshkahli, south Maheshkahli and Matabari as potential sites (see attached Figure 1 for the locations). Among others, the following factors should be considered in the analysis: Impacts on endangered species (e.g. migratory birds, sea turtles, dolphins) Impacts on protected areas and ecologically sensitive areas (e.g. Sonadia ECA,
reserve forest, mangroves, mudflats) Impacts on social environment (e.g. land use, resettlement, livelihood) Location of other planned projects (e.g. LNG terminal project in Maheshkahli) Construction cost Requirement of maintenance dredging Difficulty of construction Operational efficiency Potential for future expansion
(2) As part of the above analysis, natural condition survey should also be conducted to
understand seabed sand movement of the area, which will be important for assessing the requirement of maintenance dredging. Following are recommended surveys: Bathymetric survey (once each in dry and wet seasons, and after cyclone)

2
Particle size analysis of seabed sediment (once each in dry and wet seasons, and after cyclone)
Suspended solid (SS) concentration of mid and bottom layers. (once each in dry and wet seasons, and after cyclone)
Visual observation of wave, current and turbidity dispersion after cyclone Figure 2 shows recommended survey boundary and sites.
3. Baseline environmental survey of EIA (1) Baseline environmental survey should cover at least over an area of 10 km radius from
the project site. (2) Baseline environmental survey for the marine component should at least include
seawater quality, marine sediment quality and marine flora/fauna (e.g. mangroves, benthos, fish, marine mammals).
(3) Baseline environmental survey should be conducted during both dry and wet seasons, for parameters that have seasonal variation (e.g. seawater quality, marine flora/fauna).
(4) Detailed survey should be conducted on endangered species that are known to be present in the Maheshkahli area (e.g. migratory birds, sea turtles and dolphins). The survey should especially consider the following: Location of important wintering areas and wintering seasons of endangered
migratory birds (e.g. Spoon-billed sandpiper, Nordmann’s greenshank, Great Knot) Nesting season and important nesting areas of sea turtles Important habitats of dolphins
We sincerely hope that you carefully consider our recommendations and please do not hesitate to ask if you have any questions or comments. Genshiro Kano, JICA Study Team Leader Tokyo Electric Power Company (TEPCO), Tokyo, Japan Tel: +81-3-6373-5584, Fax: +81-3-3596-8599 E-mail: [email protected]

3
Figure 1 Recommended potential sites for 660MWx2 project

4
Figure 2 Survey boundary and sites for the natural condition survey

Appendix 3
Response from CEGIS

f +J t^ I Q pgnter-for Environmenlol ond Geogrophic Informofion servicesL = Lr | ) nis[: dil# ! ti'Ar# 3,'g# f ifi *],,,%lBl,,,n no., nThe Project DirectorChinagong and Khulna 1300 X 2 M.W Coal based TpSC projectBangladesh Power Development BoardBiddut Bhaban. Level-9. Room no_9i3l- \aivab Abdul Gani Road, Dhaka_1000
Our ref:Your ref:Subject:
Dear Sir.
42 .06 .2626. I05 .4 L00t . I2_ I783 8 ] /C E/C & K C BPSCP/BP D B/2 O 1 2Suggestion on IEE and EIA of Maheshkhali
Date: 20 February 2012Dated: 16.12.2012
LNG and Coal based power planl
la response to your above reference' we are pleased to inform that a team of experts has already been mobilizedour team for conducting IEE and EIA of the subject r.ntion.o p."i..r. iv{eanrvhile. the Inception Report has beenprrepared and submitted as per contract. The ,team i; ""*
prJp"""s_r". .urruing or, t*"tine survey andcollecting all relevant information from availabt. ,."onJuf !ori."..-pt.*r not.-that. the detail survey foran-ironmental assessments including the 1'opographical Survey', G.egrechnical Investigation depend on finalconfirmation of the project. boundJry. The project boundary pio.,rided from your end is attached herewith{'nrsachment-1)' In the inception, report some conitrains.elateito proposed pro.iect area has been pointed out: 1)ea overlapping with proposed Deep Sea Port Development area. i) acquisition of 'aluable agricultural land andia;rd potential for development of settlement in futurg. yo, ur.'th..efore requesteo to .onRrm the project areamci its boundary considering the revision (if needed) so that \\,e can start detaif baseline survey and topographical*rr'e-Y-' Similarly' tentative locations of bore holes (i0 nor; ,"n.r" geotechnical investigations are to be made areaLo needed from your end.
H""*rrlf _)iri\^*"1:: *:^:."",1i*_ y. ih. .r-l_*:.:lion v.ide your ofnce memo no 381/CE/C&KcBPscp/BpDB/2,r2 dated I6 02.20I2 inJ"nJr.,ing rlfEra "ivof lvlaheshkhali Thermal porver plant. We would
. q . oq f v . uz . zu l z l n conquc l l ng l tiike to assure you that your suggestions. rvhich are c ible rvi
responses on the given suggestions areprcenred in the table below:
.\'
comparatlve anal,vsis betrveen two sites might i!.qqr
SLNo.
I
fnstruction
A l fe rnq f i 'o . i+^ ^
CEGIS'Remarks
:/:
: : ' .aI n
lnrrrpacls on enoangered species (e.g. migratory birds,sea tuftles, dolphins)
Thanalysis as well as imoact assessmenr
Impacts on protected areas and ecologically sensitiveareas (e.g. Sonadia ECA, reserve forist, mangroves,mudflats)
reseftlement, !ivelihood)
Location of other planned projects (e.g. LNGterminal project in Maheshkhali)
Construction cost
Thanks for your suggestion; *orkine-n tl,esame is in progress. potential imiacts onecological sensitive areas would be considered
This will be duly considered
fhis infonnation is to be rec-ued =flqmppDB-or F easibi I it1, Srudy Team. Cot tectiii-thiGmefrom your office w,ill be inffi6rA€dT*tli;repons. -
This information should huu. to Glr*iGd blBPDB or Feasibility Stud)* team.
Requirement of maintenance dredging
Lrreoglng requlrement assessment is beyond thescope of the study. However. in anotheiongoingstudy- Coal Sourcing. Transportation andHandling. Capital Dredging Requiremenr hasbeen assessed for Hoanok ,it.. we canincorporare tnat
--inrrGiiioil- However.
tel; 880-2-8821 57 0-1, 881 7 648-52fax: 880-2-8855935, BB2312B

Instruction CEGIS 'Remarks
nighr requi re deta i lscope of the studv.
stud1, which is bel,ond the II
Diff iculrr of Construct ion
Operational efficiency
Parlicle size analysis of seabed sedimenr (oncein dry and wet seasons. and after crclone)
Baseline environmental survev should
1, u Consulting Team fbr Enuironmental-lStudies onlr. Enrironmental Ditf icult ies to be i
This information should iave ro bapror,,dA btBPDB or Feasibiliq. Srudr.Team. I
As per ToR- CEGIS s-ill analr-ze particte size ofsea bed r.dircen: ;i tspDB allocares someboreholes lfron: 3fuo: llljgt4 bpruhgl$) in s"ushore area- tr-iilo Ue-r:renrioned t,"r.lTiut. tH,anall'sis migJri ile carried our for shallorver areabut might nor be po:*sitrle in Deep Sea Area. Theanalvsis mig"ht not ix p'ossible in differentsea-tons a-i the srr.rdl is onil for 6 montns.Durin_e $et seasoil the *: condition miqht notbe t-ar,orabie lor such ri orks.
Thanks. ihis ir' i l i t 'e dulr considered
Seasonal variation might nor be possible toexplore bl, this srudv as the srudr is for a totalduration of onlr 6 months. Carn out survey forexplorin_e the seasonal r,ariation rvould bepossible if the duration of rhe studv is extendedand the additional financial suppon for the sameis n ror ided .
eygl an area of 10 km radius from the rotcover
each
at leasts i te
Baseline environmental survey shor-rld be conductedduring both dry and wet seasons. for parameters thathave seasonal var iat ion (e.g. sea\ \ ,a ter qual i t r , . manneflora/fauna).
Potential for future expansion Onl l the land aiai labi t in in t i r r , ,1earO *outObe possible ro frarne this crirerion.
As a par t of the above analys is ,seabed sand movement of themaintenaqce dredging. Follon.in are rqlommended sun-el-s:
natural condition su'' 'ev shourd arso be .ooau"t"olo ,rno..stanoarea, n-hich xill be important for assessing the requirement of
Bathymetric survey (onceseasons. and after cyclone)
As pr ToR- Barhlmetric lnformation will becollecred irom Bll\TA. Baneladesh Navy orotirer ayaiiable sources. These mentionedorganizanion-s cair\ oui Bathlmetric Survey in\{ah*h-khali -{rea in each j-5 lears inteival.These inibrrxaiion rrill be collecred. analyzedani incorpora:ed in the Report.The- sugested s,.lr\.e\- needs algg5!__arc-lrglsrudv provided additional financial r"rot,.."r.rlhich is nor i;*ltdeC in ihis ToR of IEE,€IA.
Suspended solid (SS) .on..ntribottom layers' (once each in dry and wet seasons. and i onil' tn-"a seasol a.s rhe srudr. is onlv for 6a f t s ' ^ . ^ l ^ - . - \s r r v r r l u l u l l s l : _ ^ - + L -. I l l u l t t t L \ .
Visual observation of wave, cunent anddispersion after cyclone Figure 2recommended survey boundary and sites.
Oceanographic sun'e1 is irer-onci rt. rt,. so-;--r--s-+--:j-- :.lt-:1Jlru ule tne- TgpjoilEe seFGesl6"'a"oT,in;-TbR. HoiGver,data from avaiiable secondan sources will becollected anci incoroorared in rhe report. Thementioned Figure-2 uas missing rvith the letter,Please s_elld u,s rhe fisure-1.
Baseline environmental survey of EIA
Baseline environmental survey f- th. ,"*i".component should at least include seawater qualitv.marine sediment quality and marine flora/fauna Thanks. this uill be duir considered
benthos, fish, marine mammals
arry

,/ ) sl.'r j xo.
Yours
Inst ruct ionCEGIS 'Remarks
?-.^t:,']:O :u r.u.), tl-r o u t a U. .o,ra L,.r.L. .nd
""L. r.d
species that are known to be present Ir ' , vw rvJ L r ra r o r c K rown I o be p resen t i n t heMaheshkhali area (e.g. rnigratory birds. sea turtles.dolphins) . The survey should especia l ly .onside, thetb l lon, ing:
sea turtles. Important habitats of dolphin
Executive Director. CEGIS
Locat ion of important rv inter ing areas and winter ing Thanks. this rvi l l be dLrly considered
::.To.n, of endangered migratory birds (e.g. Spoonlbilled wndpiper. Nordmann's
- gr..nrhun"i<. /great rKnor). Nesting season and importint nestlng areas of
In addition' cEGIS tu99t:]t revising the alternative sites menrioned in the ToR. ToR, names Anwara, chittagongand Hoanok' Maheshkhali as alteiatives sites. cEGIS feels- arternative analysis needs to be ca*ied out in,X'JHX:i11il'fil$J;Ll:l[] iitJrffi
*" r,"' .r* o"i"r.a in trre rnceiti"" n.i"n During discussions
It is to be noted here that the impact identification and assessment completely depend on project information,plans and desi-en' As such we-would r.qu.iil 'ou ro provide feasibilitv srudv repoft of the Maheshkhali g320 Mwcoal and LNG based Power Plant withdetail project inrormation. plans and design. orher*,ise. it would not befi::::f iH,:TffilfitJfii:fff fJt.f:Xr'i'ir" '"p,r.i.o''i''. '^; 'h;,;;;v p.,i"o inciuding.Jaii,"*runder such circumstances, we wourd request you to kindly provide us the followings:
cEGIS' hence you need take ne.tttury initiatives for finali"zation of the report): Study report on LNG sourcing, transporration and handlinf
Thanking you in anticipation or your best endeavor and assure you ofour best services.
With best regards,
-{r,./Giasuoaii
*