dark & bright sides of global warming jim hansen
TRANSCRIPT

The Threat to the Planet* Dark & Bright Sides of Global Warming
Jim Hansen
3 October 2007
presented at conference: Heating Up the Energy Debate
Gustavus Adolphus College St. Peter, Minnesota
*Any statements relating to policy are personal opinion
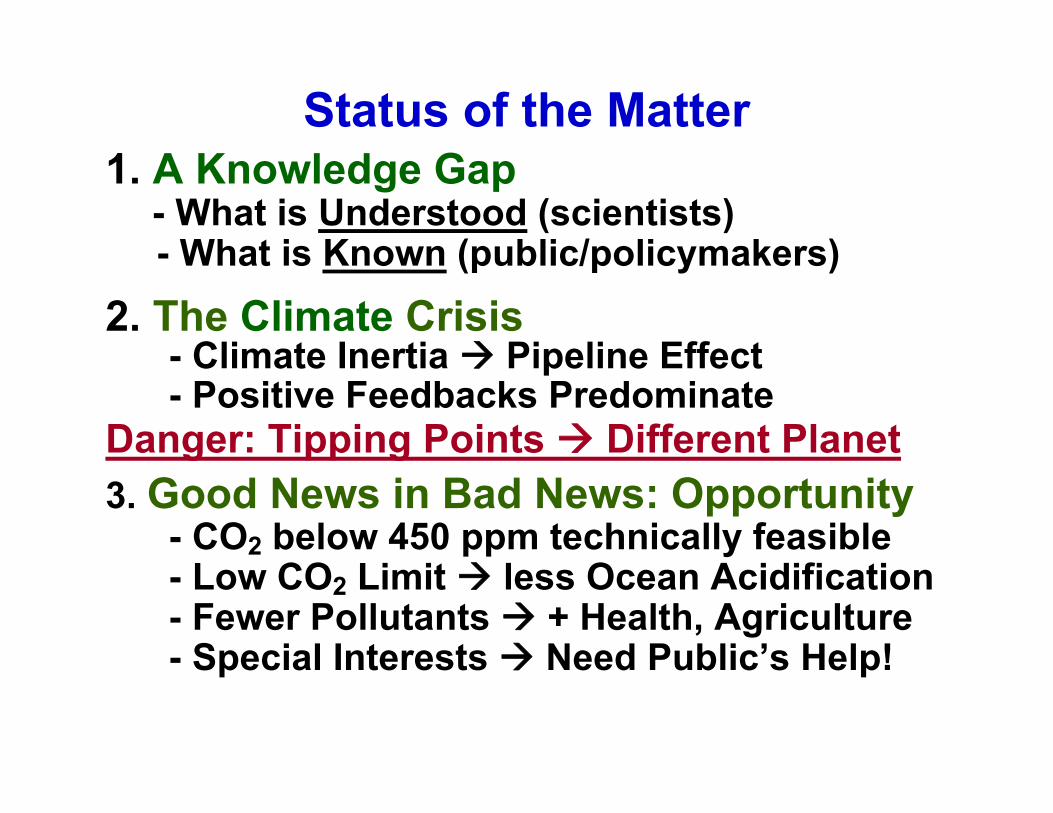
Status of the Matter1. A Knowledge Gap
- What is Understood (scientists)- What is Known (public/policymakers)
2. The Climate Crisis- Climate Inertia Pipeline Effect- Positive Feedbacks Predominate
Danger: Tipping Points Different Planet3. Good News in Bad News: Opportunity
- CO2 below 450 ppm technically feasible- Low CO2 Limit less Ocean Acidification- Fewer Pollutants + Health, Agriculture- Special Interests Need Public’s Help!


Warming in the Pipeline?Tipping Points?
Isn’t this just some sort of “theory”?
Really need to wrestle with warming?There were huge climate changes in past,
who are we to say present climate is the best?

Earth’s history provides most important information on global warming.
Recorded human history occurs within the Holocene warm period.

Temperature, CO2 and Sea Level
Fig. .3a. “Climate change and trace gases”, Hansen et al. Phil. Trans. Roy. Soc. A, 365, 1925, 2007
Sea level variations ~400 feet; unusually stable for past 7000 years.
Atmospheric CO2 variation due to exchange among surface reservoirs.
Drive for these large climate change is perturbations of Earth’s orbit.

Continental Drift
Fig. 1 “Global Warming: East-West Connections”(adapted from Keller&Pinter, 1996)

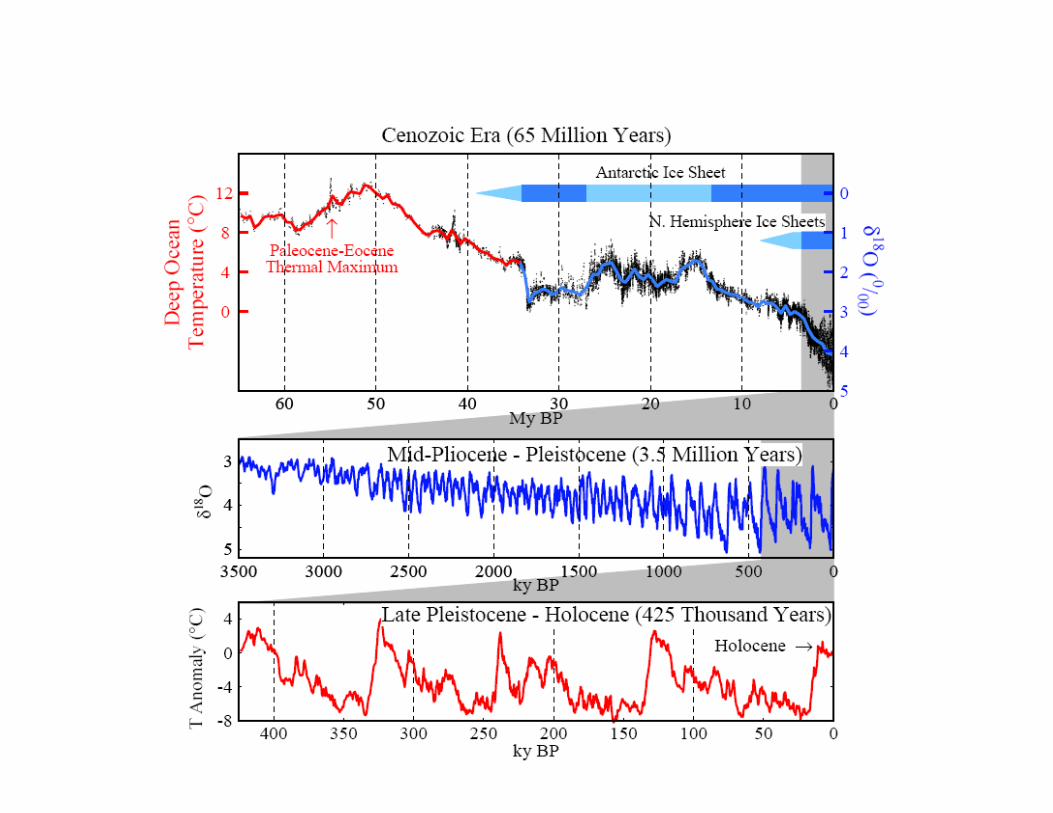
Cenozoic Era
65 Million Years Ago Present DayGlobal climate forcings: external, within atmosphere, surface.External: solar irradiance +1 W/m2
Surface: < ~1 W/m2
CO2 changes: order of 10 W/m2

Summary: Cenozoic Era1. Dominant Forcing: Natural ΔCO2
- Rate ~100 ppm/My (0.0001 ppm/year)- Human-made rate today: ~2 ppm/year
Humans Overwhelm Slow Geologic Changes
2. Climate Sensitivity High- Antarctic ice forms if CO2 < ~500 ppm- Ice sheet formation reversible
Human Could Produce “A Different Planet”


CO2, CH4 and temperature records from Antarctic ice core dataSource: Vimeux, F., K.M. Cuffey, and Jouzel, J., 2002, "New insights into Southern Hemisphere temperature changes from Vostok ice cores using deuterium excess correction", Earth and Planetary Science Letters, 203, 829-843.

Ice Age ForcingsImply Global Climate Sensitivity ~ ¾°C per W/m2.
Source: Hansen et al., Natl. Geogr. Res. & Explor., 9, 141, 1993.

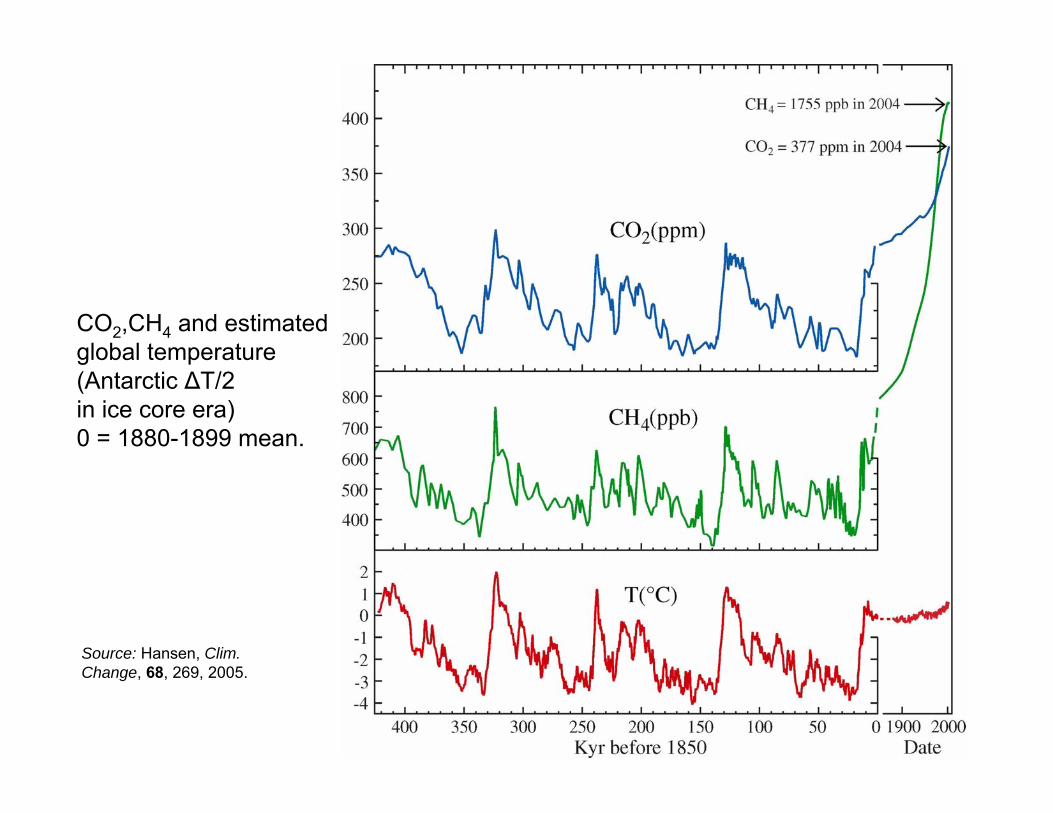
CO2,CH4 and estimated global temperature (Antarctic ΔT/2 in ice core era)0 = 1880-1899 mean.
Source: Hansen, Clim. Change, 68, 269, 2005.

Implications of Paleo Forcings and Response
1. Chief instigator of climate change was earth orbital change, a very weak forcing.
2. Chief mechanisms for paleoclimate change GHGs & ice sheet area, as feedbacks.
3. Climate on long time scales is very sensitive to even small forcings.
4. Human-made forcings dwarf natural forcings that drove glacial-interglacial climate change.
5. Humans now control the mechanisms for global climate change, for better or worse.

Source: Earth's energy imbalance: Confirmation and implications. Science308, 1431, 2005.
(A) Forcingsused to drive climate simulations.
(B) Simulated and observed surface temperature change.

21st Century Global Warming
Climate Simulations for IPCC 2007 Report
► Climate Model Sensitivity 2.7-2.9ºC for 2xCO2(consistent with paleoclimate data & other models)
► Simulations Consistent with 1880-2003 Observations(key test = ocean heat storage)
► Simulated Global Warming < 1ºC in Alternative Scenario
Conclusion: Warming < 1ºC if additional forcing ~ 1.5 W/m2
Source: Hansen et al., to be submitted to J. Geophys. Res.

United Nations Framework Convention on Climate Change
Aim is to stabilize greenhouse gas emissions…
“…at a level that would prevent
dangerous anthropogenic interference with the climate system.”

Metrics for “Dangerous” ChangeIce Sheet Disintegration: Global Sea Level
1. Long-Term Change from Paleoclimate Data2. Ice Sheet Response Time
Extermination of Animal & Plant Species1. Extinction of Polar and Alpine Species2. Unsustainable Migration Rates
Regional Climate Disruptions1. Increase of Extreme Events2. Shifting Zones/Freshwater Shortages

Increasing Melt Area on Greenland
• 2002 all-time record melt area • Melting up to elevation of 2000 m• 16% increase from 1979 to 2002 70 meters thinning in 5 years
Satellite-era record melt of 2002 was exceeded in 2005.Source: Waleed Abdalati, Goddard Space Flight Center
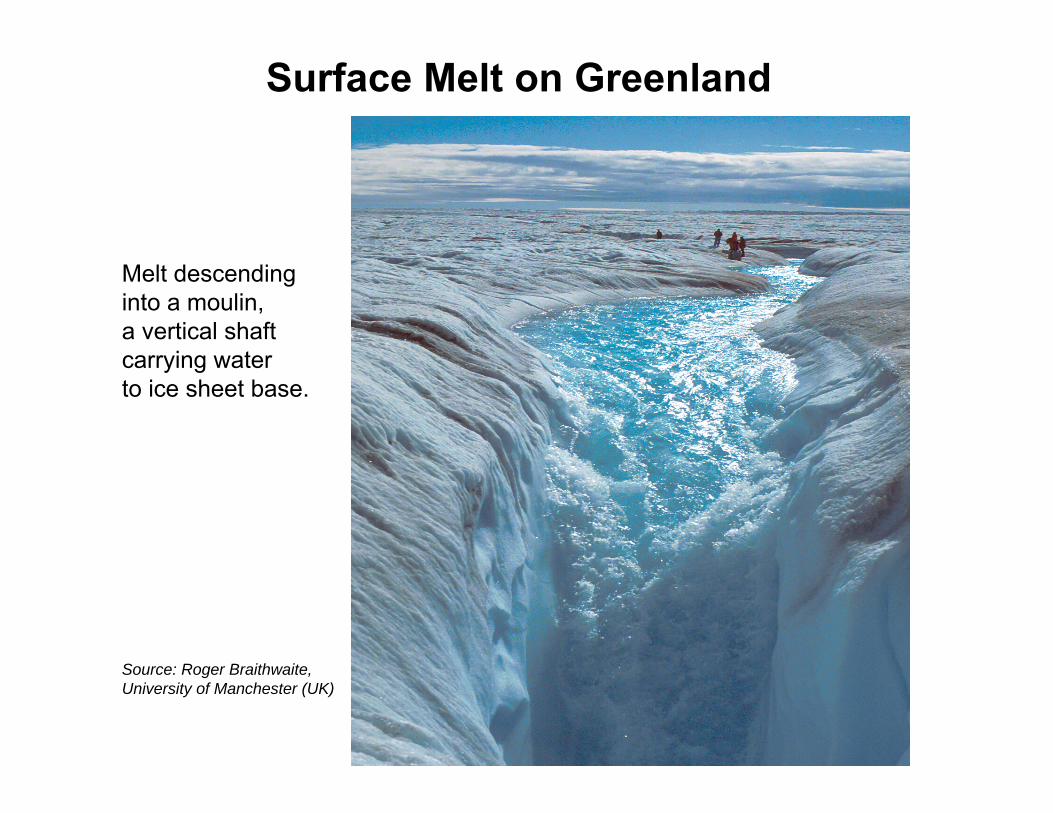
Melt descending into a moulin, a vertical shaftcarrying water to ice sheet base.
Source: Roger Braithwaite, University of Manchester (UK)
Surface Melt on Greenland
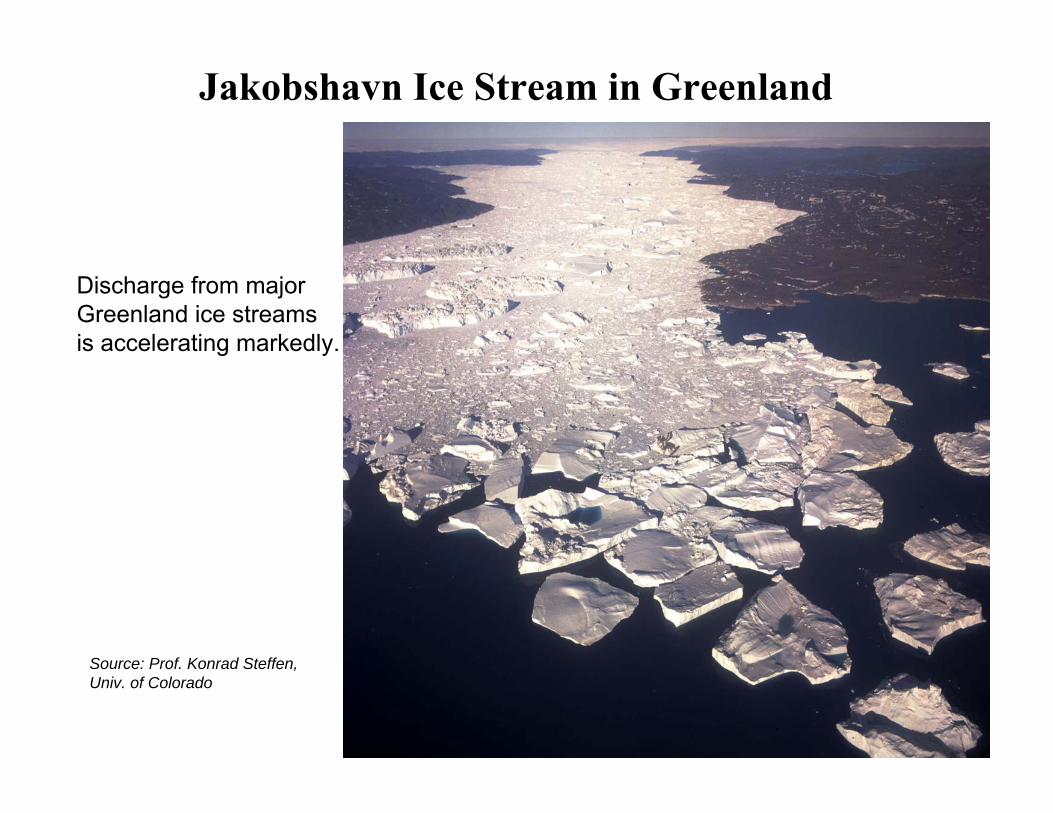
Jakobshavn Ice Stream in Greenland
Discharge from major Greenland ice streams is accelerating markedly.
Source: Prof. Konrad Steffen, Univ. of Colorado
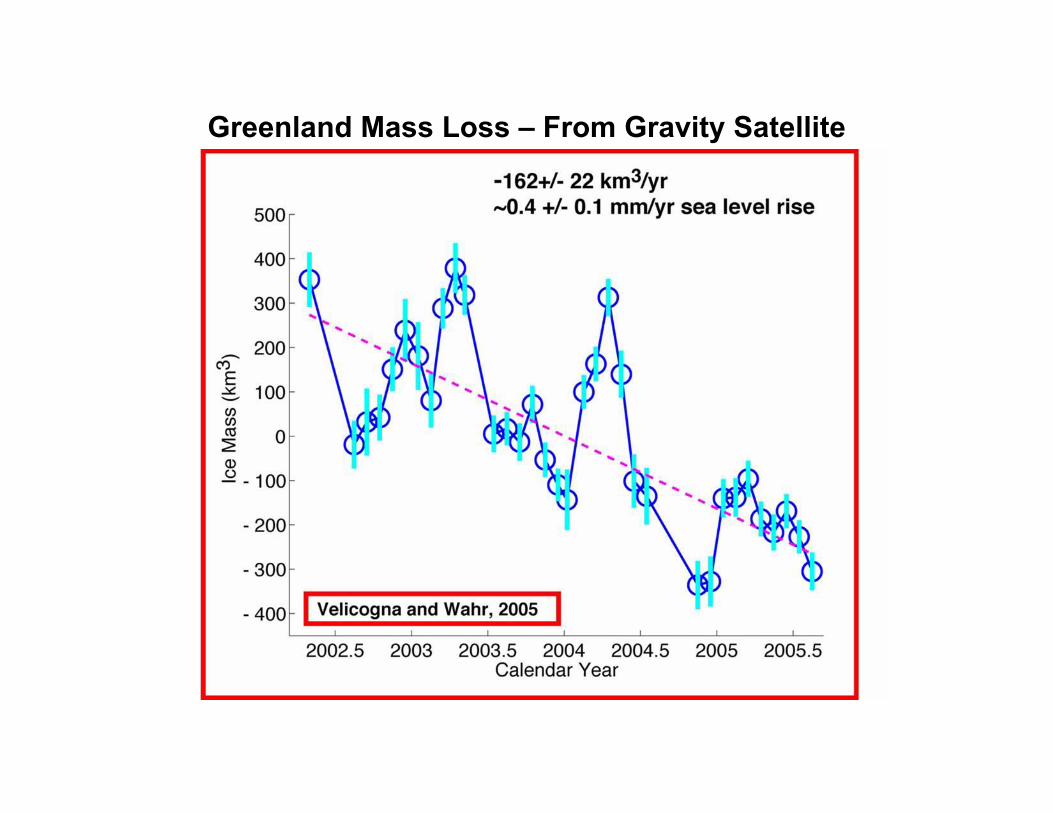
Greenland Mass Loss – From Gravity Satellite

Areas Under Water: Four Regions

Paleo and Modern Temperatures in Critical Global Regions

Lake Wobegone
Lake from indicated 200-meter high dams holds 1 meter sea level

Lake Wobegone II
Lake from indicated 242-meter high dams holds 1 meter sea level

Images:Sea Ice: Claire Parkinson & Robert TaylorPolar Bears: Unknown
Future loss of Arctic sea ice could result in a loss of 2/3 of the world's polar bears within 50 years.
Source: U.S. Geological Surveywww.usgs.gov/newsroom/special/polar%5Fbears/
Arctic Change:
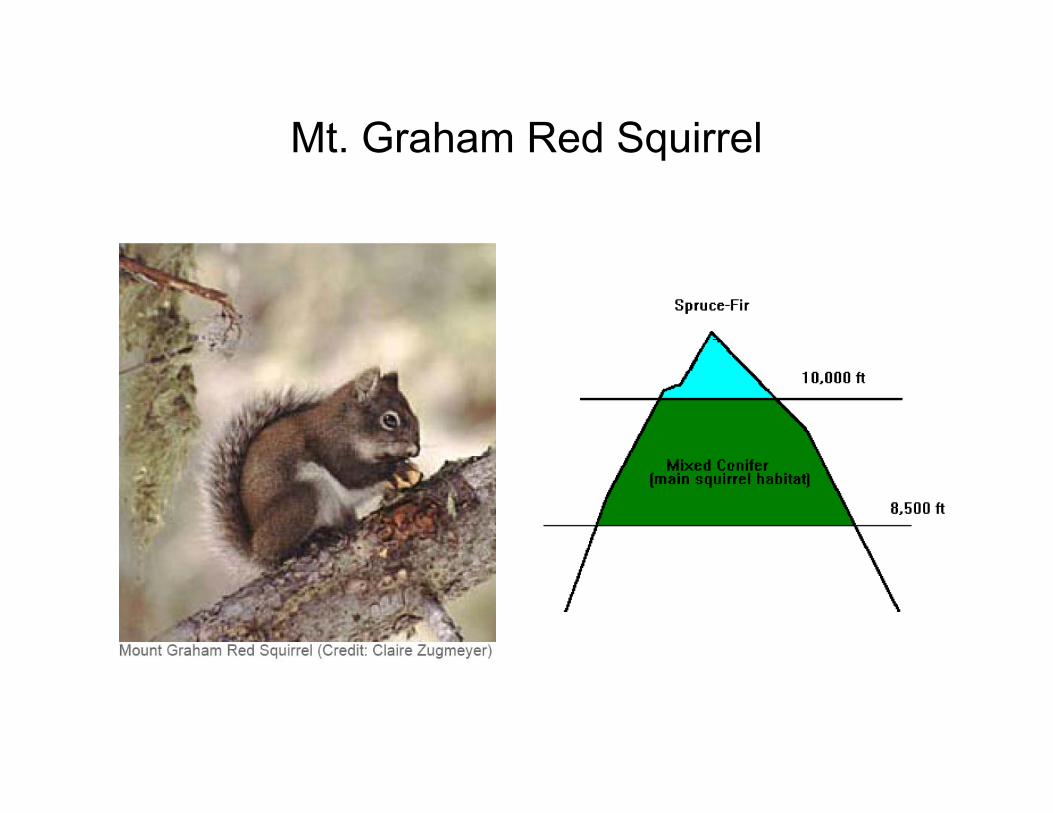
Mt. Graham Red Squirrel

Survival of Species1. “Business-as-Usual” Scenario
- Global Warming ~ 3ºC - Likely Extinctions ~25-50 percent
2. “Alternative” Scenario- Global Warming <1ºC - Likely Extinctions <10 percent
How Many Species to Survive Bottleneck?Climate Feedbacks Scenario Dichotomy

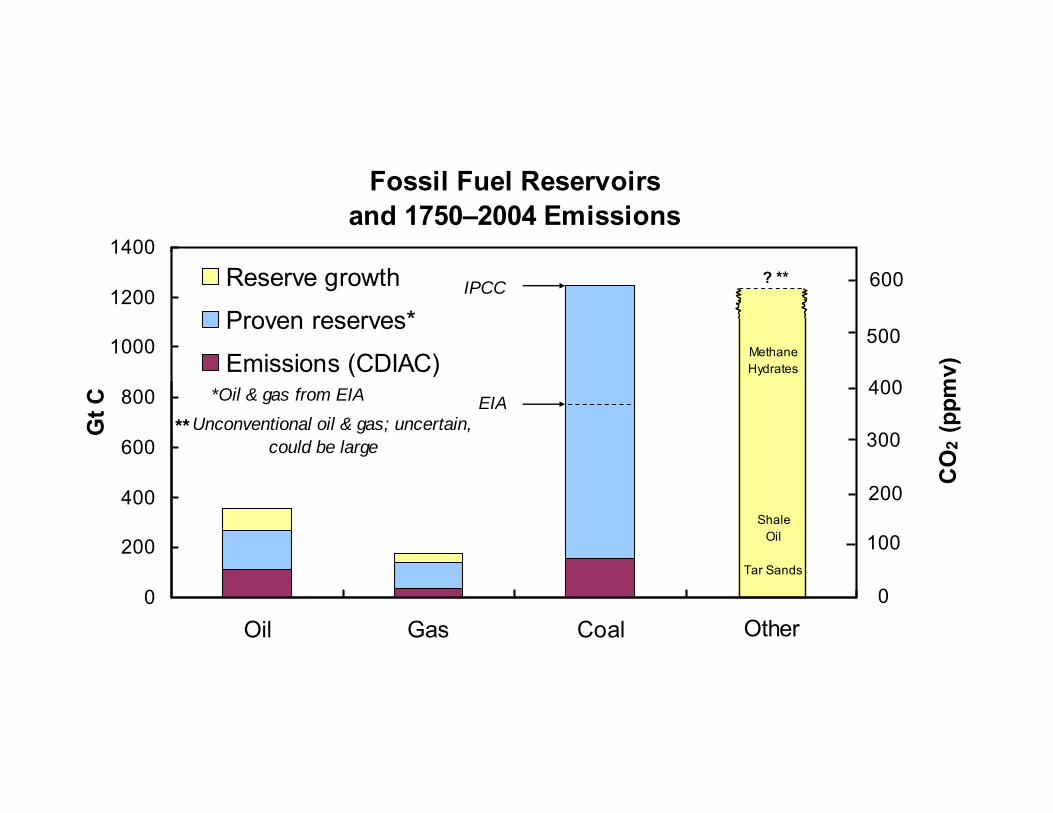
Fossil Fuel Reservoirs and 1750–2004 Emissions
0
200
400
600
800
1000
1200
1400
Oil Gas Coal
Gt C
Reserve growth
Proven reserves*
Emissions (CDIAC)EIA
IPCC
CO
2 (p
pmv)
600
400
200
100
300
0
500
*Oil & gas from EIA
** Unconventional oil & gas; uncertain, could be large
Other
MethaneHydrates
Shale Oil
Tar Sands
? **

Outline of Solution
1. Coal only in Powerplants w SequestrationOld Technology ‘Bulldozed’ in Decades
2. Stretch Conventional Oil & GasVia Incentives (Cap or Tax) & StandardsNo Unconventional F.F. (Tar Shale, etc.)
_________________________________________________________________________________________________________________________________________________________
3. Reduce non-CO2 Climate ForcingsMethane, Black Soot, Nitrous Oxide
4. Draw Down Atmospheric CO2Agricultural & Forestry PracticesBiofuel-Powered Power-Plants


Summary: Is There Still Time?Yes, But:
Alternative Scenario is Feasible,yielding a healthy, clean planet.- But It Is Not Being Pursued
Action needed now. A decade of Business-as-Usual eliminates Alternative Scenario

Update of Figure 10(e) of “Dangerous human-made interference with climate”
1751-2006 Cumulative Fossil Fuel CO2 Emissions

Per Capita Carbon Emissions
Update of Figure 10(g) of “Dangerous human-made interference with climate”


Ozone Success Story
↑1. Scientists: Clear warning
↑2. Media: Transmitted the message well
3. Special Interests: Initial oposition, but forsook disinformation, pursued advanced technologies
↑↑4. Public: quick response; spray cans replaced; no additional CFC infrastructure built
↑5. Government: U.S./Europe leadership; allow delay & technical assistance for developing countries
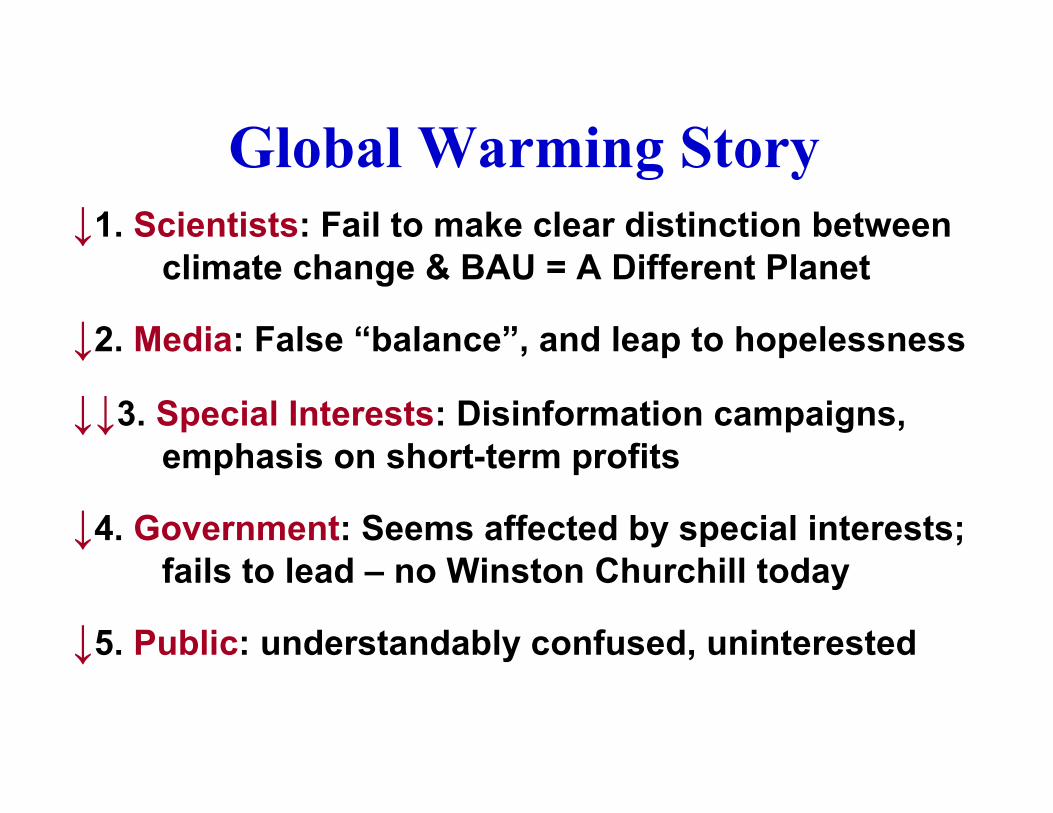
Global Warming Story
↓1. Scientists: Fail to make clear distinction between climate change & BAU = A Different Planet
↓2. Media: False “balance”, and leap to hopelessness
↓↓3. Special Interests: Disinformation campaigns, emphasis on short-term profits
↓4. Government: Seems affected by special interests; fails to lead – no Winston Churchill today
↓5. Public: understandably confused, uninterested
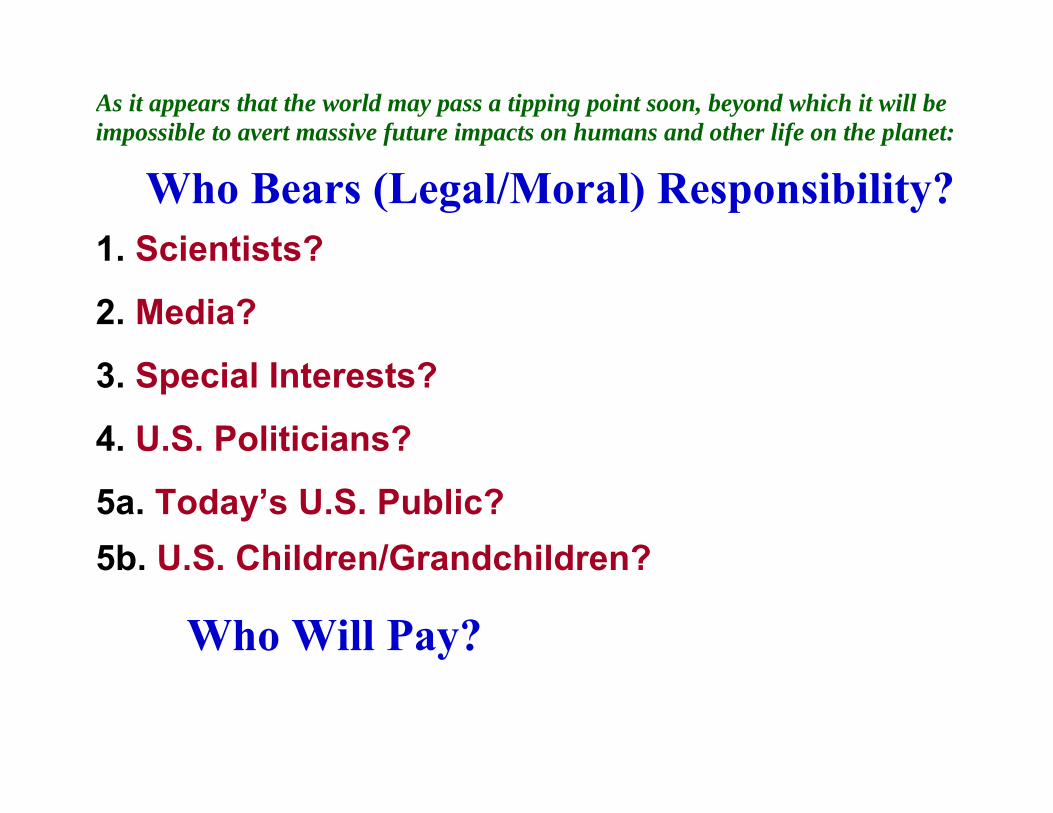
As it appears that the world may pass a tipping point soon, beyond which it will be impossible to avert massive future impacts on humans and other life on the planet:
Who Bears (Legal/Moral) Responsibility?
1. Scientists?
2. Media?
3. Special Interests?
4. U.S. Politicians?
5a. Today’s U.S. Public? 5b. U.S. Children/Grandchildren?
Who Will Pay?

Urgent Action Needed:
Moratorium on New Coal PowerplantsPlant Lifetime ~ 50-75 YearsSequestration Technology ~10 Years AwayEfficiency, Renewables in InterimNeed to Remove Barriers to Efficiency
Citizens Must Stand UpCoal Industry is Very PowerfulCongress Unlikely to Act Decisively

Declaration of Stewardshipfor the Earth and all Creation
1. Moratorium on Dirty CoalI will support a moratorium on coal-fired power plants that do not capture and sequester CO2 .
2. Price on Carbon EmissionsI will support a fair, gradually rising, price on carbon emissions, reflecting costs to the environment. Mechanisms to adjust price should be apolitical and economically sound.
3. Energy and Carbon Efficiency IncentivesI will support legislation to reward utilities and others based on energy or carbon efficiencies rather than the amount of energy sold.

Summary1. Climate Situation Clear, but not Communicated
Tipping Points near, Potential to lose controlMust draw down CO2 & reduce other forcings
2. Struggle Against IgnoranceSome progress recentlyMisconceptions are shockingInappropriately political
3. Struggle Against GreedSpecial Interests guarding short-term profitsMust draw attention to generational inequityWatch deeds, not words