daniel mugnier – palma de mallorca,...
TRANSCRIPT

IEA T
ask
53 6
thm
eetin
g –
Palm
a 10
-11/
10/2
016
IEA SHC Task 53 6th meeting
New Generation Solar Cooling & Heating systems (PV or solar thermally driven systems)
Latest results from French SAC projects : SERM
Daniel MUGNIER – Palma de Mallorca, 10/10/2016

IEA T
ask
53 6
thm
eetin
g –
Palm
a 10
-11/
10/2
016Targeted building description
Existing Building block in ZAC Jacques Coeur in Port Marianne area (Montpellier, France, built in 2010)
2 parts : building A & B (mini district)
Building A : 11 000 m² for offices and shops
Building B : 10 600 m² with 167 dwellings
Montpellier Heating and System net utilities => System owner
TECSOL : engineering company
Building A view
Buildings situation
AXIMA GDF SUEZ : Company in charge of the works
IEA T
ask
53 6
thm
eetin
g –
Palm
a 10
-11/
10/2
016Load & system strategy
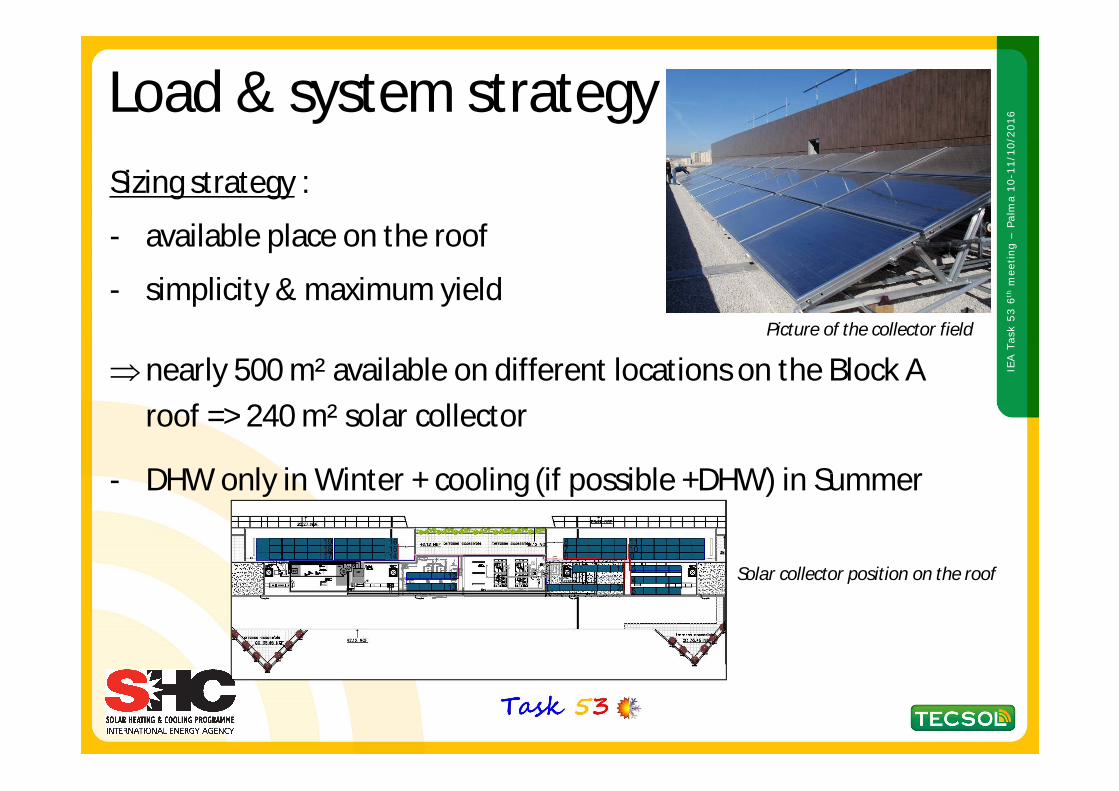
Sizing strategy :
- available place on the roof
- simplicity & maximum yield
nearly 500 m² available on different locations on the Block A roof => 240 m² solar collector
- DHW only in Winter + cooling (if possible +DHW) in Summer
Solar collector position on the roof
Picture of the collector field
IEA T
ask
53 6
thm
eetin
g –
Palm
a 10
-11/
10/2
016
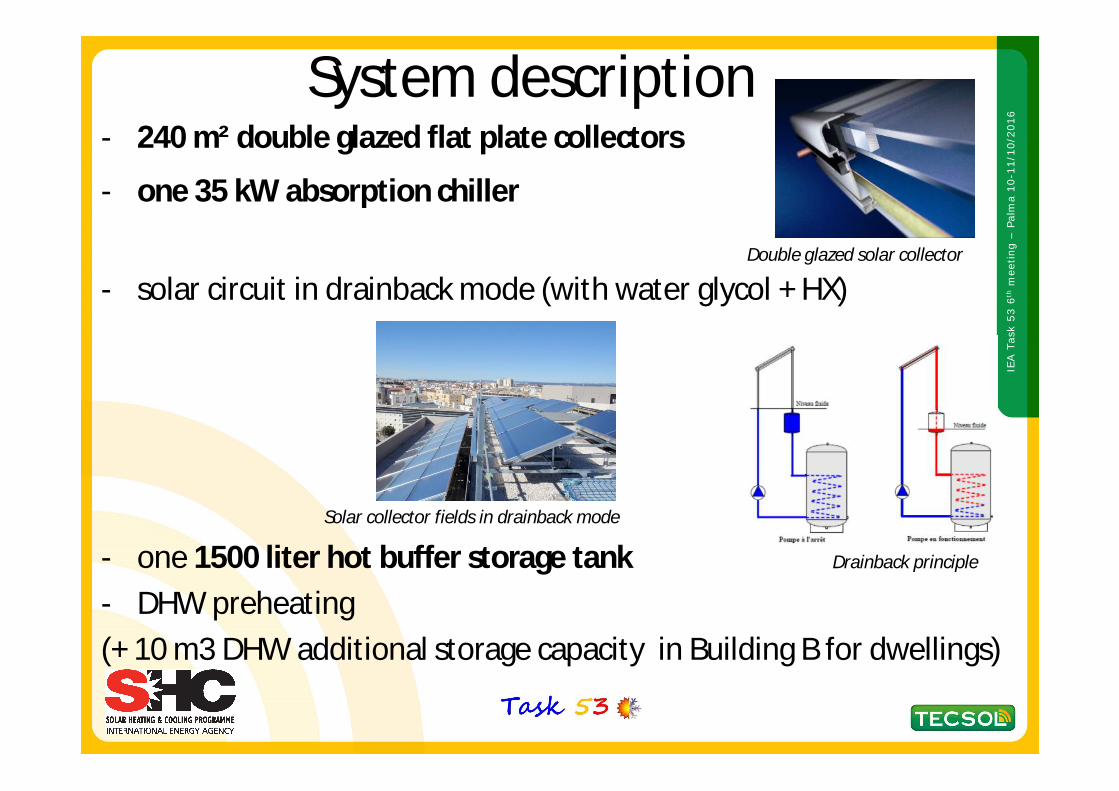
System description- 240 m² double glazed flat plate collectors
- one 35 kW absorption chiller
- solar circuit in drainback mode (with water glycol + HX)
- one 1500 liter hot buffer storage tank- DHW preheating (+ 10 m3 DHW additional storage capacity in Building B for dwellings)
Drainback principle
Double glazed solar collector
Solar collector fields in drainback mode
IEA T
ask
53 6
thm
eetin
g –
Palm
a 10
-11/
10/2
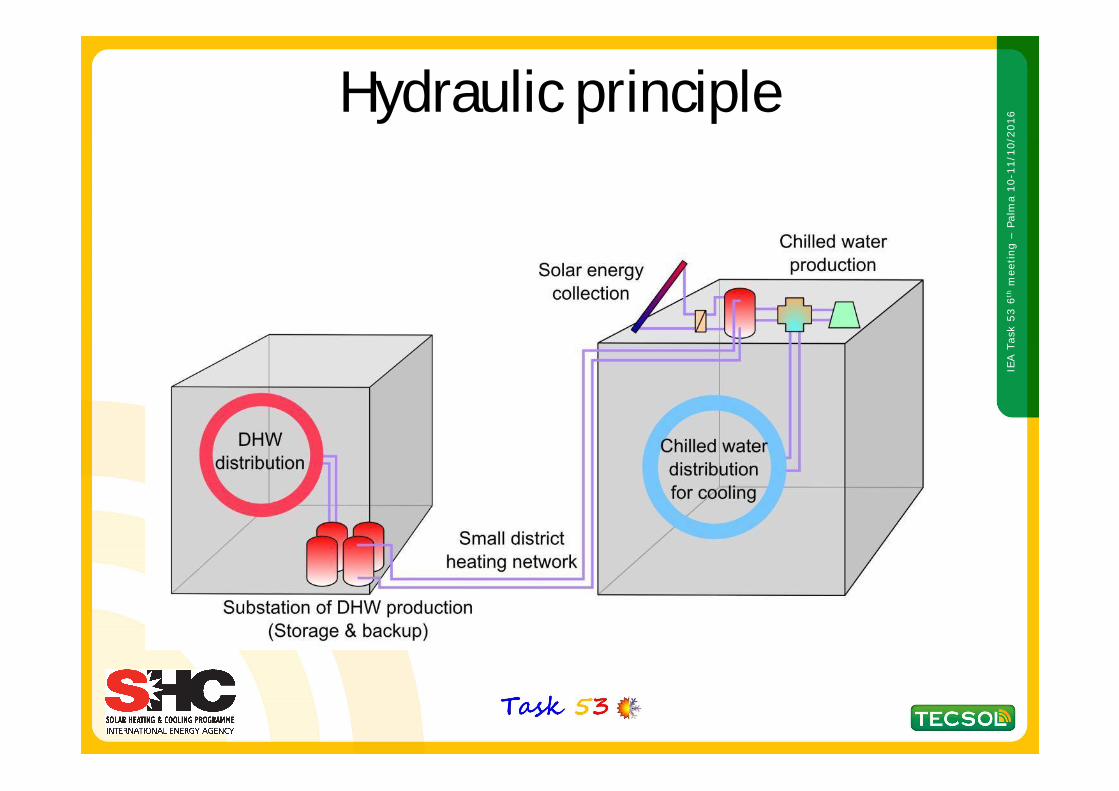
016Hydraulic principle

IEA T
ask
53 6
thm
eetin
g –
Palm
a 10
-11/
10/2
016
Hydraulic scheme
Cold production
Solar productionDHW distribution
Drainback system Anti legionnella adiabatique cooling tower
IEA T
ask
53 6
thm
eetin
g –
Palm
a 10
-11/
10/2
016
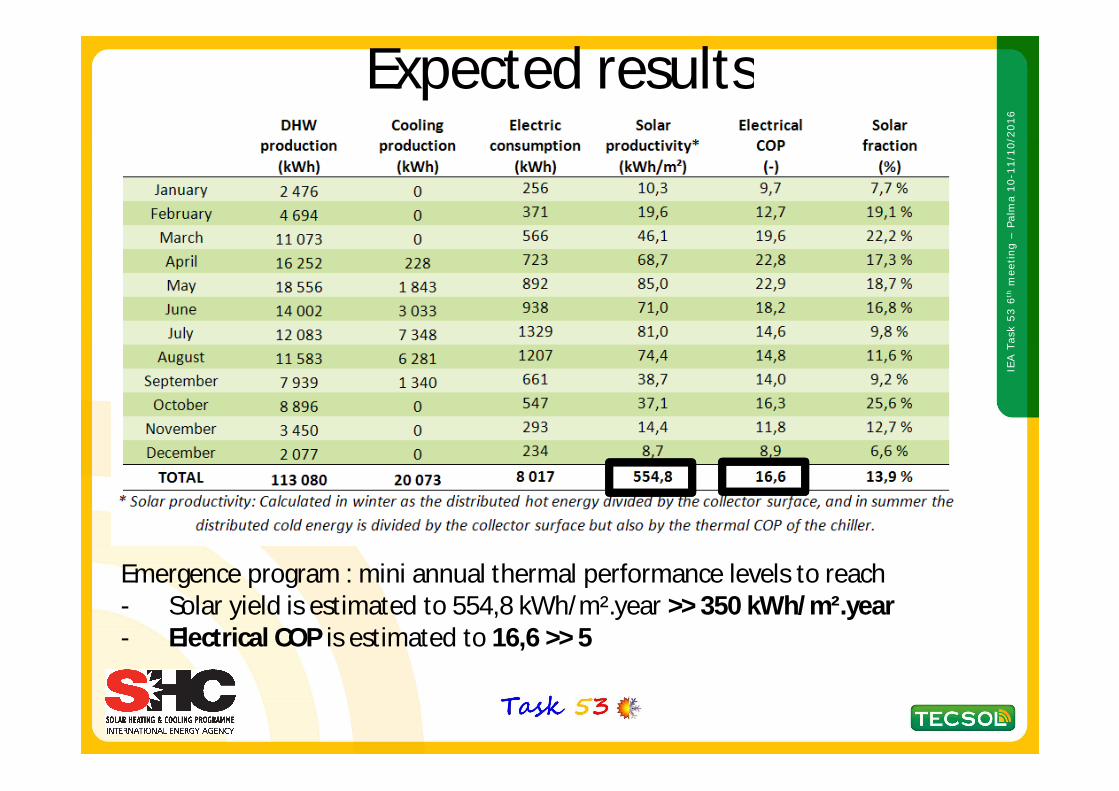
Expected results
Emergence program : mini annual thermal performance levels to reach - Solar yield is estimated to 554,8 kWh/m².year >> 350 kWh/m².year- Electrical COP is estimated to 16,6 >> 5
IEA T
ask
53 6
thm
eetin
g –
Palm
a 10
-11/
10/2
016
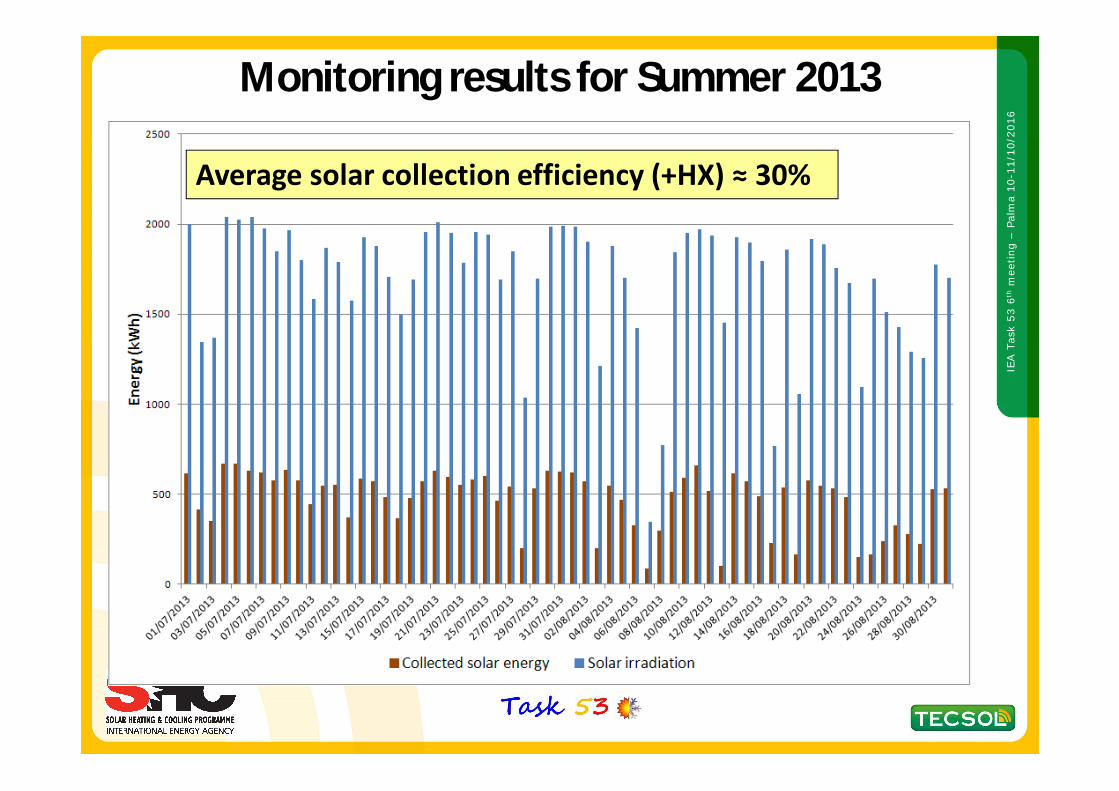
Average solar collection efficiency (+HX) ≈ 30%
Monitoring results for Summer 2013
IEA T
ask
53 6
thm
eetin
g –
Palm
a 10
-11/
10/2
016
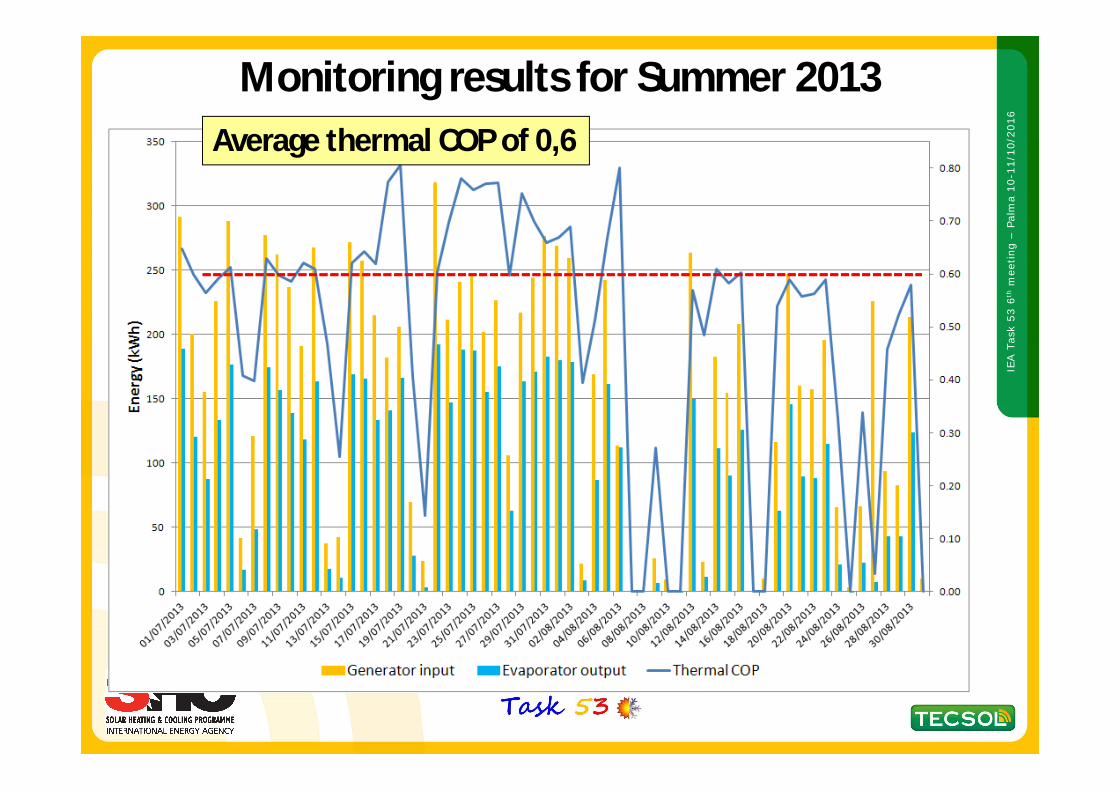
Average thermal COP of 0,6
Monitoring results for Summer 2013

IEA T
ask
53 6
thm
eetin
g –
Palm
a 10
-11/
10/2
016
Average electrical efficiency of 12,3
Monitoring results for Summer 2013
IEA T
ask
53 6
thm
eetin
g –
Palm
a 10
-11/
10/2
016
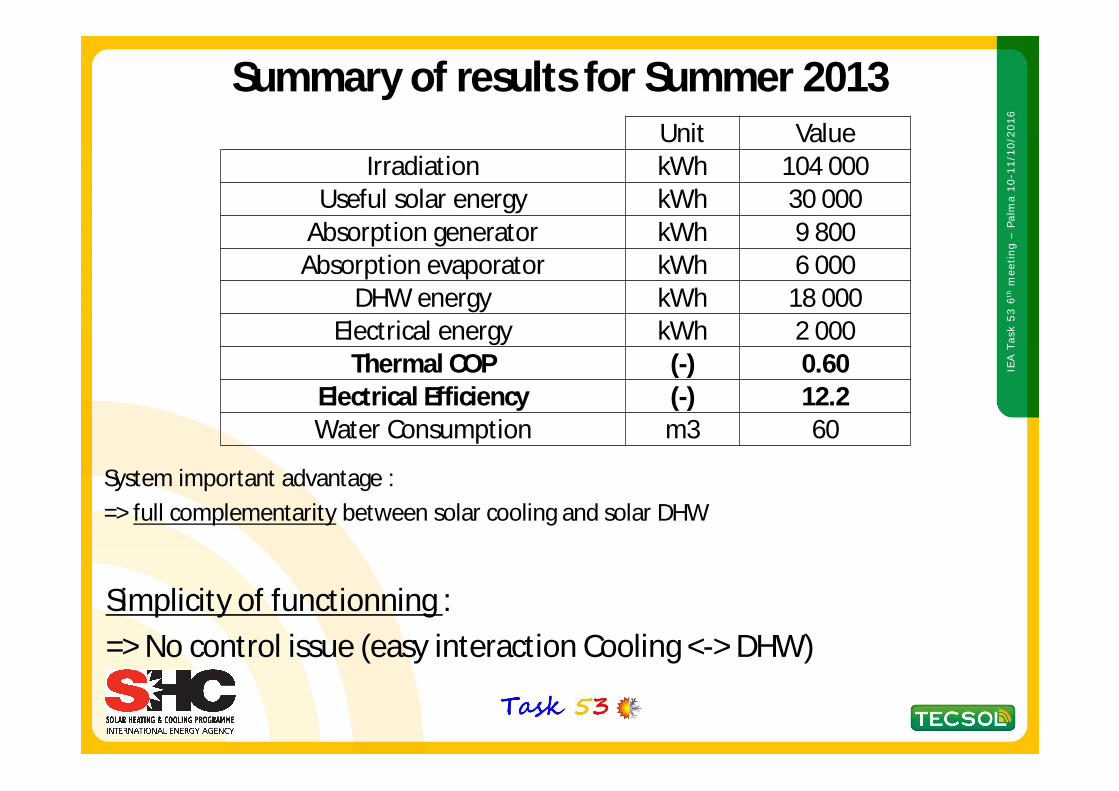
System important advantage : => full complementarity between solar cooling and solar DHW
Unit ValueIrradiation kWh 104 000
Useful solar energy kWh 30 000Absorption generator kWh 9 800
Absorption evaporator kWh 6 000DHW energy kWh 18 000
Electrical energy kWh 2 000Thermal COP (-) 0.60
Electrical Efficiency (-) 12.2Water Consumption m3 60
Simplicity of functionning : => No control issue (easy interaction Cooling <-> DHW)
Summary of results for Summer 2013

IEA T
ask
53 6
thm
eetin
g –
Palm
a 10
-11/
10/2
016
Full year balance (march 2013/ mars 2014)
Global Electrical efficiency of nearly 21 in average for a full yearand a solar yield of 465 kWh/m².year

IEA T
ask
53 6
thm
eetin
g –
Palm
a 10
-11/
10/2
016
Average Thermal COP again of 0,6
Monitoring results for Summer 2014

IEA T
ask
53 6
thm
eetin
g –
Palm
a 10
-11/
10/2
016
Monitoring results for Summer 2014
Average electrical efficiency again of 12
IEA T
ask
53 6
thm
eetin
g –
Palm
a 10
-11/
10/2
016
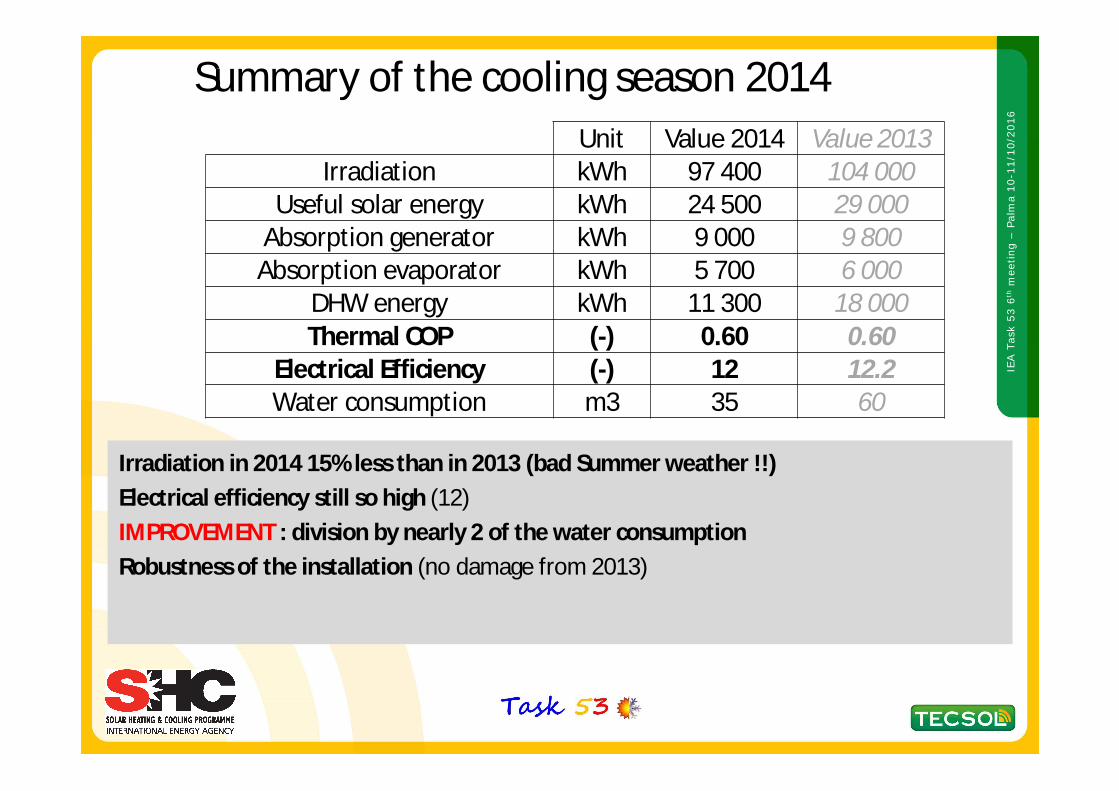
Summary of the cooling season 2014
Irradiation in 2014 15% less than in 2013 (bad Summer weather !!)Electrical efficiency still so high (12)IMPROVEMENT : division by nearly 2 of the water consumption Robustness of the installation (no damage from 2013)
Unit Value 2014 Value 2013Irradiation kWh 97 400 104 000
Useful solar energy kWh 24 500 29 000Absorption generator kWh 9 000 9 800
Absorption evaporator kWh 5 700 6 000DHW energy kWh 11 300 18 000Thermal COP (-) 0.60 0.60
Electrical Efficiency (-) 12 12.2Water consumption m3 35 60

IEA T
ask
53 6
thm
eetin
g –
Palm
a 10
-11/
10/2
016
Summary of the cooling season 2015
Irradiation in 2015 15% less than in 2014 (VERY bad Summer weather !!)Electrical efficiency not so high (7)
Unit Value 2015 Value 2014Irradiation kWh 83 000 97 400
Useful solar energy kWh 20 700 24 500Absorption generator kWh 4 800 9 000
Absorption evaporator kWh 2 800 5 700DHW energy kWh 7 500 11 300Thermal COP (-) 0.58 0.60
Electrical Efficiency (-) 7 12Water consumption m3 200 35
IEA T
ask
53 6
thm
eetin
g –
Palm
a 10
-11/
10/2
016
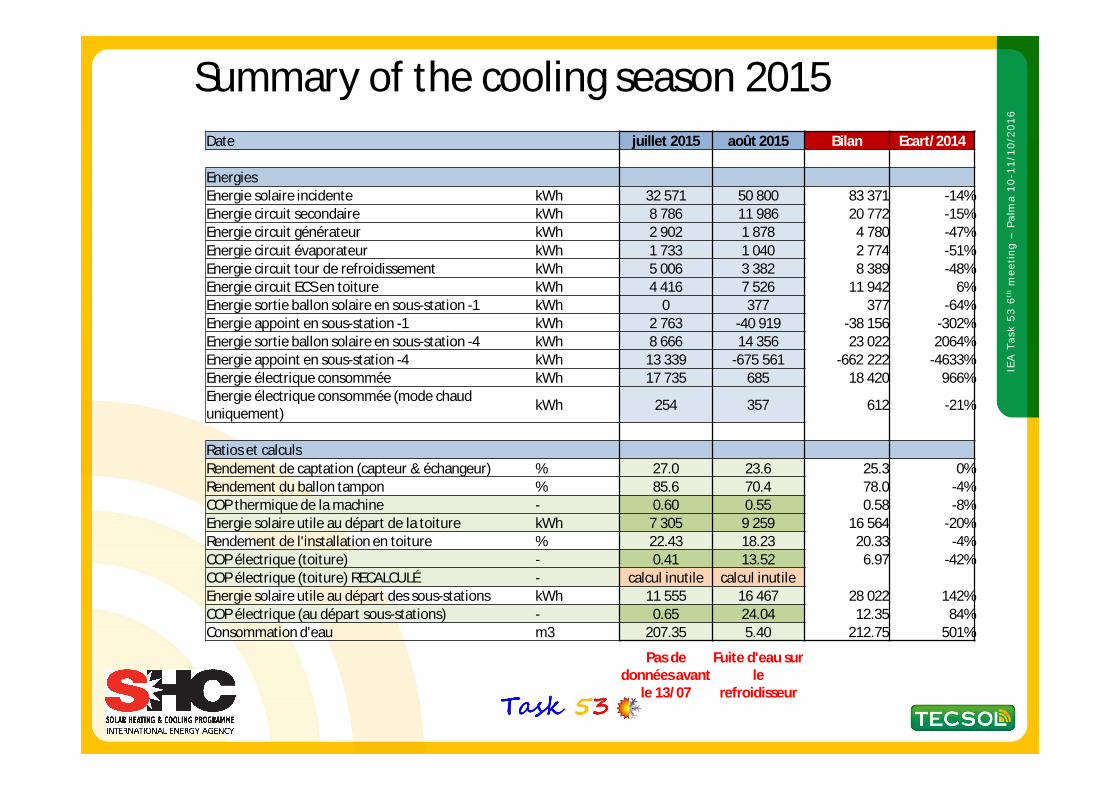
Summary of the cooling season 2015Date juillet 2015 août 2015 Bilan Ecart/2014
EnergiesEnergie solaire incidente kWh 32 571 50 800 83 371 -14%Energie circuit secondaire kWh 8 786 11 986 20 772 -15%Energie circuit générateur kWh 2 902 1 878 4 780 -47%Energie circuit évaporateur kWh 1 733 1 040 2 774 -51%Energie circuit tour de refroidissement kWh 5 006 3 382 8 389 -48%Energie circuit ECS en toiture kWh 4 416 7 526 11 942 6%Energie sortie ballon solaire en sous-station -1 kWh 0 377 377 -64%Energie appoint en sous-station -1 kWh 2 763 -40 919 -38 156 -302%Energie sortie ballon solaire en sous-station -4 kWh 8 666 14 356 23 022 2064%Energie appoint en sous-station -4 kWh 13 339 -675 561 -662 222 -4633%Energie électrique consommée kWh 17 735 685 18 420 966%Energie électrique consommée (mode chaud uniquement) kWh 254 357 612 -21%
Ratios et calculsRendement de captation (capteur & échangeur) % 27.0 23.6 25.3 0%Rendement du ballon tampon % 85.6 70.4 78.0 -4%COP thermique de la machine - 0.60 0.55 0.58 -8%Energie solaire utile au départ de la toiture kWh 7 305 9 259 16 564 -20%Rendement de l'installation en toiture % 22.43 18.23 20.33 -4%COP électrique (toiture) - 0.41 13.52 6.97 -42%COP électrique (toiture) RECALCULÉ - calcul inutile calcul inutileEnergie solaire utile au départ des sous-stations kWh 11 555 16 467 28 022 142%COP électrique (au départ sous-stations) - 0.65 24.04 12.35 84%Consommation d'eau m3 207.35 5.40 212.75 501%
Pas de données avant
le 13/07
Fuite d'eau sur le
refroidisseur
IEA T
ask
53 6
thm
eetin
g –
Palm
a 10
-11/
10/2
016
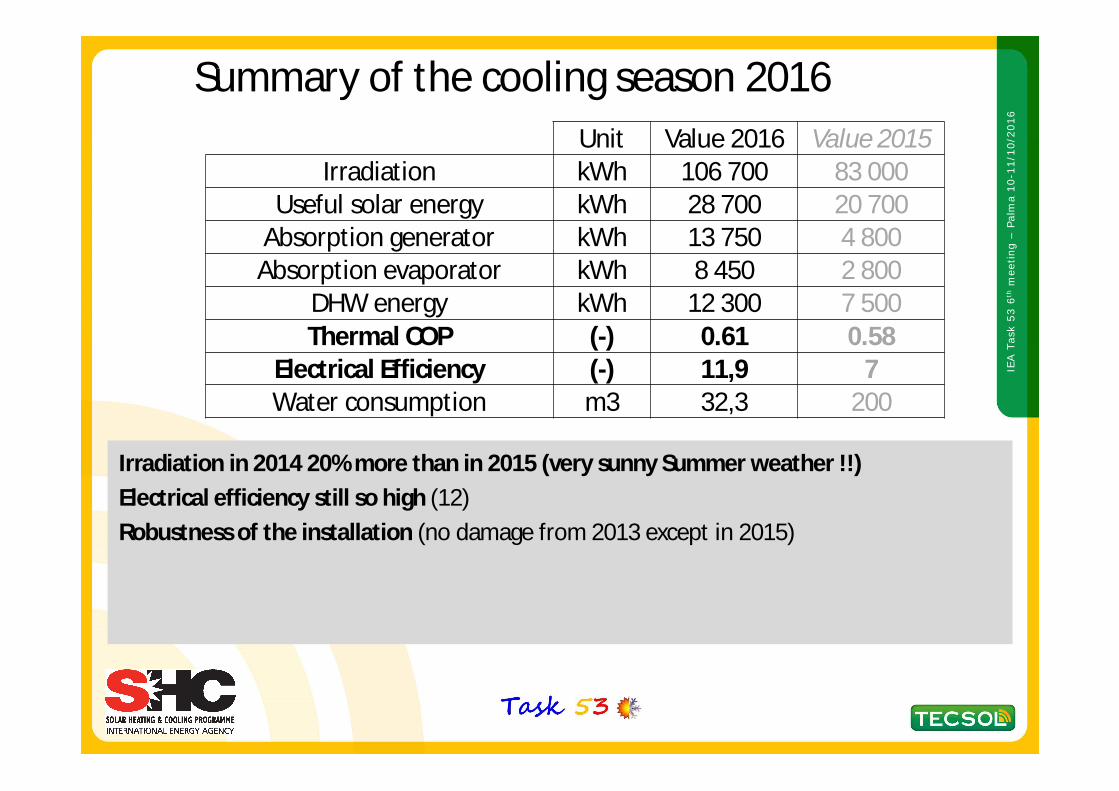
Summary of the cooling season 2016
Irradiation in 2014 20% more than in 2015 (very sunny Summer weather !!)Electrical efficiency still so high (12)Robustness of the installation (no damage from 2013 except in 2015)
Unit Value 2016 Value 2015Irradiation kWh 106 700 83 000
Useful solar energy kWh 28 700 20 700Absorption generator kWh 13 750 4 800
Absorption evaporator kWh 8 450 2 800DHW energy kWh 12 300 7 500Thermal COP (-) 0.61 0.58
Electrical Efficiency (-) 11,9 7Water consumption m3 32,3 200
IEA T
ask
53 6
thm
eetin
g –
Palm
a 10
-11/
10/2
016
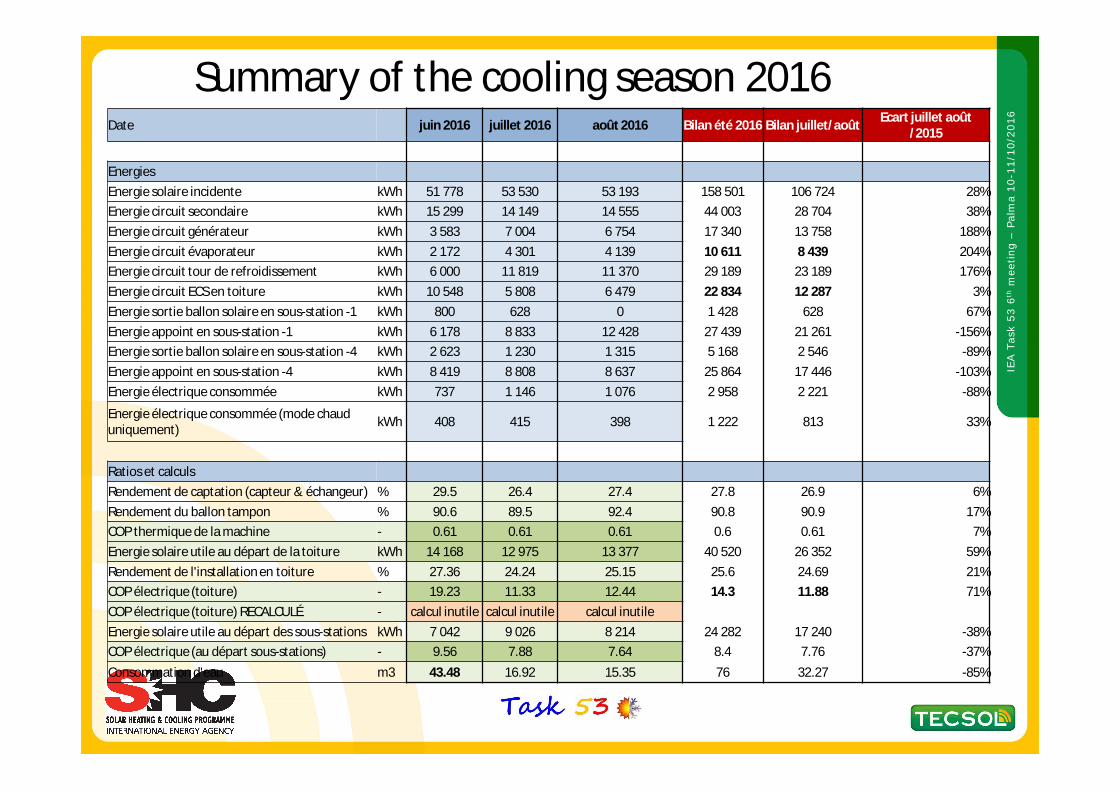
Summary of the cooling season 2016Date juin 2016 juillet 2016 août 2016 Bilan été 2016 Bilan juillet/août Ecart juillet août
/2015
EnergiesEnergie solaire incidente kWh 51 778 53 530 53 193 158 501 106 724 28%Energie circuit secondaire kWh 15 299 14 149 14 555 44 003 28 704 38%Energie circuit générateur kWh 3 583 7 004 6 754 17 340 13 758 188%Energie circuit évaporateur kWh 2 172 4 301 4 139 10 611 8 439 204%Energie circuit tour de refroidissement kWh 6 000 11 819 11 370 29 189 23 189 176%Energie circuit ECS en toiture kWh 10 548 5 808 6 479 22 834 12 287 3%Energie sortie ballon solaire en sous-station -1 kWh 800 628 0 1 428 628 67%Energie appoint en sous-station -1 kWh 6 178 8 833 12 428 27 439 21 261 -156%Energie sortie ballon solaire en sous-station -4 kWh 2 623 1 230 1 315 5 168 2 546 -89%Energie appoint en sous-station -4 kWh 8 419 8 808 8 637 25 864 17 446 -103%Energie électrique consommée kWh 737 1 146 1 076 2 958 2 221 -88%
Energie électrique consommée (mode chaud uniquement) kWh 408 415 398 1 222 813 33%
Ratios et calculsRendement de captation (capteur & échangeur) % 29.5 26.4 27.4 27.8 26.9 6%Rendement du ballon tampon % 90.6 89.5 92.4 90.8 90.9 17%COP thermique de la machine - 0.61 0.61 0.61 0.6 0.61 7%Energie solaire utile au départ de la toiture kWh 14 168 12 975 13 377 40 520 26 352 59%Rendement de l'installation en toiture % 27.36 24.24 25.15 25.6 24.69 21%COP électrique (toiture) - 19.23 11.33 12.44 14.3 11.88 71%COP électrique (toiture) RECALCULÉ - calcul inutile calcul inutile calcul inutileEnergie solaire utile au départ des sous-stations kWh 7 042 9 026 8 214 24 282 17 240 -38%COP électrique (au départ sous-stations) - 9.56 7.88 7.64 8.4 7.76 -37%Consommation d'eau m3 43.48 16.92 15.35 76 32.27 -85%
IEA T
ask
53 6
thm
eetin
g –
Palm
a 10
-11/
10/2
016
Conclusion
• Project functionning very well since Spring 2012
• Full monitoring system permetting a detailed feedback on energy performances
• Very interesting concept for solar cooling and DHW :
• Maxi usability of the solar ressource and system simplicity
• Economical Optimum (gains for DHW + cooling production)
• No overheating risks because a load everytimer
• Drainback strategy in case of failure/ damage
• First application of Emergence Programe

IEA T
ask
53 6
thm
eetin
g –
Palm
a 10
-11/
10/2
016
Thanks for your attention !
Contact : Daniel Mugnier, TECSOL