dan.d- bb cert presentation-rev.2
TRANSCRIPT

Cover graphic should fill and not exceed the defined grey box.
Dan DanescuSURFACE SYSTEMS, ROMANIA, Campina
CRB Presentation

COST CUSTOMER EXPERIENCE
Black Belt Project Tree
#6952Optimizing buffers capacity in sucker rods area
$34,790
#7044Reducing cost for sucker rods packaging system
$44,224
#7050Reduce cost of lift nut 4.06 15K & 5.12 10K
JDI
#7096Reducing two types of defects at sucker rods end
$18,972
Total Savings: $2,640,196
#8469Cladding process improvements
$134,124
#7045Increase throughput on gate milling
$118,690
#7029 Improve sucker rods end protectors
JDI
#7653Lighting system replacement in sm3 and wellhead
$14,877
#8487Reduction of allocated quantity for welding wire in cladding process
$2,286
#8643Local supplier development for torque applications
$145,140
#8845Improve outsourcing process for machining large valve components
$1,616,603
#8927Standard cost monitoring process $220,929
CYCLE TIME
#6917Eliminate burs from forging at pin shoulder sucker rods
$10,485
#8191Improve process for milling internal slots
JDI
#4530Improve Counterbalance System
JDI
#6492Improve Cycle Time for 7 1/16” FL/FLS Gates
$25,564
#5898Reduce cycle time on large body valves machining
$15,697
SAFETY
#8131Reduce safety hazard - shafts assembly process for expandable gates
JDI
#7770Sucker rods superiorforging dies - design reconsidering
$57,146#4535Improve cycle time of body cross and tees machining
JDI
#8175Valve degreasing and washing process improvement
$180,669

ProblemThe operators are using different methods for forging the same
dimension of sucker rod on identical forging dies and identical machines.
Defect rate for 5/8” , 3/4”and 7/8” sucker rods in 2009 was in average 2.17%.
Goal
Eliminating errors generated by subjective factors.Increase 5/8” , 3/4”and 7/8” FPY with average of 1% each. Scope 5/8”, 3/4” and 7/8” sucker rods and superior forging dies .
- Start: Forging machine start.
- Stop: End forging in superior forging dies
VOC
• Forging operator to obtain predictable FPY• Substantial reduce spending with third part inspections by
increasing quality at source• Increased FPY
VOP
• Increase forging dies repeatability• Increase forging operators reproducibility• Eliminate personal opinions regarding sucker rods forging
know how
CTQ• Superior forging dies design• Set up method for forging dies
NCR`sProduction
Month
3745216335356858163182145155199763522294558315402960383748878648117546671990516045
Dec-09Nov-09Oct-09Sep-09Aug-09J ul-09J un-09May-09Apr-09Mar-09Feb-09J an-09
500
400
300
200
100
01
1
11
1
Tests performed with unequal sample sizesNP Chart fOR 7/ 8" forging defects
7/8“ Mean Minimum Median Maximum FPY 0.983 0.971 0.983 0,995
BUSINESS CASE
From a total of 5076 sucker rods scraped in 2009, between January and November, 4376 sucker rods have defects originated on the forging machine. We are loosing approximately $50,000 yearly because of this issue.
Sucker rods superior forging dies - design reconsidering # 7770

The 4376 scraped sucker rods are generated mainly by the variations induced by the tool – forging dies and by the operators.
-
5078
4000
3000
2155
1383
497225
0
100
80
60
40
20
0
Number of scraped sucker rods by different cuases
1
2 4 6
7
3 5
20
15
9 1417
24
DEFECTS1 – Material missing2 – Lap3 – Material missing4 - Longitudinal crack5 – Transversal crack6 – Upset bead overlap7 – Material missing9 – Material missing14 – Material missing 15 – Material missing17 – Undersize diameter20 – Upset bead undersize
24 - Width of square area
According to API 11B we must have 11 inspection points .In reality we have 25 possible defects.
CONCENTRATION DIAGRAM FORGING DEFECTSDefects covered by this project
Sucker rods superior forging dies - design reconsidering # 7770

The logic of design is respecting two basic conditions:
- equality of volumes- equality of displacements
NecessaryCavity4Cavity3Cavity2Cavity1
200000
150000
100000
50000
0
7/8" Old design7/8" New design
Variable
7/ 8" - Material volumes in forging steps ( cubic mm.)
Sucker rods superior forging dies - design reconsidering # 7770
cavity 3 – fix die
cavity 4 – fix die
cavity 1 – movable die
cavity 2 – movable die
cavity 3 – movable die
cavity 4 – movable die
V1f
V2f
V3f
V4f
V1m
V2m
V3m
V4m
Lf Lm
S
EQUALITY OF VOLUMES :V1f+V1m = V2f+V2m = V3f+V3m = V4f+V4m = (Lf+Lm+S)x3.1416xDxD/4
D
cavity 2 – fix die
cavity 1 – fix die
S Δ3 Δ2 Δ1
EQUALITY OF DISPLACEMENTS : S = Δ3 = Δ2 = Δ1

Dec-09Nov-09Oct-09Sep-09Aug-09J ul-09J un-09May-09Apr-09Mar-09Feb-09J an-09
0.995
0.990
0.985
0.980
0.975
0.970
FPY
ActualFits
Trend Analysis for 7/ 8" FPY before improvementYt = 0.98384 - 0.000111*t
Oct-10Sep-10Aug-10J ul-10J un-10May-10Apr-10Mar-10Feb-10J an-10
1.000
0.995
0.990
0.985
0.980
FPY
ActualFits
Trend Analysis 7/ 8" Sucker Rods after improvement
Yt = 0.98382 + 0.00101*t
5/8” sucker rods FPY increased within 1,3%
3/4” sucker rods FPY increased within 2,0%
7/8” sucker rods FPY increased within 0,6%
NCR`sProduction
Month
914219201789247101196069413002347161236016827462110075729
Oct-10Sep-10Aug-10Jul-10Jun-10May-10Apr-10Mar-10Feb-10Jan-10
250
200
150
100
50
0
7/8"
NCR`s
aft
er
impro
vem
ent
ncr_1fpy_1
NCR`s & FPY for 7/ 8" Sucker Rods after improvement
7/8” FPY after = 0,989
Sucker rods superior forging dies - design reconsidering # 7770
7/8” FPY before = 0,983
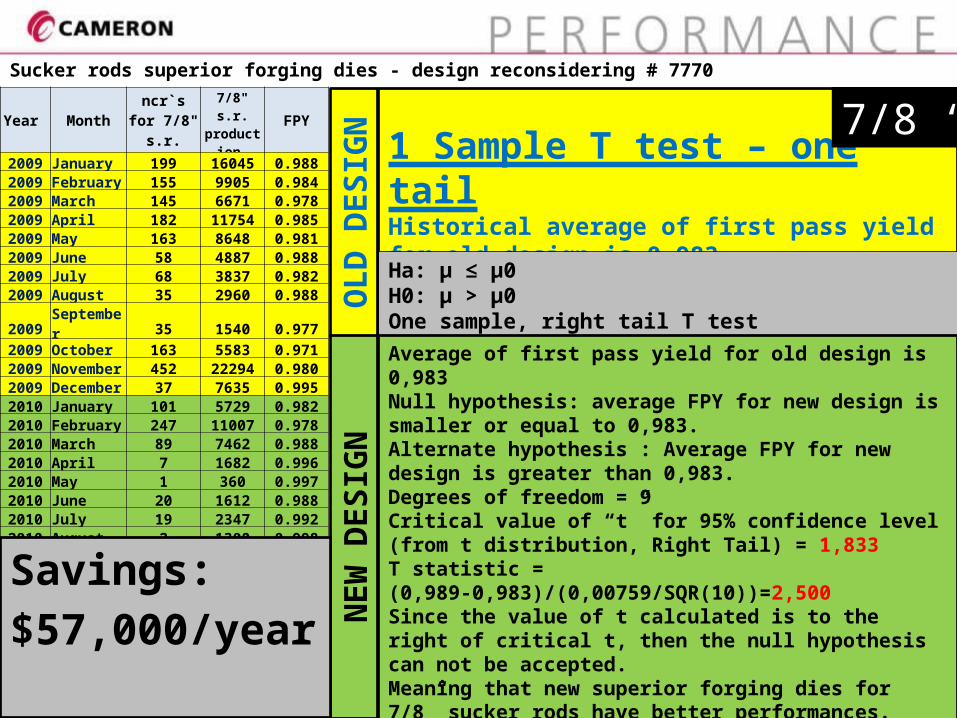
1 Sample T test – one tailHistorical average of first pass yield for old design is 0,983
Ha: μ ≤ μ0 H0: μ > μ0One sample, right tail T test
7/8 “Sucker rods superior forging dies - design reconsidering # 7770
Year Month ncr`s for 7/8" s.r.
7/8" s.r. production FPY
2009 January 199 16045 0.9882009 February 155 9905 0.9842009 March 145 6671 0.9782009 April 182 11754 0.9852009 May 163 8648 0.9812009 June 58 4887 0.9882009 July 68 3837 0.9822009 August 35 2960 0.9882009 September 35 1540 0.9772009 October 163 5583 0.9712009 November 452 22294 0.9802009 December 37 7635 0.9952010 January 101 5729 0.9822010 February 247 11007 0.9782010 March 89 7462 0.9882010 April 7 1682 0.9962010 May 1 360 0.9972010 June 20 1612 0.9882010 July 19 2347 0.9922010 August 2 1300 0.9982010 September 14 694 0.9802010 October 9 1960 0.995
OL
D D
ES
IGN
NE
W D
ES
IGN
Average of first pass yield for old design is 0,983Null hypothesis: average FPY for new design is smaller or equal to 0,983.Alternate hypothesis : Average FPY for new design is greater than 0,983.Degrees of freedom = 9Critical value of “t” for 95% confidence level (from t distribution, Right Tail) = 1,833T statistic = (0,989-0,983)/(0,00759/SQR(10))=2,500Since the value of t calculated is to the right of critical t, then the null hypothesis can not be accepted.Meaning that new superior forging dies for 7/8” sucker rods have better performances.0,00759 is standard deviation after improvement.
Savings:
$57,000/year

Consult routing requests list(ZQM10/email)T = 20 min.
Introduce Code in SAP(ZM00); T = 15 min.
I tem without
Routing ?(ZM08)
T = 5 min.
YES Forging PN ?(CS03)
T = 5 min.
YES
NO Forgingdrawing ?(CS03)
T = 5 min.
NO
Find raw material-where use list of drawing(ZCSD5; ZCS15); T = 5min.Forgings table fromV:\Groups\DOCUMENTE INGINERIE PROCES\SEMIFABRICATEFORJATE-MATRITATE
YES
Create forging code(codification)
Add “9C” before(ZM00);T = 10 min.
Create extensions(ZM09); T = 15 min.
Create long description(MM02); T = 5 min.
Create BOM(CS01); T = 15 min.
Create sales tabs(ZJ 04); T = 15 min.
Introduce raw material in BOM(CS02); T = 5 min.
Routing creation(CA01)T = 40 min.
External operations?
(CA03 – “EXTL”)T = 15 min.
YES
Email to PurchasingFor price & LTT = 15 min.
Send to Costing,Planning(QM02); T = 10 min.
NO
END
Operations plan?
T = 5 min.
NO
YES
ROUTING CREATION PROCESS
Overlapping(CA02); T = 25 min.
*After creation of the first routing, run the transaction MD20: MRP will re-run for this PN. it will create a new planned order using the scheduling of the routing . it will propose realistic start date base on the Lead time of the routing time the quantity ( and not use the lead time of the PN that is fixed)
(MD20*)
Plan creationT = 85 min.Cad; Excel
NO
Establish prioritiesAnalyze drawings
Communication with tooling and fixtures eng.Request for heat treatment and welding routings
END
TOTAL TIME = 315 min./item
Project 8927 - STANDARD COST MONITORING PROCESS

Problem: Actual cycle time for standard cost creation is 34 days. This is causing firm orders without standard cost, meaning invisible loading measured in dollars in management reports, due to unpredictable dead line for pricing.
Goals: - Monitor cycle time for standard cost
creation – no more than 15 days from MMM to Pricing.
- Manage standard cost creation activity by creating easy to use reports with clear metrics and responsibilities.
Business CaseIn July, 2010, Campina plant, was overloaded by increasing efforts in Manufacturing (process engineers) & Purchasing as main contributors of standard cost creation.Unfavorable consequences will be extended on backlog analysis, influencing on time delivery indicator and overhead hours.
Customer Service
Specialist (CSS)
EngineeringMaterial Master Meister
Process Engineer Purchasing Financial
Schedule Overview
DWeek 25, 2010Workshop with managers of involved departments Actual process definition.
MWeek 28, 2010- Workshop with key contributors in the process for analyze of current process work division.Selection of the best proposal regarding future workflow and resources,
AWeek 33, 2010Selecting unique environment of communication and monitoring process starting with MMM and finishing with standard cost creation.
I
Week 37,2010Establish main users and starting solving exceptions appeared along implementation .
C
February 7, 2011Start reporting & monitoring of standard cost creation activity.
Mitigation
First official standard cost reportConclusions from this report have to be followed by managers and people involved.
Risks
Unique communication environment is not a job solving tool; it is a tool for reporting & communication added to day to day activity.
Project 8927 - STANDARD COST MONITORING PROCESS
Scope: The scope of this project is from MMM part-number download till standard cost creation.
Start: - Part number creationStop: - Standard cost ready

CUSTOMER SERVICESPECIALIST
ENGINEE- MATERIALMASTERMEISTER
PLANNER PROCESS ENGINEER
PURCHA- PRICING-RING -SING
EMAIL - PART SETUP
ZWER1
EMAIL - PN in S.O. LINE
EM
AIL
- O
RD
ERS
EMAIL - "STANDARD COST READY"
EMAIL - "STANDARD COST READY"
EMAIL - PURCHASED ITEMS
ZL EXTERNAL OPERATIONSFORGINGS
DIRECTCUSTOMER
INTER -COMPANY
EMAIL - MAKE IN 1240
MATERIALMASTERMEISTER
ORD
ERS
; RFQ
PLANNER PROCESS ENGINEER
QUALITY PURCHA--SING
EMAIL - "STANDARD COST READY"
EMAIL - PURCHASED ITEMS
ZLEXTERNAL OPERATIONS
FORGINGS
PRICING
P/T = 30' P/T = 60' P/T = 315' P/T = P/T= 960' P/T = 78'
= 1 = 3 = 4 = 13 = 2
55 393 12209
0,02 days
0,76 days 11,43 days 20,15 days 0,65 days
0,22 days 0,67 days 0,05 days 0,04 days
33,99 days cycle time for every standard cost to be calculated.
Data obtained on 23 August 2010. Selection was made on zero standard cost at that date.
ACTUAL STATE VSM
P.C.E. = 2,94%
Project 8927 - STANDARD COST MONITORING PROCESS

SolutionTeam considered a monitoring process have to be implemented. This will be made with help of a soft application which will monitor work flow and volume for every department involved.
Material Master Meister
Process Engineer Purchasing
Financial (Pricing)
Welding Engineer
Heat Treatment Engineer
Make or buy
Ma
ke
Bu
y
Welding or HT operations?
Ye
s
No
CuteFlow is a web based open source document circulation and workflow system. Users are able to define “documents” which are send step by step to every station/user in a list. It’s an electronically way for doing circulations. For 1 new part-number, after a completed cycle (circulation) you will have a completely filled document. Also attachments to the document are possible.All operations like starting a workflow, tracking, workflow-definition or status observation can be done comfortable and easy.
MMM responsible will configure every circulation stations.
Every user can change the next station in the process.
CuteFlow circulations can be transferred in XL format facilitating reports.
Project 8927 - STANDARD COST MONITORING PROCESS

51 52 1 2 3 4 5 6 7 8 9 10 11 12 13 14 15 16 17 18 19 20 21 22 23 24 25 26 27 28
WIP Cumulated 0 0 0 0 0 0 0 0 0 0 0 3 0 3 4 3 3 3 4 1 1 1 0 0 0 0 0 7 0 0
OUT < 5 days 1 0 11 1 13 13 11 10 14 4 12 2 9 7 1 33 17 11 5 4 6 14 15 12 19 3 6 5 11 2
OUT > 5 days 0 0 0 0 4 0 0 1 5 12 0 0 2 1 0 1 0 0 0 3 2 0 1 0 0 0 0 0 7 0
2.5
7.5
12.5
17.5
22.5
27.5
32.5
WIP Cumulated OUT < 5 days OUT > 5 days
# of
Cut
eFlo
w
circ
ulat
ions
Evolution of solved & unsolved circulations for every week, between December 2010 to July 2011
INDUSTRIAL ENGINEER – VALVES
51 52 1 2 3 4 5 6 7 8 9 10 11 12 13 14 15 16 17 18 19 20 21 22 23 24 25 26 27 28
WIP Cumulated 6 11 16 45 69 78 89 92 108 116 135 113 97 102 98 85 128 103 122 119 129 86 26 2 0 0 23 5 2 2
OUT < 5 days 1 0 5 1 2 0 2 0 5 15 6 3 0 5 20 26 20 7 14 12 8 14 6 28 27 32 40 16 31 21
OUT > 5 days 0 0 8 0 8 11 21 18 8 15 12 43 28 29 4 34 17 21 27 13 24 76 72 24 0 0 0 23 5 18
10
30
50
70
90
110
130
150
# of
Cut
eFlo
w
circ
ulat
ions
INDUSTRIAL ENGINEER – WELLHEAD
Adjusting volume of necessary work
Routine work with 2 industrial engineers Stable process using two industrial engineers as before
Achieving zero routings using one more industrial engineer temporary transferred from Ploiesti
Circulation solved inside department in less than 5 days
Circulation solved inside department in more than 5 days
Active (unsolved) circulations cumulated at reporting date
Project 8927 - STANDARD COST MONITORING PROCESS
Customer Service
Specialist (CSS)
Engineering
Material Master Meister
Process Engineer
Welding Engineer
Purchasing Financial Heat Treatment
MONITORING AREAS

CIRCULATIONS
FUTURE STATE VSM
P.C.E. = 35,7%
15 days cycle time for every standard cost to be calculated.
CUSTOMER SERVICESPECIALIST
ENGINEE- MATERIALMASTERMEISTER
PROCESS ENGINEER
PURCHA- PRICING-RING -SING
EMAIL - PART SETUP
ZWER1
EMAIL - "STANDARD COST READY"
PURCHASED ITEMS
EMAIL - MAKE IN 1240
WELDING
PROCESS ENGINEER
PRODUCTPROCESS ENGINEER
TREATMENTHEAT
P/T = 30' P/T = 315' P/T = P/T = 78'
= 1 = 4 = 13 = 2
0,02 days
0 days 1,44 days 0,16 days
0,22 days 0,05 days
P/T = 60'
= 1
0,04 days
P/T = 60'
= 1
0,11 days
2 0 0 32 6
MAKE ITEMS MAKE ITEMS MAKE ITEMS MAKE ITEMS
0 days
0,04 days
P/T = 840'
0,58 days
IE valves IE wellhead IE AL Welding Heat treat-ment
Purchasing Pricing
WIP Cumulated 0 2 0 0 0 32 6
OUT < 5 days 272 367 42 1122 1161 1184 1359
OUT > 5 days 39 559 0 7 6 264 104
100
300
500
700
900
1100
1300
1500
WIP Cumulated OUT < 5 days OUT > 5 days
Weekly report cumulating all departments participating in process (week 28).
January February March April May June
Average days for 1 circu-la-tion
24.8873239436618
23.1904761904762
16.2764705882352
12.1785714285713
9.96694214876033
6.87264150943396
#circulations / day
10.1428571428571
13.65 7.39130434782607
13.3333333333333
11 9.63636363636364
2.507.50
12.5017.5022.5027.50
Number of days necessary for solving one circulation between January and June 2011 is showing a very clear descending trend.
Project 8927 - STANDARD COST MONITORING PROCESS
Closing...
First, THANK YOU !!, for opportunity of learning new way of treating business & life generally
LESSONS LEARNED:- Power of the team, including operators- Statistical tools can help for guessing the future, based on correct data;- Average 95% of industrial processes is waist – address 8 waists using VSM;- Presentation skills; powerful tool to increase teams commitment.
TO APPLY IN FUTURE:- Increase machine monitoring following 3 indicators & eliminating human reporting
- machine availability;- performance against routings;- quality
- Increase efficiency of communication between departments through one unique and standard communication environment, without emails and phone calls.- Standard metrics for machines & human in order to increase trust inside company.- Unlock innovation…