d.3.6 extended value stream maps of nace 10.3: fruit...
TRANSCRIPT

1
D.3.6 Extended Value Stream Maps of NACE 10.3:
Fruit juices and purees and tomato concentrates
Prepared by:
ENEA

2 D.3.6 Extended Value Stream Maps of NACE 10.3: Fruit juices and purees and tomato concentrates
About this document
This report corresponds to D3.6 of the SCOoPE project “Extended Value Stream maps of NACE 10.3”. It has been prepared by:
ENEA, Italian National Agency for New Technologies, Energy and Sustainable Economic Develoment
Via Anguillarese 301, 00123 Rome (IT)
Authors: Dr. Germina Giagnacovo [email protected] Dr. Arianna Latini [email protected] Dr. Carlo Alberto Campiotti [email protected] Dr. Corinna Viola [email protected] Dr. Matteo Scoccianti [email protected] Updated version: December 12, 2016
This project has received funding from the European Union’s Horizon 2020 research and innovation programme under grant agreement No 695985.
The sole responsibility for the content of this publication lies with the authors. It does not necessarily reflect the opinion of the European Union. Neither
the EASME nor the European Commission are responsible for any use that may be made of the information contained therein.

3 D.3.6 Extended Value Stream Maps of NACE 10.3: Fruit juices and purees and tomato concentrates
Table of contents
1. Introduction ...................................................................................................................................................... 6
2. Orange juice ..................................................................................................................................................... 7
2.1 Current Value Stream Mapping................................................................................................................................ 8
2.2 Processes description .......................................................................................................................................... 10
2.3 Overview list of the processes and equipment .......................................................................................................... 15
2.4 Sankey diagram ................................................................................................................................................. 17
2.5 Identification of the key points for setting up the baselines in electric and thermal processes ............................................. 20
2.6 Possible inefficiencies in the performance of the processes for the production of orange juice, fruit juices and fruit purées ...... 21
3. Fruit juices ...................................................................................................................................................... 22
3.1 Current Value Stream Mapping.............................................................................................................................. 23
3.2 Processes description .......................................................................................................................................... 25
3.3 Overview list of the processes and equipment .......................................................................................................... 31
3.4 Sankey diagram ................................................................................................................................................. 33
3.5 Identification of the key points for setting up the baselines in electric and thermal processes ............................................. 35
4. Fruit purees .................................................................................................................................................... 36

4 D.3.6 Extended Value Stream Maps of NACE 10.3: Fruit juices and purees and tomato concentrates
4.1 Current Value Stream mapping....................................................................................................................................... 37
4.2 Processes description ................................................................................................................................................... 39
4.3 Overview list of the processes and equipment ................................................................................................................... 46
4.4 Sankey diagram .......................................................................................................................................................... 48
4.5 Identification of the key points for setting up the baselines in electric and thermal processes ...................................................... 49
5. Tomato concentrate ........................................................................................................................................ 50
5.1 Current Value Stream Mapping....................................................................................................................................... 52
5.2 Processes description and equipment .............................................................................................................................. 53
5.3 Overview list of the processes and equipment ................................................................................................................... 61
5.4 Sankey diagram .......................................................................................................................................................... 63
5.5 Identification of the key points for setting up the baselines in electric and thermal processes ...................................................... 65
5.6 Possible inefficiencies in the performance of the processes ................................................................................................. 66
6. REFERENCES ................................................................................................................................................. 67
6.1 References for fruit juices and purees .............................................................................................................................. 67
6.2 References for tomato concentrate .................................................................................................................................. 68

5 D.3.6 Extended Value Stream Maps of NACE 10.3: Fruit juices and purees and tomato concentrates
List of Figures
Figure 1: Current Value Stream Map for an exemplary plant processing cold orange juice with a production capacity of 19000 L/shift .......... 9
Figure 2: Average consumption flows of thermal energy in the upper part of the graph and electricity in the lower one, in orange juice
production. ....................................................................................................................................................................................... 17
Figure 3: Current Value Stream Map for an exemplary plant processing fruit juices. ...................................................................................... 24
Figure 4: Typical fruit juice (both clear and cloudy) processing line steps in yellow boxes. ............................................................................ 25
Figure 5: Average consumption flows of steam in the upper part of the graph, hot water in the central, and electricity in the lower one, in fruit
juices production. ............................................................................................................................................................................. 33
Figure 6: Current Value Stream Map for an exemplary plant processing fruit purées. .................................................................................... 38
Figure 7: Most typical steps in fruit purées-processing line (elaboration from Lozano, 2006). ....................................................................... 39
Figure 8: Average consumption flows of thermal energy in the upper part of the graph, and electricity in the lower one, in fruit purées
production ........................................................................................................................................................................................ 48
Figure 9: Current Value Stream Map for an exemplary plant processing triple concentrate tomato paste with a production capacity of 500
ton/day. Kaizen burst icons are used to highlight improvement needs at specific processes that are critical to achieving the Future
State Map of the value stream. ........................................................................................................................................................ 52
Figure 10: Scheme of the main processes for the tomato paste processing ................................................................................................... 53
Figure 11: Average consumption flows of electricity on the left and thermal energy on the right in the production of tomato concentrate .... 63

6 D.3.6 Extended Value Stream Maps of NACE 10.3: Fruit juices and purees and tomato concentrates
1. Introduction
This document, taking as a first starting point the Current Value Stream Mapping of the industrial agro-food sector of fruit processed production -
particularly ORANGE JUICE, FRUIT JUICES and PUREES production activities - contains the description of the whole industrial process, step-by-step,
including the associated equipment. In this document, the most relevant processes from the energy point of view have been highlighted in order to serve
as basis for the further tasks of the project, as the setting up of benchmarking baselines in thermal energy and electricity consumption.
Fruit juice is the fermentable but unfermented product obtained from the edible part of fruit which is sound and ripe, fresh or preserved by chilling or
freezing of one or more kinds mixed together having the characteristic colour, flavour and taste typical of the juice of the fruit from which it comes
(http://eur-lex.europa.eu/legal-content/EN/TXT/?uri=CELEX%3A32012L0012). The juice is prepared by suitable processes, which maintain the essential
physical, chemical, organoleptical and nutritional characteristics of the juices of fruit from which it comes. A single juice is obtained from one kind of fruit.
A mixed juice is obtained by two or more juices or juices and purées from different kinds of fruits. Fruit juice can be obtained i) directly squeezed by
mechanical extraction processes or ii) from concentrate by reconstituting concentrated fruit juice with potable water.
Fruit purée for use in the manufacture of fruit juices and nectars is the unfermented but fermentable product obtained by suitable process e.g. by
sieving, grinding, milling the edible part of the whole or peeled fruit without removing the juice. The fruit must be sound, appropriately mature, and fresh
or preserved by physical means or by treatment(s) applied in accordance with the applicable provisions of the Codex Alimentarius Commission
(www.fao.org/input/download/standards/10154/CXS_247e.pdf).
The juice market in Europe, estimated to be close to 9.6 million kilolitres in 2015 (AIJN, European Fruit Juice Association, Market Report on Liquid Fruit
2016), is expected to decline because of the high sugar content in juice drinks. It is worthy of note that there is an increasing in the customer demand for
cold juices, products having a higher added value. Orange and apple juices together constituted the major share of juice consumption in Europe with a
combined market share of about 55% in terms of volume.

7 D.3.6 Extended Value Stream Maps of NACE 10.3: Fruit juices and purees and tomato concentrates
2. Orange juice
As exemplary case for fruit juice production, here it is shown a plant processing orange juice, with a production capacity of 55000 kg oranges per day,
yielding around 20000 L cold orange juice per day. The current plant uses to be operative during orange harvesting season, which is generally around
end of autumn/winter. For this specific case, orange juice is 100% natural, without inclusion of any additive, sweetener or colorant. To simplify the
analysis any processing of primary and/or secondary by-product is not taken into account. Therefore, the CVSM will be developed only for the orange
juice processing line.
As for any other fruit and vegetable processing plant, in order to save energy and money and reduce GHG emissions, the localization of the plant should
be as close as possible to the agricultural holdings so that the transport from the harvesting field to the plant is fast and easy.
Regarding the plant activity time, the orange juice processing line is operative 7 days/week, 3 shifts per day. Equipment maintaining and cleaning will be
performed every Saturday. Operators work 8 hours in total (7 hours in processing activities and 1 hour in cleaning). The all steps for orange juice
production will be performed in the same day. The delivery occurs after the production, moving out of the plant around 25 pallets per shift, each pallet
being constituted of 760 L of orange juice.
The final balance per shift for such a plant is shown in the table below:
Starting balance Oranges that undergo
extraction process
Extracted fruit (considering a
55% extraction efficiency) Final balance
55000 kg 45650 kg 20540 L 19000 L
Given 3 shifts per day, the final balance per day will be 57000 L orange juice.
Below, an attempted Current Value Stream Mapping (CVSM) of the ORANGE JUICE processing plant, using the LEAN & GREEN symbology:

8 D.3.6 Extended Value Stream Maps of NACE 10.3: Fruit juices and purees and tomato concentrates
2.1 Current Value Stream Mapping

9 D.3.6 Extended Value Stream Maps of NACE 10.3: Fruit juices and purees and tomato concentrates
FIGURE 1: CURRENT VALUE STREAM MAP FOR AN EXEMPLARY PLANT PROCESSING COLD ORANGE JUICE WITH A PRODUCTION CAPACITY OF 19000 L/SHIFT
(CAPACITY FOR THE WHOLE PROCESSING LINE: 20 TON/H; WATER CONSUMPTION 60 M3/H).

10 D.3.6 Extended Value Stream Maps of NACE 10.3: Fruit juices and purees and tomato concentrates
2.2 Processes description
Orange reception
The trucks transporting the oranges arrive at the plant. Oranges are subjected to a check and need the approval of the plant receiving team before
permitting trucks’ unloading. The approved oranges are unloaded via inclined ramps and stored in special fruit holding bins that help protect fruit quality
until the time when the juice is ready for the extraction process. In several large companies, a sample from each truck is taken for fruit quality evaluation
in external or internal laboratories.
ORANGE RECEPTION
Robust bulk bin tipper (from Van Wamel). Damper trailer or truck which uploads oranges via an inclined ramp. A transmitter receiving unit
controls the unloading speed continuously to provide a constant flow of fruit out of the bin.
Nominal capacity 35-40 uploading/hour. Maximum load around 1000 kg.
Installed power 2.2 kW

11 D.3.6 Extended Value Stream Maps of NACE 10.3: Fruit juices and purees and tomato concentrates
Washing and Sorting
Before the extraction, the oranges are washed, selected and graded by size. Oranges that do not meet grade are discarded at This stage. Often, the
oranges are not wasted, and they are used as byproduct for the production of citrus pellets for feedstuff (especially for dairy cattle, fattened beef cattle
and sheep).
WASHING AND SORTING
Fruit and vegetable washer (from Bajaj ProcessPack Limited). This equipment is suitable for wasghing various fruits and vegetables. The
fruits are subjected to strong water agitation for removal of dirt. The washed fruits are then conveyed to the next state by a pick up conveyor.
Orange grading machine (from Thoyu). This grading machine is used to sort fruits according to size. It can be widely used for grading the round shape fruit and vegetables such as
orange, citrus, lemon, apple, tomato, etc..
Nominal capacity and installed power depending on the model. Nominal capacity and installed power depending on the model.
Nominal capacity: 750-1000 kg/h. Installed power: 4.41 kW. Nominal capacity: 1000-3000 kg/h. Installed power: 0.75 kW.
Nominal capacity: 1500-2000 kg/h. Installed power: 6.62 kW.
Nominal capacity: 3000-5000 kg/h. Installed power: 1.1 kW. Nominal capacity: 3000 kg/h. Installed power: 8.83kW.
Nominal capacity: 5000 kg/h. Installed power: 11 kW.

12 D.3.6 Extended Value Stream Maps of NACE 10.3: Fruit juices and purees and tomato concentrates
Juice extraction
The selected orange then go to the equipped extractors, which squeeze the fruit to separate the juice, peel oil, and peel from the orange. In general,
citrus juice extractor machines are able to process every kind of citrus fruits.
JUICE EXTRACTION SIEVING AND CENTRIFUGATION
Citrus juice extractor machine (from JBT). Citrus juice extractor (Polycitrus ZX2 from Fratelli
Indelicato). This family of extractors is typically installed in lines of 10 to 14 machines.
Rotary drum vacuum filter.
Nominal capacity 600 oranges/min Nominal capacity Up to 20 t/h Nominal capacity Up to 500-1500 L/h
Installed power 1.5 kW Installed power 7.5 kW Installed power 0.18 kW

13 D.3.6 Extended Value Stream Maps of NACE 10.3: Fruit juices and purees and tomato concentrates
Sieving (juice filtration) and centrifugation
In order to reduce the content of pulp in the final product, the juice is passed through filters and centrifuges where pulp buds, seeds and excess pulp are
removed/separated. Very often, these residual parts of the orange fruits are sent to be used in the manufacture of by-products and animal feed, and their
price as an ingredient for cattle total mixed rations may be as high as orange juice price.
Homogeneization
This process, occurring in homogenizing tanks, is necessary for obtaining a homogeneous product.
HOMOGENEIZATION DE-AERATION
Homogeneizer tank (from SPX). De-aeretor. Levels of dissolved oxygen are reduced with decreases in temperature and pressure (from Jiadi).
Nominal capacity Up to 60000 L/h Nominal capacity (L/h) 600-1000; 1200-1500; 2000-2200; 2500-3000; 4000-5000.
Installed power 1.5 kW Installed power (kW) 2.2; 2.4; 4.15; 4.15; 6.75.

14 D.3.6 Extended Value Stream Maps of NACE 10.3: Fruit juices and purees and tomato concentrates
De-aeration
A controlled de-aeration process is applied in order to remove oxygen that was incorporated to the juice, thus preventing it from oxidizing over time. This
preserves orange juice freshness and vitamin C level, reduces flavor deterioration and the frothing during the filling step. A deaerator is essentially a
vacuum degassing unit with the addition of a regular pump and discharge pump.
Pasteurization
Prior to filling into containers, the juice undergoes a modern pasteurizing and chilling process for inactivating enzymes and destroying microbial
contaminants. Pasteurization uses to occur heating rapidly to 92 °C in tubular (or plate) heat exchangers for 30 seconds. Flash pasteurization, used for
perishable beverages as F&V juices, maintains color and flavor better, and can occur at higher temperature for a shorter time (ultra-pasteurization
sterilizes food by heating it above 135 °C for 1-2 seconds).
PASTEURIZATION ASEPTIC FILLING
Multitubular heat exchanger (from HRS heat exchangers). Tubular (or plate) heat exchangers are available in various configurations.
250ml-2L bottle juice packing machine (from GOLDSAN). It can automatically rinsing, filling and rotary capping bottles.
Packaging capacity 250 ml-2 L bottle range filling Nominal capacity Production capacity depending on the model Nominal capacity (L/h) 4000-5000/6000-8000/8000-10000/10000-12000.
Installed power Depending on the model production capacity Installed power (kW) 3.13; 3.84; 4.1; 5.6; 7.5.

15 D.3.6 Extended Value Stream Maps of NACE 10.3: Fruit juices and purees and tomato concentrates
Aseptic filling: After pasteurization and cooling, the fresh juice is aseptically filled into sterile containers.
Packaging and Labelling.
Logistics: The Net from Concentrate (NFC) juice is stored in modern stainless steel tanks.
2.3 Overview list of the processes and equipment
PROCESS EQUIPMENT N° of UNITS ELECTRIC
and/or THERMAL
SOURCE of ENERGY
ORANGE RECEPTION
TRUCKS FOR TRANSPORTATION 3 Electric and
thermal
Electricity, diesel fuel and other petroleum products, biofuel,
natural gas
OFFLOADING AREA, BINS - -
DUMPER TRAILER 1 Electric Electricity
PUMPING TO NEXT PROCESS (collection channel)
1 Electric Electricity
WASHING and SORTING
WASHING MACHINE (brush washer) 2 Electric Electricity
PUMPING TO NEXT PROCESS (sorting station)
1 Electric Electricity
AUTOMATIC SORTING MACHINE (a sorting conveyor like a belt roller).
1 Electric Electricity
CONVEYOR TO NEXT PROCESS 1 Electric Electricity
JUICE EXTRACTION JUICE EXTRACTOR
depends on nominal capacity and installed
power Electric Electricity
PUMPING TO NEXT PROCESS 1 to 10 Electric Electricity

16 D.3.6 Extended Value Stream Maps of NACE 10.3: Fruit juices and purees and tomato concentrates
SIEVING and CENTRIFUGATION
ROTARY DRUM VACUUM FILTER 2 Electric Electricity
DISK STACK CENTRIFUGE 2 Electric Electricity
PUMPING TO NEXT PROCESS 2 to 1 Electric Electricity
HOMOGENEIZATION HOMOGENEIZER TANK 1
Electric and thermal
Electricity and gas
PUMPING TO NEXT PROCESS 1 Electric Electricity
DEAERATION VACUUM DEAERATOR 1 Electric Electricity
PUMPING TO NEXT PROCESS 1 Electric Electricity
PASTEURIZATION MULTITUBULAR HEAT EXCHANGER 1
Electric and thermal
Electricity and gas
PUMPING TO NEXT PROCESS 1 Electric Electricity
ASEPTIC FILLING ASEPTIC FILLER 1 Electric Electricity
PUMPING TO NEXT PROCESS 1 Electric Electricity
PACKAGING and LABELLING
PACKAGING/LABELLING STATION (wraparound)
1 Electric Electricity
PUMPING TO NEXT PROCESS 1 Electric Electricity
LOGISTICS COLD AREA 1 - -
TABLE 1: PROCESSES AND EQUIPMENT IN AN ORANGE JUICE PRODUCING PLANT.

17 D.3.6 Extended Value Stream Maps of NACE 10.3: Fruit juices and purees and tomato concentrates
2.4 Sankey diagram
Sankey diagrams show energy consumption for each process, putting a visual emphasis on the major energy flows within the whole production process
carried out in an orange juice firm. They are very useful in locating dominant contributions to the overall energy flow.
FIGURE 2: AVERAGE CONSUMPTION FLOWS OF THERMAL ENERGY IN THE UPPER PART OF THE GRAPH AND ELECTRICITY IN THE LOWER ONE, IN ORANGE JUICE PRODUCTION.

18 D.3.6 Extended Value Stream Maps of NACE 10.3: Fruit juices and purees and tomato concentrates
In following table the energy requirements graphed in the above Sankey diagram for the main unit operations are reported (final data have been
elaborated from a sample of specific energy audits and from Waheed et al., 2008).
PROCESS
THERMAL ENERGY
CONSUMPTION (MJ)
ELECTRICITY CONSUMPTION
(MJ)
TOTAL ENERGY
CONSUMPTION (MJ)
% ENERGY
CONSUMPTION
SORTING and WASHING 8 8 0.54
EXTRACTION 52 52 3.53
FILTRATION 12 12 0.82
CENTRIFUGATION 17 17 1.15
PASTEURIZATION 1177 34 1211 (79.96 + 2.31)
82.27 ASEPTIC FILLING and PACKAGING
147 147 9.99
AUXILIARY PROCESSES 25 25 1.70
TOTAL 1177 295 1472 100.00
TABLE 2: THERMAL AND ELECTRICAL ENERGY CONSUMPTION PER PROCESS IN ORANGE JUICE MANUFACTURING
(ELABORATION FROM A SAMPLE OF SPECIFIC ENERGY AUDITS AND FROM WAHEED ET AL., 2008).

19 D.3.6 Extended Value Stream Maps of NACE 10.3: Fruit juices and purees and tomato concentrates
With the aim of putting more in evidence the main energy consumptions in this sector, in Table 3, we also report the processes’ energy consumptions, in
terms of steam for the thermal processes and in terms of electricity for the electrical ones, for another common fruit product, that is the frozen
concentrated citrus juice (the concentrate is frozen and stored until needed). Data reported in Table 3 have been elaborated from a sample of specific
energy audits and from Masanet et al., 2008. In this different case, the more energy intensive process is the concentration, consuming an estimated 0.58
kWh of steam per kg of citrus juice concentrate. During the concentration phase, juice is concentrated in a high vacuum evaporator, resulting in the
evaporation of water from the juice and in the concentration of juice sugars and solids. The frozen process, of course, also requires about one fourth of
the total needed energy.
PROCESS
PROCESS ENERGY INTENSITY (kJ/kg)
STEAM ELECTRICITY TOTAL %
SORTING 124 124 2.46
WASHING 421 124 545 (8.37 + 2.46)
10.83
EXTRACTION 37 37 0.74
DEAERATION 120 120 2.38
CONCENTRATION 2070
2070 41.14
HOMOGENEIZATION (blending)
76 76 1.51
CAN FILLING 80 80 1.59
BLAST FREEZING 1230 1230 24.44
AUXILIARY PROCESSES 750 750 14.90
TOTAL
5032 100%
TABLE 1: REPRESENTATIVE PROCESS ENERGY CONSUMPTIONS IN FROZEN CONCENTRATED CITRUS JUICE MANUFACTURE
(ELABORATION FROM A SAMPLE OF SPECIFIC ENERGY AUDITS AND FROM MASANET ET AL., 2008).

20 D.3.6 Extended Value Stream Maps of NACE 10.3: Fruit juices and purees and tomato concentrates
2.5 Identification of the key points for setting up the baselines in electric and thermal processes
Taking into consideration the identification of the inputs and outputs of main processes regarding the energy issues, the most relevant key points for
setting up the Key Performance Indicators are below described.
Thermal process:
Pasteurization: Improvements are possible but there are operating limits to obtain an effective treatment without affecting the quality of the juice.
For example, it could be possible to recover the heat content of processed juice in a counter current heat exchanger. Innovative techniques to
avoid pasteurization are still under evaluation from industry. These include processes of irradiation, hydrostatic pressure, ultrasound, high
intensity pulsed electrical fields, and oscillating magnetic fields.
Electricity consumption:
Extraction, Aseptic Filling and Packaging: These represent the processes in which more electricity is consumed, in particular in large-scale
production. Energy savings can be attained adopting equipment with high mechanical and electrical efficiency and paying more attention to
preventive maintenance activities.
This is only a preliminary approach to the identification of the Key Performance Indicators. The expert team responsible for the tasks related to setting up
the Key Performance Indicators in thermal processes and electricity consumption will define the final ones according to their expertise.
21 D.3.6 Extended Value Stream Maps of NACE 10.3: Fruit juices and purees and tomato concentrates
2.6 Possible inefficiencies in the performance of the processes for the production of orange juice, fruit juices and
fruit purées
General inefficiencies may occur in the above described manufacturing line, in particular “bottlenecks” and “unscheduled downtime” in the processes.
According to the modern Theory of Constraints, a “bottleneck” is the work station with the lowest effective capacity or throughput rate. As a
consequence, given that “the output of the entire process ise defined by the output of its weakest link (Ernst & Young Global Limited, 2013), a
“bottleneck” equipment imposes its cadence to the whole pathway making the other equipment operate at low energy yields. Changing the ““bottleneck”
equipment by another with a higher nominal flow rate would allow to reduce the travel time of the products while making energy savings. Differently, the
downtime of a process occurs when a manufacturing process stops for an unplanned event (as for a motor failure), accumulating downtime. Downtime
can also be triggered by material issues, a shortage of operators, or unscheduled maintenance. Clearly, unscheduled downtime is related to energy
efficiency. During downtime periods, value-adding energy is not consumed but non value-adding energy keeps being consumed. Some examples are
energy consumption for storing refrigerated chambers, lighting or air conditioning for plant heating or refrigeration.

22 D.3.6 Extended Value Stream Maps of NACE 10.3: Fruit juices and purees and tomato concentrates
3. Fruit juices
Fruit juices are intended as a product for direct consumption and are obtained by the extraction of the cellular juice from fruits. The juice extraction
operation can be performed by pressing or by diffusion. For classification, fruit juices do not present pulp (differently from fruit pulps, purées and
nectars – see Section 4 of this document) and can be clarified or not clarified. Natural juice products are obtained from one fruit, while mixed juice
products are obtained from the mixing of two or three juices from different fruit species or by adding sugar. Juices obtained through the removal of the
major part of their water content by vacuum evaporation or fractional freezing are defined as concentrated juices. Fruits are composed of water up to
the 75–90%, which is mainly found in plant cell vacuoles and confer turgidity to the fruit tissue. Juice is the liquid extracted from the cells of mature fruits.
Fruit cell wall is made of cellulose, hemicellulose, pectic substances, and proteins.
A fruit juice plant can vary from a simple facility performing a single juice extraction and canning, to a complex manufacturing facility, provided with
ultrafiltration and reverse osmosis equipment, cold storage, and a waste treatment plant.
Production of fruit juices can be divided into four basic principal stages:
Front-end operations, including those operations related with the reception and classification of fruits.
Juice extraction, which is the separation of water and soluble solids depending on the fruit variety.
Juice clarification and fining. The conventional route to concentration is to strip aroma, then take out the pectin with enzymes, centrifuge to
remove heavy sediments and filter through pressure pre-coat and polish filters.
Juice pasteurization and concentration.
The main processes of these four stages can be visualized in the following current value stream map in Section 3.1 and are better described in the
dedicated Section 3.2.

23 D.3.6 Extended Value Stream Maps of NACE 10.3: Fruit juices and purees and tomato concentrates
3.1 Current Value Stream Mapping

24 D.3.6 Extended Value Stream Maps of NACE 10.3: Fruit juices and purees and tomato concentrates
FIGURE 3: CURRENT VALUE STREAM MAP FOR AN EXEMPLARY PLANT PROCESSING FRUIT JUICES.

25 D.3.6 Extended Value Stream Maps of NACE 10.3: Fruit juices and purees and tomato concentrates
3.2 Processes description
All fruit juices’ processing lines share several operative phases and equipment. A general flow process diagram (FPD) for fruit juice production is shown in the figure below.
FIGURE 4: TYPICAL FRUIT JUICE (BOTH CLEAR AND CLOUDY) PROCESSING LINE STEPS IN YELLOW BOXES.
WHITE BOXES REFER TO PURÉE-PROCESSING LINE STEPS, WHICH ARE USUALLY PERFORMED IN THE SAME FIRM (ADAPTED FROM LOZANO, 2006).
26 D.3.6 Extended Value Stream Maps of NACE 10.3: Fruit juices and purees and tomato concentrates
Fruit reception
Fruit origin and varieties are recorded. Fruits are weighted and unloaded into harvesting containers. Bins are commonly used worldwide for this purpose.
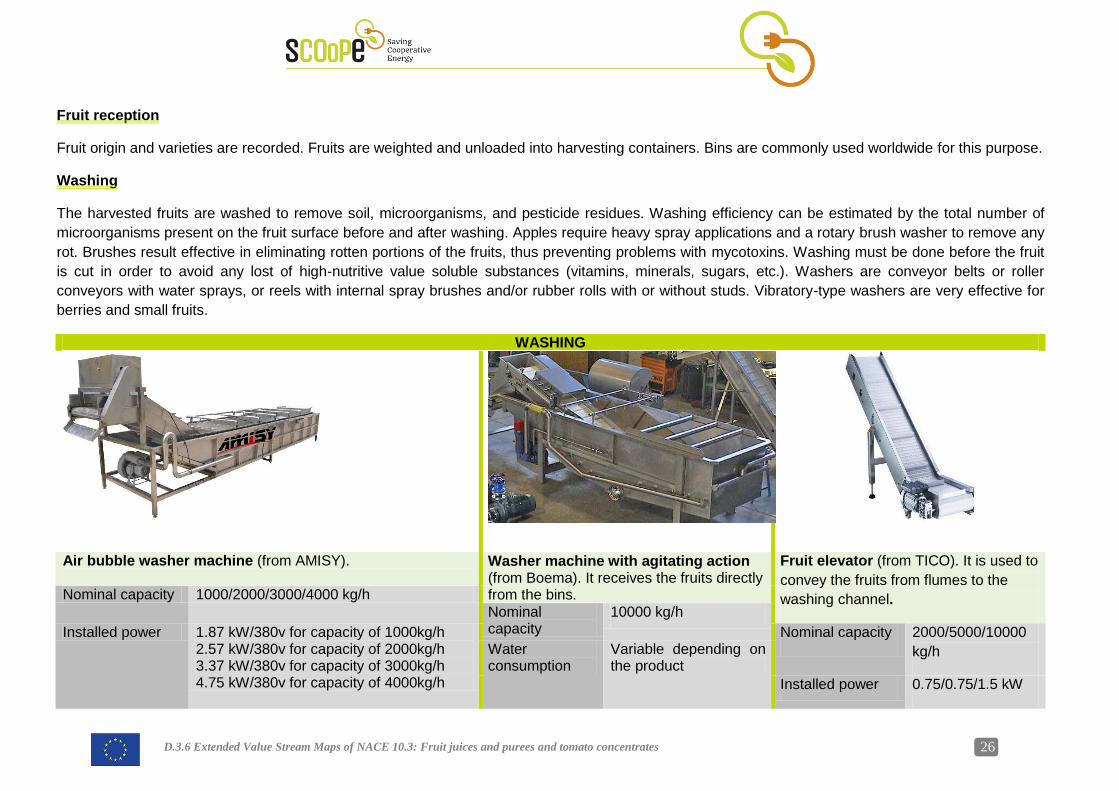
Washing
The harvested fruits are washed to remove soil, microorganisms, and pesticide residues. Washing efficiency can be estimated by the total number of
microorganisms present on the fruit surface before and after washing. Apples require heavy spray applications and a rotary brush washer to remove any
rot. Brushes result effective in eliminating rotten portions of the fruits, thus preventing problems with mycotoxins. Washing must be done before the fruit
is cut in order to avoid any lost of high-nutritive value soluble substances (vitamins, minerals, sugars, etc.). Washers are conveyor belts or roller
conveyors with water sprays, or reels with internal spray brushes and/or rubber rolls with or without studs. Vibratory-type washers are very effective for
berries and small fruits.
WASHING
Air bubble washer machine (from AMISY).
Washer machine with agitating action (from Boema). It receives the fruits directly from the bins.
Fruit elevator (from TICO). It is used to
convey the fruits from flumes to the
washing channel. Nominal capacity 1000/2000/3000/4000 kg/h
Nominal capacity
10000 kg/h
Installed power 1.87 kW/380v for capacity of 1000kg/h 2.57 kW/380v for capacity of 2000kg/h 3.37 kW/380v for capacity of 3000kg/h 4.75 kW/380v for capacity of 4000kg/h
Nominal capacity 2000/5000/10000
kg/h Water consumption
Variable depending on the product
Installed power 0.75/0.75/1.5 kW

27 D.3.6 Extended Value Stream Maps of NACE 10.3: Fruit juices and purees and tomato concentrates
Grading, inspection and sorting
Fruit sorting pays attention to the removal of damaged fruits and any foreign substance. This process is also a qualitative sorting based on organoleptic
criteria and maturity stage.
Peeling (skin removal), cutting and destoning.
SORTING, PEELING, DESTONING
Fruit sorting belt (from Boema). Steam peeler (from Boema). Fruit destoner (from Voran). The stones are
ejected separately from the mash.
Nominal capacity Depending on the model, up to 3, 6, 9, 16 and 22 ton/h
Nominal capacity
Variable and depending on the product, on the belt speed and on the model. Up to 15 ton/h.
Nominal capacity Up to 500 kg/h or up to 1000 kg/h
Installed power 5,6 kW for production up to 9 ton/h 6 kW for production up to 16 ton/h 8 kW for production up to 22 ton/h
Steam consumption
0.1÷0.2 kg of steam/1kg of product Installed power 3.0 (4.0) kW (PS) or 5.5 (7.5) kW (PS)

28 D.3.6 Extended Value Stream Maps of NACE 10.3: Fruit juices and purees and tomato concentrates
Extraction
The method of separating most of water and soluble solids (juicing) depends on the variety of fruit. Most of the systems for extracting juices from
apples and similar fruit pulps use some method of pressing juice through cloth of various thicknesses, in which pomace is retained. These systems,
called filter presses, include (i) rack and cloth press, (ii) horizontal pack press, (iii) continuous belt press, and (iv) screw press. During the pressing
step, the juice passes from the pulp through press cloth sleeve, along grooves in the flexible rods, and out to collecting channels at the ends of the
cage and the piston. The drum may be rotated, thereby breaking up the pulp and adding more water. This permits a second pressing with more juice
extraction. The whole process may be automated.
Extraction can also be performed through centrifugation. Both cone and basket centrifuges can be used for producing fruit juice.
Decanters are used for the extraction of finely solubilized fruit and vegetable mashes. Some decanters may excel in high yields and can be used
flexibly for different applications. When they allow a high separation efficiency, they bring to a lower energy consumption.
Clarification and Fining
The juice is usually concentrated through a multistage vacuum concentrator. This process involves a slight decrease in concentration of juice during
the stripping step (usually up to 10% volume is removed). For clarification different enzymes are used. Commercial pectic enzimes (pectinases) and
others are used to help extract, clarify and modify juices from many fruits. When a cloudy juice or nectar is preferred (for example, with oranges,
pineapples, or apricots) there is no need to clarify the liquid, and enzymes are used to enhance the extraction or perform other modifications. For a
clear juice, these suspended particles must be removed. It is not sufficient to filtrate, it is necessary to use a commercial enzyme to remove unwanted
pectin.
When a more concentrated juice is clarified (~20 °Brix) the volume to handle is reduced practically of an half. If a cloudy product is required, the juice
is pasteurized immediately after pressing to denature any residual enzymes. Centrifugation then removes large pieces of debris, leaving most of the
small particles in suspension. Although this method of conventional clarification was widely used in the clarified juice industry, this technology has
been practically replaced by mechanical processes such as ultrafiltration and centrifugal decanters.
Deaeration It preserves the product quality and avoids alteration of the electrical characteristics of the final fruit juice. The process generally occurs at room temperature, and removes the excess air trapped inside the juice. In fact, the oxygen present could lead to fruit oxidation, with consequences on fruits’ color and flavor. A further deaeration process is sometimes performed at hot temperature.

29 D.3.6 Extended Value Stream Maps of NACE 10.3: Fruit juices and purees and tomato concentrates
CLARIFICATION AND FINING
Decanter (from Flottweg).
Disk stack centrifuge (from Flottweg). It is used as clarifiers for the separation of fine solids that are not desired in the final product.
Nominal capacity 8-15/15-30/30-60/45-90/70-140/120-250 m3/h
Max. bowl volume 4/14/25/58 L
Installed power in the motor for bowl drive
5.5-7.5/7.5-15/15-30/30-55/55-
110/90-200 kW
Max. solids volume 1.5/7/11.5/22.5 L
Installed power in the motor for scroll drive
2.2/4/4/5.5/5.5/7.5 kW Installed power 5.5/18.5/37/55 kW

30 D.3.6 Extended Value Stream Maps of NACE 10.3: Fruit juices and purees and tomato concentrates
Pasteurization
Sterilization kills yeasts, molds, and bacteria and also to inactivate the polyphenol oxidase (PPO), enzyme responsible for the browning (oxidation) of
fruit juice. As example, clarified apple juice is typically pasteurized at 95 °C for 10–30 sec or at 85 °C for 15–120 sec.
Packaging and labelling
To ensure sterility, the pasteurized juice should be filled while still hot. Where possible, metal or glass bottles and cans can be preheated. Packaging
which cannot withstand high temperatures (e.g., aseptic, multilayer plastic juice boxes which don't require refrigeration) must be filled in a sterile
environment. Instead of heat, hydrogen peroxide or another approved sterilizing agent may be used prior to filling. In any case, the empty packages are
fed down a conveyor belt to liquid filling machinery, which is fed juice from bulk storage tanks. The filling head meters the precise amount of product into
the container, and depending on the design of the package, it may immediately invert to sterilize the lid. After filling, the containers are cooled as fast as
possible.
ASEPTIC FILLING AND PACKAGING
Brick shape carton (500-1000 ml) aseptic filling machine (from JOYTECH). Juice shelf life is 12 month at 25-30 °C.
250ml-2L bottle juice packing machine (from GOLDSAN). It can automatically rinsing, filling and rotary capping bottles.
Packaging capacity (carton range) 50-1000 ml Packaging capacity (bottle range) 250ml-2L bottle filling Packaging speed 2000 box/h Production capacity (500 ml) depending
on the model 4000-5000/6000-8000/8000-10000/10000-12000
Installed power 35 kW Compressed air pressure 0,3-0,7
Compressed air 0.4-0.6 Mpa, 1 m3/min air Total power depending on model 3.13/3.84/4.1/5.6 kW

31 D.3.6 Extended Value Stream Maps of NACE 10.3: Fruit juices and purees and tomato concentrates
3.3 Overview list of the processes and equipment
PROCESS EQUIPMENT N° of
UNITS
ELECTRIC and/or
THERMAL SOURCE of ENERGY
FRUIT RECEPTION
TRUCKS FOR TRANSPORTATION
3 Electric and
thermal
Electricity, diesel fuel and other petroleum products,
biofuel, natural gas
OFFLOADING AREA, BINS - -
DUMPER TRAILER 2 Electric Electricity
STORAGE (before entering the processing line)
COLD AREA/COLD CHAMBER/REFRIGERATED STORAGE AREA
1 Electric Electricity
WASHING
WASHING MACHINE (brush washer)
1 Electric and
Thermal Electricity and gas
PUMPING TO NEXT PROCESS (sorting station)
1 Electric Electricity
INSPECTION and GRADING
AUTOMATIC SORTING MACHINE (a sorting conveyor like a belt roller).
1 Electric Electricity
CONVEYOR TO NEXT PROCESS
1 Electric Electricity
PEELING STEAM PEELER 1
Electric and Thermal
Electricity, high pressure steam
PUMPING TO NEXT PROCESS
1 Electric Electricity
CUTTING FRUIT CUTTER 1 Electric Elecricity
PUMPING TO NEXT PROCESS
1 Electric Electricity
DESTONING FRUIT DESTONER 1 Electric Electricity

32 D.3.6 Extended Value Stream Maps of NACE 10.3: Fruit juices and purees and tomato concentrates
PUMPING TO NEXT PROCESS
1 Electric Elecricity
EXTRACTION DISK STACK CENTRIFUGE 1 Electric Elecricity
PUMPING TO NEXT PROCESS
1 Electric Electricity
CLARIFICATION and FINING
CENTRIFUGAL DECANTER 1 Electric Electricity
PUMPING TO NEXT PROCESS
1 Electric Electricity
DEAERATION DEAERATOR 1 Electric Electricity
PASTEURIZATION STERILIZER 1 Thermal
An evaporator has an heat source (normally steam) that
evaporates the water. PUMPING TO NEXT PROCESS
1 Electric Electricity
ASEPTIC FILLING ASEPTIC FILLER 1 Electric Electricity
PUMPING TO NEXT PROCESS
1 Electric Electricity
REDUCTION OF TEMPERATURE and PACKAGING
PACKAGING/LABELLING STATION (wraparound)
1 Electric Electricity
PUMPING TO NEXT PROCESS
1 Electric Electricity
STORAGE/LOGISTICS COLD AREA 1 - -
TABLE 4: PROCESSES AND EQUIPMENT FOR FRUIT JUICES MANUFACTURING.

33 D.3.6 Extended Value Stream Maps of NACE 10.3: Fruit juices and purees and tomato concentrates
3.4 Sankey diagram
Sankey diagrams show energy consumption for each process, putting a visual emphasis on the major energy flows within the whole production process
carried out in fruit juices firm. They are very useful in locating dominant contributions to the overall energy flow.
FIGURE 5: AVERAGE CONSUMPTION FLOWS OF STEAM IN THE UPPER PART OF THE GRAPH, HOT WATER IN THE CENTRAL, AND ELECTRICITY IN THE LOWER ONE, IN FRUIT JUICES PRODUCTION.

34 D.3.6 Extended Value Stream Maps of NACE 10.3: Fruit juices and purees and tomato concentrates
In following table the energy requirements graphed in the above Sankey diagram for the main unit operations are reported (final data have been
elaborated from a sample of specific energy audits and from Masanet et al., 2008).
PROCESS PROCESS ENERGY INTENSITY (kJ/kg)
STEAM HOT WATER ELECTRICITY TOTAL %
INSPECTION and GRADING 16 16 0.89
WASHING 499 16 515 (27.80+0.89)
28.69
PULPING/EXTRACTION 28 28 1.56
VACUUM DEAERATION 30 30 1.67
PASTEURIZATION 306
306 17.05
CAN WASHING 499
499 27.80
HOT CAN FILLING 16 16 0.89
CAN SEALING 76 18 94 (4.23+1.00)
5.23 HEAT STERILIZATION (RETORT)
230 230 12.81
COOLING 16 16 0.89
PACKAGING 30 30 1.67
AUXILIARY PROCESSES 15 15 0.84
TOTAL 918 998 185 1795 100.00
TABLE 5: REPRESENTATIVE PROCESS ENERGY CONSUMPTIONS, IN TERMS OF STEAM, HOT WATER AND ELECTRICITY, IN FRUIT JUICE CANNING
(ELABORATION FROM A SAMPLE OF SPECIFIC ENERGY AUDITS AND MASANET ET AL., 2008).

35 D.3.6 Extended Value Stream Maps of NACE 10.3: Fruit juices and purees and tomato concentrates
3.5 Identification of the key points for setting up the baselines in electric and thermal processes
Taking into consideration the identification of the inputs and outputs of the main processes regarding energy issues, together with the Sankey diagram
showing an average energy balance for the production of fruit juices, the most relevant key points for setting up the Key Performance Indicators are
below reported.
Thermal processes:
Pasteurization. Due to the use of steam and water in this process, the energy and water consumptions are very relevant, so it should be
recommendable setting up a Key Performance Indicator correspondent to the pasteurization process. Improvements are possible but there are
operative limits to obtain an effective treatment without affecting the quality of the juice. For example, it could be possible to recover the heat
content of processed juice in a counter current heat exchanger. Innovative techniques to avoid pasteurization are still under evaluation from
industry. These include processes of irradiation, hydrostatic pressure, ultrasound, high intensity pulsed electrical fields, and oscillating magnetic
fields.
Electricity consumption:
Extraction, Aseptic Filling and Packaging. These represent the processes in which more electricity is consumed, in particular in large-scale
production. Energy savings can be attained adopting equipment with high mechanical and electrical efficiency and making attention to
maintenance. The filling of orange juice tetrapack should be carried in a refrigerated environment, with the aim of avoiding electrical consumption
to maintain temperature.
Electricity is required in most of the production processing steps. In the preliminary stage of the raw material preparation, energy requirements may
be less in small-scale and artisanal production lines where some of the processes are done by hand.
During the storage, there is a certain energy consumption for cooling the storage area and this point can be focused to gain a specific electric KPI.
From the electric point of view, electrical energy average KPIs may be just defined for a specific electric plant/equipment based on its activity and
its energy consumption. Another suggestion for electrical energy average KPI in the specific subsector of fruit purées production may be simply
based on the electricity bill, normalized for the total production per campaign.
This is only a preliminary approach to the identification of the Key Performance Indicators. The expert team responsible for the tasks related to setting up
the Key Performance Indicators in thermal processes and electricity consumption will define the final ones according to their expertise.
36 D.3.6 Extended Value Stream Maps of NACE 10.3: Fruit juices and purees and tomato concentrates
4. Fruit purees
Freshly-pureed fruit (and vegetable) raw materials offer a clean and natural taste, combined with a full-bodied mouthfeel. Gentle processing after
pressing retains the very best of fruit and vegetables, and purées usually retain the majority of a fruit’s acid, sugar and color content. The pulpiness
depends on the screen size used in the finishing process.
Several large processing plants producing fruit purées use to be equipped with wide refrigerated and deep-freeze warehouses, in order to deliver fresh
purées all year round. Thanks to the latest technologies, the market offers tailor-made qualities in a wide range of packaging.
Purées can be classified into:
Purées NFC (Not From Concentrate), in which the fruit is processed (heat treated and sieved) to remove the skin (and usually the seeds) and
then finished through screens to a specified consistency or smoothness. Purées NFC are pasteurized.
Purées Concentrate, in which the fruit is processed (heat treated and sieved) to remove the skin (and usually the seeds) and then finished
through screens to a specified consistency or smoothness. Then, the solution is depectinized, filtered and evaporated under vacuum to a
specified Brix level, usually folded two to seven times the original Brix value. Concentrated are favored for easy-of-use and economical storage
and transport.
Some fruits as mangos and bananas are processed only into purées. The first steps of the fruit purées production process are mostly the same as for
the fruit juices. Usually, after washing, such processes follow different operational manufacturing lines. However, there are firms specialized only for
producing fruit purée and in this section of the report is focused in plants specialized only in fruit purées’ manufacturing.

37 D.3.6 Extended Value Stream Maps of NACE 10.3: Fruit juices and purees and tomato concentrates
4.1 Current Value Stream mapping

38 D.3.6 Extended Value Stream Maps of NACE 10.3: Fruit juices and purees and tomato concentrates
FIGURE 6: CURRENT VALUE STREAM MAP FOR AN EXEMPLARY PLANT PROCESSING FRUIT PURÉES.

39 D.3.6 Extended Value Stream Maps of NACE 10.3: Fruit juices and purees and tomato concentrates
4.2 Processes description
FIGURE 7: MOST TYPICAL STEPS IN FRUIT PURÉES-PROCESSING LINE (ELABORATION FROM LOZANO, 2006).
The Figure 7 shows very schematically the main operations performed for the manufacturing of fruit purées. Below, we report a more detailed processes’
description, including other important processes not present in the Figure 7.

40 D.3.6 Extended Value Stream Maps of NACE 10.3: Fruit juices and purees and tomato concentrates
Receiving Raw materials contained in bins are unloaded by trucks and kept in a holding area. A visual inspection is immediately performed on the material entering the manufacturing plant to check for quality, etc.
Storage Waiting of being transformed, raw materials are normally stored in storage areas located in the proximity of the plant building. Storage at the environmental temperature must be generally for a short period of time because the temperature is non controlled and it uses to occur when the raw material delivery is planned in relation to the production. Otherwise, the raw materials are kept in storage rooms at 0 °C temperature. Inspection Raw fruits pass through a properly designed sorting belt, while operators or a mechanical automated tool execute a material control before entering the next phases of the processing line. In this step unwholesome and immature fruits are removed. Washing and sorting These processes often occurs at the same time. The material is forwarded into water-filled tanks, then passes on a roller conveyor with incorporated showers and brushes for a further washing. Then, operators check manually the fruit integrity and discharge the damaged fruits and those presenting some kind of rot spots.

41 D.3.6 Extended Value Stream Maps of NACE 10.3: Fruit juices and purees and tomato concentrates
WASHING
Fruit washing machine. Air bubble washer machine (from AMISY).
Nominal capacity 1000/2500 Kg/h (depends upon the fruit). Nominal capacity depending on the model
1000/2000/3000/4000 kg/h
Installed power in the conveyor motor
0.74/1.1 kW in the water circulation pump 1.47 kW in the fresh water spray pump 1.47 kW in the air blower 0.74 kWin the conveyor motor
Installed power/voltage depending on the model.
1.87 kW/380v for capacity of 1000kg/h 2.57 kW/380v for capacity of 2000kg/h 3.37 kW/380v for capacity of 3000kg/h 4.75 kW/380v for capacity of 4000kg/h
Peeling: This process is important for fruit as apples and peaches, and aims to remove peels whit as little loss of usable product as possible. De-stoning: This step is important to separate the stone from the pulp. It is carried out for fruits as peaches and apricots, plums and cherries. Blanching Blanching is a thermal treatment applied to raw vegetables before preservation processes like canning, freezing, or drying. The main purposes of blanching are to inactivate enzymes, which can cause discoloration, and undesirable changes in product flavor and aroma, and to destroy any life processes, yeast, and mold that may be present in the product prior to further processing. Blanching may be accomplished with hot water or steam. Some products are blanched in hot water to preserve colour and texture. Steam blanching is quicker than hot water blanching and there is less leaching of nutrients from products during steam blanching. This treatment occurs at temperature of 95 – 100 °C for a short time (from few second to few minutes).

42 D.3.6 Extended Value Stream Maps of NACE 10.3: Fruit juices and purees and tomato concentrates
BLANCHING
Fruit blanching machine. Pre-cooking time: 1-30 minutes adjustable. Blancher cooker (from Boema).
Nominal capacity depending on the model 2-3 t/h Nominal capacity Up to 1.5 t/h
Installed power Frequency convertion motor power 2.2 kW
Installed electric power 30 kW
Milling (chopping/crushing) Specifically for fruit purées, the obtained pulp (deprived of epidermis and stone) is grinded up to obtain a right consistence.
Filtration (finishing) The purée is filtrated to eliminate any kind of impurity (epidermis, stone seed particles, etc.), according to the specific characteristics of the desired final product.

43 D.3.6 Extended Value Stream Maps of NACE 10.3: Fruit juices and purees and tomato concentrates
Deaeration This particular process is necessary to preserve the product quality and to avoid any stress that could alter the electrical characteristics of the final purées. Deaeration process, which generally occurs at room temperature, removes the excess air trapped inside the purées. In fact, significant amount of oxygen may be present as result of the grinding and filtering processes, increasing the risk of fruit oxidation, leading to possible color and flavor alterations. Sometimes a further deaeration process is performed at hot temperature to further reduce the presence of oxygen.
EXTRACTION DEAERATION
Purées extraction and refining group (from Boema). Vacuum deaerator machine (from Alfa Laval).
Installed power depending on rotor length (400, 450 or 600 mm) and number of rotors (one or two)
55/75/90/110 kW Volume: 2000 L; weight: 800 kg.
Installed power 1.5 kW
Pasteurization For fruit purées and fruit juices, pasteurization is a mild thermal process. Liquids are heated to a temperature below 100 °C for a sufficient amount of time to destroy pathogenic microorganisms. It is worthy of note that the pasteurization process does not kill heat resistant microorganisms and, for this

44 D.3.6 Extended Value Stream Maps of NACE 10.3: Fruit juices and purees and tomato concentrates
reason, the pasteurized products have a shorter shelf life than those heat sterilized. After pasteurization, MUST be refrigerated and consumed in a short-time. Aseptic filling The product is pumped into a filler machine. The filling piston pushes the product into the containers through a rotary valve located at the bottom of the measuring cylinder, ensuring high filling accuracy. The aseptic filler is equipped with “a no jar no fill” device, which ensures the final product is not lost if containers are not positioned. The containers are trays in aluminum material or in food PE. The filled trays are transferred from the filler to the capper. The capper is a linear machine that closes jars under steam vacuum, ensuring air removal from the headspace.
ASEPTIC FILLING AND PACKAGING
Brick shape carton (500-1000 ml) aseptic filling machine (from JOYTECH). Juice shelf life is 12 month at 25-30 °C.
250ml-2L bottle juice packing machine (from GOLDSAN). It can automatically rinsing, filling and rotary capping bottles.
Nominal packaging capacity (carton range)
50-1000 ml Nominal packaging capacity (bottle range) 250ml-2L bottle filling
Packaging speed 2000 box/h Production capacity (500 ml) depending on the model
4000-5000/6000-8000/8000-10000/10000-12000
Installed power 35 kW Compressed air pressure 0,3-0,7
Compressed air 0.4-0.6 Mpa, 1 m3/min air
Installed power depending on model 3.13/3.84/4.1/5.6 kW

45 D.3.6 Extended Value Stream Maps of NACE 10.3: Fruit juices and purees and tomato concentrates
Reduction of temperature and Packaging A temperature reduction is performed in order to avoid the breaking of glass containers due to thermal shock. Then, the containers are conveyed to the labeling and packaging lines.
PACKAGING
Master type Cartesian palletizer (from Europack) for palletizing packed products, from boxes to wrapped packages, cans, cases, bags and spools. This machine can work with more pallets at the same time.
Nominal capacity depending on the model 240-300 cycle/h for max. 100 kg load; 300-360 or 360-420 cycle/h for max. 30 kg load.
Installed power depending on the model 3 kW for capacity of 240-300 and 300-360 cycle/hour 4 kW for capacity of 360-420 cycle/hour
Storage: Final processed product is inventoried at 4 °C temperature.

46 D.3.6 Extended Value Stream Maps of NACE 10.3: Fruit juices and purees and tomato concentrates
4.3 Overview list of the processes and equipment
PROCESS EQUIPMENT N° of
UNITS ELECTRIC and/or
THERMAL SOURCE of ENERGY
FRUIT RECEPTION
TRUCKS FOR TRANSPORTATION 3 Electric and thermal Electricity, diesel fuel and other petroleum
products, biofuel, natural gas
OFFLOADING AREA, BINS - -
DUMPER TRAILER 2 Electric Electricity
STORAGE (before entering the processing line)
COLD AREA/COLD CHAMER/REFRIGERATED STORAGE AREA
1 Electric Electricity
WASHING WASHING MACHINE (brush washer) 1 Electric and Thermal Electricity and gas
PUMPING TO NEXT PROCESS (sorting station)
1 Electric Electricity
SORTING
AUTOMATIC SORTING MACHINE (a sorting conveyor like a belt roller).
1 Electric Electricity
CONVEYOR TO NEXT PROCESS 1 Electric Electricity
PEELING PEELER/BRUSH PEELER 1 Electric Elecricity
PUMPING TO NEXT PROCESS 1 Electric Electricity
DESTONING DESTONER 1 Electric Electricity
PUMPING TO NEXT PROCESS 1 Electric Elecricity
BLANCHING TUBULAR BLANCHING 1 Themal Steam or hot water
PUMPING TO NEXT PROCESS 1 Electric Electricity

47 D.3.6 Extended Value Stream Maps of NACE 10.3: Fruit juices and purees and tomato concentrates
MILLING
PULPING MACHINE OR CRUSHER OR CENTRIFUGAL EXTRACTOR
1 Electric and thermal Electricity and gas
PUMPING TO NEXT PROCESS 1 Electric Electricity
SEEDS’ REMOVAL FILTRATOR 1 Electric Electricity
PUMPING TO NEXT PROCESS 1 Electric Electricity
DEAERATION VACUUM DEGASSER/DEAERATOR 1 Electric Electricity
PUMPING TO NEXT PROCESS 1 Electric Electricity
PASTEURIZATION STERILIZER 1 Thermal
An evaporator has a heat source (normally steam fueled by gas) that evaporates the
water.
PUMPING TO NEXT PROCESS 1 Electric Electricity
ASEPTIC FILLING ASEPTIC FILLER 1 Electric Electricity
PUMPING TO NEXT PROCESS 1 Electric Electricity
REDUCTION OF TEMPERATURE and PACKAGING
PACKAGING/LABELLING STATION (wraparound)
1 Electric Electricity
PUMPING TO NEXT PROCESS 1 Electric Electricity
STORAGE/LOGISTICS COLD AREA 1 - -
TABLE 6: PROCESSES AND EQUIPMENT FOR FRUIT PURÉES MANUFACTURING.

48 D.3.6 Extended Value Stream Maps of NACE 10.3: Fruit juices and purees and tomato concentrates
4.4 Sankey diagram
Sankey diagrams show energy consumption for each process, putting a visual emphasis on the major energy flows within the whole production process
carried out in an fruit purée producing firm. They are very useful in locating dominant contributions to the overall energy flow.
FIGURE 8: AVERAGE CONSUMPTION FLOWS OF THERMAL ENERGY IN THE UPPER PART OF THE GRAPH, AND ELECTRICITY IN THE LOWER ONE, IN FRUIT PURÉES PRODUCTION
(FINAL DATA ELABORATED FROM SPECIFIC ENERGY AUDIT INFORMATION AND FROM REYES-DE-CORCUERA ET AL., 2014).

49 D.3.6 Extended Value Stream Maps of NACE 10.3: Fruit juices and purees and tomato concentrates
4.5 Identification of the key points for setting up the baselines in electric and thermal processes
Taking into consideration the identification of the inputs and outputs of the main processes regarding energy issues, together with the Sankey diagram
showing an average energy balance for the production of fruit purées, the most relevant key points for setting up the Key Performance Indicators are
below reported.
Thermal processes:
Blanching. All blanchers are energy intensive. Blanching may be accomplished by hot water or steam.. Most water blanchers and steam
blanchers require steam that is produced by a boiler (normally 2-8 kg of steam is required to process 1 kg of products according to Wang, 2008).
With water blanching, the steam heats the water and the product. With steam blanching, the steam is applied directly to the product. Because the
boiler is one of the most expensive pieces of equipment to operate in a food processing plant, given the high cost of energy, steam consumption
has a direct and significant affect on energy costs. Compared to the most modern water blanchers, steam blanchers use approximately half the
steam. Compared to older water blanchers, steam blanchers can often reduce steam use by as much as 80 percent. The energy costs
associated with the blanching operation mirrors this reduction. Moreover, steam blanching reduces the costs to obtain water and handle
wastewater and minimizes the capital costs and operational costs associated with the boiler. With the trend toward higher energy costs, higher
water costs, greater restrictions on the quality of wastewater, and increasing consumer demand for more nutrient-rich products, the market
conditions are increasingly favoring the use of steam blanching over water blanching (Key Technology. White Paper on steam vs. water
blanching).
Pasteurization. Due to the use of steam and water in this process, the energy and water consumptions are very relevant, so it should be
recommendable setting up a Key Performance Indicator correspondent to the pasteurization process.
Electricity consumption:
Electricity is required in most of the production processing steps. In the preliminary stage of the raw material preparation, energy requirements
may be less in small-scale and artisanal production lines where some of the processes are done by hand.
During the storage, there is a certain energy consumption for cooling the storage area and this point can be focused to gain a specific electric
KPI. From the electric point of view, electrical energy average KPIs may be simply be defined for a specific electric plant/equipment based on its
activity and its energy consumption. Another suggestion for electrical energy average KPI in the specific subsector of fruit purées production may
be simply based on the electricity bill, normalized for the total production per campaign.
This is only a preliminary approach to the identification of the Key Performance Indicators. The expert team responsible for the tasks related to setting up
the Key Performance Indicators in thermal processes and electricity consumption will define the final ones according to their expertise.

50 D.3.6 Extended Value Stream Maps of NACE 10.3: Fruit juices and purees and tomato concentrates
5. Tomato concentrate
This document, taking as a first starting point the Current Value Stream Mapping of the industrial agro-food sector of tomato transformation - particularly
TOMATO CONCENTRATE production activities - contains the description of the whole industrial process, step-by-step, including the associated
equipment. In this document, the most relevant processes from the energy point of view have been highlighted in order to serve as basis for the further
tasks of the project, as the setting up of benchmarking baselines in thermal and electricity consumption.
According to Eurostat, in Europe, in 2015, concentrated tomato puree and paste (PRODCOM Code 10391721) represented more than 8.5 billion Euros
of production value (approximately 72.5 million Euros in Italy, 49.8 in Spain, 45 in Portugal, 12.3 in France and 8.3 in Greece).
Cooperatives and enterprises involved in the transformation of tomatoes show a relevant energy consumption that depends on the specific final product.
On average, for preserved tomatoes, thermal energy consumption is 1200-1500 kJ/kg and electricity is 0.009-0.0012 kWh/kg; for tomato concentrates,
thermal energy consumption is 8500-12000 kJ/kg and electricity is 0.05-0.085 kWh/kg (data from ENEA, ENEL, ENI, IASM, December 1985). The
significant variation in the electrical energy consumption among different tomato plants is mainly due to the production capacity.
A plant (medium or large enterprise) producing some hundreds tons (let’s say 500 tonnes/day) of fresh tomato paste per day requires a precise and
constant supplying of fresh tomato fruits (raw materials), which can be achieved or by organizing tomato harvesting and delivering so that the precise
amounts may reach the plant at the right moment, or by installing water tanks in the processing plant. In general these are cement tanks, 5 x 30 m/each,
and each one contains about 150 tons of tomatoes and 150 tons of water, that allow to replenish constantly the process line, acting as stockpiles.
It is of fundamental importance that the tomato processing line is continuously operative at the maximum capacity, and it is not possible to work at very
low capacity or intermittently. In fact, every time the tomato line process is switched off, machines must be accurately cleaned, thus loosing several
working hours, wasting a great amount of water, and wasting either fresh tomatoes waiting in trucks outside or tomatoes in the facility in various stage of
processing, particularly in the evaporator. Moreover, fresh and ripe tomatoes cannot wait more than 1-2 days to be processed outside the plant, where
the temperature may be over 30 °C, because this would determine a less quality final product with a lower Brix. For all these reasons, the best solution is
to produce paste all day, every day.
Given that tomatoes contain on average 95% water and 5% solids/sugars, production of tomato paste requires a lot of tomatoes. The term “tomato
paste”, which includes different degrees of concentration, is related to canned tomatoes prepared by eliminating a part of the water from the pulpy juice
obtained by homogenising fresh tomatoes and sieving the resulting chopped product. To prepare tomato paste, tomatoes must be riche in colour, flavour
and aroma, with the right acidity level and a high sugar content.
For definition:

51 D.3.6 Extended Value Stream Maps of NACE 10.3: Fruit juices and purees and tomato concentrates
Tomato paste contains more than 18% solid material (18 °Brix).
“Double concentrate” tomato paste contains more than 28% solid material (28 °Brix), obtained by Hot Break (HB) technology. In HB, fresh
tomatoes must be heated immediately after chopping to a very high temperature ranging from 85 to 100 °C.
“Triple concentrate” tomato paste contains more than 36% solid material (36 °Brix), obtained by Cold Break (CB) technology. In CB, fresh,
chopped tomatoes are heated at a lower temperature ranging from 65 to 75 °C.
In general, production of tomato paste is performed during the prime time of the tomato season, when fresh tomatoes offer their best quality. Tomato is
considered a tender warm season crop. Most cultivated tomatoes requires around 75 days from transplanting to first harvest and can be harvested for
several weeks before production declines.
Production of concentrate tomato products can be carried out at a range of scales – from small scale (kilograms per hour) to large industrial scale (up to
200-300 t/hour), in which the unit energy consumption is greatly reduced. In medium and medium-large industries, the capacity of the whole tomato
paste processing line in cold-break (but also in hot-break) system may be from 0,5 to 80 tons/hour, meaning from 0,5 up to 80 ton of tomato fresh fruits
(input capacity) may be processed per hour. Higher capacity of tomato processing are recommended.
“As example of a large scale production plant, it can be considered a capacity of 20,8 tonnes/hour, reaching 500 tonnes/day and 75000 tonnes/year, in
150 working days (medium seasonal duration), 24 hours/day in three shifts.”
In such a plant, the finished concentrate may be sterilized, cooled and filled aseptic in ready-to-sell sterile bags of complex aluminium polyethylene of
variuous size between 5 to 1000 kg, or it may be as well packaged in 500 or 1000 g cans for domestic use.

52 D.3.6 Extended Value Stream Maps of NACE 10.3: Fruit juices and purees and tomato concentrates
5.1 Current Value Stream Mapping
Below an attempted Current Value Stream Mapping (CVSM) of A TRIPLE CONCENTRATE TOMATO PASTE processing plant, using the LEAN &
GREEN symbology is showed.
FIGURE 9: CURRENT VALUE STREAM MAP FOR AN EXEMPLARY PLANT PROCESSING TRIPLE CONCENTRATE TOMATO PASTE WITH A PRODUCTION CAPACITY OF 500 TON/DAY. KAIZEN BURST ICONS ARE USED TO HIGHLIGHT IMPROVEMENT NEEDS AT SPECIFIC PROCESSES THAT ARE CRITICAL TO ACHIEVING THE FUTURE STATE
MAP OF THE VALUE STREAM.
As highlighted by the Kaizen bursts, from the raw material supplier in the field/greenhouse cultivation to the entry of the manufacturing lane, there is a
strong need of input/output balancing in order to reduce as much as possible both raw material waste and energy consumption. Inside the map, the
processes more energy-consuming are the cold or hot break, the evaporation and the sterilization.

53 D.3.6 Extended Value Stream Maps of NACE 10.3: Fruit juices and purees and tomato concentrates
5.2 Processes description and equipment
FIGURE 10: SCHEME OF THE MAIN PROCESSES FOR THE TOMATO PASTE PROCESSING
(Source: http://www.jbtfoodtech.com/~/media/JBT%20FoodTech/Images/Modules/Tomato%20Processing/PDF/601-EN_Tomato%20Fruit%20PS_LR.ashx).
A brief description of the main processes for tomato paste processing follows.

54 D.3.6 Extended Value Stream Maps of NACE 10.3: Fruit juices and purees and tomato concentrates
Receiving
Fresh tomatoes arrive at the offloading area of the plant in trucks. An operator, using a special tube or pump, pipes water into the truck so that tomatoes
can flow out from the special opening at the rear of the trailer. Fresh tomatoes are unloaded into a hydraulic flume addressed to the processing line (in
this case fruits are protected by mechanical damage). Even though hydraulic transport allows to keep fruits at a lower temperature, tomatoes may be
transferred to flumes also through manual or mechanical means.
RECEIVING
Truck transporting tomatoes to the processing center.
Unloading/selection tomato paste line. Washing/selection tomato paste line.
Average capacity Average capacity 1.500 t of fresh fruit/day Average capacity
Installed power Installed power

55 D.3.6 Extended Value Stream Maps of NACE 10.3: Fruit juices and purees and tomato concentrates
Washing and Sorting
More water is continuously pumped into the collection channel and fresh tomatoes are rinsed. Tomato washing requires 3 to 5 times water with respect
to input capacity of tomato in cubic meter per hour (m3/h). For example, a 20 tons/hour rate requires at least 60 m3/hour of water. After that, in the
grading station, staff removes the damaged/defective/ immature fruits and materials other than tomatoes (MOT). In general, this process eliminates up to
5% of incoming raw materials that are placed on a reject conveyor and then collected into a storage unit to be taken away. A typical sorting machine is a
sorting belt conveyor roller. In some facilities the sorting is automated.
SORTING
Roller inspection conveyor (from SORTER). Pipe conveyor (from SORTER). It enables the transport of F&V between machines.
Calibrator (sizer from Navatta Group).
Nominal capacity
Given an average speed of 0,10 m/sec: 1 h = 60 min * 60 sec = 3600 sec in 1 h In 1 meter, on average 10 kg of fruit pass. In 1 h, 360 m run (3600 sec * 0,10 m). Average capacity per hour: 3600 kg Maximum capacity per day (24 h): 86,4 t
Nominal capacity
Given an average speed of 0,10 m/sec: 1 h = 60 min * 60 sec = 3600 sec in 1 h In 1 meter, on average 10 kg of fruit pass. In 1 h, 360 m run (3600 sec * 0,10 m). Average capacity per hour: 3600 kg Maximum capacity per day (24 h): 86,4 t
Working capacity
Up to 90 t/h
Installed power
Voltage: 3x400V 50Hz Air consumption: 0,55 kW Speed: 0,15-0,35 m/s Dimensions: L=300, E=74, H=65-130 cm
Installed power
Power feed: 0,55 kW Speed 0,12 m/s Length: 2830 (standard)

56 D.3.6 Extended Value Stream Maps of NACE 10.3: Fruit juices and purees and tomato concentrates
Chopping
The tomatoes suitable for processing are pumped to a chopping station, that could be a hammer mill or a special mono-pump provided with a pre-
feeding screw) where they are chopped.
Cold or Hot break
The pulp is pre-heated at 65-75 °C for CB processing or at 85-95 °C for HB processing. The main control panel of the evaporator regulates the pre-
heating temperature.
COLD BREAK
Cold break unit (from JBT). It generates a thermal treatment that produces partial
inactivation of the pectin enzymatic activities or syneresis.
Eldorado pre-heater (from CFT) for enzymatic inactivation of F&V. Thanks to its high recirculation flow-rate and special geometry of its heat exchangers, the system can run at its maximum efficiency over long periods of time (over 4 weeks without intermediate clean-ups).
Average capacity Working capacity From 450 to 4800 t/h
Installed power Voltage: 3x400V 50Hz Air consumption: 0,55 kW Speed: 0,15-0,35 m/s
Installed power

57 D.3.6 Extended Value Stream Maps of NACE 10.3: Fruit juices and purees and tomato concentrates
Juice extraction
The pre-heated tomato pulp (consisting in fibers, juice, skin and seeds) is then pumped through an extraction unit made of a pulper and a refiner that are
essentially large sieves. Pulper screen is with 1 mm perforation holes, while refiner screen is with 0.6 mm perforation holes. From the extraction unit two
products come out: refined juice for concentration and waste for disposal (generally it is sold as cattle feed). The average extractor yield varies
depending on the pulp’s temperature (juice yield increase with a higher T), the variety of tomatoes, the type of sieve fitted, the rotation speed, the
process temperature, and other technical features of the extraction system. On average, yield is around 95%. For example, if the extractor is fed with
100 kg of hot pulp, it will produce 95 kg of juice and 5 kg of waste. Considering also 1-3% of product waste coming from the grading, 100 kg of fresh
tomato fruits will give 93-94 kg of juice to be concentrated.
JUICE EXTRACTION
Giubileo cold extractor (from Rossi & Catelli).
Eureka extraction group (from Ing. A. Rossi).
Double stage turbo extractor (from FENCO).
Capacity (whole fruit at ambient temperature)
12-20 t/h with the large motor installed (1-3 t/h with the XS motor)
Nominal capacity High capacity up to 110 t/h
Nominal capacity 25-35 t/h each double stage
Installed power depending on motor type
X-Small motors: 37 kW Small motors: 55 kW Medium motors: 75 Large motors: 90 kW
Installed power 90-110 kW Total installed power 35 + 15 = 45 kW Pulper rotor diameter: 400 mm Finisher rotor diameter: 400 mm
Water consumption: 1 m3/h

58 D.3.6 Extended Value Stream Maps of NACE 10.3: Fruit juices and purees and tomato concentrates
Collection
At this point, the refined juice is collected in a large holding tank which constantly feeds the evaporator.
Evaporation
It is the process of concentration and represents the most energy-intensive step of the whole processing line. During evaporation water is extracted.
The refined juice is still only 5% solid and after evaporation it will become “double concentrate” paste (28 °Brix) or “triple concentrate (36 °Brix). The
evaporator automatically regulates juice intake and finished concentrate output; the operator only has to set the Brix value on the evaporator’s control
panel to define the concentration level. The entire concentration process takes place under vacuum conditions at low temperatures. Evaporator output
(equal to evaporator capacity) is measured on litres of evaporated water per hour (L/hour). The evaporative capacity of tomato juice concentrators is
influenced by the juice viscosity: at high Brix % corresponds more output. In a forced circulation (FC) evaporator, the solution to be evaporated circulated
by circulation pump through the heat exchangers tubes with high velocity from bottom to the top. In an evaporation/concentration plant, the major
operating cost is for the production of the steam which is obtained in a boiler. The multiple-effect evaporator design allows energy savings reducing
operating costs.

59 D.3.6 Extended Value Stream Maps of NACE 10.3: Fruit juices and purees and tomato concentrates
EVAPORATION
Forced Circulation (FC) evaporator (from KBR Ecoplanning).
http://www.ecoplanning.fi/index.php/forced-circulation-fc-evaporator.html
Concentration and Vaccum Evaporator (from Shiva Engineers).
http://www.food-processing.net/concentration-vacuum-
evaporator.html
Triple effect FC evaporator with dual output at two different concentrations
(from Ing. A. Rossi, mod. 3t2600).
Installed power 8-12 kW Inlet fresh product 1.000-20.000 kg/h
Evaporation capacity: 26.000 L/h. In a triple effect evaporator up to 3.2 kg of water are evaporated for each kg of live steam used. Nominal capacity: up to 1.200 t fresh tomato/day
Sterilization
The concentrate is sent from the evaporator directly inside the aseptic system tank, and from here it is pumped at high pressure inside the aseptic
sterilizer-cooler (where it is cooled down to 35-38 °C). The aim of the sterilization is to destroy all microorganisms which could alter the product. The
sterilization temperature and the holding time vary according to the pH of the final product: when the concentrate is enough acid (pH<4.3) a lower
temperature (90-95 °C at the center of the tomato box) may be used, when the pH is between 4.3 and 4.5 is necessary to use a higher temperature (100
°C for 7-8-minutes). For example, when pH is ≤4.2, sterilization occurs at 115 °C per a holding time of at least 60-90 seconds. It is worth of noting that
quality improves when commercial sterility can be obtained with minimal heat damage.
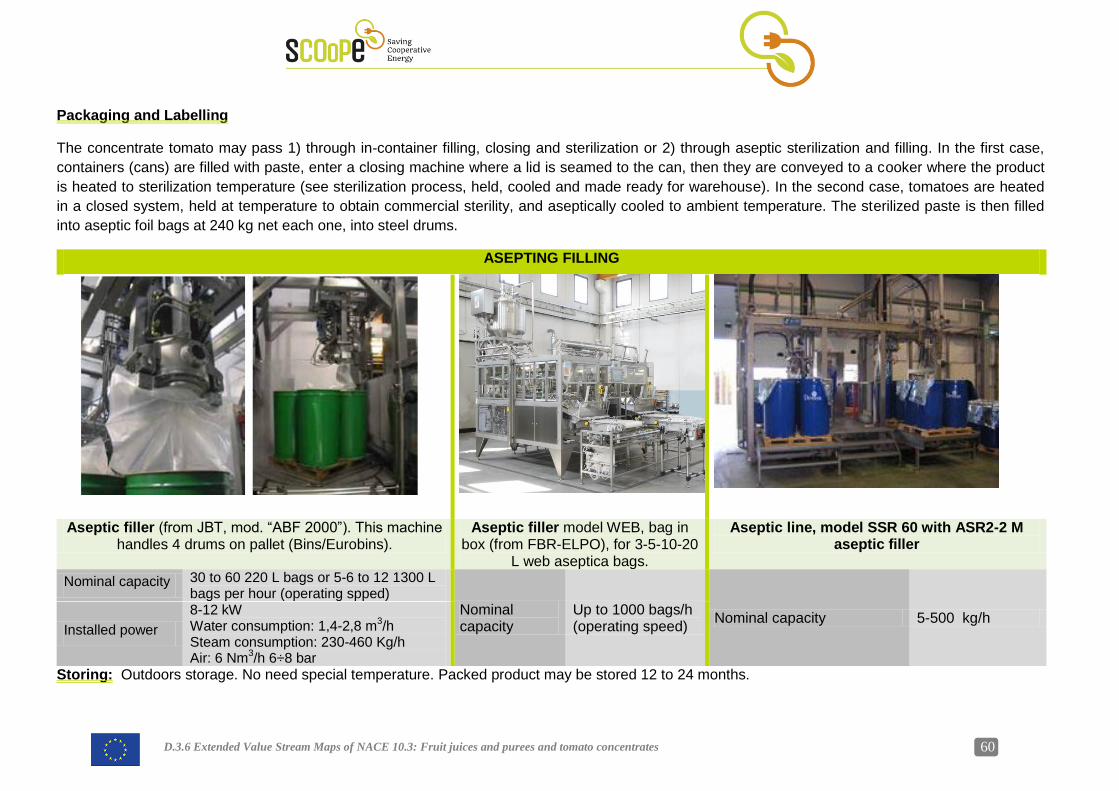
60 D.3.6 Extended Value Stream Maps of NACE 10.3: Fruit juices and purees and tomato concentrates
Packaging and Labelling
The concentrate tomato may pass 1) through in-container filling, closing and sterilization or 2) through aseptic sterilization and filling. In the first case,
containers (cans) are filled with paste, enter a closing machine where a lid is seamed to the can, then they are conveyed to a cooker where the product
is heated to sterilization temperature (see sterilization process, held, cooled and made ready for warehouse). In the second case, tomatoes are heated
in a closed system, held at temperature to obtain commercial sterility, and aseptically cooled to ambient temperature. The sterilized paste is then filled
into aseptic foil bags at 240 kg net each one, into steel drums.
ASEPTING FILLING
Aseptic filler (from JBT, mod. “ABF 2000”). This machine handles 4 drums on pallet (Bins/Eurobins).
Aseptic filler model WEB, bag in box (from FBR-ELPO), for 3-5-10-20
L web aseptica bags.
Aseptic line, model SSR 60 with ASR2-2 M aseptic filler
Nominal capacity 30 to 60 220 L bags or 5-6 to 12 1300 L bags per hour (operating spped)
Nominal capacity
Up to 1000 bags/h (operating speed)
Nominal capacity 5-500 kg/h Installed power
8-12 kW Water consumption: 1,4-2,8 m
3/h
Steam consumption: 230-460 Kg/h Air: 6 Nm
3/h 6÷8 bar
Storing: Outdoors storage. No need special temperature. Packed product may be stored 12 to 24 months.

61 D.3.6 Extended Value Stream Maps of NACE 10.3: Fruit juices and purees and tomato concentrates
5.3 Overview list of the processes and equipment
PROCESS EQUIPMENT ELECTRIC and/or THERMAL SOURCE of ENERGY
FRESH TOMATOES RECEIVING
TRUCKS FOR TRANSPORTATION Electric and thermal Electricity, diesel fuel and other
petroleum products, biofuel, natural gas
OFFLOADING AREA Electric Electricity
TUBE OR PUMP TO PIPE WATER INTO THE TRUCK (water tanks)
Electric Electricity
WATER PUMPING TO NEXT PROCESS (collection channel)
Electric Electricity
WASHING and SORTING
COLLECTION CHANNEL (washing machine) Electric Electricity
PUMPING TO NEXT PROCESS (sorting station)
Electric Electricity
AUTOMATIC SORTING MACHINE (a sorting conveyor like a belt roller).
Electric Electricity
CONVEYOR TO NEXT PROCESS Electric Electricity
CHOPPING CHOPPING STATION (crusher) Electric Electricity
PUMPING TO NEXT PROCESS Electric Electricity
COLD BREAK (pulp is preheated at 65°C)
PREHEATER Thermal and Electric Fossil fuel, biomass or waste
PUMPING TO NEXT PROCESS Electric Electricity
JUICE EXTRACTION
EXTRACTION UNIT (pulper + refiner) Thermal and Electric Electricity and gas
95% PULP + 5% WASTE (transported out of the facility to be sold as cattle feed)
Electric and Thermal Electricity
PUMPING TO NEXT PROCESS Electric Electricity

62 D.3.6 Extended Value Stream Maps of NACE 10.3: Fruit juices and purees and tomato concentrates
COLLECTION (temporary storage of the tomato juice)
HOLDING TANK that continuously feeds the evaporator
EVAPORATION (at low pressure for concentration)
EVAPORATOR (forced circulation type) Thermal An evaporator has a heat source (normally steam) that evaporates
the water. HIGH PRESSURE PUMPING TO NEXT PROCESS
Electricity Electricity
STERILIZATION (T>85°C, generally less than one minute)
STERILIZER Thermal and Electric Gas and electricity
COOLING and ASEPTIC FILLING (Packaging and labelling)
COOLER Thermal and Electric Electricity, gas, renewables
ASEPTIC FILLER Electric Electricity
PUMPING TO NEXT PROCESS Electric Electricity
STORING Electricity
TABLE 7: PROCESSES AND EQUIPMENT.

63 D.3.6 Extended Value Stream Maps of NACE 10.3: Fruit juices and purees and tomato concentrates
5.4 Sankey diagram
Sankey diagrams show energy consumption for each process, putting a visual emphasis on the major energy flows within the whole production process
carried out in a tomato firm. They are very useful in locating dominant contributions to the overall energy flow.
FIGURE 11: AVERAGE CONSUMPTION FLOWS OF ELECTRICITY ON THE LEFT AND THERMAL ENERGY ON THE RIGHT IN THE PRODUCTION OF TOMATO CONCENTRATE (DATA ELEABORATION FROM SPECIFIC ENERGY AUDIT INFORMATION).

64 D.3.6 Extended Value Stream Maps of NACE 10.3: Fruit juices and purees and tomato concentrates
PROCESS THERMAL ENERGY
CONSUMPTION (kWh/kg)
ELECTRICITY CONSUMPTION
(kWh/kg)
RECEIVING 0,0034
WASHING and SORTING 0,0011
CHOPPING 0,0086
COLD BREAK 0,50 0,0025 (HB)
JUICE EXTRACTION 0,0090
COLLECTION
EVAPORATION 2,50 0,0190
STERILIZATION 0,28 0,0042
COOLING and ASEPTIC FILLING
0,0035
STORING 0,0004
AUXILIARY PROCESSES 0,0051
TOTAL 3,28 0,0568
TABLE 8: THERMAL AND ELECTRICAL ENERGY CONSUMPTION DURING TRIPLE CONCENTRATE TOMATO PASTE PROCESSING
(DATA ELEABORATION FROM SPECIFIC ENERGY AUDIT INFORMATION).
65 D.3.6 Extended Value Stream Maps of NACE 10.3: Fruit juices and purees and tomato concentrates
5.5 Identification of the key points for setting up the baselines in electric and thermal processes
Taking into consideration the identification of the inputs and outputs of the main processes regarding energy issues, the most relevant key points for
setting up the Key Performance Indicators are below described.
Thermal processes:
Cold or Hot Break. After crushing, tomatoes are heated to form a pulp, which is further heated to a HB or CB, giving a more or less viscous
paste respectively. This process requires a substantial energy input.
Evaporation. Need of technologies that enable tomato paste processors to use less heat than conventional evaporation processes, resulted in
reduced energy consumption and improved end-product quality.
Sterilization. Due to the use of steam and water in this process, the energy and water consumption is very relevant so it should be
recommendable setting up the correspondent Key Performance Indicator.
Finally, in the production process, wastage is often dried and used to feed dairy cattle, for pet food or it is sent to landfill. In this case, there is also
the potential for this waste to feed decentralised combined heat and power plants (CHPs) to generate energy locally (López-Avilés and Leach,
2016).
Electricity consumption:
Large-scale tomato paste processing plants work intensively, fist sorting and washing tomatoes, which generally arrive to the reception after a
mechanical harvest. Electricity is required for mechanical collection (this process is not included in this study) and transportation processes, and
for treating and pumping water for washing tomatoes. Energy requirements in some of the above processes are reduced in small-scale and
artisanal production lines where some of the processes are done by hand. Also for cooling there is a little energy consumption (see Table 2), thus
these processes are not very useful to gain any KPI. Notwithstanding the limited electricity consumption, from the electric point of view, electrical
energy average KPIs may be simply be defined for a specific electric plant/equipment based on its activity and its energy consumption. Another
suggestion for electrical energy average KPI in the specific subsector of tomato paste production may be simply based on the electricity bill,
normalized for the total production per tomato season.

66 D.3.6 Extended Value Stream Maps of NACE 10.3: Fruit juices and purees and tomato concentrates
This is only a preliminary approach to the identification of the Key Performance Indicators. The expert team responsible for the tasks related to setting up
the Key Performance Indicators in thermal processes and electricity consumption will define the final ones according to their expertise.
5.6 Possible inefficiencies in the performance of the processes
Tomato paste production is an inherently energy-intensive process and tomato processors have a small window of time for processing as much product
as possible while the tomatoes are still fresh. This requires companies to operate 24 h per day, seven days per week during short season and to bypass
any time-of-use energy cost saving opportunities. Additionally, conventional technology for concentrating tomatoes involves repeatedly circulating the
tomato juice through multiple heating stages. Long duration heating can have a negative impact on the quality of the finished product, and in the early
stages of the concentration process, it does not allow for the most efficient use of steam energy. Concerning tomato paste production, cleaning time and
changeover configuration represent two possible inefficiencies in the performing of the processes.
Furthermore, also general inefficiencies may occur in the manufacturing lane, in particular “bottlenecks” and “down time” of the process. “Bottlenecks”
use to refer to an equipment whose nominal flow rate is low compared to the flow rates of the other equipment involved in the manufacturing plant
pathway. As a consequence, a “bottleneck” equipment imposes its cadence to the whole path making the other equipment operate at low energy yields.
Changing the ““bottleneck” equipment by another with a higher nominal flow rate would allow to reduce the travel time of the products while making
energy savings. Differently, the “down time” of a process occurs when a manufacturing process stops for an unplanned event (as for a motor failure),
accumulating down time. Down time can also be triggered by material issues, a shortage of operators, or unscheduled maintenance.

67 D.3.6 Extended Value Stream Maps of NACE 10.3: Fruit juices and purees and tomato concentrates
6. REFERENCES
6.1 References for fruit juices and purees
AIJN, European Fruit Juice Association. Liquid Fruit. Market Report 2016. http://www.aijn.org/files/default/aijn2016-market-report.pdf
Alonso Cabezas I. Diseño y logística de una línea de elaboración de zumo de naranja natural refrigerado de 20.000l/día. Trabajo fin de grado.
https://www1.etsia.upm.es/acreditacion2015/Evidencias_IAL/TFC/Isabel%20Alonso%20Cabezas/Isabel%20Alonso%20Cabezas.pdf
CODEX GENERAL STANDARD FOR FRUIT JUICES AND NECTARS (CODEX STAN 247-2005). http://www.fao.org/input/download/standards/10154/CXS_247e.pdf
Directive 2012/12/EU of the European Parliament and of the Council of 19 April 2012 amending Council Directive 2001/112/EC relating to fruit
juices and certain similar products intended for human consumption. http://eur-lex.europa.eu/legal-content/EN/TXT/?uri=CELEX%3A32012L0012
Flottweg Separation Technologies. Flottweg processing technology for the production of fruit and vegetable juices. From fruit to juice.
Key Technology. White Paper. Steam blanching vs water blanching: cost, efficiency, and product quality.
Lozano J.E.. Fruit Manufacturing. Scientific bases, engineering properties, and deteriorative reactions of technological importance. Springer 2006
Masanet E., et al.. Energy efficiency improvement and cost saving opportunities for the fruit and vegetable processing industry. An ENERGY STAR Guide for Energy and Plant Manager. March 2008 https://www.energystar.gov/ia/business/industry/Food-Guide.pdf
Reyes-De-Corcuera J.I., et al.. Processing of fruit and vegetable beverages. From the book “Food Processing: Principle and Applications”.
Chapter 15. 2014 Second Edition (eds S. Clark, S. Jung and B. Lamsal), John Wiley & Sons, Ltd, Chichester, UK.
Natura Nuova. Manuale di autocontrollo igienico sanitario 2015. http://www.natura-nuova.com/
Waheed M.A., et al.. Energetic analysis of fruit juice processing operations in Nigeria. ENERGY 2008 33:35-45.
Wang L. Energy efficiency and management in food processing facilities. CRC Press. Taylor and Francis Group. 2008
www.citrosuco.com.br

68 D.3.6 Extended Value Stream Maps of NACE 10.3: Fruit juices and purees and tomato concentrates
6.2 References for tomato concentrate
http://www.fenco.it/tomato-processing-lines/
http://www.tomatojos.net/08-tomato-paste-processing/
ENEA, ENEL, ENI, IASM. Manuale per l’uso razionale dell’energia nel settore delle conserve di pomodoro. December 1985.
http://www.jbtfoodtech.com/Solutions/Processes/Tomato-processing
http://www.food-processing.net/tomato-processing-plant.html
www.sorter.eu
http://www.ecoplanning.fi/index.php/forced-circulation-fc-evaporator.html
López-Avilés, A. and Leach, M. Food-Energy-Water Local Nexus Network for Redistributed Manufacturing: Energy Feasibility Study. February
2016.
http://sankeymatic.com/build/
http://www.devisa.es/eng/instalaciones.php