d1 design and analysis approaches to evaluate cardiovascular risk - 2012 eugm
TRANSCRIPT

Cytel East Users Group Meeting
Cambridge, Massachusetts
D i d A l i A h
Cambridge, Massachusetts
Design and Analysis Approaches
to Evaluate Cardiovascular Risk
October 12, 201211:45-12:15
Brenda Gaydos, Ph.D. Research Fellow

Outline
� Backgroundg
� Statistical Methods (tools)
� Development Options� Single CV Trialg
� Two CV Trials
Si l L D l t St d� Single Large Development Study
2

Background
• CV disease remains the leading cause of morbidity and mortality in patients with diabetes
• In light of the potentially harmful CV effects raised with rosiglitazone, regulatory agencies now require Sponsors to show that a new therapy for T2DM is not associated with an unacceptable increase in CV risk
Primary – Hazard Ratio (HR)– Time to first occurrence of any of the following adjudicated components:
• MACE (or 3-point MACE): CV death, non-fatal MI, non-fatal stroke• MACE +: typically 4th component hospitalization for unstable angina
– Cox proportional hazards model– Non-inferiority to standard of care– ITT population
3

FDA guidance: CI for CV Meta AnalysisFDA guidance: CI for CV Meta-Analysis
Upper bound of a 2-Upper bound of a 2sided 95% CI for
estimated CV risk RatioConclusion
>1.8 Data are inadequate to support approval. A large safety trial should be conductedThe potential for CV harm may still exist.
1.3 – 1.8* An adequately powered and designed post-marketing trial is needed to show an upper bound < 1.3
<1.3* Post-marketing CV trial is generally not needed3 g g y*with a reassuring point estimateCI = confidence interval
42008�FDA�Guidance�for�Industry:�Diabetes�Mellitus�– Evaluating�CV�risk�in�new�antidiabetic�therapies�to�treat�type�2�diabetes.��www.fda.gov

Cardiac Safety Research Consortium
White PaperWorking title Designs and statistical approaches to assess CV• Working title: Designs and statistical approaches to assess CV risk of new type 2 diabetes therapies in development
• Target journal: American Heart Journal
Objectives• Increase the quality and efficiency of CV risk assessment of new
therapies to treat T2DMtherapies to treat T2DM• Propose study designs and statistical analysis methods to meet
current CV safety regulatory requirements • Discuss operational considerations (e g processes for interim• Discuss operational considerations (e.g. processes for interim
analyses)• Use simulation to provide examples and discuss impact of
decisionsdecisions
5

Typical Development Program
Efficacy Studies – 3-5 Phase 3 studies (HbA1c is primary)– 1-2 Phase 2 studies1 2 Phase 2 studies
Discharge 1.8 and 1.3 based on meta-analysis– Independent, blinded, adjudication of all CV events– Prospectively planned meta-analysis at end of phase 3– Sufficient events to allow a meaningful estimate of risk– Include patients at higher risk of CV events (e.g. relatively advanced
disease elderly patients some degree of renal impairment)disease, elderly patients, some degree of renal impairment)– Controlled trials of longer duration needed (minimum 2 years)
Challengesg– Few events– Typically lower risk population– Relatively short duration– Can meet statistical significance, but be inconsistent across sensitivity
analyses6

No Dedicated CV Trial: Challenging
Assume:– All trials start in parallel; Fixed duration follow-up
1 year to fully enroll a trial; 1% lost to follow up– 1 year to fully enroll a trial; 1% lost to follow-up– 90% power for non-inferiority (1.3)
True�HR Fixed� Sample�Size Sample Size�Duration (2%�event�rate�
on�control)(1%�event�rate�on�control)
0.80(178 events)
18�months 10,058 20,017(178 events)
2�years 6,750 13,405
3�years 4,106 8,118
1(611�events)
18�months 31,028 61,722
2 years 20 831 41 342
7
2�years 20,831 41,342
3�years 12,681 25,047

Some Challenges Initiating a CV Study
Initiate during phase 3 development – Benefit: Insure timely discharge of 1.8– Need CV study prior to knowing dose/effect– If continue the CV study, need to maintain appropriate blind for interim – True HR unknown (assume equivalent for powering)True HR unknown (assume equivalent for powering)– Rate of events unknown (over/under estimate N needed to maintain
acceptable duration)
Initiate after phase 3 development– Risk not meeting 1.8
Same uncertainty in unknown HR and rate of events– Same uncertainty in unknown HR and rate of events
8

Statistical Methods
Setting• Desirable to initiate a CV study in phase 3 development• Desirable to leverage accruing information to mitigate risk in the
presence of so much uncertainty
• Focus on methods that are well understoodFocus on methods that are well understood
MethodsMethods– Meta-analysis– Group Sequential Designs
R ti ti # t– Re-estimating #events– Sample-size re-estimation
9

Statistical Methods
Meta-Analysis: Reduce patient exposure by efficiently utilizing events
– Acceptable for 1.8 (phase 2,3 & possibly CV trial)p (p , p y )– Acceptable for 1.3 (CV trials & possibly phase 2,3 trials)– ? Acceptable for 1 (CV trials)
• Does superiority need to be demonstrate in a single CV Outcomes trial?• Does superiority need to be demonstrate in a single CV Outcomes trial?• Typically seeing gated hypothesis testing within meta-analysis: 1st test HR <
1.3, then test HR < 1
• If an interim analysis is utilized for assessing 1.8:– Need acceptable process to maintain blind of ongoing studies– Completely blind the sponsor (CRO or some other body)– Blind the study team, but not the sponsor (e.g. team internal to sponsor, but
firewalled from study team; internal steering committee with CRO)
• What will be published in SBA? [Transparency / Data Confidentiality]
10

Statistical Methods
Group Sequential Designs: Opportunity to stop early for success (1.8, 1.3 or 1)(1.8, 1.3 or 1)
– Opportunity to answer the question sooner & reduce patient exposure– Can be combined with meta-analysis to further reduce patient exposure
• Determine in advance the maximum number of events and alphaDetermine in advance the maximum number of events, and alpha spend
– Allows for multiple interims to avoid looking too early or too late– Need to establish minimum clinically meaningful exposure (notNeed to establish minimum clinically meaningful exposure (not
just about statistical significance on MACE)
Current recommendations: о Encouraging of group sequential designsо Determine a-priori alpha spend and number of events at each analysisо Alpha spend is sponsor’s choice (preference for O’Brien-Fleming)p p p (p g)о Report adjusted point estimator
11

Group Sequential Design (GSD) Approaches
Assume single CV study to demonstrate HR <1.3, non-inferiority– O’Brien-Fleming spending function, 3 look design for early stopping, 90% power– Fixed design requires 611 events if true HR = 1
True HR Average�#�Events�(400,�513,�626)
Average�#�Events�(500,�565,�629)
1.00 480 527
0.90 418 503
0.85 406 501
0.80 401 500
0.75 400 500
Design Pr Stop�at�Interim�1 Pr�Stop�By�Interim�2 Pr�Success��ByFinal Analysis
400,�513,�626 0.52 0.767 0.90
If the true HR is 1
12
500,�565,�629 0.75 0.838 0.90

Statistical Methods
Sample-size re-estimation (Duration): Right-size the study– Sample-size drives study duration, NOT powerp y , p– Opportunity to increase sample size if needed to maintain reasonable
study duration once more information is gathered on event rateAnalysis can be done using blinded data (observed event rate)– Analysis can be done using blinded data (observed event rate)
Re-estimating # Events (Power): Minimize patient years– # events drive power– # events drive power– Delay upfront investment to power for superiority given initial uncertainty
in true HRSi i iti ll f i f i it ith th ti t i # t if– Size initially for non-inferiority with the option to increase # events if superiority is likely (e.g. utilize estimate of HR at ~400 events)
– Analysis likely will require unblinded data
13

Click to edit Master title style
DEVELOPMENT OPTIONS
14

Single CV Trial: Approaches
A. Fixed Design: Assessing 1.3 only (or 1)• 1.8 assessed only from phase 2 & 3 via meta-analysisy p y
Pro: No interim analysis needed Con: Cannot be used to discharge 1.8 if insufficient events observed (even
if initiated prior to end of phase 3)
To utilize the CV trial as back-up to discharge 1.8Group Sequential Design approach would be needed (alpha• Group Sequential Design approach would be needed (alpha spending 1.8)
• Needs to be pre-specified in meta-analysis plan PRIOR to unblinding Phase 3unblinding Phase 3
• CV Trial needs to incorporate an interim analysis based on timing relative to the total #events needed for the meta-analysis
15

Single CV Trial: Approaches
B. GSD: Assessing both 1.8 and 1.3 (or 1)• Must start prior to completion of Phase 3• Incorporating separate alpha spending for 1.8 & 1.3• May incorporate GSD for 1.8 and/or 1.3 for early stopping• May also incorporate meta-analysis for 1.8 • Can incorporate blinded SSR on observed event rate to manage duration
PreͲSubmission�Period
PostͲSubmission�Period
Can incorporate blinded SSR on observed event rate to manage duration
Period
Group Sequential DesignIncrease likelihood of meeting 1.8 as soon as Phase 3 trials complete Group Sequential Designg pIncrease likelihood of meeting 1.8 without requiring additional study
Group Sequential DesignPossibility to stop earlier if objectives meet
Blinded�SSR�to�manage�durationMeta-Analysis
Event from Phase 2 & 3
16

Single CV Trial: Approaches
Group Sequential Design (at 400 events) Enable Early Stopping for Superiority Only ( < 0.001)
C. Plan for non-inferiority with option to enlarge study to demonstrate superiority (example)
Event Re-estimation (at 400 events)Assess the Likelihood of Superiority,Increase the #Events if superiority likely
Sample Size Re-estimationManage Post Submission Trial Duration8000 (max of 9622)
PreͲSubmission�Period
PostͲSubmission�Period
Final Analysis (750 or 1067 events)
Impact vs Superiority Design (N=9622, #Events 1067)
Approximately same power for superiorityGroup Sequential Design with Meta- pp y p p y9Earlier Submission: 3 months9Reduced Cost: (20%) 40M-50M 9Reduced Trial Duration:
1 year if superiority is true
p q gAnalysis to discharge 1.8100 & 130 events, Pocock spending function, min 90% power (versus 122 single analysis)
6 months if non-inferiority is true
17

Operating Characteristics
Across�Range�of�HRsFixed
� Approximately�the�same�power�for�superiority
Adaptive
p y
� Adaptive�design�reduces�the�number�of�patient�years
KEYLines: Power (scale on left)Bars: Patient Yrs (scale on right)
18

Two CV Trials
Objective:Non inferiority– Non-inferiority
– Meta-analysis approach to discharge 1.8 & 1.3
• 1.8: 1st CV study and Phase 2 & 3y
• 1.3: 2 CV studies only
Benefits:– Flexibility to adjust to learning– Stop or continue 1st CV study depending on results of Phase 3
Utilize design of 2nd CV study to add or remove doses if needed– Utilize design of 2nd CV study to add or remove doses if needed
19

Two CV Trials: Example
Design Outline1st CV st d starts in parallel ith phase 31st CV study starts in parallel with phase 3
• GSD can be incorporated to discharge 1.8– First analysis after all phase 3 studies completey p p– Second analysis after maximum # events reached
• Design 1st CV study to ensure enough events to meet 1.8 as soon as phase 3 st dies completesoon as phase 3 studies complete
• May also assess HR < 1.3 (but may not be worth alpha spend)
2nd CV study starts after approval • GSD can be incorporated to discharge 1.3
20

2 CV Trials – The High Cost of Stopping 1st CV Study at Submission
Option 1 increases total cost by× 6000 pts×$130 Million
Assumes: 2500 pts/yr recruited, 2% event rate(cost: $30M fixed cost, $25k / patient, $2k / patient-year)
CV Study #1 – N=3500, Events=155, 3
Option #1: Stop at Submission
$relative to option 2
CV�Study�#1� N 3500,�Events 155,�3�years�duration
CV�Study�#2�– N=8900,�Events=545
CV�Study�#1�– N=3500,�Events=460,�8�years�duration
Option #2: Run CV #1 for 8 Years
5 Years Post Approval
CV�Study�#2�– N=2900,�Events=240
Submission Approval(trigger CV #2)
5 Years Post-Approval(Complete CV #2)
700 Total Events CV #1 + CV #221

Variation: Sub-studies
Sub-studies within CV design – Initiated at time of Phase 3Initiated at time of Phase 3
– Goal: an indication within a patient subset
– Need to fully analyze sub-study at time of submission
– Ideally: Follow all patients to assess CV risk
– Alternative: discontinue patients in sub-study
Need acceptable process to maintain blind of ongoing studies
22
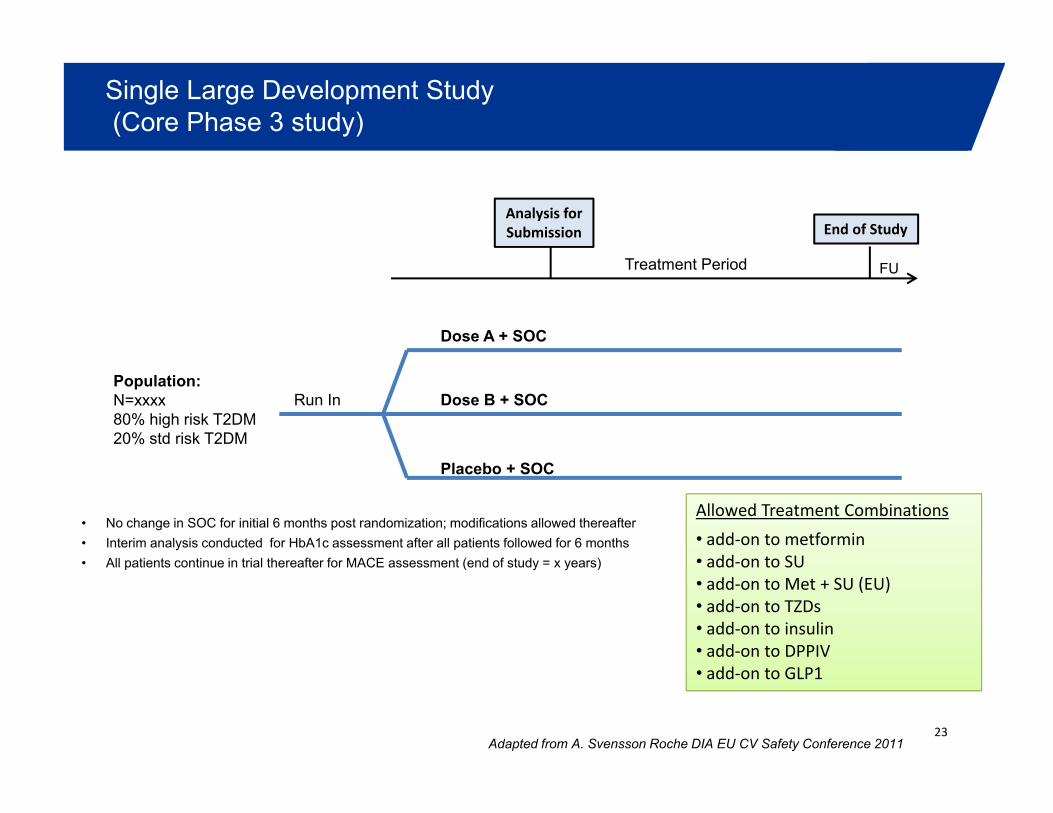
Single Large Development Study(Core Phase 3 study)
End�of�StudyAnalysis�for�Submission
Dose A + SOC
Treatment Period FU
Run In Dose B + SOCPopulation:N=xxxx80% high risk T2DM20% std risk T2DM
Placebo + SOC
• No change in SOC for initial 6 months post randomization; modifications allowed thereafter• Interim analysis conducted for HbA1c assessment after all patients followed for 6 months
All ti t ti i t i l th ft f MACE t ( d f t d )
Allowed�Treatment�Combinations
• addͲon�to�metformin• add on to SU• All patients continue in trial thereafter for MACE assessment (end of study = x years) • addͲon�to�SU• addͲon�to�Met�+�SU�(EU)• addͲon�to�TZDs• addͲon�to�insulin• addͲon�to�DPPIV
23Adapted from A. Svensson Roche DIA EU CV Safety Conference 2011
• addͲon�to�GLP1

Concluding Remarks
� Integrate CV evaluation with the clinical plan– Plan should include both 1.8 and 1.3
Efficiencies gained by considering EARLY the totality of information needed– Efficiencies gained by considering EARLY the totality of information needed
� Consider GSD– Choice of spending function Sponsor’s decision– Preference for O’Brien-FlemingPreference for O Brien Fleming– Adjusted point estimator of HR should be reported
� Need to establish operational approaches for interim analyses– Important to maintain trial integrity AND cost/benefit of datag y– Industry needs to put forwarded models
� Other key considerations not discussed– Only high-level concepts presented– E.g. endpoint (MACE, MACE +), patient population, heterogeneity
� Other (more novel) approaches not discussed– Shared control designs
Leveraging historical information– Leveraging historical information
24