cyclic behaviour of interior post-tensioned flat plate...
TRANSCRIPT

Cyclic behaviour of interior post-tensioned flat
plate connections
S. W. Han*, S.-H. Kee*, T. H.-K. Kang†, S.-S. Ha*, J. W. Wallace† and L-H. Lee*
Hanyang University; University of California
In high seismic regions, post-tensioned (PT) slab–column frames are commonly used to support gravity loads in
conjunction with a lateral-force resisting system (LFRS) such as a core wall. The LFRS is designed to resist 100%
of the design lateral forces as well as to limit lateral displacements to an acceptable level, whereas the slab–
column frame must sustain the gravity loads under the expected (design) displacements. Given the relatively sparse
data on the seismic performance of PT flat plate slab–column frames, cyclic tests of four interior PT slab–column
connections were conducted. Primary test variables were the level of gravity shear at the slab–column connection
and the slab tendon arrangement. Test results indicate that both the test variables strongly influence the cyclic
behaviour of the PT connections, and that the use of slab bottom reinforcement at the slab–column connection was
effective in resisting positive moment developed under lateral loading as well as improving the hysteretic energy
dissipation capacity.
Notation
Aps area of tendons
Asm area of continuous bottom bonded
reinforcement
b0 perimeter of critical section
b1 width of critical section parallel to loading
direction
b2 width of critical section perpendicular to b1c distance from the centroid of critical section
to the perimeter of critical section
c2 column dimension perpendicular to the
loading direction
d effective slab depth
db bar diameter
dp effective slab depth of tendons
f 9c peak concrete compressive stress
fpc average compressive stress in concrete
owing to effective post-tensioning force only
fps nominal stress in an unbonded tendon
(limited to lesser of fpy and fse + 210)
fpy tendon yield stress
fse effective tendon stress
fy yield stress of slab bottom reinforcement
h slab thickness
Jc polar moment of inertia of critical section
l1 centre-to-centre spans parallel to the
loading direction
l2 centre-to-centre spans perpendicular to the
loading direction
Mn,c þ 3 h nominal moment for a slab width of c2 + 3h
Mn,fs nominal moment for a full slab width
Mu,ub peak unbalanced moment
Vc nominal concrete shear strength
Vg gravity force to be transferred from a slab
to a column
Vp vertical component of effective post-
tensioning force at section
Vu factored shear force to be transferred from a
slab to a column
�c ratio of long side to short side of a column
ªf factor used to determine the unbalanced
moment transferred by flexure at slab–
column connections
ªv fraction of unbalanced moment transferred
by eccentric shear
�c nominal shear strength provided by concrete
�u maximum shear stress
Łu drift ratio at punching
Ły drift ratio at yielding
* Division of Architectural Engineering, Hanyang University, Seoul
133–791, Korea.
† Department of Civil and Environmental Engineering, University of
California, Los Angeles (UCLA), California 90095, USA.
(MCR 51489) Paper received 29 November 2005; accepted 7 August
2006
Magazine of Concrete Research, 2006, 58, No. 10, December, 699–711
699
www.concrete-research.com 1751-763X (Online) 0024-9831 (Print) # 2006 Thomas Telford Ltd
rp reinforcement ratio associated with tendons
(¼ Aps/l2dp)
� strength reduction factor
øu uniformly distributed design load
Introduction
Slab–column framing is popular because it offers
distinct advantages such as low cost owing to ease of
construction (e.g. slip forms), low floor-to-floor height
and flexible use of space. In particular, post-tensioned
(PT) flat plate slab systems are very efficient, since the
PT flat plate slab systems provide improved crack and
deflection control, and allow relatively large slab span-
to-thickness ratios, in the order of 35 to 45. Slab–
column frames are commonly used to resist gravity
loads in high seismic regions (SDC-D or -E, IBC-031),
where SDC indicates seismic design category; however,
they may be utilised as intermediate moment frames
(ACI 318–052 section 21.12.6) in areas with moderate
seismic demands (SDC-A, -B and -C). Given the broad
potential applications, a detailed understanding of
slab–column frame behaviour subjected to lateral
forces and/or displacements is important.
According to the seismic provisions in ACI 318–05,2
structural systems are either designated to resist earth-
quake forces [i.e. be part of the lateral-force resisting
system (LFRS)] or they are referred to as ‘non-partici-
pating’ systems or ‘gravity’-force resisting systems
(GFRS). In high seismic regions, post-tensioned slab–
column frames are commonly used for GFRS, particu-
larly for residential and office buildings where the LFRS
consists of shear walls or moment-resisting frames at
the building perimeter. When subjected to earthquake
ground motions, the LFRS undergoes lateral deforma-
tions, which are imposed on the GFRS through the floor
diaphragms. The lateral displacements imposed on the
slab–column frame are likely to introduce significant
unbalanced moments on the slab–column connections,
increasing the potential for punching failures. Before
the introduction of ACI 318–05,2 no specific require-
ments existed to avoid punching failures at slab–column
connections in GFRS owing to the lateral displacement
of the LFRS. However, the ability to maintain gravity
loads after punching failure (i.e. post-punching resis-
tance) could be justified owing to the ACI 3182 chapter
7 requirement for integrity reinforcement (continuous
bottom reinforcement through the column cage).
According to the eccentric shear stress model in ACI
318–05,2 punching failures at slab–column connec-
tions subjected to shear (Vu) and unbalanced moment
(Mub) occur where the shear stress owing to direct shear
and eccentric shear exceeds the nominal shear stress on
the slab critical section. The eccentric shear stress is a
result of moment ªvMub. The remaining portion of Mub
equal to ªfMub is assumed to be resisted by flexure by
providing slab reinforcement over a slab flexural trans-
fer width of c2 + 3h. Prior studies3–5 indicate that the
eccentric shear stress model gives conservative results
for the punching shear capacity of the post-tensioned
interior slab–column connections.
Available seismic provisions for the flat plate slab
systems (e.g. ACI 318–052 section 21.11) focus on
conventional non-prestressed slab–column connections:
similar provisions for prestressed post-tensioned slab–
column connections do not exist. In particular, very
limited testing has been conducted on the PT interior
connections subjected to reversed cyclic loads
(Qaisrani,5 Pimanmas et al.6). For PT flat plate slab
systems with shear reinforcement, existing data are
limited to the shake table tests of an approximately
one-third scale, two-storey, post-tensioned flat plate
frame (Kang and Wallace7). Therefore, seismic per-
formance of the PT connections, which tend to have
relatively high gravity shear ratios owing to the sub-
stantial spans, have not been adequately studied.
Furthermore, the impact of the tendon arrangement,
which typically involves the use of banded tendons in
one direction and distributed tendons in the other direc-
tion (ACI 423.3R-968), has not been systematically
assessed, and the influence of bonded bottom reinforce-
ment on the behaviour of PT flat plate systems sub-
jected to moment reversal has not been addressed.
Test programme
Prototype and specimen design
Figure 1 depicts the prototype building selected to
assist in the determination of specimen proportions and
details. The prototype building is a ten-storey, post-
tensioned flat plate slab system with 3.5 m storey
heights with special reinforced concrete (RC) shear
walls (R ¼ 6) designed according to IBC-031 and ACI
318–052 requirements for SDC-E (high seismic risk).
A slab thickness of 200 mm and a span length of 8 m
were selected for the prototype building, resulting in a
span-to-depth ratio of 40, which is within the range of
35 to 45 typically used for PT flat plate construction.
The shear walls were designed to resist the lateral
earthquake forces, whereas the PT flat plate slab sys-
tems were proportioned to support gravity forces.
Given that the prototype building is used for typical
residential/office construction, the unit weight of the
building is estimated as 23.5 kN/m3. Additional dead
loads (e.g. partition walls) of 0.5 kPa and live loads of
2 kPa were chosen based on recommendations in IBC-
03.1 Slab moments and shear forces owing to factored
gravity loads were determined based on the results of
an elastic analysis using MIDAS/Gen (MIDAS IT,9
Version 6.3.2).
The specimens were approximately two-thirds scale
representations of a typical interior slab–column con-
nection within the prototype building (Fig. 1). Inflection
points were assumed to occur at or near slab mid-span,
S. W. Han et al.
700 Magazine of Concrete Research, 2006, 58, No. 10

resulting in a span length of 4.6 m for the loading direc-
tion. A slightly shorter span length of 3.6 m was used in
the transverse direction. A 300 3 300 mm column
cross-section and a 130 mm slab thickness were selected
based on the two-thirds scale factor.
Slabs were post-tensioned with 12.7 mm diameter,
seven-wire strands with design yield stress of
1861 MPa. The arrangement of slab reinforcement is
provided in Fig. 2. Minimum concrete clear cover was
12 mm for both top and bottom slab reinforcement.
The post-tensioning strands were greased and placed in
polyethylene tubes with a diameter of 16 mm; there-
fore, the tendons were ‘unbonded’. The number of
post-tensioning tendons and the post-tensioning force
per tendon were selected such that approximately 100%
of slab dead weight was balanced (Table 1). The result-
ing average compressive stress ( fpc) of 1.21 MPa is
within the allowable range of 0.88 MPa and 3.44 MPa
as specified by ACI 318–05.2 According to section
18.9 of ACI 318–05,2 minimum bonded top reinforce-
ment ( fy ¼ 352 MPa) was placed within an effective
transfer width of c2 þ 3h at the connection region.
Although the slab–column frame is designed for
gravity loads, it is subjected to the lateral deformations
imposed on it by the lateral system (shear walls). To
investigate the influence of the lateral deformations of
the LFRS on the slab moment distribution, three-
dimensional elastic analyses of combined PT flat plate
frame and shear wall system were conducted for var-
ious levels of seismic demand. Resulting slab moments
are depicted in Fig. 3. The slab moment diagrams
indicate that the positive slab moment eventually devel-
ops on one side of the slab–column connection as the
seismic demand is increased; therefore, sufficient bot-
tom reinforcement should be provided to avoid the
formation of large cracks. Requirements for minimum
bonded bottom reinforcement for the post-tensioned
connections do not exist; therefore, it is common to
provide structural integrity reinforcement per ACI
318–052 section 7.13.2.5. This provision was devel-
oped primarily based on common practice for RC
slab–column frames, which typically have slab span-to-
thickness ratios closer to 20. Owing to the larger spans
of typical of PT construction, bottom reinforcement
satisfying ACI 3182 (section 7.13.2.5) and ACI-ASCE
35210 requirements [equation (1)] was provided
Asm ¼ 0:5øu l1 l2
� f y(1)
where � ¼ 0.9. Accordingly, five D10 (db ¼ 10 mm)
bottom bars were placed within a column width of c2for both directions, whereas no bottom reinforcement
was provided outside of c2.
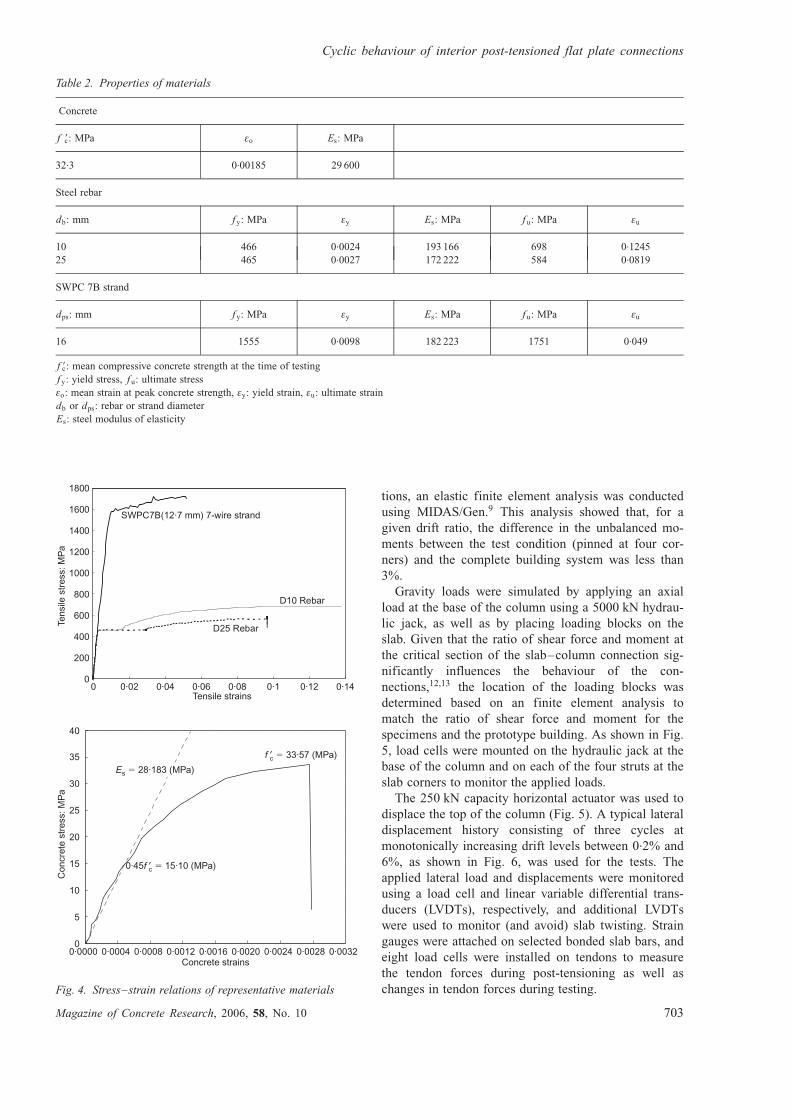
Material properties
Normal Portland cement concrete with a design con-
crete strength of 29.8 MPa and a maximum aggregate
size of 19 mm were used. The measured slump of the
concrete ranged from 100 to 125 mm. As indicated in
Table 2, mean compressive test-day strength of the con-
crete was 32.3 MPa based on compressive test results
of five, 100 3 200 mm concrete cylinders in accor-
dance with KS F 2404 (KS-0211). Seven-wire strands
[steel wire for prestressed concrete (SWPC) 7B11,
db ¼ 12.7 mm] and D10 mild reinforcement were used
for slab reinforcement, whereas D25 reinforcement
(db ¼ 25 mm) was used for column longitudinal rein-
forcement. The SWPC 7B strands ( fy ¼ 1555 MPa)
and reinforcement ( fy ¼ 466 MPa) were fabricated in
accordance with KS D 7002 and KS B 0802, respec-
��������� ��� ���
���
���
���
���
���
���������� ��������
���
�������
����
�����
���
��������� ��� ���
Fig. 1. Prototype building
Cyclic behaviour of interior post-tensioned flat plate connections
Magazine of Concrete Research, 2006, 58, No. 10 701

tively (KS-0211). Properties determined from the mate-
rial test programme are summarised in Table 2, whereas
the stress–strain relations obtained from representative
samples are shown in Fig. 4.
Testing and instrumentation
The four interior post-tensioned slab–column con-
nections were subjected to uni-directional, reversed
cyclic loading using the test set-up illustrated in Fig. 5.
The primary variables of the test programme were the
level of gravity shear, which could be varied using
the hydraulic jack at the base of the column, and the
arrangement of slab tendons (Table 1). For two of the
specimens (PI-B50 and PI-B30), tendons were banded
in the loading direction (E–W) and approximately uni-
formly distributed in the transverse direction (N–S),
whereas for the other two specimens (PI-D50 and PI-
D30), the tendons were uniformly distributed in the
loading direction (E–W) and banded in the transverse
direction (N–S), as shown in Fig. 2. The name PI-B50
refers to the following variables: Post-tensioned, Inter-
ior, Banded, with 50% gravity shear ratio. The gravity
shear ratio is calculated as Vg/�Vc , where Vg is the
factored gravity shear determined from analysis, Vc is
calculated according to ACI 318–052 (equation (11–
36)), which includes the impact of the prestress, and
� ¼ 0.75.
The base of the column was pinned, and the slab
edges were pin-supported at the four corner points by
struts (steel bars) with a diameter of 10 cm (Fig. 5). To
evaluate the appropriateness of the boundary condi-
���������� �������������
���
��������
��� !"#��$%��&�
!'��
���
� �
����
(��
(��
���������� �����
���
���
���
)��
#�
����
����
���$
���)
��
���
�&�
(��
(����(�
���
����
�
)��
��(�
!"#��$%
��&�
!"#��$%�$��
!'������
!"#��$%�$�� ������� #
���� ���$ ���) ����
����
���&
����
���
��*� ��+
� &���
� &� �
����
���&
��*� ��+
���
�!"#��$%
�$��
�!"#��$%
�$�
�
� &����
�
� &����
�
���
���
Fig. 2. Details of unbonded tendons and bonded top bars of
specimens: (a) PI-B50 and PI-B30; (b) PI-D50 and PI-D30
Table 1. Properties of specimens
Mark c2: mm d†: mm rp: % f 9c: MPa fpc: MPa Vc: kN Vg: kN
PI-B50 300 104 0.21 32.3 1.21 343 132
PI-B30 300 104 0.21 32.3 1.21 343 82
PI-D50 300 104 0.16 32.3 1.21 343 132
PI-D30 300 104 0.16 32.3 1.21 343 82
c2: column dimension in the direction perpendicular to loading
d†: effective depth based on average of d ps in two directions
rp: ratio of post-tensioning tendons
f 9c: mean compressive concrete strength at the time of testing
fpc: average compressive stress in concrete owing to effective post-tensioning
Vc: nominal shear strength
Vg: gravity force to be transferred from slab to column
e.g. PI-B50, (P): PT, (I): interior, (B): banded, (50): Vg/�Vc � 0.50 (� ¼ 0.75)
�)��
� ��
�&��
�
&��
��
)��
,��
����-.
��
'�+��� �/����0����
0� %� ��
� & ) � � �)0� %� ��
���'���&������"'�!%����'���&������"'�!�����'���&������"'�!'����'���&������"'�!��
Fig. 3. Slab moment distribution for both gravity and lateral
loads
S. W. Han et al.
702 Magazine of Concrete Research, 2006, 58, No. 10
tions, an elastic finite element analysis was conducted
using MIDAS/Gen.9 This analysis showed that, for a
given drift ratio, the difference in the unbalanced mo-
ments between the test condition (pinned at four cor-
ners) and the complete building system was less than
3%.
Gravity loads were simulated by applying an axial
load at the base of the column using a 5000 kN hydrau-
lic jack, as well as by placing loading blocks on the
slab. Given that the ratio of shear force and moment at
the critical section of the slab–column connection sig-
nificantly influences the behaviour of the con-
nections,12,13 the location of the loading blocks was
determined based on an finite element analysis to
match the ratio of shear force and moment for the
specimens and the prototype building. As shown in Fig.
5, load cells were mounted on the hydraulic jack at the
base of the column and on each of the four struts at the
slab corners to monitor the applied loads.
The 250 kN capacity horizontal actuator was used to
displace the top of the column (Fig. 5). A typical lateral
displacement history consisting of three cycles at
monotonically increasing drift levels between 0.2% and
6%, as shown in Fig. 6, was used for the tests. The
applied lateral load and displacements were monitored
using a load cell and linear variable differential trans-
ducers (LVDTs), respectively, and additional LVDTs
were used to monitor (and avoid) slab twisting. Strain
gauges were attached on selected bonded slab bars, and
eight load cells were installed on tendons to measure
the tendon forces during post-tensioning as well as
changes in tendon forces during testing.
Table 2. Properties of materials
Concrete
f 9c: MPa �o Es: MPa
32.3 0.00185 29 600
Steel rebar
db: mm fy: MPa �y Es: MPa fu: MPa �u
10 466 0.0024 193 166 698 0.1245
25 465 0.0027 172 222 584 0.0819
SWPC 7B strand
dps: mm fy: MPa �y Es: MPa fu: MPa �u
16 1555 0.0098 182 223 1751 0.049
f 9c: mean compressive concrete strength at the time of testing
fy: yield stress, f u: ultimate stress
�o: mean strain at peak concrete strength, �y: yield strain, �u: ultimate strain
db or dps: rebar or strand diameter
Es: steel modulus of elasticity
� �+� �+����+
�
&��
��
)��
���
����
�&��
� ��
�)��
����
'���1 ��
'&��1 ��
"#��$%��&�$�����$!2�� �+����
� �+� �+�� ++��,�
� ���& ��� ���) ���� ��� ���& ���
�
�
��
��
&�
&�
��
��
�
����� � �+�� ++��,
�
����� � �+����+������ ����� ������ �����& �����) ����&� ����& ����&� �����&
�+���&�������,��
�� �� ������������,��
� ���������$��,��
Fig. 4. Stress–strain relations of representative materials
Cyclic behaviour of interior post-tensioned flat plate connections
Magazine of Concrete Research, 2006, 58, No. 10 703

Test results
Crack patterns and observed damage
Crack patterns at the completion of testing are shown
in Fig. 7. In general, for drifts less than 1%, slab
flexural cracks formed adjacent to the column and sub-
sequently extended across the entire slab width. For
drift ratios greater than 3%, significant cracks were
observed to extend approximately 300 mm (ffi 2.5d)
away from the column face (Fig. 7). Based on observa-
tions, as well as the test data presented in the following
subsections, it is concluded that punching failures oc-
curred for all test specimens after flexural yielding of
slab bonded reinforcement.
Lateral load versus lateral drift
Values of unbalanced moments obtained from two
different approaches are plotted in Fig. 8. The first
estimate of the unbalanced moment was obtained as the
lateral load multiplied by a column height of 2.1 m,
whereas the second estimate was derived from the
difference of vertical reactions measured in the struts at
the slab corners times the distance between the struts
(4.8 m). A comparison of the results obtained using the
two approaches is provided in Fig. 8 and indicates that
consistent results were obtained.
Envelopes to the load–displacement relations as well
as an idealised bi-linear relationship4,14,15 fitting to the
envelope relations also are depicted in Fig. 9. The bi-
linear relations are used to determine drift angles asso-
ciated with yielding (Ły) and punching (Łu) as noted in
Table 3. As depicted in Fig. 9, Łu is defined as the drift
ratio at punching (Łu,1) for specimens that experienced
sudden punching failures (PI-B50, PI-B30 and PI-D50),
or the drift angle at which the lateral load experiences
a 20% drop from the peak lateral load (Łu,2) for the
specimen PI-D30, which did not experience a sudden
punching failure.
As noted for reinforced concrete connections,4,14–17
the limited data available have shown that lateral drift
capacity at punching for post-tensioned slab–column
connections is also strongly influenced by the magni-
tude of direct gravity shear stress applied on the critical
section.4,5 A detailed review of the existing database
for the PT connections4 indicates that higher drift ratios
at punching were obtained for the PT connections, in-
part owing to the larger span-to-thickness ratios (40 to
45) compared with the RC connections (� 25), and that
lower drift values were observed for the PT connections
(��
����
���
�����
�
�������+� ����
1��������-+
���
���
&���-.���3���
���
� �
) �
&���
#� ����������-+ ����������-+
���
����� ���
��������
���+�3� ��+��3���������������+� ����
"����������� � /���
�����-.45��3���6�-
"����������� � � ������2
Fig. 5. Test set-up
�)
�
�&
�
&
)
��&�
�(�
�)�
���
�
��
)�
(�
�&�
�5� +
��&7 ��&�7����7���7 ��$�7���7 �� 7��$�7&�&7
&�$�7���7
��7
)��7
�� �����/��������7
� � �� �� &� &� �� �� � � ��
�� ����+*� �
������
Fig. 6. Loading histories
S. W. Han et al.
704 Magazine of Concrete Research, 2006, 58, No. 10

subjected to reversed cyclic loading relative to the PT
connections subjected to monotonic or repeated lateral
loading (Fig. 10). Since the database for PT interior
connections subjected to reversed cyclic loading is lim-
ited to the four, isolated specimens with relatively high
gravity shear ratios (Vg/Vc ¼ 0.46 to 0.72) tested by
Qaisrani5 and Pimanmas et al.6, the test results pre-
sented for this study provide valuable information to
assess trends for gravity shear ratios Vg/Vc between
approximately 0.25 and 0.40 (actual values for the con-
nections based on actual material properties, versus the
design values of 0.30 and 0.50, respectively).
Figure 10 presents data (Vg/�Vc; Łu) for the four
specimens tested (Table 3), along with the existing test
data of post-tensioned slab–column connections with-
out shear reinforcement. Based on the results pre-
sented in Fig. 10, a fairly consistent trend of
decreasing drift ratio at punching (Łu) for increasing
gravity shear ratio (Vg/�Vc) is observed. The four test
specimens from this study achieved substantially high-
er lateral drifts (3.2% to 5.9%) compared with earlier
test results (1.8 to 2.3%) for interior connections sub-
jected to cyclic loading with higher gravity shear
ratios.5,6). Furthermore, specimens with lower gravity
shear ratios (PI-B30 and PI-D30) achieved 180 and
135% of the lateral drift ratios of the companion
�8!%��
�8!'�� �8!'��
�8!%��
&����&����
�����
&����
&����&����
&����&����
�����&����
&����&����
Fig. 7. Observed damage
� +�����+ 93 ��
����
���
�
��
���
����8!%��
����
����
���
�
��
���
����8!'��
����� �����
����-.
������� �����
����-.
:�
/����;���<������3�������� +/����� ��������+�3� ��+��3������ +
/����;���<������3�������� +/����� ��������+�3� ��+��3������ +
Fig. 8. Comparisons of unbalanced moments
Cyclic behaviour of interior post-tensioned flat plate connections
Magazine of Concrete Research, 2006, 58, No. 10 705

specimens with higher gravity shear ratios (PI-B50
and PI-D50), respectively, before punching failures
(Fig. 10).
For PI-B30 and PI-D30, relatively large lateral drift
ratios were achieved for both specimens, 5.6 to 5.9%,
respectively, indicating that the tendon arrangement did
not impact the drift at punching failure significantly for
the moderate gravity shear ratio. However, for the high-
er gravity shear ratio, based on the load–displacement
relations (Fig. 9), higher drift capacity (120%) and im-
proved ductility (190%) were observed for PI-D50
compared with PI-B50. The lower drift capacity and
ductility for PI-B50 compared with PI-D50 is likely
owing to larger precompression within the connection
region. In both cases of gravity shear ratios, larger drift
ratio at punching failure was achieved for the case with
distributed tendons. Current practice, which typically
bands tendons in one direction, may result in connec-
tions that have less drift capacity for loads parallel to
the banded direction.
Dissipated energy
The dissipated energy per cycle, which is used to
assess the hysteretic damping characteristics of the
system, was calculated based on the area of a load–
displacement relation for that cycle (Fig. 9). Based on
evaluation of these data, it is concluded that a gravity
shear ratio (Vg/�Vc) has a modest impact of the accu-
mulated dissipated energy for specimens with the same
tendon distribution (for a given cycle). However, as
shown in Fig. 11, the values of the accumulated dissi-
pated energy at failure differ substantially, as specimens
PI-B30 and PI-D30 have values that are approximately
150% and 40% higher than those for PI-B50 and PI-
D50, respectively. The PT connections with higher
gravity shear (PI-B50 and PI-D50) tend to fail at a
����8!%�� �����8!%��
�����8!'�������8!'��
&��7 ���7 &��7 ��(7
���7�� 7
��� 7� ��7
'��/��������7�) � �& � & )
'��/��������7�) � �& � & )
'��/��������7�) � �& � & )
'��/��������7�) � �& � & )
�)�
� �
�&�
�
&�
�
)�
�� ������-.
�)�
� �
�&�
�
&�
�
)�
�� ������-.
�)�
� �
�&�
�
&�
�
)�
�� ���
���-.
�)�
� �
�&�
�
&�
�
)�
�� ���
���-.
�* -����&�&�-.
&:���* -����� ���-.�������=3�:������&�����
�� ��
�������=3�:������&�����
�* -��� $���-.
&:���* -�������(�-.�������=3�:������&�����
�� ��
�������=3�:������&�����
�* -��� ��)�-.
&:���* -����&(����-.
�������=3�:������&�����
�� ��
�������=3�:������&�����
�* -���� $���-.
&:���* -����������-.�������=3�:������&�����
����
�������=3�:������&�����
Fig. 9. Lateral load plotted against lateral drift ratio
S. W. Han et al.
706 Magazine of Concrete Research, 2006, 58, No. 10

lower drift ratio, and thus achieve less ductility. In
particular, yielding of the slab reinforcement of PI-B50
was limited prior to punching failure. These results
indicate that the hysteretic energy dissipation capacity
is dependent upon the gravity shear ratio.
Test data indicate that the hysteretic energy dissipa-
tion capacity also is sensitive to the tendon distribution
pattern. Based on the relations plotted in Figs 9(a) and
(b), specimens PI-B50 and PI-B30 exhibited fairly lin-
ear behaviour up to 2% drift with limited yielding of
both top and bottom slab bonded reinforcement, prob-
ably as a result of high local precompression provided
by the banded post-tensioning within the connection
region. On the other hand, for specimens PI-D50 and
PI-D30, a significant drop in lateral stiffness was ob-
served at 1% drift (Figs 9(c) and (d)). As a result, the
values of accumulated dissipated energy for PI-B50
and PI-B30 are approximately 90% and 40% of those
for PI-D50 and PI-D30, respectively (Fig. 11).
Bonded slab reinforcement
As mentioned earlier, the test specimens included
minimum bonded top reinforcement (eight D10 bars) in
accordance with ACI 318–052 and bonded bottom rein-
forcement (five D10 bars) as required for structural
integrity reinforcement based on ACI 352.1R-89.10 Dur-
ing the cyclic tests, both top and bottom bonded reinfor-
cing bars reached the yield strain of approximately
0.002 (Fig. 12). Yield of top reinforcement initiated at
drift ratios of 1.1, 1.7, 0.6 and 1.7% for PI-B50, PI-B30,
PI-D50 and PI-D30, respectively, whereas yield of bot-
tom reinforcement occurred between drift ratios of 2.2%
and 3.5% for all specimens. Figures 12(a) and (b) show
that, before punching, the degree of yielding of top
reinforcement was more extensive than that of bottom
reinforcement. Bottom reinforcement strains are plotted
against the measured drift ratios in Fig. 13 for the bars
located at the column centreline. Owing to gravity load-
ing, bottom reinforcement was in compression before
the application of lateral loading. The strains in bottom
reinforcement began to vary from negative to positive
values (i.e. moment reversal) at drift ratios of 0.8% and
0.5% for PI-B50 and PI-D50, respectively. This result is
consistent with the observation that larger pre-compres-
sion within the connection region may have existed
where banded tendons were parallel to the loading direc-
tion. For PI-B30 and PI-D30, with relatively low gravity
shear stresses, moment reversal was observed at rela-
tively low drift ratio of 0.5%.
In high seismic regions, the lateral (roof) drift de-
mand on the structure is typically limited to 2% for life
safety considerations,18 and some storey drift ratios
typically exceed the roof drift ratio. Bonded bottom
steel with the amount of Asm (equation (1)) is not
anticipated to yield for drifts less than approximately
1.5%;14 however, moment reversal is likely to occur
(Fig. 3). Therefore, bonded bottom reinforcement
should be provided for PT flat plate systems designedTable3.Testandanalyticalresults
Mark
Testresults
GSR
Shearstrength
Flexuralstrength
Moment
Failure
mode
Ppeak:kN
Ł y:%
Ł u:%
Mu,ub:
kN/m
� u:MPa
Vg/V
c� u:MPa
� u/�
cªfM
u,ub:
kN/m
PM
n,cþ3h:
kN/m
PM
n,fs:
kN/m
ªfM
u,ub/
PM
n,cþ3h
Mn,ub:
kN/m
Mu,ub/M
n,ub
12
34
56
78
¼5
/7
910
11
12
¼9
/10
13
14
¼4
/13
PI-B50
43. 6
2. 1
3. 3
91. 6
2. 38
0. 39
2. 01
1. 18
55. 0
78. 7
105. 7
0. 70
80. 2
1. 14
F+P
PI-B30
47. 8
2. 0
5. 9
100. 4
2. 22
0. 24
2. 01
1. 11
60. 2
79. 0
106. 5
0. 76
98. 4
1. 03
F+P
PI-D50
49. 1
1. 4
4. 0
99. 3
2. 51
0. 39
2. 01
1. 25
59. 6
59. 4
104. 1
1. 00
80. 2
1. 24
F+P
PI-D30
52. 2
1. 5
5. 4
109. 6
2. 38
0. 24
2. 01
1. 18
65. 8
59. 6
104. 8
1. 10
98. 4
1. 13
F+P
GSR:gravityshearratio
ªf¼
0. 6
(accordingto
ACI318–05)
Mu,ub¼
(Ppeak)(h1),whereh1¼
2. 1m
Mn,cþ3h:flexuralmomentcapacityofslabsover
thewidth
ofc 2
+3h
�M
n,fs:flexuralmomentcapacityofslabsover
entire
slab
width
F+P:flexuralyielding,followed
bypunchingfailure
Cyclic behaviour of interior post-tensioned flat plate connections
Magazine of Concrete Research, 2006, 58, No. 10 707

to resist gravity loads since tensile strains in the bottom
slab reinforcement was observed before reaching a lat-
eral drift ratio of 1.5% (Fig. 12(b)). The quantity of
bottom reinforcement provided in the specimens was in
compliance with equation (1) and was sufficient to
resist positive moment developed up to lateral drifts of
approximately 1.5% to 2.0% before reaching the yield
strain (Fig. 12(b)), as well as to prevent progressive
collapse. Accordingly, bottom reinforcement required
by equation (1) is sufficient to limit extensive yielding;
therefore, there does not appear to be a need to provide
larger quantities of bottom reinforcement.
Stresses in unbonded tendons
For each specimen, average tendon stresses were
monitored using seven or eight load cells mounted at
�
����
���&
����
���
����
���)
���$
����
���(�������
�
������
'��/���������*3�
�;���
>����5�+; ���������:�
� ��� ��& ��� �� ��� ��) ��$ ��� ��( �
0�8����!������/������/������� ��3:����������$��
% +�!/����� /�����
���� �����+2��;�3��+; �� ��/��� � ��+3�6 �� ����
� � �+ ���5���� �������
% +�!/����� /���������� �����+2��;�3�+; �� ��/��� � ��
'��+ ��+�� / � �� ����?������#�
���?����� �@�(
,���� <!��3<��&��!��A�@4���� �@& �!��A�@,���� <!��3<��&��!����� �";��&��!��A�@��2��;�+; ��� ��/@�1���;� ����>;�&��!��A�@��2:�+; ��� ��/@�?������#� �!����/�� �2:�+; ��� ��/��� � ���
";��&��!��A�@
������;�����42-��+&��!�8��@B�+�����!�8��@�����+��� �@)�!�8��@
4���� �@���� + ����!�8��@������;�����42-��+&��!��A�@
C�3��;��� �@&&�!��A�@
Fig. 10. Gravity shear ratio plotted against drift ratio at punching (PT slab–column connections)
�
�
��
��
&�
&�
���8!%���8!%���8!'���8!'��
0��3�
3� ����++�*
� �� � ��5��-.:�
� � �� �� &� �� � �� ���&��5� +
Fig. 11. Accumulated dissipated energy
'�+��� �/������3���� ��� ����
"������3� +%��� ����*�� ��/��� � �������� ��� ����+
�8!%���8!%���8!'���8!'��
���7 ���
���7
����
����
�
&���
���������� ������ #
"����+�����)
��
��������� �)�� � �� �&�� � &�� �� )�� ��� ����
'�+��� �/������3���� ��� ����
�8!%���8!%���8!'���8!'��
���7 ���7
&���
&���
����
�
���������� ������ #
"����+�����)
�&��� ����� ����� ���� � ��� ���� ���� &���
��
"������3� +������ ��� ����+
%��� ���������� ��/��� � �����
��
Fig. 12. Strain distribution in (a) top and (b) bottom reinfor-
cement passing through the column cage
S. W. Han et al.
708 Magazine of Concrete Research, 2006, 58, No. 10

tendon ends (TC, see Fig. 2). Figure 14 reveals that the
stress in the unbonded tendons increased as a lateral
drift ratio increased and that the tendon distribution
influenced the change in the tendon stress in the load-
ing direction. For the PI-B specimens, tendon stresses
in the loading direction (TC 1, 2 and 3) tended to
increase fairly uniformly irrespective of tendon loca-
tion. However, for the PI-D specimens, only the stresses
in tendons placed close to the column (TC 1 or 2)
increased significantly (Fig. 14).
The peak values of the increase in the tendon stresses
are in the range of 4.7 to 6.4% of the effective tendon
stress ( fse). These values are substantially smaller than
those (� 15%) predicted by using equation (2) (ACI
318–052 equation 18–5)
f ps ¼ f se þ 70þ f 9c
300rpMPa (2)
The smaller increases may be partly attributed to the
smaller total elongation of the tendon obtained for the
interior connection under both gravity and lateral loads
(plotted against the interior connection under gravity
loads only, where the tendon in always in the tension
zone). The lower stresses in the unbonded tendons under
lateral loads result in reduced moment capacities under
combined gravity and lateral load, relative to the nom-
inal moment capacities computed for gravity load alone.
Shear strength of post-tensioned slab–column
connections (ACI 318–05)
The shear strength of the specimens was evaluated
using the eccentric shear stress model of ACI 318–052
chapter 11
�u ¼Vu
b0d� ªvMu,ubc
Jc< ��c (3)
ªf ¼1
1þ 2=3ð Þffiffiffiffiffiffiffiffiffiffiffiffib1=b2
p (4)
ªv ¼ 1� ªf (5)
��c ¼ � �pffiffiffiffiffiffif 9c
pþ 0:3 fpc þ
Vp
b0d
� �(6)
where �vc is the nominal shear stress capacity of the
post-tensioned connection without shear reinforcement
reduced by the capacity reduction factor in units of
MPa, �p is the smaller of 0.29 or (Æsd/b0 + 1.5)/12 and
Æs is 40 for interior columns.
In Table 3 column 10, the nominal moment for a
slab width of c2 + 3h (Mþn,cþ3 h + M�
n,cþ3 h) is calculated
for the specimens using the actual concrete strength
( f 9c), the actual yield stress of bonded bars ( fy), and the
measured stress in unbonded tendons at failure ( fps),
given that all the slab bonded reinforcement yielded at
the time of the failure. It is noted that the moment
transferred by flexure (ªfMu,ub ffi 0.6Mu,ub) and the
flexural transfer capacity (Mþn,cþ3h + M�
n,cþ3h) are al-
most identical (Table 3, column 12), suggesting that the
assumed fraction of unbalanced moment transferred by
flexure (ªf ¼ 0.6) according to ACI 318–052 is reason-
able for the PI-D specimens. For the PI-B specimens,
most of post-tensioning tendons and all the bonded
reinforcement were placed within c2 + 3h (Fig. 2).
Thus, information provided in column 12 in Table 3 is
not sufficient to assess the fraction of unbalanced mo-
ment transferred by flexure.
The peak values of the applied unbalanced moment
(Mu,ub) monitored from a load cell attached to the
horizontal actuator and the values of the total flexural
moment capacity (Mþn,fs + M�
n,fs) computed using meas-
ured material properties for the specimens are indicated
�����
����
�
���
����
����
&���
&���
����
�8!%���8!%���8!'���8!'��
"����+������
)
'��/��������7� ��� � ��� & &�� � ���
�5
Fig. 13. Strains in bonded bottom reinforcement versus drift
ratio
�&�
�
&�
�
)�
��
����8!%�� �����8!%�� �����8!'�� �����8!'��
���� ����
��������
���&����
���
����
���)
���$���&����
���
����
���)���$���&����
����
�������)
���$
���&
����
�������) ���$
"�� ++����� �
��+����3����� �
� ����+��,�
� � & � �'��/��������7
� � & � �'��/��������7
� � & � �'��/��������7
� � & � �'��/��������7
� � & � �'��/��������7
Fig. 14. Stress increments in unbonded tendons versus lateral drifts
Cyclic behaviour of interior post-tensioned flat plate connections
Magazine of Concrete Research, 2006, 58, No. 10 709

in columns 4 and 11 in Table 3, respectively. Note that
Mn,f s denotes the moment capacity considering full slab
width, not c2 + 3h. As might be expected, the values
obtained using the two different approaches are quite
close (ratios ¼ 0.87 to 1.05), and also consistent with
other independently obtained measurements (load cells
installed at the base of slab end points) (see Fig. 9).
These results support that the shear stress capacities
(vc) of the specimens were greater than the peak shear
stresses (vu) such that the full flexural moment capaci-
ties were reached prior to punching failures that even-
tually occurred at relatively large drifts (3.2 to 5.9%).
The peak shear stress (vu) owing to direct shear and
eccentric shear obtained using equations (3) to (6) with
peak unbalanced moment (Mu,ub) was compared with
the nominal shear strength (�c ¼ 0.29ffiffiffiffiffiffif 9c
p+ 0.3fpc
+ Vp/b0d, where Vp is negligible) for the specimens in
column 8 in Table 3. Based on the results, the eccentric
shear stress model gives conservative results for the
nominal shear strength for the PT specimens, as well as
for the post-tensioned interior slab–column specimens
tested earlier (Fig. 15). Results for this test programme
are consistent with results for earlier test programmes
for gravity loads, although the ratios tend to be a bit
lower, possibly owing to the modest increase in tendon
stress under lateral loads noted earlier.
Conclusions
Experimental studies of four isolated, post-tensioned
interior slab–column connections subjected to both
gravity and cyclic lateral loading were conducted.
Based on the test results, the following conclusions are
reached.
(a) Consistent with observations for reinforced con-
crete slab–column connections, the level of gravity
shear on the slab critical section significantly influ-
ences the cyclic behaviour of the post-tensioned
slab–column connections. As the gravity shear ra-
tio increased, a drift ratio at punching and the
hysteretic energy dissipation capacity for the post-
tensioned connections decreased. The improved
hysteretic energy dissipation for the connections
with lower gravity shear (PI-B30 and PI-D30) was
owing to more extensive yielding of bonded rein-
forcement prior to punching failure.
(b) Results indicate that seismic performance of the
post-tensioned flat plate slab systems is impacted
by the tendon distribution. For the higher gravity
shear ratio (40%), higher drift capacity and im-
proved ductility were observed for PI-D50 com-
pared with PI-B50. For these cases, limited
yielding of both top and bottom slab reinforcement
was noted and the use of banded tendons appears
to create larger precompression within the connec-
tion region.
(c) Moment reversal (change from negative slab mo-
ment due to gravity load to positive slab moment
under lateral load on one side of a connection)
occurred between lateral drifts of 0.5 to 0.8%. In
turn, bonded bottom reinforcement, which was
placed according to ACI 318–052 and ACI
352.1R-89,10 reached yield at lateral drifts between
2.2% to 3.5%. Based on these results, it is con-
cluded that bonded bottom reinforcement should
be provided for the post-tensioned flat plate slab
systems; however, integrity reinforcement required
by chapter 7 of ACI 318–05 appears sufficient to
limit rebar yielding. In addition, the bottom rein-
forcement improves the hysteretic energy dissipa-
tion capacity of the PT interior connections.
(d ) Test results indicate that tendon stresses for com-
bined gravity and lateral loading were approxi-
mately 35 to 60% of the values predicted by ACI
318–052 provisions. The reduced tendon stress
should be considered for flexural design of the
post-tensioned flat plate slab systems in high seis-
mic regions, as moment reversal is anticipated.
(e) The validity of the eccentric shear stress model
defined in ACI 318–052 was assessed. The test
results indicate that the eccentric shear stress mod-
el gives reasonable predictions for the nominal
shear strength (vc) and the flexural transfer capa-
city.
Acknowledgements
The work presented in this paper was sponsored by
Hanyang University, MOST R01–2006–000–10722–0
and SRC/ERC R11–2005–056–04002–0. The views
expressed are those of authors and do not necessarily
represent those of the sponsor.
References
1. International Code Council. International Building Code
(IBC-03). Whittier, California, 2003.
��&
���
��
���
��)
��$
���
����
� �:�
�� ���:&��,
��
:&
� ��� ��& ��� �� ��� ��) ��$ ��� ��( ��*�:�� ���
�:&��,��:&
>����5�������� +�+�
1 * � ��� ��������� +�+�1 � �+ ���5����������� +�+��� + ���� +��*������
Fig. 15. Shear strength of post-tensioned interior slab–
column connections
S. W. Han et al.
710 Magazine of Concrete Research, 2006, 58, No. 10
2. American Concrete Institute. Building Code Requirements
for Structural Concrete and Commentary (ACI 318-05). ACI,
Farmington Hills, Michigan, 2005.
3. Burns N. H. and Hemakom R. Test of post-tensioned flat plate
with banded tendons. Journal of Structual Engineering, ASCE,
1985, 111, No. 9, 1899–1915.
4. Kang T. H.-K. and Wallace J. W. Punching of reinforced and
post-tensioned concrete slab–column connections. ACI Structur-
al Journal, 2006, 103, No. 4, 531–540.
5. Qaisrani A. N. Interior Post-Tensioned Flat-Plate Connections
Subjected to Vertical and Biaxial Lateral Loading. PhD thesis,
University of California, Berkeley, 1993.
6. Pimanmas A., Warnitchai P. and Pongpornsup S. Seismic
performance of 3/5 scaled post-tensioned interior flat slab–
column connections. Asia Conference on Earthquake Engineer-
ing (ACEE 2004), Manila 2004 (CD-ROM).
7. Kang T. H.-K. and Wallace J. W. Dynamic responses of flat
plate systems with shear reinforcement. ACI Structural Journal
2005, 102, No. 5, 763–773.
8. Joint American Concrete Institute–American Society of
Civil Engineers Committee 423. Recommendations for Con-
crete Members Prestressed with Unbonded Tendons (ACI
423.3R-96). ACI, Farmington Hills, Michigan, 1996.
9. Midas It. MIDAS/GENw User’s Manual. Version 6.3.2, Seoul,
Korea, 2004.
10. Joint American Concrete Institute–American Society of
Civil Engineers Committee 352. Recommendation for Design
of Slab–Column Connections in Monolithic Reinforced Con-
crete Structures (ACI 352.1R-89). ACI, Farmington Hills, Michi-
gan, 1989.
11. Korean Standard Association. Standard Specification (KS-
02). KSA, Seoul, Korea, 2002.
12. Akiyama H. and Hawkins N. M. Response of Flat Plate Con-
nection Structures to Seismic and Wind Forces. University of
Washington, Seattle, 1984. Structures and Mechanics Report
SM 84–1, 1–267.
13. Pan A. D. and Moehle J. P. An experimental study of slab–
column connections. ACI Structural Journal, 1992, 89, No. 6,
626–638.
14. Pan A. D. and Moehle J. P. Lateral displacement ductility of
reinforced concrete flat plates. ACI Structural Journal, 1989, 86,
No. 3, 250–258.
15. Megally S. and Ghali A. Design considerations for slab–
column connections in seismic zones. ACI Structural Journal,
1994, 91, No. 30, 303–314.
16. Hueste M. B. D. and Wight J. K. Nonlinear punching shear
failure model for interior slab–column connections. Journal of
Structural Engineering ASCE, 1999, 125, No. 9, 997–1008.
17. Moehle J. P. Seismic design considerations for flat-plate con-
struction. Mete A. Sozen Symposium, Tarpon Spring, Florida (J.
K. Wight and M. E. Kreger (eds)). American Concrete Insti-
tute, Farmington Hills, MI, 1996, ACI SP-162, pp. 1–34.
18. Federal Emergency Management Agency. Pre-Standard
and Commentary for the Seismic Rehabilitation of Buildings
(FEMA-356). FEMA, Washington DC, 2000.
19. Kang T. H.-K., Lafave J. M., Robertson I. N. and Hawkins
N. M. Post-tensioned slab–column connections: Drift capacity
at punching of connections subjected to lateral loading. ACI
Concrete International, to be published in 2007.
20. Trongtham N. and Hawkins N. M. Moment Transfer to Col-
umns in Unbonded Post-tensioned Prestressed Concrete Slabs.
University of Washington, Seattle, 186 pp., 1977, Report
SM77-3.
21. Shatila M. Prestressed Concrete Slab-edge Column Connec-
tion. MSc thesis, University of Calgary, 1987.
22. Foutch D. A., Gamble W. L. and Sunidja H. Tests of post-
tensioned concrete slab-edge column connections. ACI Struct-
ural Journal, 1990, 87, No. 18, 167–179.
23. Matinez-Cruzado J. A. Experimental Study of Post-tensioned
Flat Plate Exterior Slab–Column Connections Subjected to
Gravity and Biaxial Loading. PhD thesis, University of Califor-
nia, Berkeley, 1993.
24. Han S. W., Kee S.-H., Park Y.-M., Lee L.-H. and Kang
T. H.-K. Hysteretic behavior of exterior post-tensioned flat plate
connections. Engineering Structures, in press, doi: 10.1016/j.
engstruct.2006.03.029.
25. Ritchie M. and Ghali A. Seismic-resistant connections of edge
columns with prestressed slabs. ACI Structural Journal, 2005,
102, No. 2, 314–323.
Discussion contributions on this paper should reach the editor by
1 June 2007
Cyclic behaviour of interior post-tensioned flat plate connections
Magazine of Concrete Research, 2006, 58, No. 10 711