cwp enhanced dividend income portfoliofiles.ctctcdn.com/52e635eb001/3a89897c-b833-4543-b2f3... ·...
TRANSCRIPT
CWP
Enhanced Dividend
Income Portfolio

Firm Profile
Capital Wealth Planning is an independent, fee-only Investment
Advisory firm registered with the Securities and Exchange
Commission. CWP provides sub-advisory investment services to high
net worth individuals, pensions, profit sharing plans, trusts, estates,
charitable organizations, and corporations. CWP’s strategic focus is
concentrated on providing proprietary investment products and
services for institutional investment platforms.
CWP realizes that as markets and environments change, the ability to
adapt is crucial. CWP specializes in covered call strategies, which
allows our firm to focus solely on what we do best; increase the yield
of the portfolio. Capital Wealth Planning exists at the forefront of
implementing covered call strategies on our proprietary ETF Income
and Enhanced Dividend Income Portfolios, as well as concentrated
equity holdings.
Above all else, CWP’s strategic partners and clients are our number
one priority and our firm takes that very seriously. CWP’s success is
dependent on your satisfaction. A teammate like relationship allows
our firm to establish highly personalized sub-advisory relationships
coupled with customized portfolios composed of innovative
investment opportunities, which generate monthly cash flow and
reduce risk in the client’s portfolio. (See Disclaimer).
A teammate like relationship allows our firm to establish highly
personalized sub-advisory relationships.

3
Kevin G. Simpson – Chief Investment Officer
Kevin Simpson has been the President and Chief Investment Officer of Capital Wealth Planning, LLC since
establishing the firm in 2005. Originally from Philadelphia, Pennsylvania, Kevin has been investing in options since
he began his career at W.H. Newbold's Son & Co. in 1992. After his time at W.H. Newbold's Son & Co Kevin spent
7 years with Wheat First Butcher Singer (Subsequently Wells Fargo) where he helped institutions and high-net
worth individuals plan and achieve their financial goals through option centered strategies. Following his time at
Wheat First Butcher Singer Kevin spent several years at Sterling Financial before establishing Capital Wealth
Planning. Over the years, Kevin has shifted Capital Wealth Planning away from a financial planning orientation to
an established investment management firm, offering separately managed ETF and Equity portfolios that are
complemented with a yield enhancing covered call strategy. A graduate of The George Washington University
majoring in Finance, Kevin applies institutional investment management strategies to diversified equity and option
portfolios.
Josh Smith, CFA – Head Trader
Josh is responsible for the oversight and management of the trading of the firm’s investment strategy. Prior to
joining CWP Josh spent 6 years with First Financial Capital Advisors, the internal asset management arm of First
Financial Bank. While at First Financial Capital Advisors Josh oversaw roughly $500M in assets as the lead portfolio
manager for the International Global Focused SMA and the Pure Equity SMA, both strategies employed covered
call programs to enhance yield and cover fees. Josh also served as co-portfolio manager of the Large Cap Core
Mutual Fund. During a portion of his college experience and career in finance Josh served in the U.S. Army
National Guard for 8 years with deployment to the Middle East and received an honorable discharge. Josh received
his B.S. in Finance from Miami University of Ohio. He is a CFA charter holder, as well as, a member of the CFA
Institute and CFA Society of Cincinnati.
Trade Team Bios
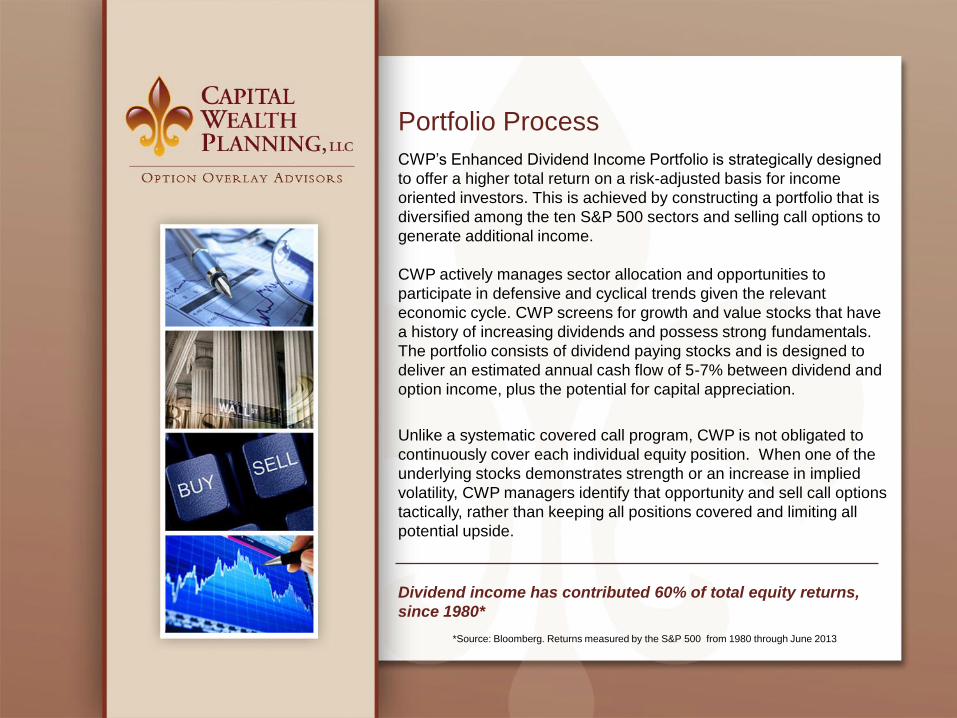
Portfolio Process
CWP’s Enhanced Dividend Income Portfolio is strategically designed
to offer a higher total return on a risk-adjusted basis for income
oriented investors. This is achieved by constructing a portfolio that is
diversified among the ten S&P 500 sectors and selling call options to
generate additional income.
CWP actively manages sector allocation and opportunities to
participate in defensive and cyclical trends given the relevant
economic cycle. CWP screens for growth and value stocks that have
a history of increasing dividends and possess strong fundamentals.
The portfolio consists of dividend paying stocks and is designed to
deliver an estimated annual cash flow of 5-7% between dividend and
option income, plus the potential for capital appreciation.
Unlike a systematic covered call program, CWP is not obligated to
continuously cover each individual equity position. When one of the
underlying stocks demonstrates strength or an increase in implied
volatility, CWP managers identify that opportunity and sell call options
tactically, rather than keeping all positions covered and limiting all
potential upside.
Dividend income has contributed 60% of total equity returns,
since 1980*
*Source: Bloomberg. Returns measured by the S&P 500 from 1980 through June 2013
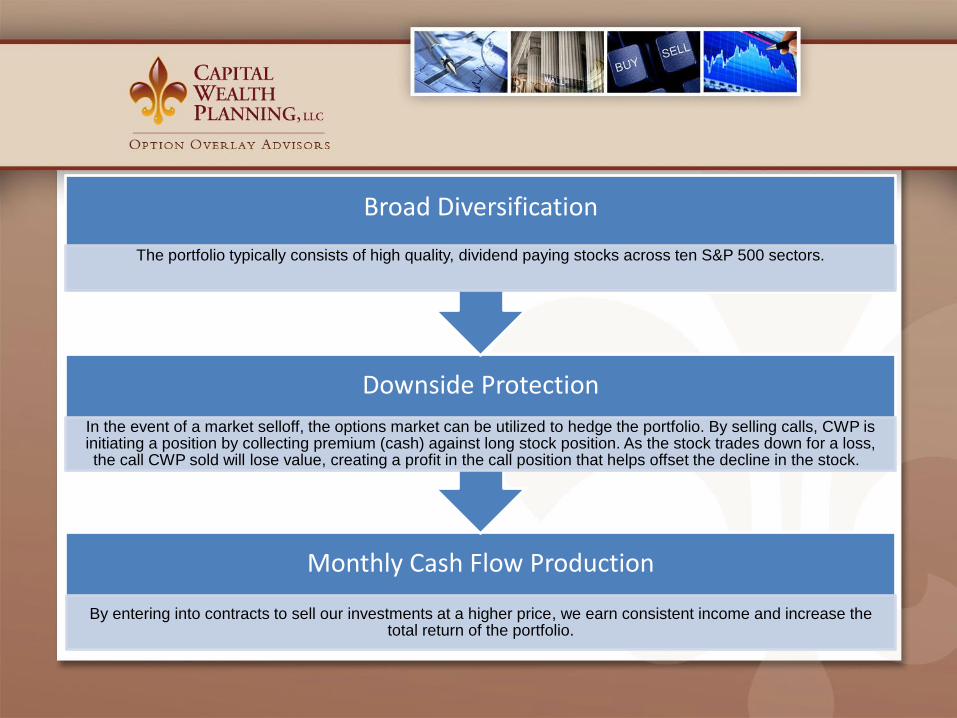
Monthly Cash Flow Production
By entering into contracts to sell our investments at a higher price, we earn consistent income and increase the total return of the portfolio.
Downside Protection
In the event of a market selloff, the options market can be utilized to hedge the portfolio. By selling calls, CWP is initiating a position by collecting premium (cash) against long stock position. As the stock trades down for a loss, the call CWP sold will lose value, creating a profit in the call position that helps offset the decline in the stock.
Broad Diversification
The portfolio typically consists of high quality, dividend paying stocks across ten S&P 500 sectors.
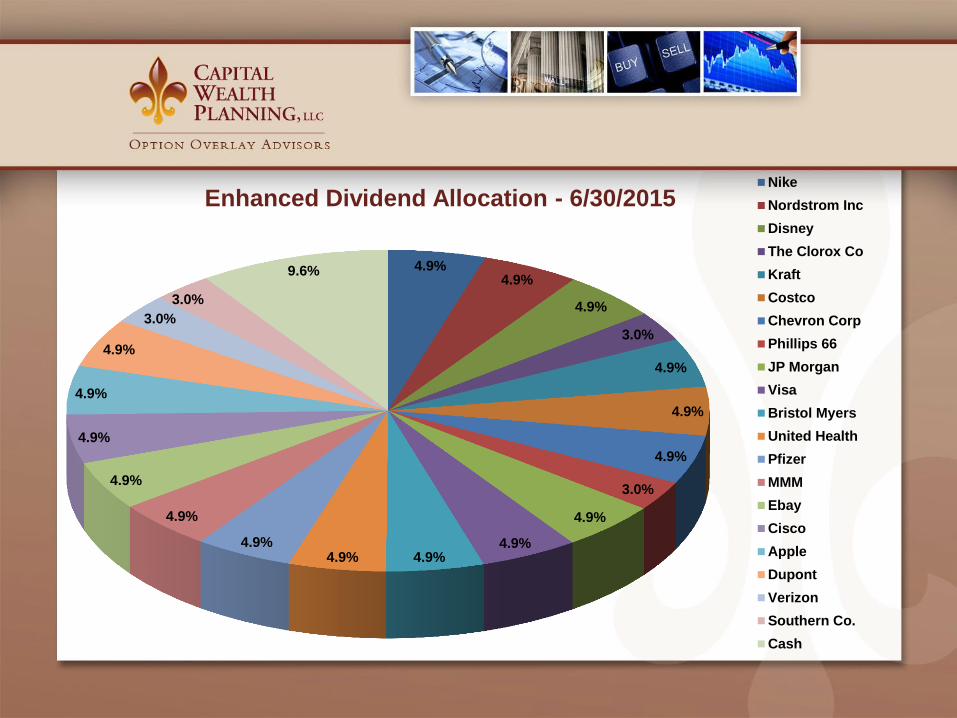
Enhanced Dividend Allocation - 6/30/2015
4.9% 4.9%
4.9%
3.0%
4.9%
4.9%
4.9%
3.0%
4.9%
4.9% 4.9% 4.9%
4.9%
4.9%
4.9%
4.9%
4.9%
4.9%
3.0%
3.0%
9.6%
Nike
Nordstrom Inc
Disney
The Clorox Co
Kraft
Costco
Chevron Corp
Phillips 66
JP Morgan
Visa
Bristol Myers
United Health
Pfizer
MMM
Ebay
Cisco
Apple
Dupont
Verizon
Southern Co.
Cash

Enhanced Dividend Allocation - 6/30/2015
Sector Position
Dividend
Yield
Estimated Option
Premium
Total
Estimated
Yield
Consumer Discretionary - Nike (NKE) 1.10% 5.00% 6.10%
Nordstrom (JWN) 2.04% 3.00% 5.04%
Disney (DIS) 1.01% 3.00% 4.01%
Consumer Staples - The Clorox Co (CLX) 2.75% 3.50% 6.25%
Costco (COST) 0.98% 2.70% 3.68%
Kraft (KRFT) 2.61% 4.00% 6.61%
Energy - Chevron Corp (CVX) 4.16% 3.00% 7.16%
Phillips 66 (PSX) 2.83% 5.00% 7.83%
Financials - JP Morgan (JPM) 2.43% 3.00% 5.43%
Visa (V) 0.70% 3.00% 3.70%
Healthcare - United Health (UNH) 1.23% 5.00% 6.23%
Pfizer (PFE) 3.22% 3.00% 6.22%
Bristol Myers (BMY) 2.29% 3.00% 5.29%
Industrials - MMM (MMM) 2.56% 3.00% 5.56%
Information Technology - Ebay (EBAY) 0.00% 8.00% 8.00%
Apple (AAPL) 1.60% 5.00% 6.60%
Cisco (CSCO) 2.87% 3.50% 6.37%
Materials - Dupont (DD) 2.76% 3.00% 5.76%
Telecom - Verizon (VZ) 4.45% 2.60% 7.05%
Utilities - Southern Company (SO) 4.12% 3.00% 7.12%
Returns for DJIA and CWP EDIP are adjusted for dividends, splits and calculated on a total return basis. Raw data was provided by djaverages.com and Bloomberg
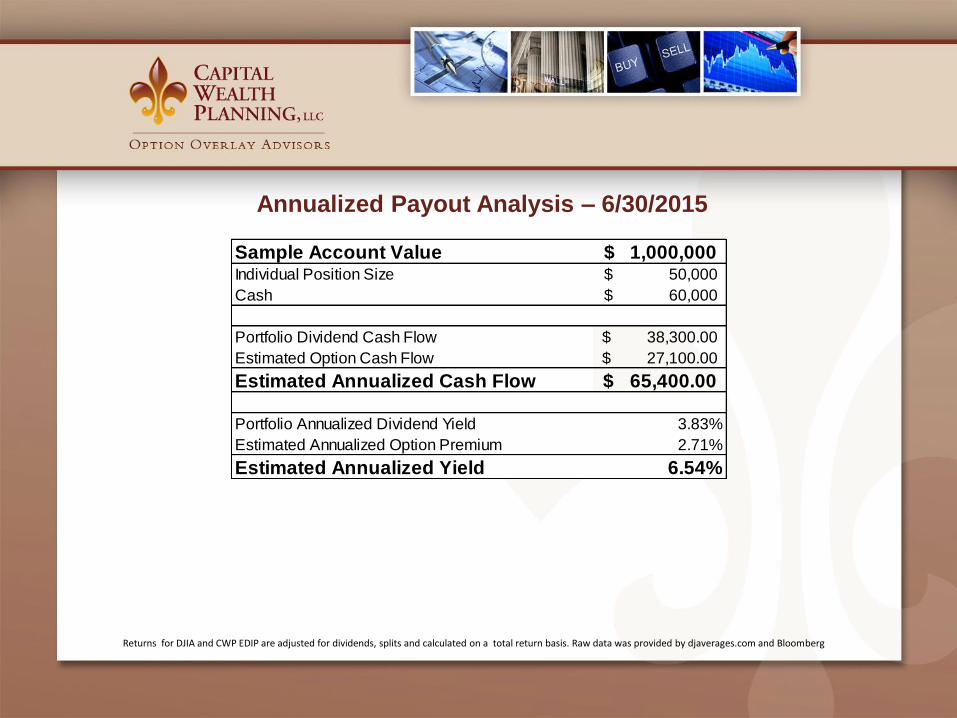
Annualized Payout Analysis – 6/30/2015
Sample Account Value 1,000,000$ Individual Position Size 50,000$
Cash 60,000$
Portfolio Dividend Cash Flow 38,300.00$
Estimated Option Cash Flow 27,100.00$
Estimated Annualized Cash Flow 65,400.00$
Portfolio Annualized Dividend Yield 3.83%
Estimated Annualized Option Premium 2.71%
Estimated Annualized Yield 6.54%
Returns for DJIA and CWP EDIP are adjusted for dividends, splits and calculated on a total return basis. Raw data was provided by djaverages.com and Bloomberg
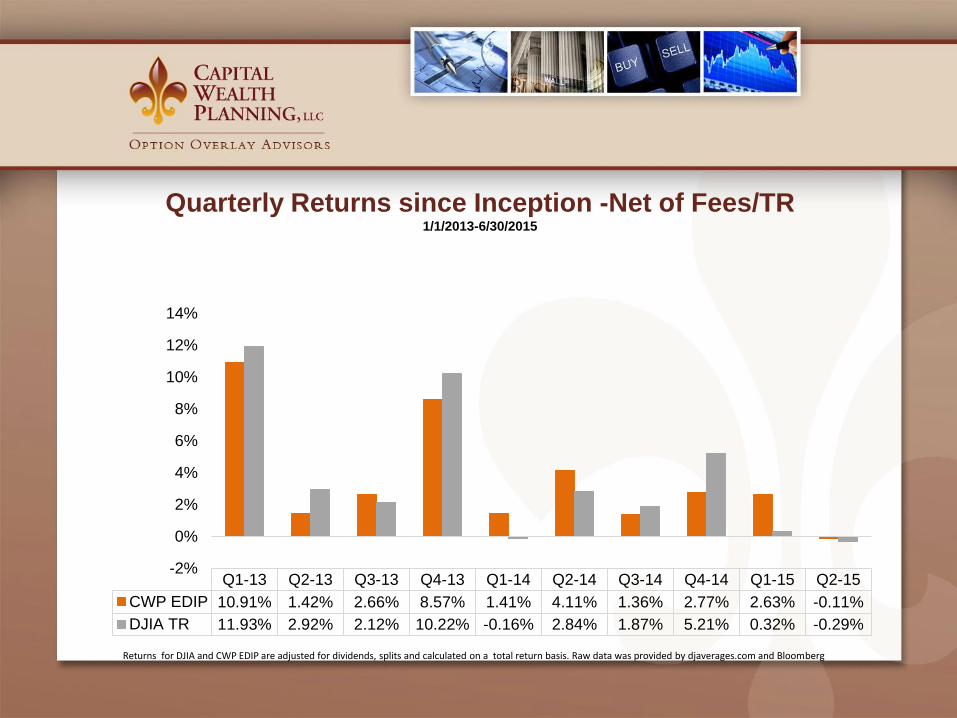
Quarterly Returns since Inception -Net of Fees/TR 1/1/2013-6/30/2015
Q1-13 Q2-13 Q3-13 Q4-13 Q1-14 Q2-14 Q3-14 Q4-14 Q1-15 Q2-15
CWP EDIP 10.91% 1.42% 2.66% 8.57% 1.41% 4.11% 1.36% 2.77% 2.63% -0.11%
DJIA TR 11.93% 2.92% 2.12% 10.22% -0.16% 2.84% 1.87% 5.21% 0.32% -0.29%
-2%
0%
2%
4%
6%
8%
10%
12%
14%
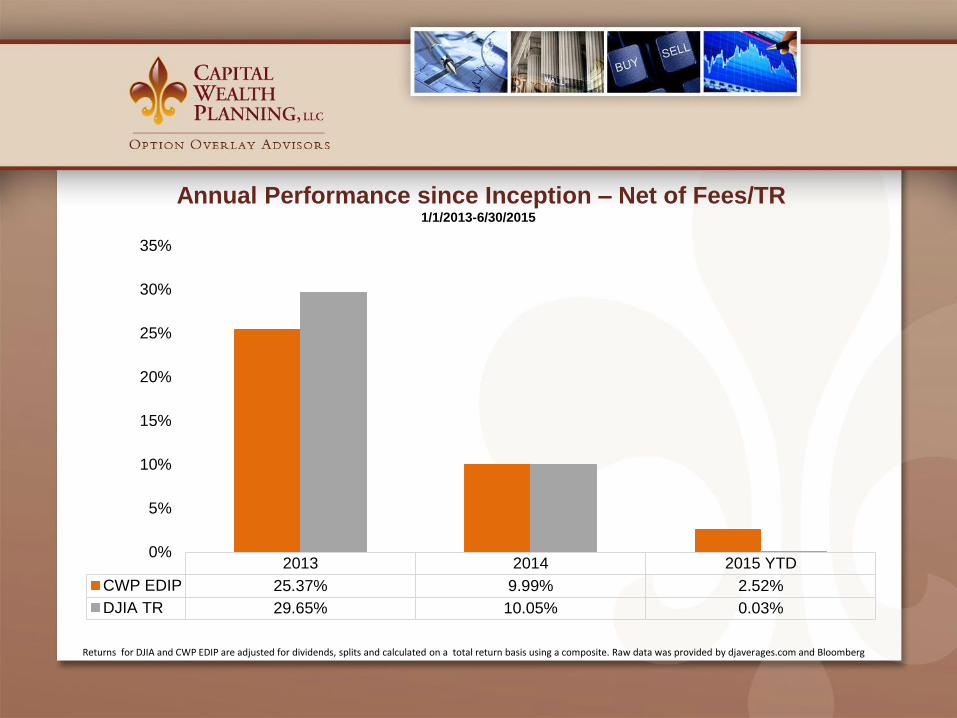
Annual Performance since Inception – Net of Fees/TR 1/1/2013-6/30/2015
Returns for DJIA and CWP EDIP are adjusted for dividends, splits and calculated on a total return basis using a composite. Raw data was provided by djaverages.com and Bloomberg
2013 2014 2015 YTD
CWP EDIP 25.37% 9.99% 2.52%
DJIA TR 29.65% 10.05% 0.03%
0%
5%
10%
15%
20%
25%
30%
35%
Returns for DJIA and CWP EDIP are adjusted for dividends, splits and calculated on a total return basis using a composite. Raw data was provided by djaverages.com and Bloomberg
0% 5% 10% 15% 20% 25% 30% 35% 40% 45%
CWP EDIP
DJIA
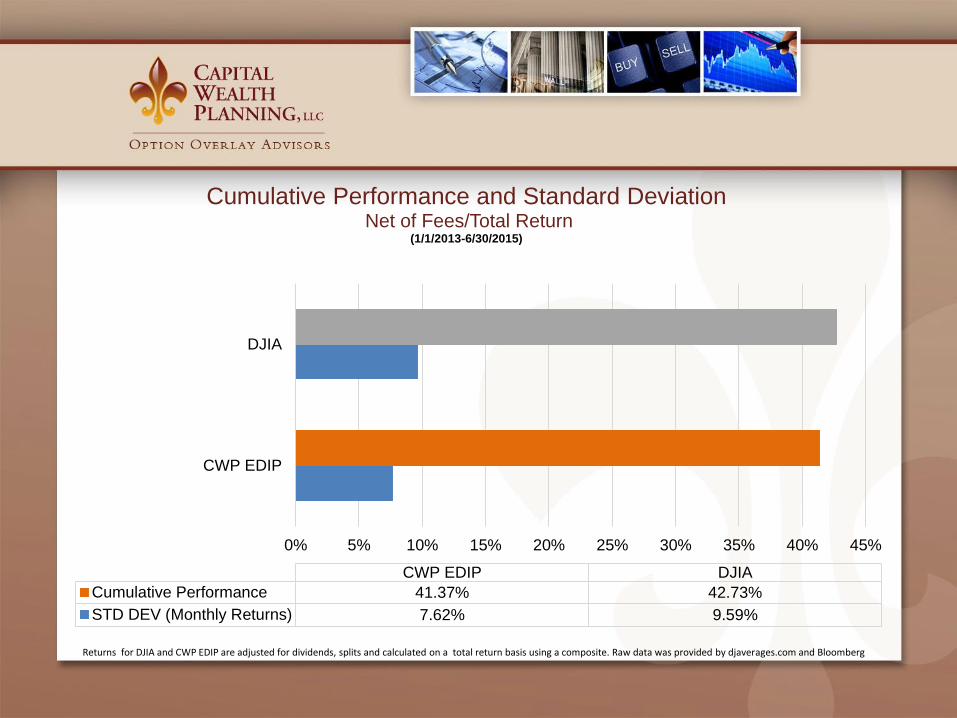
CWP EDIP DJIA
Cumulative Performance 41.37% 42.73%
STD DEV (Monthly Returns) 7.62% 9.59%
Cumulative Performance and Standard Deviation Net of Fees/Total Return
(1/1/2013-6/30/2015)
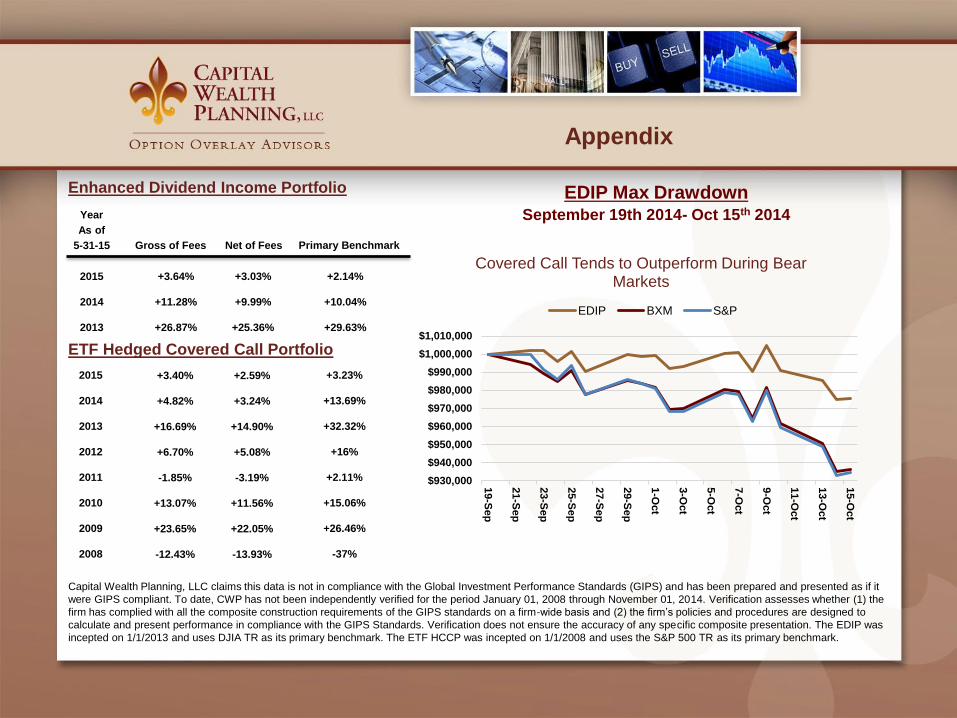
Appendix
Year
As of
5-31-15 Gross of Fees Net of Fees Primary Benchmark
2015
2014
2013
+3.03%
+9.99%
+25.36%
+3.64%
+11.28%
+26.87%
+2.14%
+10.04%
+29.63%
Enhanced Dividend Income Portfolio
ETF Hedged Covered Call Portfolio
2015
2014
2013
2012
2011
2010
2009
2008
+3.40%
+4.82%
+16.69%
+6.70%
-1.85%
+13.07%
+23.65%
-12.43%
+2.59%
+3.24%
+14.90%
+5.08%
-3.19%
+11.56%
+22.05%
-13.93%
+3.23%
+13.69%
+32.32%
+16%
+2.11%
+15.06%
+26.46%
-37%
Capital Wealth Planning, LLC claims this data is not in compliance with the Global Investment Performance Standards (GIPS) and has been prepared and presented as if it
were GIPS compliant. To date, CWP has not been independently verified for the period January 01, 2008 through November 01, 2014. Verification assesses whether (1) the
firm has complied with all the composite construction requirements of the GIPS standards on a firm-wide basis and (2) the firm’s policies and procedures are designed to
calculate and present performance in compliance with the GIPS Standards. Verification does not ensure the accuracy of any specific composite presentation. The EDIP was
incepted on 1/1/2013 and uses DJIA TR as its primary benchmark. The ETF HCCP was incepted on 1/1/2008 and uses the S&P 500 TR as its primary benchmark.
$930,000
$940,000
$950,000
$960,000
$970,000
$980,000
$990,000
$1,000,000
$1,010,000
19-S
ep
21-S
ep
23-S
ep
25-S
ep
27-S
ep
29-S
ep
1-O
ct
3-O
ct
5-O
ct
7-O
ct
9-O
ct
11-O
ct
13-O
ct
15-O
ct
Covered Call Tends to Outperform During Bear Markets
EDIP BXM S&P
EDIP Max Drawdown September 19th 2014- Oct 15th 2014
Disclaimer
IMPORTANT NOTE: Capital Wealth Planning, LLC, (CWP) is a registered investment advisor with the U.S. Securities and Exchange Commission (SEC). Registration with the SEC does not
imply that CWP or any individual providing investment advisory services on behalf of CWP possess a certain level of skill or training. Capital Wealth Planning may only transact business in
those states in which it is registered or qualifies for an exemption or exclusion from registration requirements. Individualized responses that involve actual or contemplated securities
transactions or the rendering of personal investment advice for compensation will not be made absent compliance with all applicable investment adviser regulation requirements. Please contact
the sender if there are any questions.
CWP, LLC is an investment advisory firm located in Naples, Florida. Capital Wealth Planning and its representatives are in compliance with the current registration requirements imposed upon
registered investment advisors by those states in which it maintains clients. Illustrations used in this document are hypothetical. The results achieved by individual clients will vary and will
depend on a number of factors including the particular underlying investments and their dividend yield, option market liquidity, interest rate levels, implied volatilities, and the client's expressed
return and risk parameters at the time the service is initiated and during the term. Past performance is not a guarantee of future returns. Investing in options involves risk that must be
considered and reviewed with a professional prior to investing. This brochure is not intended as the giving of investment advice to any single investor or group of investors and no investor
should rely upon or make any investment decisions based solely upon contents of the marketing piece.
These illustration(s) of potential portfolio cash flow from a covered call option writing program is based on a model, not actual, portfolio. Covered call option cash flow for any portfolio will vary
depending on actual portfolio positions, option premiums received, individual stock price volatility, and general stock market volatility. Positions covered by call options may be called away,
creating realized capital gains or losses. Cash flow is not guaranteed over any period. More information may be found in CWP’s Form ADV.
Option trading is not suitable for all investors. The booklet “Characteristics and Risks of Standardized Options” can be found at: http://www.cboe.com/Resources/Intro.aspx. Copies of this
document may be obtained by your Financial Advisor or the Option Clearing Corporation, 1 North Wacker Drive, Suite 500, Chicago, IL 60606. 1-888-678-4667
The performance reflected herein represents preliminary composite data for the Capital Wealth Planning Enhanced Dividend Model Portfolio. The performance data herein may change as a
result of being verified by a third party. All performance data is shown net of maximum fee of 1.50%annual fee. While compiled from actual accounts, the information has not been audited,
reviewed, or otherwise verified by any third party and are not reported in accordance with Global Investment Performance Standards (GIPS). Actual advisor fees are deducted quarterly.
All income has been reinvested when possible. The results are calculated using simple monthly returns, ending value divided by beginning value adjusted for contributions to and distributions
from the accounts, if any. Monthly results are then compounded to produce period return statistics. Actual performance results will vary depending on numerous factors including fees, size of
the portfolio, income needs and tax status among others. Performance results for clients that invested in accordance with the tactical portfolios will vary from the simulated performance data
due to market conditions and other factors, including investment cash flows, size and timing portfolio inception with respect to ex-dividend dates, frequency and precision of subsequent option
writing activity, cash balances, varying custodian fees, and/or the timing of fee deductions. The net compounded impact of the deduction of our fees over time will be affected by the amount of
the fees, the time period and investment performance. These and other factors may materially influence performance results and therefore actual client performance for the portfolio would
historical performance by coincidence.
Clients should consult their account statements for information about how their actual performance compares to that of the model portfolios. Depending on the size of client assets under
management or account type, the investment management fees may vary. Transaction costs and account maintenance charges could be charged and vary across custodial platforms. When
used for comparison purposes, it should be noted that the composition and variability of the Dow Jones Industrial Average, an unmanaged market-value weighted index, and the composition
and volatility of the Enhanced Dividend Model Portfolio managed by Capital Wealth Planning, LLC, are materially different. Results have not been audited, reviewed, or otherwise verified by any
third party. As with any investment strategy, there is potential for profit as well as the possibility of loss. Asset allocation does not ensure a profit or guarantee against a loss. CWP, LLC, does
not guarantee any minimum level of investment performance or the success of any index portfolio or investment strategy. All investments involve risk and investment recommendations will not
always be profitable. Current and future performance may be higher or lower than the performance shown. The investment return and principal value of an investment will fluctuate so that an
investor's shares, when redeemed, may be worth more or less than their original cost.