c:\working papers\11028.wpd - gerald r. ford school of public policy
TRANSCRIPT

RESEARCH SEMINAR IN INTERNATIONAL ECONOMICS RESEARCH SEMINAR IN INTERNATIONAL ECONOMICS
School of Public Policy School of Public Policy The University of Michigan The University of Michigan
Ann Arbor, Michigan 48109-1220 Ann Arbor, Michigan 48109-1220
Discussion Paper No. 524 Discussion Paper No. 524
Public Finance and Individual Preferences Public Finance and Individual Preferences Over Globalization Strategies Over Globalization Strategies
Gordon H. Hanson Gordon H. Hanson University of California, San Diego University of California, San Diego
Kenneth F. Scheve Kenneth F. Scheve University of Michigan University of Michigan
Matthew J. Slaughter Matthew J. Slaughter Dartmouth College Dartmouth College
January 2005 January 2005
Recent RSIE Discussion Papers are available on the World Wide Web at: http://www.spp.umich.edu/rsie/workingpapers/wp.html
Recent RSIE Discussion Papers are available on the World Wide Web at: http://www.spp.umich.edu/rsie/workingpapers/wp.html

NBER WORKING PAPER SERIES
PUBLIC FINANCE AND INDIVIDUAL PREFERENCESOVER GLOBALIZATION STRATEGIES
Gordon H. HansonKenneth F. Scheve
Matthew J. Slaughter
Working Paper 11028http://www.nber.org/papers/w11028
NATIONAL BUREAU OF ECONOMIC RESEARCH1050 Massachusetts Avenue
Cambridge, MA 02138January 2005
For helpful comments we thank Rafaela Dancygier, Jens Hainmueller, Shigeo Hirano, David Stasavage,Michael Tomz, and seminar participants at the Institute for International Economics, London School ofEconomics, University of Michigan, and University of Oregon. For financial support we gratefullyacknowledge the National Science Foundation. The views expressed herein are those of the author(s) anddo not necessarily reflect the views of the National Bureau of Economic Research.
© 2005 by Gordon H. Hanson, Kenneth F. Scheve, and Matthew J. Slaughter. All rights reserved. Shortsections of text, not to exceed two paragraphs, may be quoted without explicit permission provided that fullcredit, including © notice, is given to the source.

Public Finance and Individual Preferences over Globalization StrategiesGordon H. Hanson, Kenneth F. Scheve, and Matthew J. SlaughterNBER Working Paper No. 11028January 2005JEL No. F2, H3
ABSTRACT
In the absence of distortionary tax and spending policies, freer immigration and trade for a country
would often be supported by similar groups thanks to similar impacts on labor income. But
government policies that redistribute income may alter the distributional politics. In particular,
immigrants may pay taxes and receive public services. Imports, obviously, can do neither of these.
This suggests quite different political coalitions may organize around trade and immigration. In this
paper we develop a framework for examining how pre-tax and post-tax cleavages may differ across
globalization strategies and also fiscal jurisdictions. We then apply this framework to the case of
individual immigration and trade preferences across U.S. states. We have two main findings. First,
high exposure to immigrant fiscal pressures reduces support for freer immigration among natives,
especially the more-skilled. Second, there is no public-finance variation in opinion over trade policy,
consistent with the data that U.S. trade policy has negligible fiscal-policy impacts. Public-finance
concerns appear to be crucial in shaping opinions towards alternative globalization strategies.
Gordon H. HansonIR/PS 0519University of California, San Diego9500 Gilman DriveLa Jolla, CA 92093-0519and [email protected]
Kenneth F. ScheveGerald R. Ford School of Public PolicyUniversity of Michigan412 Lorch Hall611 Tappan StreetAnn Arbor, MI [email protected]
Matthew J. SlaughterTuck School of BusinessDartmouth College100 Tuck HallHanover, NH 03755and [email protected]

1
1. Introduction
Despite the protestations of economists, in many countries a substantial share of the public is
skeptical about the benefits of globalization. Concerns stem from many non-economic
considerations, from cultural values to beliefs about environmental impacts. But by now, it is
also well documented that there are important economic concerns as well; in particular, concerns
about labor-market pressures and economic insecurity more generally.1 These economic
concerns accord with much standard economic theory, in which international flows of goods,
capital, and labor all work to integrate national labor markets.
What has received much less attention is the fact that these three alternative strategies of
globalization can have quite different economic impacts on national fiscal policies. Immigration
and trade, for example, both increase international labor-market competition. Indeed, under
certain situations freer trade and immigration can have identical impacts on labor demand and
thus labor income. In the absence of distortionary government tax and spending policies, this
suggests both strategies would be supported by similar groups.
But fiscal policies that redistribute income may alter the distributional politics. Freer trade
and immigration can affect government fiscal activity by comparable amounts, through their
similar impacts on labor demand and thus pre-tax labor income. But there may be important
fiscal differences between the two. Perhaps most crucially, immigrants may pay taxes, may
receive public services, and may vote over tax and spending choices. Imports, obviously, do
none of these things. But trade liberalization that lowers tax rates on imports and/or exports may
alter the composition and level of tax revenue. This suggests quite different political coalitions
1 See Rodrik (1997, 1998), Scheve and Slaughter (2001a, 2001b, 2001c, 2004), Kessler (2001), O’Rourke and Sinnott (2001, 2003), Hays, Ehrlich, and Peinhardt (Forthcoming), Beaulieu (2002), Baker (2003), Mayda and Rodrik (2004), Mayda (2004), and Jain, Kapur, and Mukand (2004). But also see Citrin, Green, Muste, and Wong (1997) and Hainmueller and Hiscox (2004a, 2004b) for alternative perspectives.

2
may organize around trade and immigration because of different public-finance considerations,
making globalization cleavages more fractious than they might otherwise appear.
Consider the example of the United States. What are the labor-market impacts of freer trade
and immigration on U.S. natives? The U.S. comparative advantage in many skill-intensive
products means freer trade is likely to lower the pre-tax earnings of less-skilled natives relative
to more-skilled natives via the Stolper-Samuelson process (Stolper and Samuelson, 1941). For
some time now less-skilled individuals have comprised a large share of U.S. immigrants. In
2000 31% of foreign-born adults in the United States had less than 12 years of education,
compared with only 13% of native-born adults. Because low-skilled and high-skilled labor tend
to be complements, freer immigration is likely to alter pre-tax earnings of natives like trade does.
There is now abundant evidence that freer trade and immigration have in fact generated these
pre-tax wage pressures.2
But do trade and immigration generate any post-tax impacts through fiscal channels? Freer
trade might shift economic activity and thus tax revenue across different states. It might also
increase churning in the labor market as workers and firms adjust to changes in relative prices.
But the magnitude of additional fiscal costs from this adjustment in countries like the U.S. is
likely to be modest, given the limited extent of programs for labor-market adjustment and that
trade, unlike immigration, does not change the potential pool of those receiving public
assistance. For example, the only U.S. outlay explicitly linked to trade liberalization, Trade
Adjustment Assistance, has recently cost less than $300 million a year—about 0.01% of total
federal spending in fiscal 2004. Revenue effects from trade liberalization are also likely to be
2 This literature is very large. For studies on trade, see surveys in Feenstra (2000) or Feenstra and Hanson (2002). For important migration studies, see Borjas, Freeman, and Katz (1997), Card (2001), and Borjas (2003).

3
relatively small in magnitude: the U.S. Constitution prohibits states from taxing trade, and at the
federal level trade taxes have recently constituted less than 1% of total federal revenue.3
But in many U.S. states immigrants have access to public assistance financed by taxes.
Indeed, there is abundant evidence that immigrants make greater use of means-tested welfare
programs than do natives—even after federal welfare reform in 1996 restricted immigrant access
to certain government benefits. Freer immigration may thus increase the net tax burden on U.S.
natives and thus tend to lower their post-tax income. Progressive tax regimes are common in the
United States, which means this fiscal burden may especially hit higher income and more-skilled
natives. All this suggests freer immigration is likely to be evaluated by natives for not just its
labor-market impacts but its fiscal impacts as well.4
To make concrete these fiscal concerns, consider the recent experiences of California and
Texas. In the mid-1990s both states had fiscally conservative governors who were rising stars in
the Republican party. Pete Wilson and George Bush each faced difficult fiscal environments, as
their states had been hit hard by the recession of 1990-91. California and Texas were also
absorbing the brunt of the rising national surge of immigration. During the 1990s, as the foreign-
born share of the U.S. population grew from 7.9% to 11.1%, 37.3% of immigrants chose to
reside in one of the two states (versus just 17.4% of natives).
That many new immigrants were poor and relatively likely to receive public assistance
created the perception that native taxpayers in the two states were bearing most of the fiscal costs
associated with immigration. The data supported this perception. Smith and Edmonston (1997)
calculated that in California over 1994-95 immigrants households received an average fiscal
3 Fiscal revenue data come from International Monetary Fund (2004). TAA information comes from Kletzer and Litan (2001). 4 On immigrant welfare take-up in general see Borjas and Hilton (1996), Borjas (1999), and Fix and Passel (1999). On take-up post-1996 see Zimmerman and Tumlin (1999) and Fix and Passel (2002).

4
transfer of $3,463, or 9.1% of average immigrant household income, which generated an average
fiscal cost to native households of $1,178, or 2.3% of average native household income.
Bush and Wilson appeared to have similar politics. Among other issues, they were both
unabashed free traders who strongly supported the North American Free Trade Agreement. Yet
they took very different approaches toward immigration. In California, Wilson made restricting
public benefits to immigrants the centerpiece of his strategy to control spending. Memorably, he
backed Proposition 187, a ballot measure to deny public services to illegal immigrants.5 In
Texas, Bush embraced the state’s immigrant population and courted the Latino vote, saying he
would not support a measure like Prop. 187 in Texas.6
This tale of two states suggests that fiscal policies shape voter attitudes toward immigration.
High-income voters are important Republican constituents in both states. In California, which
funds generous public benefits with progressive income taxes, high-income voters may worry
immigration raises their tax burden. This was one source of pressure on Wilson to reduce fiscal
transfers to immigrants.7 Texas, in contrast, has a weaker safety net and no state income tax. Its
high-income voters may perceive immigration as having a small impact on their tax obligations,
which may have given Bush greater latitude in how to address the issue.8
In this paper we examine how fiscal policy may shape individual preferences towards
different globalization strategies. We first develop a simple framework of voter preferences, to
see how pre- and post-tax cleavages may differ between trade and immigration and also across
jurisdictions. Absent distortionary tax and spending policies, standard trade theory predicts that
in any country freer immigration and trade will be supported by relatively-abundant workers and
5 See Julie Marquis, “Wilson Blames Ills on Illegal Immigrants,” Los Angeles Times, Oct. 17, 1994, B1. 6 See Juan Palomo, “The Cool Headed Governor,” Hispanic Business, Dec. 1995, 12-16. 7 See Louis Freedberg, “Wilson Defends Stance on Illegals,” San Francisco Chronicle, Jun. 23, 1994, A2. 8 In particular, Texas fiscal policies may have allowed Bush the political space to appear both pro-immigrant, to appeal to the Latino vote, and fiscally conservative, to appeal to the party base. See “Yo te quiero mucho,” Economist, Sep. 28, 2000.

5
opposed by relatively-scarce workers. Again, for many countries there is now abundant evidence
of this. But fiscal policies that redistribute income, which have been ignored by the literature,
alter the distributional politics along the lines suggested above. Our framework clarifies the pre-
and post-tax pressures on individual economic welfare from various globalization policies.
We then apply this framework to the case of individual immigration and trade preferences
across U.S. states over the 1990s. For at least two important reasons this is an especially rich
empirical setting. One is the ample evidence for the United States cited above to support both
labor concerns that immigration changes wages and fiscal concerns that it raises native tax
burdens. The other is that U.S. states vary greatly in the size of their immigration inflows, the
generosity of their public benefits, and the progressivity of their tax structures. This variation
suggests that natives in some states will be especially “exposed” to immigrant fiscal burdens.
Our empirical work combines data from multiple sources. What results is a rich individual-
level data set with which we can apply our theoretical framework to examine how individual
attitudes toward immigration and trade are shaped by important forces including individual
labor-market skills and state immigration and fiscal regimes. We exploit variation both across
states and over time in fiscal exposure to immigration, such as the fact that some high-immigrant
states offer generous public assistance while others do not. Moreover, our data allow us to
control for a wide array of individual characteristics and political attitudes that have been
demonstrated to have a strong correlation with opinions about trade and especially immigration.9
We have two main findings. First, high exposure to immigrant fiscal pressures reduces
support for freer immigration among natives, especially the more-skilled. The magnitude of this
post-tax fiscal cleavage is comparable to the pre-tax labor-market effects of skill itself. Second,
9 See, for example, Citrin, Green, Muste, and Wong (1997), Scheve and Slaughter (2001a, 2001b, 2001c), Kessler (2001), O’Rourke and Sinnott (2001, 2003), Mayda and Rodrik (2004), Mayda (2004), and Hainmueller and Hiscox (2004a, 2004b).

6
there is no public-finance variation in opinion over trade policy, consistent with the data that
U.S. trade policy has negligible fiscal-policy impacts. The overall message is that public-finance
concerns appear to be crucial in shaping opinions towards alternative globalization strategies.
Our paper has five additional sections. In section 2 we develop our theoretical framework.
Section 3 presents our data and some motivating summary statistics. In section 4 we discuss our
econometric specifications, and in section 5 we report estimation results. Section 6 concludes.
2. Theoretical Framework: The Welfare Consequences of Immigration and Trade
In this section we develop a simple framework of voter preferences to examine how pre-tax
and post-tax cleavages may differ for trade and immigration and also across jurisdictions. For
simplicity, we focus on voter preferences based on just individual economic welfare. As stated
in the introduction, there are many important non-economic determinants of attitudes towards
globalization. These will be an essential part of our empirical analysis.
Framework
Let V(p, Ii) be the indirect utility enjoyed by individual i, which depends on the vector of
prices for consumption goods and services, p, and also on after-tax income available for
consumption, Ii. In turn, after-tax income depends on the pre-tax wage income, iy ; the effective
income-tax rate, it ; and government transfers, ig .
iiii g)t1(yI +−= (1)
Tax rates and government transfers vary across individuals by both state of residence and level
of income. Equation (1) assumes both that all income is from labor earnings, and that only labor
earnings are taxed. Neither assumption is essential, but they simplify the presentation.

7
Together these assumptions imply that an individual’s economic well-being can be expressed
as V(p, iiii tygy −+ ). Thus, well-being can be thought of as depending on three separate terms:
prices, p, pre-tax income, iy , and the post-tax net fiscal transfer, )tyg( iii − . It is useful to
consider the impact of freer immigration or trade on each of these terms separately.
Impacts on Prices
If immigration lowers some of the prices in p at which goods and services are available in a
state, its individuals are better off. This may be particularly true for non-tradables that use
intensively immigrant labor services. As is well-known, freer trade can also alter relative prices,
with higher prices for comparative-advantage goods and services.
Impacts on Pre-Tax Labor Income
Next consider the change in pre-tax labor income, iy , from freer immigration or trade. If
immigration increases the relative supply of low-skilled labor, then this income is likely to rise
for high-skilled individuals and fall for low-skilled individuals. We expect the opposite impacts
if immigrants are predominantly more-skilled. These wage impacts could be national or local in
scope, depending on the extent of labor-market integration across states. And they could even be
zero if immigrants are absorbed via mechanisms other than wage changes.10
Trade liberalization can also alter individual welfare through (nominal) pre-tax labor income.
Indeed, the net impact of this channel plus the commodity-price channel on real labor income is
the focus of the Stolper-Samuelson theorem, a well-known mechanism of standard Heckscher-
Ohlin trade theory. Here the net impact on real pre-tax earnings varies along factor lines, not
10 For evidence on national vs. local wage impacts of immigration see Borjas, Freeman, and Katz (1997); Card (2001); and Borjas (2003). Two other adjustment mechanisms may be factor prices other than wages or the industry mix of output, known in the trade literature as Rybczynski effects. See Hanson and Slaughter (2002) for evidence of these output-mix effects across U.S. states. For a more-detailed discussion of all these possibilities, see Scheve and Slaughter (2001c).

8
industry lines, thanks to sufficient interindustry factor mobility. Impacts on pre-tax income
would be different with relatively immobile factors of production.11
Impacts on Post-Tax Net Fiscal Transfer
The third channel to consider is the change in the net fiscal transfer received by individual i.
In countries like the United States this net fiscal transfer, )tyg( iii − , contains state and federal
components. We assume that the federal component can be expressed as a reduced-form
function of individual characteristics (e.g., age, income, family size). The state component of net
fiscal transfers will depend on the interaction of individual characteristics, as summarized by iy ,
and state tax and spending policies, as summarized by it and ig .
Consider first how immigration will change net fiscal transfers received by natives. For the
U.S. case, as stated in the introduction there is now abundant evidence that immigrants make
greater use of means-tested welfare programs than do natives. Accordingly, we assume that the
arrival of immigrants to a state raises demand and, given eligibility rules, cost for its welfare
services. In principle, states can meet this higher immigrant-related cost in one of three ways:
borrow, reduce other transfers, or raise tax revenue. In practice, for most U.S. states borrowing
is not an option: all but Vermont self-impose constitutional or statutory balanced-budget
requirements. We therefore assume that states meet higher immigrant welfare costs by a
combination of reduced government transfers to and increased taxation of natives. So with
higher immigration natives suffer a fall in )tyg( iii − because of lower ig and/or higher it .
The exact fiscal impact on each native in each state will depend on individual characteristics,
predominantly labor-market skills and thus income. It will also depend on state characteristics:
the nature of state fiscal policy in terms of progressivity and welfare generosity, and the
11 See Scheve and Slaughter (2001b) for details on trade’s impact on factor income in different settings.

9
magnitude of the state’s total immigrant inflow. We expect natives to experience larger falls in
net fiscal transfers when living in states with larger immigrant inflows and/or generous welfare
programs. For states that use more progressive tax and spending systems, we also expect the
declines in net fiscal transfers to fall disproportionately on more-skilled natives.
Now consider the fiscal impacts of freer trade. Like freer immigration, freer trade can alter
)tyg( iii − via pre-tax changes in iy . Unlike freer immigration, however, freer trade does not
bring a change in the population and thus changes in welfare take-up that must be accommodated
by changes in the net fiscal transfers to natives. It is true that trade might increase churning in
the labor market as workers and firms adjust to changes in relative prices. But the magnitude of
additional fiscal costs from this adjustment in countries like the U.S. is likely to be modest, given
the limited extent of state and federal programs for labor-market adjustment.12 We conclude that
freer trade generally does not generate the same fiscal pressures as immigration, and certainly
does not do so in countries with minimal trade taxes and minimal labor-market policies.13
Summary of Theoretical Framework
Freer immigration and welfare can affect individual economic welfare and thus policy
preferences through product prices, pre-tax labor income, and post-tax net fiscal transfers.
Public-opinion research to date has largely ignored this third channel. Our framework clarifies
that for immigration this channel is likely important but that for trade its relevance depends on
whether trade and fiscal policies are explicitly linked, which is not the case in the United States.
12 An alternative argument may be that a generous tax and transfer system that provides more insurance to workers reduces opposition to liberalization. For cross-country evidence consistent with this idea, see Hays, Ehrlich, and Peinhardt (forthcoming) and Scheve and Slaughter (forthcoming). This effect may be relevant in settings in which borrowing is allowed or for which the incidence of taxes paying for the insurance is not clear—settings unlike the U.S. states. Or this effect may especially apply to less-skilled individuals at greater risk from liberalization but less likely to pay the costs. Our empirical work investigates the possibility of this alternative fiscal impact. 13 Today in many countries trade taxes constitute a small share of total government revenue. This is not true for many other countries, however, especially outside the OECD, and was not true for almost all of today’s advanced countries in earlier decades and/or centuries. For a discussion see United States Trade Representative (2003).

10
Our framework generates a number of testable predictions of how immigration and trade
opinions in the United States may differ across individuals and also across fiscal jurisdictions.
The pre-tax labor-income pressures from immigration and also trade are likely to cleave across
skill groups within all jurisdictions. But for immigration there should also be after-tax fiscal
pressures that vary with state fiscal regime and skill type. Natives in states that are fiscally
exposed to immigration, thanks to a combination of high immigrant inflows and/or generous
welfare programs, should be less supportive of immigration than natives in less-exposed states.
To the extent that states rely on progressive tax-and-spending regimes, this reduced support for
freer immigration should be especially strong among higher income and more-skilled natives.
3. Data and Summary Statistics
The data for our analysis of individual policy preferences about immigration and trade come
from three sources. We measure individual attitudes regarding immigration and international
trade using the 1992 and 2000 American National Election Studies (NES) (Sapiro, et al, 1998).
We select these two NES years to match as closely as possible our data from the 1990 and 2000
U.S. Censuses of Population and Housing, from which we obtain data on immigrant and native
populations, labor forces, and use of public assistance, and also to allow for significant temporal
variation in these characteristics. Finally, data on state fiscal policies, in particular welfare
spending and tax progressivity, come from the U.S. Censuses of Governments.
3.1 The Fiscal Impact of Immigrant Populations in U.S. States
We begin our discussion of the data by showing that the fiscal impact of immigration varies
significantly across U.S. states. States vary both in their exposure to immigration and in their
generosity of public assistance. In summarizing immigration patterns across U.S. states, we take

11
households (rather than individuals) as the unit of analysis. Households are the units on which
government agencies assess income taxes, property taxes, and other levies. For determining
individual eligibility for means-tested benefit programs, it is typically household characteristics
that are evaluated (Zimmermann and Tumlin, 1999). An immigrant household is defined as one
whose head is foreign born. This definition of the immigrant population includes U.S.-born
children of immigrants.
Figure 1, which plots the share of the state population residing in immigrant-headed
households in 1990 and 2000, reproduces the familiar fact that within the United States the
immigrant population is geographically concentrated. For the nation as a whole, the share of the
population living in immigrant-headed households was 16.5% in 2000, up from 11.5% in 1990.
For 2000 the immigrant population share was between 30% and 40% in two states (California,
New York), and it was above the national share in just eleven other states.14
While California and New York have long been immigrant havens, the immigrant population
has been growing most rapidly in states that traditionally have not been immigrant gateway
locations. To see this growth, it is important to control for the facts that some states begin with
very small immigrant populations and that some have rapid growth in native populations. For
immigrants and natives, we normalize state population growth by the cross-time average state
population and measure immigration population growth relative to native population growth as,
)NN(NN
)MM(MM
1990200021
19902000
1990200021
19902000
+−
−+−
where Mt and Nt are the year t foreign-born and native-born populations in a state, respectively.
14 These 11 states are New Jersey, Hawaii, Florida, Nevada, Texas, Connecticut, Massachusetts, Arizona, Rhode Island, Illinois, and District of Columbia.

12
Figure 2 plots normalized relative immigrant population growth between 1990 and 2000
against the immigrant population share in 1990. The states with the most rapid immigrant
population growth (North Carolina, Georgia, Arkansas, Nebraska, Colorado, Utah) had relatively
small immigrant populations in 1990. Other states with rapidly growing immigrant populations
(Nevada, Colorado, Utah, Oregon, Arizona) had moderate immigrant populations in 1990.
These two groups of states had rapid job growth during the 1990s. And, with the exception of
Oregon, these states are not known for the generosity of their welfare programs.
The fiscal impact of immigrants is, however, only partially related to the size of immigrant
flows. Depending on both immigrants’ characteristics and state policies, immigrants may or may
not access public assistance or consume other public services and may or may not pay taxes.
The extent of fiscal transfers from natives to immigrants depends on these factors as well.
Individuals use public services in many forms, including public safety (fire and police
protection), public spaces (parks and recreation facilities), public education, public health care,
and public assistance (welfare). For immigrants, it is access to public assistance that is perhaps
the most controversial. The Census of Population and Housing collects information on cash
assistance in the form of supplemental security income, aid for families with dependent children
(which has become temporary assistance for needy families), and general assistance. This is
only a partial list of means-tested entitlement programs, and it excludes non-cash benefits such
as food stamps, Medicaid, public housing, and energy subsidies. In contrast, the Census of
Governments data discussed below measures both cash and non-cash benefits.
Figures 3a and 3b plot the fraction of immigrant and native households that received cash
public assistance in 1990 and 2000. The likelihood that immigrants receive welfare varies
widely across states. The states in which immigrants were most likely to receive benefits are

13
mostly high-income states on the east and west coasts (California, New York, Massachusetts,
Pennsylvania, Connecticut). In 1996 there was a major reform of federal U.S. welfare law,
which imposed a lifetime cap on the number of years an individual could receive certain cash
benefits and which excluded non-citizens from eligibility for many types of benefits. After 1996
many states at least partially replaced benefits at the state level that immigrants lost at the federal
level, adding to the cross-state variation of public benefits available to immigrants.15
As discussed in Section 2, an important requirement of our analysis below will be to measure
accurately variation in natives’ potential fiscal exposure to immigrants across both states and
years. Our measure would ideally account for the relative size of the immigrant and native
populations as well as the incidence and value of immigrant uptake of benefits. Figure 3 shows
immigrant uptake incidence, but only for cash benefits and without any value information. The
Census of Governments measures the annual value of both cash and non-cash benefits by state,
but not broken out between immigrants and natives. However, Figure 3 shows a positive
correlation between the fraction of native and immigrant households receiving public assistance
(0.24 in 2000, weighted by state population), which suggests that welfare spending in total
should be a reasonable proxy for welfare spending on immigrants only.
Accordingly, our first measure of potential fiscal exposure to immigrants, Fiscal Exposure 1,
is a dichotomous indicator variable equal to one for state-years that meet two conditions: (1) that
have relatively high welfare generosity, measured as above the national median welfare spending
per native; and (2) that have relatively high immigration populations defined as those states with
15 For evidence on this replacement, see Zimmermann and Tumlin (1999). Following welfare reform, there was a well-documented national decline in the fraction of native and immigrant households receiving benefits from means-tested entitlement programs (Fix and Passel, 2002; Borjas, 2003). The national decline was larger for immigrants than for natives, leading many to conclude that welfare reform was at least partly effective in its stated aims. Borjas (2003) finds that the national relative decline in immigrant use of means-tested programs was due entirely to California. For the period 1994-1998, he finds that outside of California immigrant and native use of welfare declined by a similar amount.

14
a ratio of immigrants to natives of at least 0.12.16 Our welfare-spending measure from the Census
of Governments includes a broad range of benefits including cash and medical assistance.
An alternative measure of native fiscal exposure might use the immigrant uptake intensity in
Figure 3 but scale it against all native households to measure the overall native tax base. The
result is Figures 4a and 4b, which plot the number of immigrant households receiving cash
benefits relative to the total number of native households against the ratio of immigrant to native
households for 1990 and 2000, respectively.
Many states have both small immigrant populations and small numbers of immigrant
households on welfare. Among high-immigration states there is considerable variation in
immigrant uptake of welfare. California and New York stand out as states with high immigrant
welfare use. Among states with immigrant households equal to 10% to 20% of the number of
native households in 1990, the ratio of welfare-receiving immigrant households to native
households ranges from 0.005 in Nevada to over 0.02 in Massachusetts. Although the relative
size of the immigrant population is comparable in these two states, in effect each native
household in Massachusetts must support four times as many immigrant households on welfare
as does each native household in Nevada.
This cross-state variation in the expected fiscal cost to natives of immigrant welfare use
creates the potential for regional variation in public opinion about immigration policy—even
among states with similar-sized immigrant populations. Accordingly, we construct our second
measure, Fiscal Exposure 2, as a dichotomous indicator variable equal to one for state-years in
16 This particular cutoff identifies those states in Figure 1 that are spread out from the mass of states in the bottom left with low immigrant populations in both years.
15
which the ratio of immigrant households receiving cash forms of welfare relative to the total
number of native households exceeds 0.012.17
This ratio that defines Fiscal Exposure 2 gauges the potential fiscal effects of immigrants on
natives insofar as it incorporates both the incidence of immigrant cash welfare use and also the
relative sizes of the immigrant and native populations. Relative to Fiscal Exposure 1, Fiscal
Exposure 2 has the disadvantages of excluding non-cash benefits and also containing no measure
of the value of welfare use. We thus prefer our first measure, but for robustness use both.
3.2 Public Opinion about Globalization and State Generosity Towards Immigrants
The NES is an extensive survey of individual political opinions, including opinions about
trade and immigration, based on a stratified random sample of the U.S. population. These
surveys also report respondent characteristics including age, gender, educational attainment, and
location of residence. To evaluate individual preferences toward immigration and trade, we use
two questions from the NES. Regarding immigration, the NES asks
"Do you think the number of immigrants from foreign countries who are permitted to come to the United States to live should be increased a little, increased a lot, decreased a little, decreased a lot, or left the same as it is now?"
For the main analyses of immigration in the paper, we set the variable Immigration Opinion
equal to 1 for those individuals favoring immigration to be decreased a little or a lot and 0 for
those individuals favoring immigration be maintained or increased.18 This question requires
respondents to reveal their general position on the proper direction for U.S. immigration policy.19
In 2000, 44.8% of respondents favored decreasing immigration (15.0% by a little, 29.8% by a 17 The threshold of 0.012 was selected based on Figure 4a. Along the y-axis of this graph, there is a substantial gap between Texas and the states above it separated by 0.012. 18 Using the fully disaggregated coding of the responses to this question and changing our econometric specifications accordingly generates qualitatively similar results. We dichotomize this variable for ease of exposition and comparison to trade opinions. 19 The question does not ask what skill-mix immigrants would have relative to the survey respondent or the native population as a whole. We assume responses are informed by the average skills of actual U.S. immigrants in recent decades, which are relatively low and thus increase the relatively supply of less-skilled workers. The distribution of U.S. immigrants does include a substantial number of relatively skilled individuals. Nonetheless, the average U.S. immigrant is less skilled and we assume that this central tendency informs respondents’ answers to the question.

16
lot), 44.5% favored leaving immigration unchanged, and 9.8% favored increasing immigration
(5.8% by a little, 4.0% by a lot).
Regarding trade, the NES asks,
"Some people have suggested placing new limits on foreign imports in order to protect American jobs. Others say that such limits would raise consumer prices and hurt American exports. Do you favor or oppose placing new limits on imports, or haven't you thought much about this?"20
We set the variable Trade Opinion equal 1 for those individuals favoring protection and 0 for
those opposing it. This question requires respondents to reveal their general position on U.S.
trade policy. Note that the question does not ask what sector(s) would receive import
restrictions. We assume that responses to the question are informed by the idea that import
limits will be placed on comparative-disadvantage sectors. This seems more sensible than
alternatives such as limits on comparative-advantage sectors. In 2000, 48.5% of respondents
favored new restrictions on imports.
Our theoretical discussion in Section 2 focused on two motivations for opposition to
immigration and trade. One is the concern that immigration and trade put downward pressure on
pre-tax wages for less-skilled workers. A number of recent papers have found evidence
consistent with this prediction.21 Our focus is on the second motivation: concern that immigrant
use of public services alters the net fiscal burden on native taxpayers. This carries potential
after-tax impacts of immigration; in particular, the progressive U.S. tax structure could tend to
make high-income taxpayers particularly more opposed to immigration. Recall that because
U.S. trade policy does not have the same fiscal consequences as immigration, we do not expect
20 In 2000, the NES asked some respondents this question and some respondents a similar but not identical question which did not include the response option “haven’t you thought much about this”. In the main trade results reported in Table 10, we include all respondents from the 2000 survey who answered either form of the question. The results are qualitatively the same if those respondents asked the experimental question are excluded from the analysis. 21 Scheve and Slaughter (2001a, 2001b, 2001c), Kessler (2001), O’Rourke and Sinnott (2001, 2003), Mayda and Rodrik (2004), Mayda (2004), and Hays, Ehrlich, and Peinhardt (Forthcoming). But also see Citrin, Green, Muste, and Wong (1997), and Hainmueller and Hiscox (2004a, 2004b) for alternative perspectives.

17
support for trade policy to vary across states according to expected welfare costs of immigrants
or even by alternative measures of fiscal exposure tailored to trade as opposed to immigration.
Our econometric estimation will examine both these motivations, as well as a host of other
important non-economic factors that may affect an individual’s stance on immigration, e.g.,
political beliefs and ethnicity. But before turning to these estimates, it is instructive to see if
simple summary statistics reveal patterns consistent with these two considerations.
Table 1 shows the fraction of native-born individuals favoring new restrictions on
immigration in the 1992 and 2000 NES surveys by four levels of education (less than high
school, high school, some college, and college graduate). The most educated are the least
opposed to immigration, broadly consistent with the expectation that less-skilled natives have
more restrictionist policy opinions due to labor market competition. For these pooled descriptive
statistics, Table 1 indicates that the key skills cleavage is between college graduates and all other
respondents. Table 2 reproduces Table 1 for trade policy opinions. Support for trade restrictions
varies dramatically by skill type. Over 72% of individuals without a high-school diploma
support further restrictions, compared with just 39% of college graduates.
Table 3 breaks down Table 1 further according to whether an individual lives in a state for
which the welfare costs of immigrants are expected to be high or low as measured by Fiscal
Exposure 1 and 2. Given our theoretical framework, the key fiscal quantity of interest is the
difference in the immigration opinions of similarly skilled respondents across states. In states
with high fiscal exposure to immigration we expect natives to be less supportive of freer
immigration than are natives elsewhere. To the extent that states rely on progressive tax-and-
spending regimes, this reduced support should be especially strong among more-skilled natives,

18
for whom the negative fiscal effects of immigration on after-tax income work against the positive
wage effects of immigration on pre-tax labor income.
Table 3 shows that in states with high expected fiscal costs 42% to 44% of college graduates
have restrictionist immigration opinions, compared with only 36% in states with low expected
costs. This differential is even larger for high-school dropouts, somewhere between nine and 16
percentage points. These cross-state cleavages are broadly consistent with the idea that fiscal
concerns reduce support for immigration among U.S. natives.
Table 4 investigates whether the patterns of Table 3 hold for trade policy opinions. Again,
because U.S. trade policy does not have the same fiscal consequences as immigration we do not
expect support for freer trade to vary across U.S. states according to the welfare costs of
immigrants. The pattern of responses in Table 4 is broadly consistent with this expectation. For
the three lower education levels trade opposition is lower in the high fiscal-exposure states; for
college graduates trade opposition is higher in these states, but marginally so.22
4. Empirical Specifications
Our theoretical discussion highlighted three distinct channels through which immigration and
trade are likely to affect an individual’s economic well-being: prices, pre-tax income, and post-
tax net fiscal transfers. We build on this framework to specify reduced-form estimating
equations for individual preferences regarding immigration and trade policy.
Let *istI )( *
istT be a latent variable indicating opposition to immigration (trade) by a native
individual i living in state s at time t. We model the determinants of *istI )( *
istT as follows,
iststiststistkkstistkkistjjist ZXFEEducImmEducEducI µδθλγβα ++++++= )(1)(1)(1)(1)(10* (2)
22 In the econometric analyses of trade opinion presented below, we also examine alternative measures of fiscal exposure that are tailored to trade as opposed to immigration.

19
where j is an index from 1 to 3; k is an index from 1 to 4; )(1 istjEduc and )(1 istkEduc are a series
of dichotomous variables indicating individual educational attainment; )(1 stImm is the
dichotomous variable Immigration indicating whether the state in which the respondent lives is a
high-immigration state; )(1 stFE is a dichotomous variable, Fiscal Exposure 1 or 2, indicating
whether the state in which the respondent lives faces a high level of fiscal exposure to
immigration; X is vector of individual-level control variables, Z is a vector of state-level control
variables; α ,β , γ , λ , θ , and δ are parameters to be estimated; and istµ is a mean-zero
random error term that reflects unobserved factors associated with individual preferences over
changes in immigration or trade policy, including the impact of immigration or trade on the
unobserved determinants of wage income and fiscal transfers.
The first term in this expression, 0α , is simply a constant. The second and third terms
evaluate the pre-tax income channel for how immigration and trade affect economic well-being.
The second term is indexed by j because for )(1 istjEduc we include three indicator variables,
High School, Some College, and College, with No High School as the omitted category. The
third term is indexed by k because we interact all four educational categories with the variable
Immigration, indicating whether the respondent lives in a high immigration state.
This parameterization provides a pre-tax labor-market interpretation of 3...1β and 4...1γ . In the
presence of low-skilled immigration, we expect opposition to immigration to be decreasing in
respondent skill levels because of its effect on earnings across skills. Thus the coefficient for
College, 3β , should be less than zero, and perhaps the same will hold for Some College, 2β . If
immigrants alter wages locally rather than nationally, then correlations between skills and
opinion should be stronger in states with immigration levels. This implies that the coefficient on

20
the interaction between No High School and Immigration, 1γ , should be greater than zero and/or
that the coefficient on the interaction between College and Immigration, 4γ , should be less than
zero (with potentially analogous predictions for the other two education-immigration
interactions). With the exception of the last point of local wage impacts, these same predictions
apply to trade insofar as freer trade expands the effective supply of low-skilled labor.
The fourth term in equation 2, )(1)(1 stistkk FEEducλ , evaluates the main argument of this
paper: that the consequences of immigration for post-tax net fiscal transfers have an important
effect on individual economic well-being and thus policy opinions. We interact all four
educational variables with our measures indicating whether the state in which the respondent
lives faces high fiscal exposure to immigration. Our theoretical discussion highlighted the
consequences of immigration for net fiscal transfers across different income groups. But for our
benchmark specifications, we use education rather than income to differentiate fiscal exposure
across individuals in the same state. This is because income is well known to be poorly
measured, nonrandomly missing in surveys, and sensitive to transitory shocks (e.g., illness or
bonuses) that do not reflect permanent income and thus fiscal status. For robustness, we will
also present evidence using a direct measure of each respondent’s relative income.
The parameters 4...1λ indicate whether respondents with No High School, High School, Some
College, and College in high fiscal-exposure states are more or less likely to oppose immigration.
Our theoretical discussion suggests that respondents across all income/educational categories
should be more opposed to immigration in states with high fiscal exposure to immigrants, and
that this should be especially true for high income/educated individuals due to the progressivity
of state tax and transfer systems. We therefore expect the parameters 4...1λ to be positive and
increasing in magnitude. In principle, a similar effect might be observed for trade. But in

21
practice, we do not expect opposition to trade to vary significantly with state fiscal exposure
because of the small magnitudes of any likely fiscal effects of trade in the context of U.S. states.
Finally, the fifth and sixth terms in equation (2), istXθ and stZδ , estimate the effect of various
individual-level and state-level control variables including Age, Age Squared, dichotomous
indicator variables Female and Hispanic, State Unemployment, a year indicator variable for
2000, and in most specifications a full set of state fixed effects to account for time-invariant
features of states that may influence individual attitudes towards immigration and trade. Some
of these control variables account for the price channel, which depends on consumption patterns
not measured in our data.23 Importantly, the controls may capture some non-economic
influences on policy opinions. We will report results with many additional control variables that
measure tolerance, isolationist sentiment, ideology, and partisanship, all which more directly
attempt to account for non-economic determinants of policy opinions.
In equation (2), the latent variable *istI )( *
istT is unobserved. Let istI , Immigration Opinion,
( istT , Trade Opinion) be an indicator variable equal to one if an individual favors decreasing
immigration (restricting trade) and zero otherwise, in which case Pr( 0* >istI ) = Pr( 1=istI ) or
Pr( 0* >istT ) = Pr( 1=istT ). Assuming that the idiosyncratic component of individual preferences,
µist, is normally distributed, then for immigration (analogously for trade) the following applies:
))(1)(1)(1)(1)(1()1Pr( 0 stiststistkkstistkkistjjist ZXFEEducImmEducEducI δθλγβα +++++Φ== (3)
where Φ() is the standard normal cdf. We will estimate equation (3) as a probit, first on
immigration and then on trade preferences and report robust standard errors clustered on states.
23 The interactions between educational attainment and whether the respondent lives in a high-immigration state also control for the price channel because consumption patterns vary by income and education and because the effect of immigration on prices depends on how many immigrants there are.

22
All estimations use NES data for native-born individuals pooled across 1992 and 2000. We
focus on the sub-sample of natives to highlight the public-finance aspect of preference formation.
5. Estimation Results
5.1 Immigration-Policy Preferences
Table 5 reports our benchmark estimates of equation (3) for immigration preferences. Again,
our theoretical framework suggests that freer immigration may affect individual economic
welfare through three distinct channels. One is through commodity prices, captured with our
benchmark controls, state fixed effects, and other regressors. The second is through pre-tax
labor income. This is measured by the dichotomous skill indicators (No High School, High
School, Some College, and College) and these indicators interacted with Immigration, our
dichotomous indicator of high state immigration presence. These interactions allow the labor-
income consequences of—and thus policy preferences over—immigration to be different in
high-immigration states.24 The third channel is through after-tax net fiscal transfers. This is
measured by Fiscal Exposure 1 and 2, interacted with the skill regressors. Each specification
includes the set of benchmark controls discussed in Section 4 and we estimate specifications both
without and with state fixed effects. We prefer including state fixed effects because there are
likely to be unobserved, unmeasured but time constant characteristics of states that both may
influence support for immigrants and also may be correlated with our fiscal-exposure
measures.25
24 Consistent with much of the labor-economics literature on wage impacts from immigration, this specification assumes that states delineate local labor markets. Our key results demonstrating the importance of public-finance considerations for public opinion about immigration policy are robust to dropping the interactions between education and Immigration, which would be consistent with immigration having national and not state-level wage impacts. 25 For brevity, estimation results for all of these other regressors are omitted from the tables.
23
We first note that the results across all four specifications in Table 5 replicate the finding in
the literature that more-skilled natives are less likely to support immigration restrictions. The
coefficients on education alone indicate the relationship between education and immigration
opinions for respondents in states for which immigration is low in both magnitude and expected
fiscal effects. Here, opposition to immigration is weakest among college graduates. The
coefficient on College in Model I2 implies that college graduates were approximately 14
percentage points less likely to prefer fewer immigrants than high-school dropouts.26
The results for respondents in high-immigration but low-fiscal-impact states show even more
striking evidence of this skills cleavage. For both fixed-effects specifications, the coefficient on
the interaction between No High School and Immigration is positive, large in magnitude, and
statistically significant (none of the other skill interactions with Immigration are significant).
Low-skilled respondents have substantially stronger support for further immigration restrictions
in those states for which immigration is high but fiscal exposure is low. More precisely, since
this result is clearest in the specifications with fixed effects, it is in those states with increasing
levels of immigrants that low-skilled natives are most supportive of restrictions. This finding is
consistent with area-analysis models that predict stronger labor-market consequences of
immigration in gateway communities, and so that differences in policy opinions across skill
groups are likely to be larger in magnitude.27 The results for Model I2 imply that the difference
in probability of supporting tighter immigration policies between College and No High School
natives doubles in size in those states with high immigration populations, to a difference of over
26 The size of this effect is very similar across all four specifications. We note that for respondents in these states we do not observe the expected differences between the No High School, High School, and Some College groups. There is some evidence (Models I3 and I4) that individuals with (i.e., not without) a high-school degree have the most-restrictionist opinions. 27 Scheve and Slaughter (2001c) found little support for the prediction that policy opinion differences between more and less-skilled workers are strongest in gateway communities. The analysis in this paper takes advantage of a longer time period between surveys in order to estimate specifications with state fixed effects that account for unobserved state characteristics and identify off of changes in immigration population.

24
30 percentage points. This cleavage is consistent with the potential impact of immigration on
pre-tax labor income being an important factor in opinion formation over immigration policy.
Our main substantive question of interest, however, is whether potentially high fiscal costs
from immigration shape policy preferences. Our theoretical framework suggested that this effect
may hold across all natives, but is likely to be strongest for those with the highest skills and
income. Across all four specifications in Table 5, the coefficients on interactions between
College and Fiscal Exposure 1 (or 2) are positive and statistically significant. College-educated
natives have more-restrictionist policy views in states for which the net fiscal burden of
immigration is likely to be high. Table 5 also offers evidence of a fiscal effect for the other skill
categories as well. Our preferred specification in Table 5 is Model I2, which uses Fiscal
Exposure 1 (rather than 2) and includes (rather than excludes) state effects. In Model I2 the
interaction of Fiscal Exposure 1 with each of the four skill measures is positive and statistically
significant (though only marginally so for the No High School interaction).
These results for the fiscal-exposure regressors are consistent with the central argument of
this paper: the post-tax fiscal burdens associated with more immigrants tend to increase support
for immigration restrictions, and do so even among those more-skilled individuals likely to
benefit in the labor market from immigration. These results are the paper’s main finding.
The substantive magnitude of the fiscal-exposure effect is large. For the preferred fixed-
effects specifications reported in Table 5, Table 6 reports the estimated effect across different
skill groups of increasing fiscal exposure to immigration on the probability of supporting
immigration restrictions. For Fiscal Exposure 1, moving a college graduate from a state with
low to high fiscal exposure to immigration raises the probability of favoring fewer immigrants by
19 percentage points. The size of the comparable effect for natives in the other three educational

25
categories is about 10 percentage points. The magnitude of this post-tax fiscal cleavage is
comparable to the magnitude of the pre-tax labor-market cleavage across skills mentioned above.
For Fiscal Exposure 2 the results are almost identical in magnitude for college graduates but are
smaller and less precisely estimated for the other skill categories. We conclude from our
benchmark results in Tables 5 and 6 that living in states with high fiscal costs from immigration
significantly increases the likelihood of restrictionist opinions, and that the magnitude of this
fiscal cleavage is large and in fact comparable in size to the labor-market cleavage across skills.
To evaluate the robustness of our benchmark results and also probe our interpretation of
them, we estimated many alternative specifications. Some of these are reported in Tables 7
through 9. The two specifications in Table 7 add to our benchmark fixed-effects models a
broader set of demographic and political control variables. The estimates for these additional
control variables are mostly consistent with previous findings in the literature. For example,
respondents that scored higher on our measure of Tolerance were less likely to have restrictionist
opinions about immigration policy. Individuals with isolationist views about the role of the
United States in the world, as measured by Isolationism, were much more likely to support
further immigration restrictions. These findings highlight the common claim in the literature that
policy attitudes about immigration are shaped in part by non-economic considerations (e.g. Citrin
et al 1997, Scheve and Slaughter 2001c, Hainmueller and Hiscox 2004a).28 We would add that
these non-economic considerations provide a complementary answer to our emphasis on fiscal
considerations in addressing why individuals might have different opinions about alternative
28 This interpretation needs, however, to be made cautiously. It is, of course, possible that factors such as levels of tolerance, ideology, and isolationist sentiments are a consequence of economic competition rather than exogenous determinants, though a completely economic reductionist account seems implausible. Moreover, a number of the additional control variables may be endogenous to immigration policy opinions or generate other estimation problems such as introducing additional measurement error. For these reasons, we retain our benchmark specifications in most of the remaining results discussed in the paper.

26
globalization strategies. Certainly one reason why is that prejudice and other political attitudes
are likely to play a bigger role in policies like immigration in comparison to policies like trade.
Rather than explore the results for these control variables in greater detail, we focus on the
robustness of our key fiscal findings for these specifications. For both Models I5 and I6, the key
fiscal-exposure estimates remain statistically and substantively significant. If anything, results
come through more clearly with the additional controls: now the interaction terms of Fiscal
Exposure 2 with High School and Some College are also significantly different from zero.29
In Table 8 we experiment with alternative measures of individual skills and relative fiscal
position. Consistent with much work in labor economics, our benchmark specifications measure
individual skills and relative fiscal position with educational attainment. This latter choice
assumes that long-run or “permanent” income is determined primarily by human capital. That
said, it is certainly an individual’s realized income rather than educational attainment that
directly determines net fiscal transfers and their possible sensitivity to immigrant inflows. But as
discussed earlier, for our benchmark specifications we chose education rather than income.
In Table 8 we replace individual educational attainment with individual reported income
ranked by quartiles; we retain the other aspects of the benchmark specification. Our key fiscal
results are qualitatively the same as those in Table 5. For both measures of fiscal exposure to
immigration, the interaction terms with all income quartiles are positive. For both fiscal
measures the estimate is largest and statistically significant for the highest income quartile. And
for Fiscal Exposure 1 the estimate is significant for the third quartile and marginally so for the
29 To further test the robustness of the correlation between fiscal exposure and policy opinions to the inclusion of additional control variables, we estimated a number of alternative specifications that added further measures of attitudes toward minority groups. In all specifications, the results were qualitatively similar to those reported in Table 7. In some specifications, the interaction terms between High School and Some College with the fiscal exposure variables were no longer significant at conventional levels but in all cases the interaction terms with the College variable were statistically and substantively significant.

27
second. Overall, these results are consistent with argument that respondents more exposed to the
tax and transfer consequences of immigration have more restrictionist immigration opinions.30
The final set of immigration results are in Table 9, where we explore our interpretation of the
key fiscal-exposure results. Our theoretical framework emphasized that the fiscal impact of
immigration may affect natives of all skill and income groups. But since most state tax and
transfer systems are at least somewhat progressive, the impact of immigration on net fiscal
transfers is likely to hit hardest the most-skilled, highest-income natives. Evidence consistent
with this argument has been presented in terms of the magnitude of the effect of fiscal exposure
across different skill (and, in Table 8, income) categories.
This interpretation can be bolstered by re-estimating our benchmark specifications on the
sub-sample of natives living in states with the most-progressive tax systems. We identify these
states with two measures. The first indicates all states with above-median values of the ratio of
the top income-tax rate to the bottom rate. The second indicates all states with above-median
values of the ratio of income tax revenue to total revenue. Based on our theoretical framework,
we expect that the pattern of estimates for the consequences of increasing fiscal exposure on
restrictionist immigration will be most clear in those states that match our theoretical assumption
of relatively progressive tax and transfer systems.
The results reported in Table 9 confirm this expectation, where we use our preferred Fiscal
Exposure 1. The most striking difference between these results and those in Table 5 for the full
sample is that the magnitude of the impact of living in a state with high fiscal exposure to
immigration is now much larger for these sub-samples of states with relatively progressive tax
systems. For example, for the model using our first measure of progressive states, moving a
high-school graduate from a state with low to high fiscal exposure to immigration raises the 30 These results employing income quartiles are also robust to including the additional control variables discussed in Table 7.

28
probability of favoring fewer immigrants by 15 percentage points—versus just 6 to 12
percentage points in the full-sample estimates of Table 5. For this same model, for college
graduates the impact of living in a state with high rather than low fiscal exposure is over 30
percentage points—versus about 20 percentage points in the full sample.
We also note that our interpretation of the key fiscal-exposure results is supported not just by
the larger substantive magnitudes for the sub-sample of progressive states. It is also supported
by the evidence in Table 9 that the differences across education categories are now larger than
before. The estimates in the final column of Table 9 are not just larger but even suggest a linear
progression in the magnitude of the effect of fiscal exposure, moving up the four education
groups from an estimated increase of 0 percentage points to 11, 19, and 33, respectively.
Beyond Tables 7 through 9, we verified the robustness of our central results to many other
checks (unreported for brevity). For example, we experimented with alternative measures of
state fiscal exposure to immigration, such as expanding our reported measures to account for
other researchers’ interpretation of state responses to the 1996 federal welfare reform.31 We
dropped individual states from our sample, in particular outlier immigration states shown in our
figures such as California and New York. We added a number of additional non-economic
individual characteristics that might help shape opinions, e.g., additional tolerance measures.32
31 Zimmerman and Tumlin (1999) categorize certain states that did not reverse federal welfare restrictions on immigrants set in the 1996 reforms, and thus post-1996 had welfare regimes that were less generous to immigrants than to natives. We re-created Fiscal Exposure 1 by removing from the group of above-median welfare generosity in 2000 states that Zimmerman and Tumlin categorized as non-reversers. 32 One additional robustness check used the fact that in 1992 the NES asked respondents about whether “Hispanic” or “Asian” immigrants raise taxes. We did not find clear evidence that responses to this question were correlated with our fiscal-exposure measures. This lack of correlation may be for a number of reasons. One is that our analysis omitted relevant state determinants because estimations with state fixed effects were not possible on just one year of data. Another is that the frame of each question specified a particular immigrant group, so that respondents may not have truthfully revealed their beliefs so as not to appear biased against minorities. It is important to note that for our argument that fiscal considerations influence opinion formation about immigration, it is not necessary that all individuals have a clear reasoned belief that immigration has fiscal consequences. Individuals may simply have summary opinions consistent with their interests that depend on their consumption of information in their social networks and from the media (see Scheve and Slaughter 2001a for further discussion about how individuals may form policy opinions consistent with their interests despite low levels of information, but see also Tomz 2004 for an alternative view).

29
The important result in Tables 5 through 9 is that fiscal exposure to immigration reduces
support for freer immigration and that this effect is strongest among the high-skilled/high-income
natives that pay a proportionately higher share of the fiscal costs. The magnitude of this fiscal
cleavage is comparable to the effects of skill itself, from which we conclude that public-finance
considerations are crucial in shaping opinions towards immigration policies.
5.2 Trade Policy Preferences
Table 10 reports our estimates of equation (3) for trade-policy preferences. Recall that based
on our theoretical framework, we expect trade opinions to depend on pre-tax labor-market
concerns but not on post-tax fiscal concerns. This is both because in theory trade does not have
the necessary fiscal consequences that immigration does by virtue of population changes, and in
practice because U.S. taxation and spending linked to trade policy is negligible.
The first two specifications in Table 10 are identical to Models I2 and I4 in Table 5 for
immigration, except now the new dependent variable measures trade-policy opinions. Because
these specifications measure state fiscal exposure to immigration, we do not expect to find any
correlation here between fiscal concerns and trade opinions. The final two specifications use
different fiscal measures that may be more relevant to possible fiscal impacts of trade. Fiscal
Exposure 3 is defined using just the first criterion of Fiscal Exposure 1; that is, it identifies states
with relatively high welfare generosity measured as above the national median welfare spending
per native. Fiscal Exposure 4 is the same as Fiscal Exposure 3 but scores states on welfare
spending divided by gross state product rather than number of natives. If state welfare programs
provide some insurance to the pre-tax income pressures generated by freer trade, then individuals
who feel they carry the burden of this welfare spending may be less inclined to support freer

30
trade. As with immigration, given the progressivity of state fiscal regimes this disinclination
may be strongest among the more-skilled, higher-income individuals.
The results across all four specifications in Table 10 replicate the findings in the literature
that more-skilled individuals are less likely to support further trade restrictions. For an
individual in a state with low fiscal impact, the coefficients for Model T1 imply that the
difference between a college graduate and high-school drop out in the probability of favoring
further trade restrictions is 0.37 (with a standard error of 0.05). This difference is identical for
residents in high fiscal impact states, and is robust across all alternative specifications. This
skills cleavage has been found by many others, and is consistent with the potential impact of
trade on pre-tax labor income being an important factor in opinion formation over trade policy.
More important for this paper’s focus on fiscal concerns, Table 10 shows no consistent
variation in opinions over trade policy across states based on their fiscal regimes. The
coefficients in Table 10 for interactions between the education variables and the fiscal-exposure
measures are generally small and imprecisely estimated. We expected this for Fiscal Exposure 1
and 2, but also find this for Fiscal Exposure 3 and 4. The only exception is a statistically
significant coefficient estimate on the interaction between College and Fiscal Exposure 4 but in
unreported results this particular finding was not very robust.
This lack of a clear correlation between trade opinions and fiscal considerations, along with
the opposite evidence for immigration in Tables 5 and 9, is consistent with our overall argument
that public-finance considerations appear to be crucial in shaping opinions towards alternative
globalization strategies. Where public-finance matters can bite directly—in our data, for
immigration but not trade—we see important impacts on individual opinions.

31
6. Conclusions
This paper has examined the influence of public finance on individual preferences towards
alternative globalization strategies. In the absence of distortionary tax and spending policies,
freer immigration and trade for a country would often be supported by similar groups thanks to
similar impacts on labor demand and thus labor income. But government policies that
redistribute income may alter the distributional politics. Immigrants may pay taxes and receive
public services. Imports, obviously, do neither of these. This suggests quite different political
coalitions may organize around trade and immigration.
In this paper we developed a framework for examining how pre-tax and post-tax cleavages
may differ across globalization strategies and also across fiscal jurisdictions. We then applied
this framework to the case of individual immigration and trade preferences across U.S. states.
The substantial variation both across states and over time in immigrant presence and welfare
eligibility allows a rich examination of theoretical predictions.
We generated two main empirical findings. First, high exposure to immigrant fiscal
pressures reduces support for freer immigration among natives, especially the more-skilled. The
magnitude of this post-tax fiscal cleavage is comparable to the pre-tax labor-market effects of
skill itself. Second, there is no public-finance variation in opinion over trade policy, consistent
with the data that U.S. trade policy has negligible fiscal-policy impacts.
The evidence in this paper suggests that public-finance considerations are crucial in shaping
opinions towards alternative globalization strategies. It is not just distributive politics in the
labor market that feature prominently for these opinions, as much recent work has investigated.
It is also distributive politics in the fiscal arena as well.
32
We think that this insight may shed light on a number of important questions in international
political economy. For example, even within the same policy domain the fiscal issues at stake
can vary greatly and account for differences in the politics observed in different contexts. U.S.
immigration policy was much more liberal a century ago than today. One source of this
difference may be that, unlike today, a century ago the United States had virtually no social
safety net. Fiscal considerations may also push in the opposite direction. In current immigration
debates in Europe, concern over social spending on immigrants is balanced against the need to
recruit workers whose tax payments could support state pension systems that face dangerous
shortfalls from significantly aging populations.
But the most interesting application of our framework may be to help explain why countries
choose different policy approaches toward different dimensions of international economic
integration. It is has long been recognized that many countries have chosen liberal trade but
restrictionist immigration policies. Perhaps even more striking is how liberal policies regulating
foreign investment are compared to both trade and immigration. The explanation for different
approaches no doubt involves many factors, but we think that future research examining the
fiscal consequences of policy alternatives may help account for voter preferences and their role
in explaining these policy combinations.

33
References
Baker, Andy. 2003. “Why is Trade Reform so Popular in Latin America?” World Politics 55 (April): 423-55. Beaulieu, Eugene. 2002. “Factor or Industry Cleavages in Trade Policy? An Empirical Test of the Stolper-Samuelson Theorem.” Economics and Politics Vol. 14 No. 2 (July):99-131. Borjas, George J. 1999a. Heaven’s Door: Immigration Policy and the American Economy. Princeton, N.J.: Princeton University Press. Borjas, George J. 1999b. “The Economic Analysis of Immigration.” In Orley C. Ashenfelter and David Card, eds., Handbook of Labor Economics, Amsterdam: North-Holland, pp. 1697-1760. Borjas, George J. 2003. “Welfare Reform, Labor Supply, and Health Insurance in the Immigrant Population.” National Bureau of Economic Research Working Paper #9781. Borjas, George J., Richard B. Freeman, and Lawrence F. Katz. 1997. "How Much Do Immigration and Trade Affect Labor Market Outcomes?" Brookings Papers on Economic Activity 1: 1-90. Borjas, George J., and Lynette Hilton. 1996. “Immigration and the Welfare State: Immigrant Participation in Means-Tested Entitlement Programs,” Quarterly Journal of Economics, 111(2), pp. 575-604. Card, David. 2001. “Immigrant Inflows, Native Outflows, and the Local Labor Market Impacts of Higher Immigration.” Journal of Labor Economics, 19 (1): 22-64. Citrin, Jack, Donald Green, Christopher Muste, and Cara Wong. 1997. "Public Opinion Toward Immigration Reform: The Role of Economic Motivation." The Journal of Politics 59 (3): 858-81. Feenstra, Robert C. (ed). 2000. The Impact of International Trade On Wages. Chicago: The University of Chicago Press. Feenstra, Robert C., and Gordon H. Hanson. 2002. “Global Production and Inequality: A Survey of Trade and Wages,” in James Harrigan (ed.) Handbook of International Trade, Basil Blackwell. Fix, Michael, and Jeffrey Passel. 1999. “Trends in Citizens’ and Noncitizens’ Use of Public Benefits Following Welfare Reform, 1994-1997.” Washington, DC: The Urban Institute. Fix, Michael, and Jeffrey Passel. 2002. “The Scope and Impact of Welfare Reform’s Immigrant Provisions.” Washington, DC: The Urban Institute.

34
Hainmueller, Jens, and Michael J. Hiscox. 2004a. “Educated Preferences: Explaining Attitudes Toward Immigration in Europe.” Paper prepared for presentation at the Annual Meeting of the American Political Science Association. Hainmueller, Jens, and Michael J. Hiscox. 2004b. “Learning to Love Globalization: The Effects of Education on Individual Attitudes Toward International Trade.” Harvard University Mimeo. Hanson, Gordon H. and Matthew J. Slaughter. 2002. “Labor-Market Adjustment in Open Economies: Evidence from U.S. States,” Journal of International Economics, 57 (1), pp. 3-29. Hays, Jude, Sean Ehrlich, and Clint Peinhardt. Forthcoming. “Government Spending and Public Support for Trade in the OECD: An Empirical Test of the Embedded Liberalism Thesis.” International Organization. International Monetary Fund. 2004. Government Finance Statistics. Washington, D.C. Kessler, Alan. 2001. “Immigration, Economic Insecurity, and the “Ambivalent” American Public.” Working Paper No. 41. Center for Comparative Immigration Studies, UCSD. Jain, Sanjay, Devesh Kapur, and Sharun Mukand. 2004. “Outsourcing and International Labor Mobility: A Political Economy Analysis.” Paper presented at the Institute for World Economics, Kiel, Germany.
Kletzer, Lori, and Robert Litan. 2001. “A Prescription to Relieve Worker Anxiety.” Policy Brief #01-2, Washington, D.C: Institute for International Economics.
Mayda, Anna Marie. 2004. “Who is Against Immigration?: A Cross-Country Investigation of Individual Attitudes toward Immigrants.” Mimeograph. Mayda, Anna Marie, and Dani Rodrik. 2002. “Why Are Some People (and Countries) More Protectionist Than Others?” NBER Working Paper No. 8461. O’Rourke, Kevin, and Richard Sinnott. 2001. “The Determinants of Individual Trade Policy Preferences: International Survey Evidence.” In Brookings Trade Forum: 2001, Collins, S. M. and Rodrik, D. (eds.). Washington, D.C.: Brookings. O’Rourke, Kevin, and Richard Sinnott. 2003. “Migration Flows: Political Economy of Migration and the Empirical Challenges.” Working Paper. Rodrik, Dani. 1997. Has Globalization Gone Too Far? Washington, DC: Institute for International Economics. Rodrik, Dani. 1998. “Why Do More Open Economies Have Bigger Governments?” Journal of Political Economy Vol. 106 No. 5:997-1032.

35
Sapiro, Virginia, Steven J. Rosenstone, Warren E. Miller, and the National Election Studies. 1998. American National Election Studies, 1948-1997 [CD-ROM]. ICPSR ed. Ann Arbor, MI: Inter-university Consortium for Political and Social Research [producer and distributor]. Scheve, Kenneth F., and Matthew J. Slaughter. 2001a. Globalization and the Perceptions of American Workers. Washington DC: Institute for International Economics. Scheve, Kenneth F., and Matthew J. Slaughter. 2001b. "What Determines Individual Trade-Policy Preferences." Journal of International Economics, Vol. 54 No. 2 (August):267-292. Scheve, Kenneth F., and Matthew J. Slaughter. 2001c. "Labor-Market Competition and Individual Preferences Over Immigration Policy." Review of Economics and Statistics, Vol. 83 No. 1 (February):133-145. Scheve, Kenneth F. and Matthew J. Slaughter. 2004. “Economic Insecurity and the Globalization of Production.” American Journal of Political Science Vol. 48 No. 4 (October). Scheve, Kenneth F. and Matthew J. Slaughter. Forthcoming. “Public Opinion, International Integration, and the Welfare State.” In Samuel Bowles, Pranab Bardhan, and Michael Wallerstein (eds.) Globalization and Egalitarian Redistribution. Princeton, NJ: Princeton University Press. Smith, J.P. and Edmonston, B (eds.). 1997. The New Americans: Economic Demographic, and Fiscal Effects of Immigration. National Academy Press: Washington, D.C. Stolper, Wolfgang, and Paul Samuelson. 1941. “Protection and Real Wages.” Review of Economic Studies 9: 58-73. Tomz, Michael. 2004. “Interests, Information, and the Domestic Politics of International Agreements.” Stanford University Mimeo. United States Trade Representative. 2003. “Revenue Implications of Trade Liberalization: Communication from the United States.” Communication to World Trade Organization, dated April 10. Zimmermann, Wendy, and Karen Tumlin. 1999. “Patchwork Policies: State Assistance for Immigrants under Welfare Reform.” The Urban Institute Occasional Paper Number 24.

36
Share of State Population in Immigrant Headed Households
Imm
igra
nt S
hare
200
0
Immigrant Share 19900 .1 .2 .3 .4
0
.1
.2
.3
.4
Ohio
Florida
MassachuArizona
District
WyomingIndiana
Texas
Maryland
North Da
New Hamp
Arkansas
Illinois
KentuckySouth Da
Hawaii
New York
West Vir
Michigan
Delaware
Colorado
Mississi
North CaNebraska
Georgia
Tennesse
Washingt
Wisconsi
Utah
Rhode isConnecti
Californ
New Jers
Missouri
Virginia
KansasMinnesot
Alabama
IdahoAlaska
Nevada
Maine
New MexiOregon
MontanaVermont
Pennsylv
South CaOklahomaLouisianIowa
Figure 1
Immigrant Population Growth minus Native Population Growth, 1990-2000
Rel
ativ
e Im
mig
rant
Pop
. Gro
wth
Immigrant Population Share 19900 .1 .2 .3
0
.1
.2
.3
.4
.5
.6
.7
.8
.9
1
Ohio
Florida
Massachu
Arizona
DistrictWyoming
IndianaTexas
MarylandNorth Da
New Hamp
Arkansas
Illinois
Kentucky
South Da
HawaiiNew YorkWest Vir
Michigan
Delaware
Colorado
Mississi
North Ca
Nebraska
Georgia
Tennesse
Washingt
Wisconsi
Utah
Rhode isConnecti
CalifornNew Jers
Missouri Virginia
Kansas
MinnesotAlabama
Idaho
Alaska
Nevada
Maine
New Mexi
Oregon
Montana
Vermont
Pennsylv
South Ca
Oklahoma
Louisian
Iowa
Figure 2
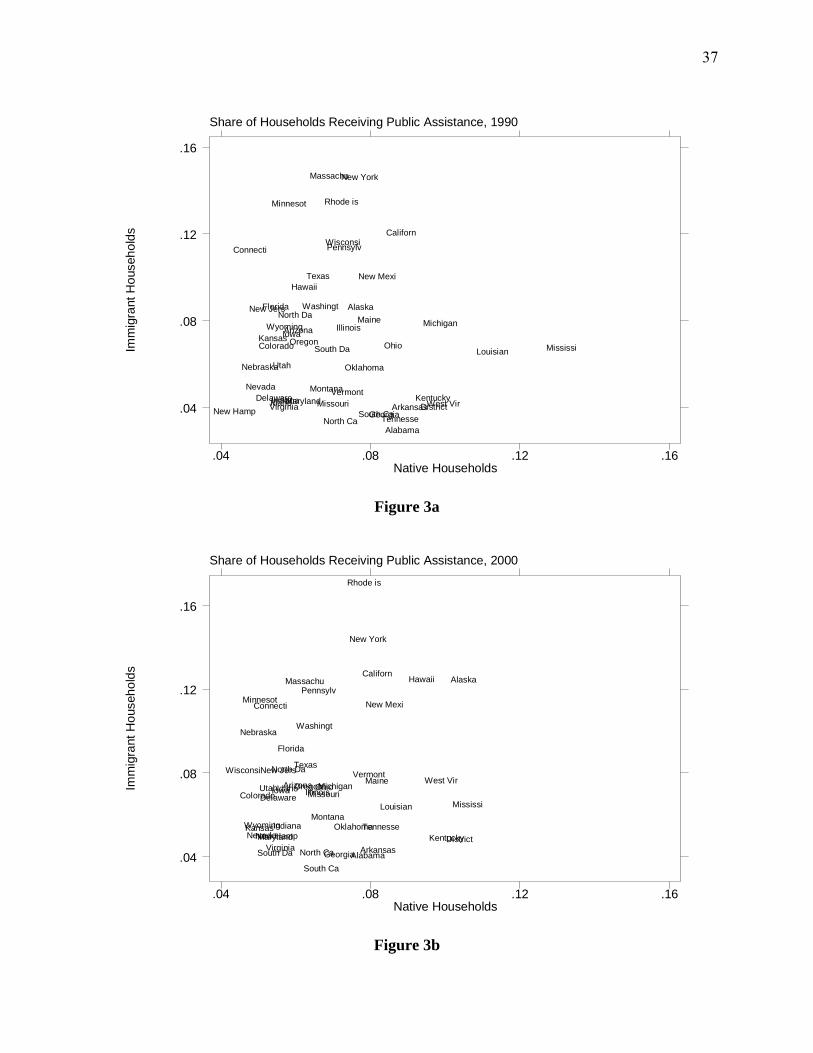
37
Share of Households Receiving Public Assistance, 1990
Imm
igra
nt H
ouse
hold
s
Native Households.04 .08 .12 .16
.04
.08
.12
.16
South CaIndiana
Nevada
Idaho
Washingt
Michigan
Rhode is
TennesseVirginia Arkansas
Alaska
Alabama
Massachu
Georgia
New Jers
UtahNebraska
Arizona
Colorado
Pennsylv
District
Ohio
Californ
North Ca
Kentucky
Wyoming Illinois
New Hamp
Hawaii
North Da
New Mexi
Florida
Wisconsi
Oklahoma
Kansas
New York
VermontDelaware
Minnesot
Oregon
Maine
MissouriMaryland
Texas
South Da
Connecti
Iowa
Montana
MississiLouisian
West Vir
Figure 3a
Share of Households Receiving Public Assistance, 2000
Imm
igra
nt H
ouse
hold
s
Native Households.04 .08 .12 .16
.04
.08
.12
.16
Ohio
Florida
Massachu
Arizona
DistrictWyomingIndiana
Texas
Maryland
North Da
New HampArkansas
Illinois
Kentucky
South Da
Hawaii
New York
West VirMichigan
DelawareColoradoMississi
North Ca
Nebraska
Georgia
Tennesse
Washingt
Wisconsi
Utah
Rhode is
Connecti
Californ
New Jers
Missouri
Virginia
Kansas
Minnesot
Alabama
Idaho
Alaska
Nevada
Maine
New Mexi
Oregon
Montana
Vermont
Pennsylv
South Ca
Oklahoma
Louisian
Iowa
Figure 3b

38
1990
Imm
HH
s on
Wel
fare
/ Nat
ive
HH
s
Immigrant HHs / Native HHs0 .1 .2 .3 .4
0
.01
.02
.03
.04
.05
Connecti
Nevada
IdahoK ansasUtahNorth Ca
ColoradoMichigan
A rkansasIowaTennesse
Mary landOregon
K entucky
Rhode is
GeorgiaA labamaOhio
Massachu
Ill inois
S outh CaNew Hamp
W est V irW yoming
P ennsylv
Louisian
New Mexi
New Y ork
Delaware
Distric tV irginia
New Jers
NebraskaMiss issi
A laska
Californ
Florida
Haw aii
OklahomaW isconsi
North Da
W ashingt
V ermontMissouri
Minnesot
Indiana
A rizona
MontanaMaine
S outh Da
Texas
Figure 4a
2000
Imm
HH
s on
Wel
fare
/ Nat
ive
HH
s
Immigrant HHs / Native HHs0 .1 .2 .3 .4
0
.01
.02
.03
.04
.05
Oregon
K ansas
New Y ork
A rkansas
Texas
North DaV ermont
Colorado
Haw aii
GeorgiaNebraska
K entuckyNorth CaW yoming
NevadaIll inois
New Jers
OklahomaMissouriIdaho
Rhode is
S outh Ca
Distric t
Iowa
Californ
Utah
S outh DaNew Hamp
A labamaIndiana
P ennsylv
FloridaMassachu
W ashingt
A laska
V irginiaLouisian
Minnesot
New Mexi
MaineDelaware
OhioW est V ir
Connecti
MichiganW isconsi
MontanaMiss issiTennesse
Mary land
A rizona
Figure 4b

39
Table 1: Support for Decreased Immigration by Education
No High High Some College School School College Graduate Total
0.541 0.568 0.500 0.386 0.503
Table 2: Support for Trade Restrictions by Education
No High High Some College School School College Graduate Total
0.722 0.706 0.588 0.394 0.591
Notes: Table 1 reports the fraction of native-born individuals reporting that they would prefer immigration to be decreased (by a little or by a lot) in the NES surveys for 1992 and 2000. Table 2 reports the fraction of native-born individuals reporting support for trade restrictions also for 1992 and 2000. No high school refers to those with less than 12 years of education, high school refers to those with 12 years of education, some college to those with 13-15 years of education, and college graduates to those with 16 or more years of education. Summary statistics are calculated using the NES sampling weights.

40
Table 3: Support for Decreased Immigration by Education and Fiscal Exposure to Immigrants
Fiscal Exposure
Measure Fiscal Exposure No High School
High School
Some College
College Graduate
Fiscal Exposure 1 Low 0.537 0.571 0.507 0.362
High 0.625 0.558 0.461 0.420
Fiscal Exposure 2 Low 0.498 0.572 0.516 0.361 High 0.658 0.557 0.464 0.435
Table 4: Support for Trade Restrictions
by Education and Fiscal Exposure to Immigrants
Fiscal Exposure Measure Fiscal Exposure
No High School
High School
Some College
College Graduate
Fiscal Exposure 1 Low 0.748 0.719 0.590 0.383
High 0.662 0.674 0.560 0.418
Fiscal Exposure 2 Low 0.728 0.719 0.606 0.392 High 0.707 0.674 0.548 0.397
Notes: Table 3 reports the fraction of native-born individuals reporting that they would prefer immigration to be decreased (by a little or by a lot) in the NES surveys for 1992 and 2000. Table 4 reports the fraction of native-born individuals reporting support for trade restrictions also for 1992 and 2000. States with high immigrant welfare costs have values of Fiscal Exposure 1 (or Fiscal Exposure 2) equal to 1. No high school refers to those with less than 12 years of education, high school refers to those with 12 years of education, some college to those with 13-15 years of education, and college graduates to those with 16 or more years of education. Summary statistics are calculated using the NES sampling weights.

41
Table 5: Immigration-Policy Preferences, Benchmark Specifications Fiscal Exposure 1 Fiscal Exposure 2 Model I1 Model I2 Model I3 Model I4 High School 0.182 0.168 0.211 0.206 (0.101) (0.107) (0.095) (0.103) 0.071 0.118 0.027 0.046 Some College 0.047 0.027 0.102 0.092 (0.097) (0.098) (0.100) (0.104) 0.626 0.783 0.309 0.379 College -0.347 -0.356 -0.298 -0.295 (0.119) (0.130) (0.116) (0.127) 0.004 0.006 0.011 0.020 No High School * Immigration 0.445 0.474 0.365 0.667 (0.141) (0.173) (0.257) (0.270) 0.002 0.006 0.155 0.014 High School * Immigration -0.016 0.034 -0.012 0.248 (0.117) (0.136) (0.122) (0.140) 0.889 0.802 0.920 0.077 Some College * Immigration -0.098 -0.033 -0.143 0.116 (0.094) (0.097) (0.088) (0.151) 0.297 0.734 0.105 0.439 College * Immigration -0.078 -0.016 -0.183 0.043 (0.111) (0.128) (0.115) (0.165) 0.480 0.900 0.112 0.796 No High School * Fiscal Exposure (1 or 2) -0.090 0.246 0.102 0.189 (0.200) (0.169) (0.264) (0.259) 0.652 0.147 0.698 0.465 High School * Fiscal Exposure (1 or 2) -0.008 0.303 -0.011 0.144 (0.141) (0.130) (0.137) (0.136) 0.954 0.020 0.936 0.288 Some College * Fiscal Exposure (1 or 2) -0.036 0.237 -0.003 0.138 (0.089) (0.109) (0.082) (0.110) 0.686 0.030 0.974 0.211 College * Fiscal Exposure (1 or 2) 0.219 0.490 0.347 0.526 (0.118) (0.145) (0.127) (0.117) 0.063 0.001 0.006 0.000 State Fixed Effects No Yes No Yes Baseline Control Variables Yes Yes Yes Yes Observations 2,978 2,978 3,117 3,117 Log-likelihood -2,021.13 -1,995.44 -2,115.0 -2,088.7 Notes: This table reports coefficient estimates for probit regressions on native individuals from the 1992 and 2000 NES surveys. The dependent variable is Immigration Opinion, equal to one for respondents who support further restricting immigration and zero otherwise. The baseline control variables are Age, Age Squared, Female, Hispanic, State Unemployment, a year indicator variable for 2000, and a constant. Each cell reports a coefficient estimate, a state-clustered robust standard error in parentheses, and a p-value. Observations are weighted using sampling weights from the NES data.

42
Table 6: Estimated Effect of Increasing Fiscal Exposure to Immigration on the Probability of Supporting Immigration Restrictions
Fiscal Exposure Measure Education Level
Change in Probability of Supporting Immigration
Restrictions
Fiscal Exposure 1 No High School 0.097 (0.066) High School 0.119 (0.050) Some College 0.094 (0.043) College 0.189 (0.053)
Fiscal Exposure 2 No High School 0.075 (0.102) High School 0.057 (0.054) Some College 0.055 (0.044) College 0.202 (0.042)
Notes: Based on the estimates from Model I2 and I4, this table reports the consequences for the probability of supporting immigration restrictions of changing from a state in which fiscal exposure to immigration is low (Fiscal Exposure 1 or 2 equals 0) to a state in which it is high (Fiscal Exposure 1 or 2 equals 1) for individuals at different skill levels. The standard error of this estimate is reported in parentheses.

43
Table 7: Immigration-Policy Preferences, Additional Control Variables Fiscal Exposure 1 Fiscal Exposure 2 Model I5 Model I6 High School 0.142 0.146 (0.159) (0.152) Some College -0.022 -0.006 (0.150) (0.142) College -0.304 -0.289 (0.169) (0.160) No High School * Immigration 0.507 0.662 (0.234) (0.374) High School * Immigration 0.038 0.238 (0.171) (0.172) Some College * Immigration -0.019 0.167 (0.106) (0.157) College * Immigration -0.133 -0.024 (0.112) (0.155) No High School * Fiscal Exposure (1 or 2) 0.273 0.287 (0.264) (0.355) High School * Fiscal Exposure (1 or2) 0.331 0.276 (0.144) (0.136) Some College * Fiscal Exposure (1 or 2) 0.222 0.182 (0.134) (0.094) College * Fiscal Exposure (1 or 2) 0.529 0.603 (0.144) (0.131) Unemployed -0.281 -0.271 (0.145) (0.143) Union Member 0.165 0.164 (0.108) (0.107) Government Employee -0.015 -0.006 (0.065) (0.062) Partisanship 0.030 0.032 (0.017) (0.017) Ideology 0.046 0.050 (0.024) (0.024) Tolerance -0.044 -0.052 (0.022) (0.023) Isolationism 0.461 0.463 (0.066) (0.065) State Fixed Effects Yes Yes Baseline Control Variables Yes Yes Observations 2,201 2,277 Log-likelihood -1,419.25 -1,463.65 Notes: This table reports coefficient estimates for probit regressions on native individuals from the 1992 and 2000 NES surveys. The dependent variable is Immigration Opinion, equal to one for respondents who support further restricting immigration and zero otherwise. The baseline control variables are Age, Age Squared, Female, Hispanic, State Unemployment, a year indicator variable for 2000, and a constant. Each cell reports a coefficient estimate and a state-clustered robust standard error in parentheses. Observations are weighted using sampling weights from the NES data.
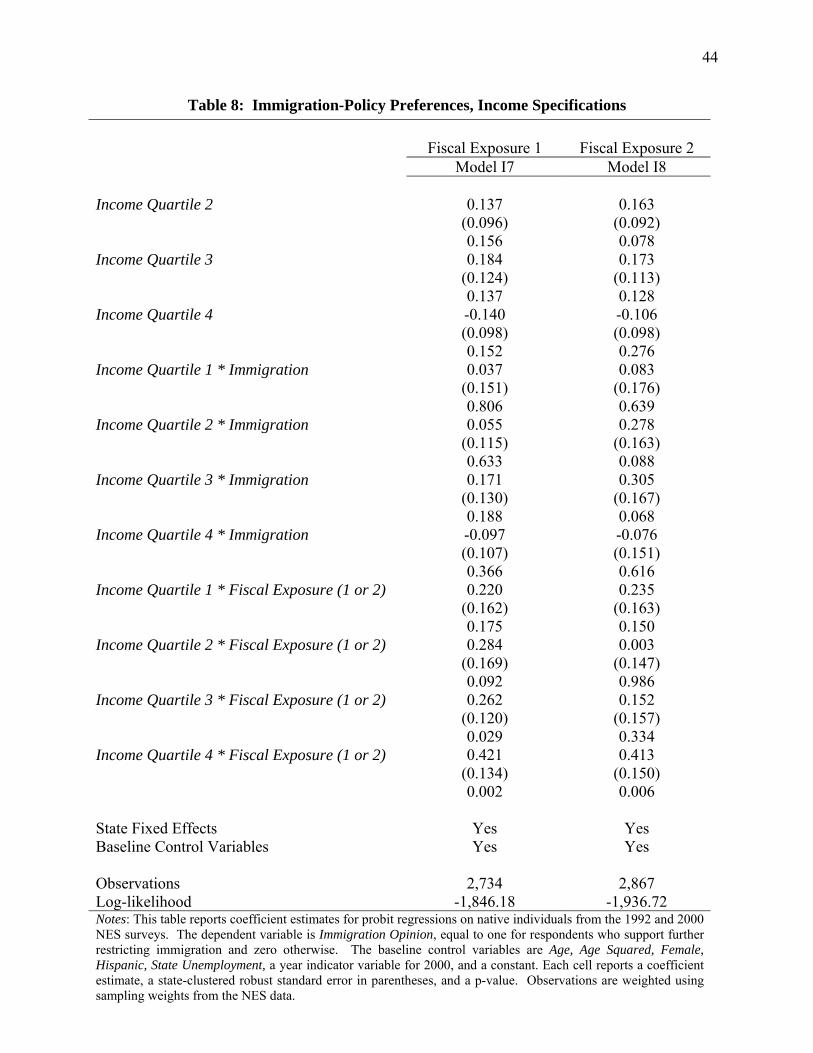
44
Table 8: Immigration-Policy Preferences, Income Specifications Fiscal Exposure 1 Fiscal Exposure 2 Model I7 Model I8 Income Quartile 2 0.137 0.163 (0.096) (0.092) 0.156 0.078 Income Quartile 3 0.184 0.173 (0.124) (0.113) 0.137 0.128 Income Quartile 4 -0.140 -0.106 (0.098) (0.098) 0.152 0.276 Income Quartile 1 * Immigration 0.037 0.083 (0.151) (0.176) 0.806 0.639 Income Quartile 2 * Immigration 0.055 0.278 (0.115) (0.163) 0.633 0.088 Income Quartile 3 * Immigration 0.171 0.305 (0.130) (0.167) 0.188 0.068 Income Quartile 4 * Immigration -0.097 -0.076 (0.107) (0.151) 0.366 0.616 Income Quartile 1 * Fiscal Exposure (1 or 2) 0.220 0.235 (0.162) (0.163) 0.175 0.150 Income Quartile 2 * Fiscal Exposure (1 or 2) 0.284 0.003 (0.169) (0.147) 0.092 0.986 Income Quartile 3 * Fiscal Exposure (1 or 2) 0.262 0.152 (0.120) (0.157) 0.029 0.334 Income Quartile 4 * Fiscal Exposure (1 or 2) 0.421 0.413 (0.134) (0.150) 0.002 0.006 State Fixed Effects Yes Yes Baseline Control Variables Yes Yes Observations 2,734 2,867 Log-likelihood -1,846.18 -1,936.72 Notes: This table reports coefficient estimates for probit regressions on native individuals from the 1992 and 2000 NES surveys. The dependent variable is Immigration Opinion, equal to one for respondents who support further restricting immigration and zero otherwise. The baseline control variables are Age, Age Squared, Female, Hispanic, State Unemployment, a year indicator variable for 2000, and a constant. Each cell reports a coefficient estimate, a state-clustered robust standard error in parentheses, and a p-value. Observations are weighted using sampling weights from the NES data.

45
Table 9: Immigration-Policy Preferences, Benchmark Specifications in States with Relatively Progressive Tax Systems
Progressive Tax
System Measure 1 Progressive Tax
System Measure 2 Fiscal Exposure Measure Model I2 Model I2
No High School * Fiscal Exposure 1 0.285 -0.229 (0.235) (0.299) 0.224 0.444 High School * Fiscal Exposure 1 0.382 0.290 (0.150) (0.219) 0.011 0.185 Some College * Fiscal Exposure 1 0.315 0.477 (0.056) (0.144) 0.000 0.001 College * Fiscal Exposure 1 0.803 0.905 (0.064) (0.104)
0.000 0.000
Education Variables Yes Yes Education * Immigration Variables Yes Yes State Fixed Effects Yes Yes Baseline Control Variables Yes Yes Observations 1,293 1,752 Log-likelihood -857.36 -1,161.03 Notes: This table reports coefficient estimates for probit regressions on native individuals in states with relatively progressive tax systems from the 1992 and 2000 NES surveys. Progressive Tax System Measure 1 is all states with above median values of the ratio of the top income tax rate to the bottom rate. Progressive Tax System Measure 2 is all states with above median values of the ratio of income tax revenue to total revenue. The dependent variable is Immigration Opinion, equal to one for respondents who support further restricting immigration and zero otherwise. The baseline control variables are Age, Age Squared, Female, Hispanic, State Unemployment, a year indicator variable for 2000, and a constant. Each cell reports a coefficient estimate, a state-clustered robust standard error in parentheses, and a p-value. Observations are weighted using sampling weights from the NES data.

46
Table 10: Trade-Policy Preferences
Fiscal Exposure Measure 1 2 3 4 Model T1 Model T2 Model T3 Model T4 High School -0.111 -0.020 -0.074 -0.033 (0.121) (0.123) (0.151) (0.161) 0.360 0.869 0.623 0.837 Some College -0.390 -0.267 -0.268 -0.263 (0.133) (0.146) (0.138) (0.143) 0.003 0.067 0.053 0.066 College -0.971 -0.849 -0.908 -0.946 (0.132) (0.128) (0.163) (0.143) 0.000 0.000 0.000 0.000 No High School * Fiscal Exposure (1-4) -0.367 0.232 0.004 0.245 (0.264) (0.360) (0.306) (0.275) 0.165 0.519 0.989 0.373 High School * Fiscal Exposure (1-4) -0.228 0.132 -0.021 0.160 (0.132) (0.196) (0.238) (0.189) 0.084 0.500 0.928 0.398 Some College * Fiscal Exposure (1-4) -0.221 0.111 -0.173 0.064 (0.148) (0.188) (0.236) (0.179) 0.135 0.553 0.462 0.719 College * Fiscal Exposure (1-4) -0.046 0.223 0.045 0.376 (0.161) (0.193) (0.259) (0.164) 0.773 0.249 0.863 0.022 State Fixed Effects Yes Yes Yes Yes Baseline Control Variables Yes Yes Yes Yes Observations 2,297 2,401 2,297 2,297 Log-likelihood -1,379.76 -1,447.92 -1,380.17 -1,377.77 Notes: This table reports coefficient estimates for probit regressions on native individuals from the 1992 and 2000 NES surveys. The dependent variable is Trade Opinion. The baseline control variables are Age, Age Squared, Female, Hispanic, State Unemployment, a year indicator variable for 2000, and a constant. Each cell reports a coefficient estimate, a state-clustered robust standard error in parentheses, and a p-value. Observations are weighted using sampling weights from the NES data.