cut-off values for gait variables to detect forelimb
TRANSCRIPT

Purdue UniversityPurdue e-Pubs
Open Access Theses Theses and Dissertations
Summer 2014
Cut-Off Values For Gait Variables To DetectForelimb Lameness In Individual DogsJennifer G. CarrPurdue University
Follow this and additional works at: https://docs.lib.purdue.edu/open_access_theses
Part of the Veterinary Medicine Commons
This document has been made available through Purdue e-Pubs, a service of the Purdue University Libraries. Please contact [email protected] foradditional information.
Recommended CitationCarr, Jennifer G., "Cut-Off Values For Gait Variables To Detect Forelimb Lameness In Individual Dogs" (2014). Open Access Theses.410.https://docs.lib.purdue.edu/open_access_theses/410

01 14
PURDUE UNIVERSITY GRADUATE SCHOOL
Thesis/Dissertation Acceptance
Thesis/Dissertation Agreement.Publication Delay, and Certification/Disclaimer (Graduate School Form 32)adheres to the provisions of
Department
Jennifer G. Carr
CUT-OFF VALUES FOR GAIT VARIABLES TO DETECT FORELIMB LAMENESS ININDIVIDUAL DOGS
Master of Science
Gert J. Breur
Nicolaas E. Lambrechts
Hsin-Yi Weng
Gert J. Breur
Stephen B. Adams 6/30/2014

i
CUT-OFF VALUES FOR GAIT VARIABLES TO DETECT FORELIMB LAMENESS
IN INDIVIDUAL DOGS
A Thesis
Submitted to the Faculty
of
Purdue University
by
Jennifer G. Carr
In Partial Fulfillment of the
Requirements for the Degree
of
Master of Science
August 2014
Purdue University
West Lafayette, Indiana

ii
This thesis is dedicated to all of my mentors in the Small Animal Surgery and Neurology
Department with special thanks to Dr. Gert Breur.

iii
TABLE OF CONTENTS
Page
LIST OF ABBREVIATIONS............................................................................................... iv
ABSTRACT........................................................................................................................... v
CHAPTER 1. INTRODUCTION......................................................................................... 1
CHAPTER 2. REVIEW........................................................................................................ 6
CHAPTER 3. CUT-OFF VALUES FOR DETERMINING LAMENESS.......................... 26
Introduction............................................................................................................................ 26
Materials and Methods........................................................................................................... 30
Results.................................................................................................................................... 33
Discussion..............................................................................................................................35
CHAPTER 4. CONCLUSIONS, SIGNIFICANCE, FUTURE DIRECTIONS................... 49
APPENDIX............................................................................................................................ 52
VITA...................................................................................................................................... 56
iv
LIST OF ABBREVIATIONS
OGA = Observational Gait Analysis
IGA = Instrumented Gait Analysis
PVF = Peak Vertical Force
VI = Vertical Impulse
SI = Symmetry Index
CV = Coefficient of Variation
ROM = Range of Motion

v
ABSTRACT
Carr, Jennifer G. M.S., Purdue University, August 2014. Cut-off Values for Gait
Variables to Detect Forelimb Lameness in Individual dogs. Major Professor: Gert Breur.
The objective of this study was to characterize kinetic and kinematic variables in dogs
with forelimb lameness and determine lameness cut-off values of gait variables using
ROC analysis with observational gait analysis (OGA) as reference. Twenty client-owned
dogs with unilateral lameness were included. Dogs underwent orthopedic exam,
including OGA, and instrumented gait analysis (IGA; kinetic and kinematic analysis).
Kinetic variables with the highest accuracy were PVF and %WD with an area under the
curve (AUC) of 0.73 and 0.92, respectively. Optimal cut-off value for PVF and %WD
were ≤ 10.6 kgf (sensitivity 70% and specificity 75%) and ≤ 29.7% (sensitivity 90% and
specificity 85%), respectively. Results of the ROC analysis indicate that KVs were most
useful in determining lameness.

1
CHAPTER 1: INTRODUCTION
Lameness probably is the most common clinical manifestation of canine musculoskeletal
conditions and therefore recognition of lameness is an essential part of the diagnostic
process for canine orthopedic diseases.1,2
Lameness may be defined as an abnormality of
gait caused by nociceptive stimuli originating from the affected limb or restricted
movement within the affected limb and is almost always caused by musculoskeletal
pathology.1,3
Lameness must be differentiated from abnormal gait caused by pathology of
the neurological system.
Two major techniques have been employed to detect lameness in dogs: observational gait
analysis (OGA) and instrumented gait analysis (IGA). Gait is most commonly evaluated
by an observer (OGA). With OGA, lameness is described in terms of visual changes
including: decreased loading of the affected limb and shifting of the load to the
unaffected limbs, decreased length of the swing phase, decreased duration of the stance
phase, and alterations in joint angle.1,2
However, subtle visual changes are difficult to
discern and it is not known how much deviation from normal is needed to denote
lameness. In addition, OGA is susceptible to observer prejudice, for instance following
surgery or treatment where an improved outcome is expected.2 Unfortunately, it is almost
impossible to completely eliminate this form of bias.4 Several techniques have been

2
employed to make observational gait analysis more objective, such as lameness scoring
rubrics, the use of more than one observer, making videos for more than one observer to
evaluate, and visual analog scales.4-7
Regardless, observational gait analysis remains a
subjective technique of evaluating gait.
Instrumented gait analysis (IGA) may be used as a way to quantify and objectively
define lameness in dogs.8,9
Because gait analysis equipment has become more easily
available, the use of IGA as a way to systematically measure normal and abnormal gait
patterns in dogs has gained popularity in the last decades.3 With IGA, lameness mostly
has been defined as a decrease of the peak vertical force (PVF) of the affected limb.4,10
Derivatives of PVF also have been suggested as indicators of lameness: vertical impulse
(VI), PVF normalized for body weight (%PVF), dynamic weight distribution (%WD), L-
R symmetry indices (SI), rate of loading and unloading, and Fourier analysis.10-12
However, just as with OGA, criteria that denote lameness have not been well defined. In
most canine IGA studies, gait variables of a group of experimental dogs is compared with
gait variables of a control group, carefully matched for body weight and breed.11,13
A
statistically significant difference between the two groups may then signify improvement
or deterioration of gait, but not necessarily lameness. However, in a clinical setting, it is
unpractical to determine lameness with group comparisons and the interest is in
determining lameness in individual dogs. Several approaches to discriminate lame from
non-lame individual dogs of different body weight, body size and body shape have been
proposed, including normalization of gait variables (dynamic similarity), establishing cut-
of values using receiver operating characteristics (ROC) analysis, and defining lameness

3
using normal values of gait variables. However, as of yet, none of these approaches has
resulted in robust criteria to detect lameness in dogs.
The purpose of the research in this thesis is to characterize kinetic and kinematic
variables in dogs with forelimb lameness, and to compare the obtained variables to a set
of established normal ranges.

4
References
1. Sumner Smith G. Gait analysis and orthopedic examination. In: Textbook of Small
Animal Surgery.Vol 2. 2nd ed. Philadelphia: W.B. Saunders; 1993:1577–1586.
2. Newton CD, Nunamaker DM. Normal and Abnormal gait. In: Textbook of small
animal orthopaedics. Philadelphia: Lippincott; 1985: 1 - 11.
3. Alshehabat M.A. Instrumented Gait Analysis to Characterize Pelvic Limb Ataxia in
Dogs. 2012.
4. Quinn MM, Keuler NS, Lu Y, et al. Evaluation of agreement between numerical rating
scales, visual analogue scoring scales, and force plate gait analysis in dogs. Vet Surg
2007;36:360–367.
5. Waxman AS, Robinson DA, Evans RB, et al. Relationship between objective and
subjective assessment of limb function in normal dogs with an experimentally induced
lameness. Vet Surg 2008;37:241–246.
6. Kaler J, Wassink GJ, Green LE. The inter- and intra-observer reliability of a
locomotion scoring scale for sheep. Vet J 1997;180:189–194.
7. Voss K, Imhof J, Kaestner S, et al. Force plate gait analysis at the walk and trot in dogs
with low-grade hindlimb lameness. Vet Surg 2007;20:299–304.
8. Marsolais GS, McLean S, Derrick T, et al. Kinematic analysis of the hind limb during
swimming and walking in healthy dogs and dogs with surgically corrected cranial
cruciate ligament rupture. J Am Vet Med Assoc 2003;222:739–743.

5
9. Drüen S, Böddeker J, Meyer-Lindenberg A, et al. Computer-based gait analysis of
dogs: Evaluation of kinetic and kinematic parameters after cemented and cementless total
hip replacement. Vet Comp Orthop Traumatol 2012;25:375-384.
10. Budsberg SC, Jevens DJ, Brown J, et al. Evaluation of limb symmetry indices, using
ground reaction forces in healthy dogs. Am J Vet Res 1993;54:1569–74.
11. Torres BT, Moëns NMM, Al-Nadaf S, et al. Comparison of overground and
treadmill-based gaits of dogs. Am J Vet Res 2013;74:535–541.
12. Kim J, Kazmierczak KA, Breur GJ. Comparison of temporospatial and kinetic
variables of walking in small and large dogs on a pressure-sensing walkway. Am J Vet
Res 2011;72:1171–1177.
13. Sanchez-Bustinduy M, de Medeiros MA, Radke H, et al. Comparison of kinematic
variables in defining lameness caused by naturally occurring rupture of the cranial
cruciate ligament in dogs. Vet Surg 2010;39:523–530.

6
CHAPTER 2: REVIEW
Gait has been defined as a sequence of movements which propel an animal forward.1 A
full repetitive movement or gait cycle includes both a swing and stance phase of a
particular body segment or body segments. In dogs, normal gait can be divided into
symmetric and asymmetric gaits.2,3
Normal symmetric gaits include the walk, trot, amble
and pace. These are called symmetric because the movements of the left and right side of
the animal are a temporo-spatial mirror of each other in terms of movement of joints and
placement of limbs. However, even in normal dogs with a symmetric gait, there is usually
mild asymmetry of forces, timing, and joint angles. 4-6
If, during a gait the movement of
the right and left side of the body do not mirror each other, the gait is asymmetrical. An
example of such is the gallop; limb movements of one side do not mirror the ones from
the other side and the interval between foot falls is uneven.1 A normal walk is a slow,
symmetrical gait where at any time two, three (usually) or four (rarely) legs are on the
ground.3 In contrast, in a normal trot no more than two limbs are ever touching the
ground at the same time.3 Symmetrical gaits are ideal for detecting lameness because
visible asymmetry of a symmetrical gait is seen as an indicator of lameness.2,3,7,8,9
The
walk and trot are the two most commonly used gaits when evaluating lameness, because
in contrast to amble and pace, they are easy to elicit.2

7
Lameness has been defined as an interference of normal gait of an animal, usually
involving the propulsion mechanism of one or more limbs.3 Two methods for the
evaluation of lameness have been described. The oldest and most commonly used method
is observational gait analysis (OGA). More recently, instrumented gait analysis (IGA) has
gained popularity as a method of trying to more objectively evaluate lameness. The
purpose of this review is to outline these two types of gait analysis and identify their
limitations.
Observational Gait Analysis is often considered the gold standard of gait analysis. In its
basic form, it is easy to use and inexpensive. It does not take too much time to complete
and does not require a large amount of space or equipment. However, the use of multiple
observers and/or the use of recorded evaluations make OGA much more complex.
Unfortunately OGA is subjective and inherently susceptible to observer bias.10
With OGA, gait is most commonly observed and assessed by a single observer with an
assistant walking and trotting the dog.3 This is done by observing the animal move both
towards and away from the observer and from both sides of the animal.3 The animal may
also be walked in circles to stress different limbs or to rule out ataxia.3 When the animal
is moving away from the observer, it is evaluated for pelvic limb asymmetry, while when
the dog is moving towards the observer, the focus is on thoracic limb asymmetry. Limb
and joint motion is best evaluated from the side.3 This is ideally done in an examination
area long enough for the animal to maintain a steady velocity during walking or trotting,
and wide enough for the observer to watch from different viewpoints. In some cases, the

8
dog may be asked to walk up or down stairs, on inclines or on a treadmill to induce or
accentuate lameness.3 Lameness may be more exaggerated at a trot than at a walk, which
has been confirmed with IGA.3,8
Lameness is often described in terms of visual changes of asymmetry related to forces,
joint angles, and temporo-spatial gait characteristics. Even though many criteria for
lameness have been reported, there is scant information on descriptions of deviations that
denote normal from abnormal gait. For example, decreased loading of a limb is seen as a
sign of lameness, but the extent of the decrease needed for it to be called lameness has
not been defined. The exact extent to which visual changes must occur in order to call a
gait “lame” is a significant source of variability in the evaluation and description of
lameness.
Forelimb lameness can be characterized by an abbreviated length of time the affected leg
is on the ground. To further decrease the loading of the affected limb, the dog with
forelimb lameness typically also has a head “bob”, where the head is lifted when the
affected leg contacts the ground. The hindlimbs may also be carried further under the
body to receive weight that is shifted away from the front limbs1. Hindlimb lameness is
also defined by a shortened stance phase duration. Dogs with unilateral hindlimb
lameness may have a pelvic tilt away from the affected limb and pelvic oscillations
during their gait. To transfer weight to the forelimbs and unload the affected hindlimb(s),
a dog with hindlimb lameness also may extend and lower its head1. When the affected
limb is placed on the ground, the dog may exaggerate the downward motion of the head

9
and neck to lessen weight on the hindlimbs. Tail movement also has been used as an
indicator of hindlimb lameness: rather than swinging the tail from side to side as in the
normal dog, the lame dog may move its tail up and down with the up motion occurring
when the injured extremity contacts the ground.2 Joint angles can also be used to detect
lameness, although much variability exists among and between breeds.3 In the hindlimb,
the most movement is generated at the hip joint. Very little movement takes place in the
stifle joint until the end of the stance phase.3 In the forelimb, most of the movement is
between the shoulder blades until the end of the swing phase where the rest of the limb is
extended.3,11
Motion of the thoracic and pelvic joints can be accentuated while moving up
stairs and ramps.12-14
Again, even though many criteria for lameness have been reported
and are being used, descriptions of deviations that denote normal from abnormal gait
have not been reported.
Findings of OGA can be described qualitatively or semi-quantitatively. Traditionally,
lameness has been described qualitatively using criteria described above. To make the
evaluation less subjective, semi-quantitative methods like scoring rubrics that treat
lameness as categorical data, and visual analog scales that consider them as continuous
data have been proposed. Many scoring rubrics have been reported but all are subjective
due to the poor definitions of the categories.10,15,16
For instance, there is no true definition
of a so-called moderate lameness. Visual analogue scales (VAS), where the observers
grades the lameness with a score between 0 and 10 have been used as another way to
improve the objectivity of observational lameness exams. In a study comparing numerical
scoring and VAS for lameness in sheep, VAS scoring by veterinarians and veterinary

10
students was found to correlate well with numerical scoring when the lameness was mild
or severe, but not for moderate lameness.15
In another study, a VAS questionnaire given
to dog owners was found to be a repeatable and valid test when evaluating mild or
moderate lameness.17
Other reported approaches to make OGA less subjective include
the use of multiple observers or by recording trials and subsequent evaluation of the
video recordings obtained at one or more time points.16,18
The purpose of both these
methods is to increase the precision and accuracy of the observations by taking into
account more than one observer’s opinion. With multiple observers, the lameness scores
are typically combined and an average score is given to each animal. Several studies have
demonstrated that multiple observers, often after a training period, can obtain a high
degree of inter-observer agreement as demonstrated by correlation or the so-called kappa
statistic.15,17
However, we could not find studies that demonstrated that multiple
observers really improved the accuracy of the findings over those of a single observer.
Another major limitation of the use of OGA is observer bias in the form of inter or intra-
observer variability. Inter-observer variability, the variability due to systematic
differences between observers may, at least partly, be caused by different levels of
experience of the observers.17,19
It has been suggested that over time the effect of the
level of experience may become less profound, meaning that over time an observer is
expected to become more experienced.16
Inter-observer variability may occur in practices
with multiple veterinarians, where different clinicians may be evaluating a patient at
different recheck visits. Intra-observer variability may become a factor if an observer
interprets or grades signs of lameness differently over time.19,20
Both inter- and intra-

11
observer variability may be reduced with video recorded exams.19,21,22
When an observer
can perform all lameness evaluations at the same time, it becomes more likely that
identical lameness criterion definitions are being used for the evaluations thus reducing
intra-observer variability. In studies where multiple observers review recorded exams, all
observers can evaluate the same lameness exam which may result in reduced inter-
observer variability.16,19
Observer bias affecting qualitative and semi-quantitative
techniques also may occur if the observer has information pertaining to the medical
history or observations at home, prior to examination. This form of bias may be avoided
by blinding the observers to this information.19
Nevertheless, even if efforts are made to
avoid observer bias, OGA remains a subjective technique and it is almost impossible to
completely eliminate observer bias.10
In veterinary medicine, motion analyses (kinematic analysis), force analyses (kinetic
analysis) and Paw Pressure Analyses (PPA: pedobarography) are the most commonly
used IGA modalities to detect lameness.2,19
Less commonly used are electromyography
(EMG), accelerometry and inverse dynamics.2,23,24
For a more thorough description of
EMG, accelerometry and inverse dynamics the reader is encouraged to review a textbook
and recently published work.24-26
Kinematic analysis is the study of absolute or relative motion between rigid bodies.2
Kinematic analysis determines the displacement, velocity, and acceleration of various
body segments and can be divided into measurements of joint angle variables
(goniometry) and of temporo-spatial variables (TSVs).2,27

12
Temporo-spatial variables of gait are used to describe velocity during locomotion and
durations of both the stance and swing phases of gait.2 The TSVs provide information
about the gait cycle and include: duration of gait cycle, stance and swing phase duration
and length of stride and step. TSVs can be acquired with kinematic or kinetic systems.28
Kinematics can also be used to record angular motion of joints and body segments
including joint flexion and extension, joint range of motion, and velocity and acceleration
of joints.29
For each kinematic variable the associated Symmetry Index (SI), a measure
comparing a variable value of a limb with that of the contralateral limb and the inter-trial
coefficient of variation (CV), a measure of inter-step variability, also can be
calculated.4,5,30,28
Many kinetic variables, variables used to describe the force of limbs in relation to the
ground, have been used to describe gait. The principle force measured with kinetic gait
analysis is the ground reaction force (GRF), the force exerted by the ground on a body in
contact with it according to Newton’s Third Law.2,26 The most commonly used variable
to describe GRF is the peak vertical force (PVF), the maximum force perpendicular to the
ground during stance. Commonly used variables derived from PVF include PVF as a
percentage of body weight (%PVF), dynamic weight distribution (%WD; the PVF of a
limb as a percentage of the total PVF of all four limbs), vertical impulse (VI; the total
vertical force generated during the stance phase), and paw contact area (PCA); the latter a
measure of surface area covered by each paw. Just as for kinematic variables, for each
kinetic variable a symmetry index and inter-trial coefficient of variation can be
calculated.4,5,28,30

13
To describe lameness with IGA, PVF or PVF derivatives like PVF normalized for
bodyweight (%PVF), vertical impulse (VI), %WD, L-R symmetry indices (SI), and rate
of loading and unloading are used. In addition, Fourier analysis is a method that has also
been used to detect subtle changes in IGA data of dogs with hindlimb lameness.31,32
A
decreased PVF or PVF derivative of the affected limb usually is seen as a sign of
lameness, but there only is scant literature on how much of a decrease signifies true
lameness.33,34
Two main approaches have been used to define lameness: by evaluating
groups of dogs and by evaluating individual dogs. When evaluating lameness in a group
of dogs, the means of the gait variable of the experimental limbs can be compared with
the mean values of the contralateral, unaffected limbs.31,35
Alternatively, a group of
presumed lame dogs may be compared to themselves longitudinally or to a control group
in a cross-sectional manner. A study with IGA of an experimental and control group is
an example of the latter, whereas a study using IGA to compare outcome over time after
a treatment is an example of the former.20,36
There are several limitations to this type of
approach. Only statistically significant differences between group means are detected, but
the comparisons do not indicate whether a mean variable value signifies lameness or not.
Also, mean variable values do not provide information about individual dogs within the
group, and particularly if dogs within a group are not of the same breed, body weight or
body size, it may be difficult to assess variability within a group. Another reported
approach is using a 10% or more deviation of gait variables from the control group as
evidence of lameness.9 However, there is no scientific evidence in support of this 10%
criterion.37
Finally, these approaches are of limited clinical use as they cannot be applied
to determine lameness or soundness of individual dogs.

14
Several approaches have been proposed to discriminate between lame and non-lame
individual dogs, independent of body weight, body size or body shape. One reported
approach is to normalize gait data using the principal of dynamic similarity.38
Dynamic
similarity is the process of normalizing gait variables to body size as well as body weight.
It is based on the assumption that animals of different sizes move in a ‘dynamically
similar’ way at ‘body size-normalized’ velocities. Previous studies have shown that in
trotting dogs normalizing PVF to body weight alone is insufficient to account for
differences in body size and velocity.38,39
Others attempted to describe force platform-
obtained gait variables of trotting dogs as a function of body weight, body size
(represented by height of withers) and body shape (breed).8,38
In these dogs, velocity was
kept within a standard range. With the exception of forelimb VI and pelvic limb PVF,
correlations between gait variables, body weight or body size alone were found to be
only moderately strong (mean r2=0.72, range 0.01 – 0.97), suggesting that most kinetic
variables cannot be normalized and used to predict lameness based on body weight. Even
after full normalization to body weight and wither height, gait parameters still varied by
approximately 10%, and were different for different breeds. In a similar study of walking
dogs it was found that PVF was best described as a function of body weight and that
velocity or limb length did not strengthen the model.29
The authors also reported
that %PVF was inversely related to body weight, which would make this variable
unsuitable for comparison of the PVF of dogs of different body weight, body size, or
body shape. Collectively these data suggest that present normalization techniques do not
allow comparison of gait variables from dogs with different body weight, body size, body
shape, gait or velocity. Nevertheless, without suitable normalization techniques it will be

15
difficult to compare gait variables and develop universal definitions of criteria to
discriminate between lame and non-lame individual dogs.
Another approach to discriminate lame from sound individuals is by evaluation of IGA
gait variables of known lame dogs using a receiver operating characteristics (ROC)
analysis. Evans et al used ROC curves and area under the curve (AUC) to determine the
sensitivity and specificity of force plate variables for detection of gait abnormalities in
Labrador retrievers after surgery for ruptured CCL.40
PVF alone as a variable yielded 89%
accuracy. The combined PVF–FS (falling slope) was the most sensitive predictor and had
a sensitivity of 93% and a specificity of 94%. Falling slope is the slope of the line
between maximum force and end of stance phase and is the rate at which the limb is
unloaded.40
They concluded that in trotting dogs a combination of PVF and falling slope
could best distinguish lame from non-lame dogs. Other workers attempted to determine
cut-off values with ROC analysis for pelvic limb symmetry indices (SI) of PVF, VI, PCP
(paw contact pressure) and PCA (paw contact area) using large breed dogs with lameness
due to naturally occurring rupture of the cranial cruciate ligament.9 All SI’s had 100%
sensitivity and specificity. An underlying assumption of both these studies is that all dogs,
independent of body weight, body size and body shape, have the same gait variable
values. However, studies with normalized gait variables indicate that this is not true and
there also are no reports of this being true for SIs.41
Therefore, without such proof, these
findings should not be applied to dogs of different breeds with different body weight,
body size, body shape, or gait. Another question is whether these findings can be applied
to dogs with lameness due to other causes than ruptured cranial cruciate ligament.

16
Intuitively, one would think that gait variable changes that occur with cranial cruciate
ligament rupture (CCLR) will not be the same as with for instance fractures, hip
dysplasia, or forelimb conditions.
A third approach is by establishing normal values for gait variables using normal dogs
free of lameness or neurological deficits, and comparing these variables to those of lame
animals. In a recent study, kinetic gait variables of 90 normal dogs of different body
weight (BW; ranging from 1.5-60 kg), different body size and body shape were
evaluated.29
First, gait variables that were constant or a function of bodyweight across all
weight groups were identified and then 95% confidence intervals of selected gait
variables were determined. It was suggested that such 95% confidence intervals may
serve as normative ranges that may be used to detect lameness and neurological deficits
in individual dogs of any body weight, body size and body shape. An advantage of this
approach is that it can be used for dogs with lameness due to any etiology. Even though
the normal ranges are for dogs of any body weight, body size and body shape, use of
appropriately normalized gait variables will be advantageous, as they most likely will
have a narrower normal range than non-normalized variables. A limitation of this
approach is that these normative ranges have not been validated and that the sensitivity
and specificity of the normative ranges to detect thoracic or pelvic limb lameness in
individual dogs has not been determined. An additional limitation of this approach is that
a 95% confidence interval of the mean provides very conservative minimum and
maximum range values, at least theoretically resulting in an increased number of false
negative results. Unfortunately, statistical calculations show that a population of 90-120

17
dogs would be needed to establish a true normal range. Nevertheless, pilot studies using
the proposed normal ranges demonstrated that they may be used successfully to identify
lameness in dogs with CCLR and neurological deficits due to cervical or thoracolumbar
spinal cord lesions.29,42
Several studies have tried to establish the relationship between OGA and IGA in an
attempt to determine how accurate each method truly is.10,16
One study using both
numerical rating scales and VAS by trained veterinarians, compare lameness scores in
dogs with induced pelvic limb lameness with force plate analysis.10
Agreement between
observer and force plate was calculated using correlation coefficients and was found to be
low (r = 0.3 – 0.58) unless the lameness was severe, regardless of scoring technique used.
Another study compared VAS scores to force plate data.16
Correlations ranged from 0.69
to 0.90 when compared to PVF and 0.68 to 0.89 when compared to VI. They concluded
that agreement between OGA and IGA was low.
The true relationship between OGA and IGA has not been well characterized. Although
current literature suggests these two do not correlate very well, the search remains for
which method can be considered the superior method. This becomes important when a
gold standard is needed on which to base lameness findings. Because the agreement
between different observational scoring systems is low and subjectivity is high, it is hard
to support OGA as a true gold standard. From a scientific viewpoint it would make sense
that IGA would make a better gold standard because it is more objective. However,
criteria for detecting lameness using IGA have not been properly validated. Additionally,

18
IGA equipment is not readily available in many practices, making it difficult to give it
such an important title as gold standard. The truth is that a gold standard may not exist
yet.
Both OGA and IGA use the same criteria to evaluate lameness: force, temporo-spatial,
and joint angle variables. With OGA, observations are made by a single or multiple
observers to determine whether or not an animal is lame. Observations are qualitative and
subjective, mainly because of observer bias. This form of bias is difficult to eliminate, but
OGA can be made less subjective by applying numerical scales to the observations. Even
though many criteria for lameness have been reported, there is only scant information on
definitions of the severity of deviation required to differentiate normal from abnormal
gait. Nevertheless, OGA is the most commonly used type of gait analysis as it is an easy
and fast method of detecting lameness.
Instrumented gait analysis is a more objective way of evaluating lameness than OGA.
Gait variables that can be used to differentiate normal from abnormal gait, such as
decreased PVF or %WD, have been proposed. However, changes of variable values that
constitute lameness have not been defined. Several approaches to discriminate abnormal
gait have been reported and include normalization of gait variable values, use of ROC
analysis to determine cut-off values using gait data of lame dogs, and by determining
normal values for gait variables using sound dogs. These approaches are promising, but
hitherto have not provided robust and reliable definitions of lameness. Compared with
19
OGA, IGA has the advantages of being quantitative. However, IGA takes more time,
requires a significant investment, and is technically more demanding than OGA.
For IGA to become a useful tool to determine lameness in individual dogs, gait variable
criteria to discriminate normal from abnormal gait will have to be defined. First, more
normalization techniques for KVs, TSVs, and KMVs, valid for dogs of any body weight,
body shape, body size, and perhaps also velocity and symmetric gait, will have to be
developed. Then, cut-off values can be determined, either by ROC analysis of
normalized gait data from known lame dogs or by normal ranges of normalized gait
variables from known sound dogs. Part of this work already has been completed, but it
will take more time and effort before a set of defined criteria to discriminate between
normal and abnormal canine gait will be available for researchers and clinicians.
20
References
1. Lameness. Available at: Merriam Webster Online. http://www.merriam-webster.com/.
Accessed June 1, 2014.
2. Newton CD, Nunamaker DM. Gait analysis and orthopedic examination. In: Textbook
of small animal orthopaedics. Philadelphia: Lippincott; 1985.
3. Sumner Smith G. Gait analysis and orthopedic examination. In: Textbook of Small
Animal Surgery.Vol 2. 2nd ed. Philadelphia: W.B. Saunders; 1993:1577–1586.
4. Budsberg SC, Jevens DJ, Brown J, et al. Evaluation of limb symmetry indices, using
ground reaction forces in healthy dogs. Am J Vet Res 1993;54:1569–1574.
5. Herzog W, Nigg BM, Read LJ, et al. Asymmetries in ground reaction force patterns in
normal human gait. Med Sci Sports Exerc 1989;21:110–114.
6. Colborne GR, Walker AM, Tattersall AJ, et al. Effect of trotting velocity on work
patterns of the hind limbs of Greyhounds. Am J Vet Res 2006;67:1293–1298.
7. Colborne GR, Good L, Cozens LE, et al. Symmetry of hind limb mechanics in
orthopedically normal trotting Labrador Retrievers. Am J Vet Res 2011;72:336–344.
8. Voss K, Galeandro L, Wiestner T, et al. Relationships of body weight, body size,
subject velocity, and vertical ground reaction forces in trotting dogs. Vet Surg
2010;39:863–869.

21
9. Oosterlinck M, Bosmans T, Gasthuys F, et al. Accuracy of pressure plate kinetic
asymmetry indices and their correlation with visual gait assessment scores in lame and
nonlame dogs. Am J Vet Res 2011;72:820–825.
10. Quinn MM, Keuler NS, Lu Y, et al. Evaluation of agreement between numerical
rating scales, visual analogue scoring scales, and force plate gait analysis in dogs. Vet
Surg 2007;36:360–367.
11. Goslow GE Jr, Seeherman HJ, Taylor CR, et al. Electrical activity and relative length
changes of dog limb muscles as a function of speed and gait. J Exp Biol 1981;94:15–42.
12. Durant AM, Millis DL, Headrick JF. Kinematics of stair ascent in healthy dogs. Vet
Comp Orthop Traumatol 2011;24:99–105.
13. Carr JG, Millis DL, Weng H-Y. Exercises in canine physical rehabilitation: range of
motion of the forelimb during stair and ramp ascent. J Small Anim Pract 2013;54:409–
413.
14. Millard RP, Headrick JF, Millis DL. Kinematic analysis of the pelvic limbs of healthy
dogs during stair and decline slope walking. J Small Anim Pract 2010;51:419–422.
15. Welsh EM, Gettinby G, Nolan AM. Comparison of a visual analogue scale and a
numerical rating scale for assessment of lameness, using sheep as a model. Am J Vet Res
1993;54:976–983.

22
16. Waxman AS, Robinson DA, Evans RB, et al. Relationship between objective and
subjective assessment of limb function in normal dogs with an experimentally induced
lameness. Vet Surg 2008;37:241–246.
17. Hudson JT, Slater MR, Taylor L, et al. Assessing repeatability and validity of a visual
analogue scale questionnaire for use in assessing pain and lameness in dogs. Am J Vet
Res 2004;65:1634–1643.
18. Kaler J, Wassink GJ, Green LE. The inter- and intra-observer reliability of a
locomotion scoring scale for sheep. Vet J 2009;180:189–194.
19. Breur GJ, Kim J. Should gait analysis be a part of clinical orthopaedic reports? J
Small Anim Pract 2008;49:113–114.
20. Sanchez-Bustinduy M, de Medeiros MA, Radke H, et al. Comparison of kinematic
variables in defining lameness caused by naturally occurring rupture of the cranial
cruciate ligament in dogs. Vet Surg 2010;39:523–530.
21. Borgens, RB, Toombs JP, Breur G, et al. An imposed oscilating electrical field
imoproves the recovery of function in neurologically complete paraplegic dogs. Journal
of Neurotrauma 1999;16:639–657.
22. Laverty PH, Leskovar A, Breur GJ, et al. A preliminary study of intravenous
surfactants in paraplegic dogs: polymer therapy in canine clinical SCI. J Neurotrauma
2004;21:1767–1777.

23
23. Bockstahler BB, Gesky R, Mueller M, et al. Correlation of Surface Electromyography
of the Vastus Lateralis Muscle in Dogs at a Walk with Joint Kinematics and Ground
Reaction Forces. Vet Surg 2009;38:754–761.
24. Ragetly CA, Griffon DJ, Mostafa AA, et al. Inverse dynamics analysis of the pelvic
limbs in Labrador Retrievers with and without cranial cruciate ligament disease. Vet Surg
2010;39:513–522.
25. Pillard P, Gibert S, Viguier E. Development of a 3D accelerometric device for gait
analysis in dogs. Comput Methods Biomech Biomed Engin 2012;15 Suppl 1:246–249.
26. Tobias KM. Gait Analysis. In: Manual of Small Animal Soft Tissue Surgery. 1st ed.
Wiley-Blackwell; 2009.
27. Jaegger G, Marcellin-Little DJ, Levine D. Reliability of goniometry in Labrador
Retrievers. Am J Vet Res 2002;63:979–986.
28. Kim J, Rietdyk S, Breur GJ. Comparison of two-dimensional and three-dimensional
systems for kinematic analysis of the sagittal motion of canine hind limbs during walking.
Am J Vet Res 2008;69:1116–1122.
29. Alshehabat MA. Instrumented Gait Analysis to Characterize Pelvic Limb Ataxia in
Dogs. Purdue University Thesis. 2012.
30. Kim SY, Kim JY, Hayashi K, et al. Skin movement during the kinematic analysis of
the canine pelvic limb. Vet Comp Orthop Traumatol 2011;24:326–332.

24
31. Torres BT, Moëns NMM, Al-Nadaf S, et al. Comparison of overground and
treadmill-based gaits of dogs. Am J Vet Res 2013;74:535–541.
32. Katic N, Bockstahler BA, Mueller M, et al. Fourier analysis of vertical ground
reaction forces in dogs with unilateral hind limb lameness caused by degenerative disease
of the hip joint and in dogs without lameness. Am J Vet Res 2009;70:118–126.
33. Rumph PF, Kincaid SA, Baird DK, et al. Vertical ground reaction force distribution
during experimentally induced acute synovitis in dogs. Am J Vet Res 1993;54:365–369.
34. Budsberg SC. Long-term temporal evaluation of ground reaction forces during
development of experimentally induced osteoarthritis in dogs. Am J Vet Res
2001;62:1207–1211.
35. Ragetly CA, Griffon DJ, Mostafa AA, et al. Inverse dynamics analysis of the pelvic
limbs in Labrador Retrievers with and without cranial cruciate ligament disease. Vet Surg
2010;39:513–522.
36. Drüen S, Böddeker J, Meyer-Lindenberg A, et al. Computer-based gait analysis of
dogs: evaluation of kinetic and kinematic parameters after cemented and cementless total
hip replacement. Vet Comp Orthop Traumatol 2012;25:375–384.
37. Foss K, da Costa RC, Rajala-Schuttz PJ, et al. Force plate gait analysis in Doberman
Pinschers with and without cervical spondylomyelopathy. J Vet Intern Med
2013;27:106–111.

25
38. Voss K, Wiestner T, Galeandro L, et al. Effect of dog breed and body conformation
on vertical ground reaction forces, impulses, and stance times. Vet Comp Orthop
Traumatol 2011;24:106–112.
39. Budsberg SC, Verstraete MC, Soutas-Little RW. Force plate analysis of the walking
gait in healthy dogs. Am J Vet Res 1987;48:915–918.
40. Evans R. Accuracy and Optimization of Force Platform Gait Analysis in Labradors
with Cranial Cruciate Disease Evaluated at a Walking Gait. Vet Surg 2005;34:445-449.
41. Voss K, Imhof J, Kaestner S, et al. Force plate gait analysis at the walk and trot in
dogs with low-grade hindlimb lameness. Vet Surg 2007;20:299–304.
42. Elmore M. Application of kinetic criteria to define lameness in individual dogs.
Purdue University Phi Zeta Day 2013.

26
CHAPTER 3: CUT-OFF VALUES FOR DETERMINING LAMENESS
Introduction
Lameness is a common presentation of musculoskeletal disease.1,2
Decreased lameness
severity is often seen as a sign of healing or success of treatment.1 Therefore, recognition
of lameness and the severity of lameness is an essential part of the evaluation process and
diagnosis of canine orthopedic diseases.
The gait of lame dogs can be evaluated by one of two methods. The first, known as
observational gait analysis (OGA), relies on an observer to make a visual assessment of
lameness. Observed lameness can be described in terms of visual changes including:
decreased loading of the affected limb and shifting of the load to the unaffected limbs,
decreased length of the swing phase, decreased duration of the stance phase, alterations in
joint angle and thus a combination of kinetic and kinematic changes.1 A major limitation
of OGA is its inherent subjectivity and limited repeatability both by the same observer
and between observers. Several techniques such as numerical lameness scoring, the use
of visual analog scales, and the use of multiple observers with or without video analysis
have been used in an attempt to make this technique less subjective and more
repeatable.3–5

27
The second method to evaluate canine gait is instrumented gait analysis (IGA) which
uses electronic equipment to capture forces (kinetic analysis) and movement (kinematic
analysis) related to an animal’s locomotion. It has been proposed as a more objective
quantitative way to define lameness in dogs.6,7
However, criteria used to define lameness
based on IGA are lacking. The most commonly used variable to report lameness is peak
vertical force (PVF), the maximum force perpendicular to the ground during stance.8–10
Variables can be calculated from PVF and include the derivatives PVF normalized for
body weight (%PVF), dynamic weight distribution (%WD; the PVF of a limb as a
fraction of the total PVF of all four limbs), and vertical impulse (VI; the total vertical
force generated during the stance phase), left-right symmetry indices (SI), and the limb’s
rate of loading and unloading.11
Even though lameness has been reported as a decrease of
the affected limb’s PVF and derivatives, it is not known (or defined) how much decrease
constitutes lameness as opposed to normal variability. Not having established criteria
defining lameness is a major limitation of IGA and inhibits widespread implementation
of the technique.
Several approaches towards definition of lameness criteria in individual dogs have been
reported.12–14
To make future criteria applicable to dogs of all breeds, bodyweights, body
sizes and body shapes, normalization of gait variables, for instance normalization by
body weight or body size has been proposed.13
However, this approach has not yet
resulted in a recommended and generally accepted set of gait variables that can be used
for comparisons between dogs of different body weight, body size and body shape.

28
Approaches aimed at defining criteria to discriminate lame from sound individual dogs
include development of cut-off values, either by receiver operating curve analysis (ROC)
of gait data from known lame dogs or by defining normal ranges of gait variables from
known sound dogs. Recently, two groups have used ROC cut-off values to define
lameness criteria.12,15
With ROC analysis, optimal cut-off values as well as their
sensitivity and specificity are determined using the so-called area under the curve (AUC).
These cut off values may then be used to identify lameness. Evans et al evaluated
individual and combined variables in dogs with hind limb lameness due to ruptured
cranial cruciate ligament (RCCL) to come up with combinations of the most sensitive and
specific variables.15
They reported that a combination of PVF-FS (falling slope) had the
greatest AUC (0.98), indicating the test’s almost perfect ability to discriminate lame from
sound dogs. Others used ROC analysis to evaluate the ability of symmetry indices (SIs)
of kinetic variables (KVs) to differentiate between sound dogs and dogs with hind limb
lameness due to RCCL.12
They concluded that using symmetry indices of each variable
could produce sensitivities of up to 100%. Both studies show the promise of this
approach, but both only used large breed dogs with ruptured cranial cruciate ligament.
Thus, it is unknown whether these criteria can be used with dogs of different body weight
or lameness caused by other conditions than ruptured cranial cruciate ligament.
Other workers established normal ranges for kinetic variables of sound (normal) walking
dogs of any body weight, body size or body shape.14
These normal ranges have not been
evaluated in a larger population of lame dogs, but results of a preliminary study of 30
29
dogs with hind limb lameness due to ruptured cranial cruciate ligament rupture suggested
that normal ranges may be used as cut-off values to discriminate sound from lame dogs.16
Reports on the values of normal and abnormal forelimb gait variables are limited.
Information does exist, however, describing joint motion of normal dogs of different
breeds, undergoing different activities.17–22
Recently, alterations in IGA variables from
dogs with forelimb lameness were described.22
Beagles were evaluated at walk and at trot
before and after induction of lameness by attaching a round sphere to one paw. They
found that during walking and trotting, PVF and VI decreased in the ipsilateral forelimb,
increased in the contralateral hind limb, and remained unchanged in the ipsilateral hind
limb after lameness was induced.22
Those variables increased in the contralateral forelimb
at a trot. This information is useful in characterizing changes that may occur in forelimbs
during lameness, but it is unknown whether these changes also are associated with
naturally occurring forelimb lameness or lameness of different etiology.
The goal of the present is study is to characterize kinetic and kinematic variables in dogs
with orthopedic forelimb lameness and to determine cut-off values of gait variables for
lameness detection using ROC analysis with OGA as the reference standard. Our
hypothesis is that cut-off values with an AUC greater than 0.7 can be established for
selected IGA variables.

30
Materials and Methods
Twenty client-owned dogs with unilateral forelimb lameness were studied. Dogs were
included if they had an observable unilateral forelimb lameness of any duration and the
lameness could be localized to a region of the affected limb. Age, breed, size and weight
were not selection criterion. Dogs were excluded if they had bilateral or shifting forelimb
lameness at the time of examination, if they had neurological disease, or if they were too
aggressive or uncooperative during the orthopedic or instrumented gait exam. Written
informed consent was obtained from all clients prior to inclusion and the study was
approved by the Purdue Animal Care and Use Committee.
Visual lameness exams (OGA) were performed prior to instrumented gait analysis and
any physical manipulation. Visual exams were performed by a board-certified small
animal surgeon (Observer 1) and a small animal surgery resident (Observer 2), unaware
of the side of the forelimb lameness or presumptive diagnosis. Lameness grading was
performed first at the walk and then at the trot according to the following numerical scale:
Grade 0: no observable lameness, Grade I: mild observable lameness, Grade II: moderate
observable lameness, Grade III: significant weight bearing lameness, and Grade IV: non-
weight bearing lameness. Each observer was asked to determine which forelimb was
affected (left or right) and to score each dog at the walk and at the trot. The average score
of the two observers for walk and for trot was calculated. Dogs were only included if
lameness (defined as numerical score of >0) was documented at either the walk or the trot
by one or both observers. The dog was then taken to have instrumented gait analysis

31
performed. Upon return, a full physical, orthopedic and neurologic exam were performed.
The ultimate diagnosis was based on results of radiographic and surgical evaluation (if
applicable). All lame dogs were free of concurrent orthopedic and neurologic
abnormalities.
Before data acquisition, dogs were conditioned by one handler to walk over a 9 m long
runway. A pressure sensing walkway (3.9sensors/cm2, Tekscan Inc, South Boston, MA,
USA) was used. Trials were collected until 6 valid trials (3 on each side) were collected.
A valid trial consisted of straight walking without stopping, hesitating, trotting, or
swinging of the head.11,5
Variables obtained directly included PVF, stance phase duration,
gait cycle duration and stride length. The dynamic weight distribution (%WD), swing
phase duration, symmetry index (SI) and duty factor were derived using the following
equations.5,11
%WD = (PVFLimb of interest /Σ PVFAll four limbs) × 100%
Swing phase duration = gait cycle duration – stance phase duration
SI = (|XR-XL|/[0.5|XR+XL| ]) x 100%
Duty factor = duration of stance phase/duration of gait cycle
For each variable, the inter-trial CV (coefficient of variation), a measure of inter-step
variability also was calculated.5,11
32
Reflective spheres were placed on the thoracic limb (dorsal aspect of the scapular spine,
acromion, lateral epicondyle of the humerus, ulnar-carpal joint, distal aspect of the 5th
metacarpal bone). Motion was digitized using cameras and specialized software
(MaxTRAQ®
and MaxMATE
®; Innovision Systems Inc, MI, USA, MathLab
®). A full
gait cycle was defined as one of the thoracic limb paw pads hitting the floor and
contacting the pressure walkway (beginning of stance phase) and ending when the same
forelimb contacted the walkway during the subsequent gait cycle.11
For each forelimb
joint, the peak extension, peak flexion and range of motion (ROM) was obtained and of
each variable the SI and inter-trial CV was calculated.5,11
Mean and standard deviation (SD) were used to summarize the distribution of the kinetic
and kinematic variables in the study sample. A paired t-test was performed to compare
variables of affected and unaffected forelimbs. Significance between limbs for each
variable was set at p <0.05. Correlation between the scores of the observers and between
walk and trot OGA score were determined via Spearman’s Rank Correlation. Correlations
between OGA score and IGA variables of the affected limb were also calculated. The
AUC from the ROC analysis was generated to quantify the overall performance of the
instrumented gait analysis variables on discriminating forelimb lameness. In addition, the
optimal cut-off values for the selected kinetic and kinematic variables based on the
Youdon’s index were identified.9 Sensitivity and specificity using the optimal cut-offs
identified from the ROC analysis were also reported. Statistical analyses were performed
using MedCalc for Windows, version 12.6 (MedCalc Software, Ostend, Belgium).

33
Results
Of the 20 lame dogs (mean age 42 months, range 9-100 months), 14 were male and 6
were female. Mean body weight was 39.2 kg (range 13.2 – 50.5 kg). Breeds included:
Labrador Retriever (n= 4), mixed breed (n=3), German Shepherd (n=2), Golden retriever
(n=2), Bernese Mountain Dog (n=1), English Setter (n=1), American Bulldog (n=1),
English bulldog (n=1), Goldendoodle (n=1), Border Collie (n=1), Boston terrier (n=1),
Great Dane (n=1) and Borzoi (n=1). Final diagnoses included bicipital tenosynovitis
(n=3), shoulder osteochondritis dessicans (n=3), chronic elbow osteoarthritis (n=2),
elbow dysplasia including; fragmented coronoid process (n=2), elbow subluxation (n=1),
ununited anconeal process (n=1); other (n=2), carpal valgus (n=1), brachial myositis
(n=1), carpal DJD (n=1), supraspinatus mineralization (n=1) and in two patients lameness
localized but undiagnosed.
The mean OGA lameness score for the dogs at the walk was 1.2 out of 4 for both
Observer 1 (sd 0.77; range 0 -3) and Observer 2 (sd 0.82; range 0-3); the mean lameness
score of the 2 observers for dogs at walk was 1.2 (sd 0.75). At the trot, the mean OGA
lameness scores for Observer 1 and Observer 2 were 1.4 (range 0 - 2) and 1.3 (range 0 - 2)
respectively; the mean lameness score of the 2 observers for dogs at trot was 1.35 (sd =
0.78). Correlation between the two observers was 0.79 for scores at the walk and 0.71 for
scores at the trot. Correlation between the mean scores obtained at walk and scores
obtained at trot was 0.86. Side of observed lameness correlated 100% of the time between
observers.

34
The mean duty factor was 0.63 (range 0.55-0.67), indicating that all dogs were walking
during the data acquisition. Significant differences between affected and unaffected limbs
were only found for PVF (p < 0.0001), %WD (p < 0.0001) and CV of peak elbow
extension (p = 0.04). Even though no quantitative differences between KMVs of affected
and unaffected were found, qualitative differences in the shape of the joint angle-gait
cycle curves were seen (see Fig 1). A summary of the descriptive statistics of KVs, TSVs
and KMVs can be found in Table 1, 2 and 3.
The AUC and associated 95% CI of PVF, %WD, CV of carpal joint extension and CV of
elbow peak extension exceeded 0.5, indicating discriminatory ability. Only the AUC of
PVF and %WD exceeded 0.7 (0.727 and 0.922, respectively). Optimal cut-off values for
PVF and %WD, based on Youden’s index, yielded ≤10.6 kgf for PVF and
≤29.7% for %WD. Associated sensitivity and specificity for PVF were 70% and 75%,
and for %WD they were 90% and 85% respectively. The results of the ROC analysis are
listed in Table 4 and 5.
The lame forelimb as chosen by the observers during OGA always corresponded with the
lame side based on gait variable values obtained with IGA. The correlation between the
mean OGA lameness score of the 2 observers of the walking dogs and KVs of the
affected limb was only > 0.60 for the PVF-SI (0.65) and %WD-SI (0.65). Correlation
coefficients of TSVs > 0.6 were the stance phase duration SI (0.64), swing phase duration
SI (0.65), and stance phase duration CV of the affected limb (0.63). Overall, correlation
coefficients for KMVs were smaller than those for KVs and TSVs, and all were < 0.52.

35
Discussion
The results of the OGA study suggest a moderate inter-observer correlation for forelimb
lameness (walk r = 0.79, trot r = 0.71) and a moderate scoring agreement of dogs with
forelimb lameness at walk and at trot (r=0.86). The results of the IGA study suggest that
in walking dogs only the mean PVF, mean %WD and the mean inter trial CV of
maximum elbow extension were significantly different when gait variables of affected
and unaffected forelimbs were compared. Using ROC analysis, cut off values for PVF
(≤10.6 kgf; sensitivity 70% specificity 75%) and %WD (≤29.7%; sensitivity 90%
specificity 85%) to discriminate between lame and sound individual walking dogs were
determined. Only a modest correlation between OGA results of walking dogs and IGA
results of the affected forelimb was found.
The combined results of the comparison of mean gait variable values of the affected and
unaffected forelimb and the ROC analysis suggest that the PVF and %WD may be the
most useful gait variables to identify forelimb lameness. The utility of PVF for the
detection of forelimb lameness had been reported before by others.5,8,23
The
discriminatory power of PVF is remarkable because PVF is not a normalized variable and
at walk is mostly a function of body weight14
which had a wide range in this study. The
superior discriminatory power of %WD compared with PVF was expected, because in
walking dogs %WD is independent of body weight and the same for dogs with different
body weight.14

36
In this dataset TSVs and KMVs did not appear to facilitate the differentiation between
sound dogs and dogs with forelimb lameness. This is surprising because decrease of
stance phase and swing phase duration, as well as changes in joint angles have been
mentioned as lameness criteria for OGA.1,2
Both TSVs and KMVs were not normalized,
as normalization techniques for these variables, except for step length, have not been
reported. The lack of normalization may be a major factor why TSVs and KMVs are not
discriminatory in this study. Even though no quantitative differences in mean peak
extension, mean peak flexion and mean ROM were found, qualitative evaluation of the
graphic evaluations of the joint angle changes during the gait cycle (Fig. 2) revealed
shape differences when curves of affected and unaffected joints, suggesting that even
though a significant difference was not detected, subtle changes are present. These
differences may signify differences in timing or in amplitude of activation of one or more
muscles in the joint angles of interest. Thus, present quantitative analysis techniques of
joint angles during locomotion may be insufficient to detect actual differences. Clearly,
further studies will be needed to determine the full effect of lameness on TSVs and
KMVs.
The lack of discriminatory power of SIs was also unexpected. Firstly, although it only has
been demonstrated for SIs of KVs, it is assumed that the SI of gait variables is
independent of body weight and velocity..13
Thus, one would expect that the SI would be
an excellent variable to detect lameness. Secondly, asymmetry has been mentioned as a
lameness criterion with OGA, and other workers reported a very high AUC and
sensitivity for the SIs of PVF and other KVs in dogs with hind limb lameness due to CCL

37
rupture.15
A possible explanation for the differences between the results of that study and
the present one may be due to the mild lameness of the patients in this study compared
with the studies with hind limb lameness due to RCCL. The relationship between limb
function and SI is non-linear, thus it indeed may be that more severe lameness will be
relatively more detectable. It also may be that shifting of the body weight to the hind limb
in the patients of the present study limited the increase of the SIs of forelimb gait
variables. The effect of lameness severity on the weight distribution among the four limbs
and on utility of the SI should be further explored.
In essence, IGA is a sophisticated way of recording phenomena that are also evaluated
and observed with OGA. With both techniques loading and unloading of limbs (kinetic
variables), timing (temporo-spatial variables), and joint angles (kinematic analysis) are
evaluated. In this study, the highest correlation was found between mean lameness score
during walking and the IGA variables PVF-SI (0.65), %WD-SI (0.65), stance phase
duration-SI (0.64), and swing phase duration-SI (0.65). Thus, in dogs with forelimb
lameness evaluated using OGA asymmetry may be the most important visual cue. This is
consistent with work from other workers reporting a moderate correlation between
observational lameness scores and SIs of kinetic variables in dogs with hindlimb
lameness.12
A major limitation of this study is the limited number of enrolled dogs. An initial power
calculation suggested that 20 dogs would be sufficient for this study, but a follow-up
power calculation indicated that a population of 50 dogs would be necessary to

38
adequately evaluate all KV, TSP and KMV values. Such a study is in progress. Another
limitation is that most dogs exhibited only mild to moderate (grade 0 – 2) forelimb
lameness. As suggested above, this may have affected the interpretation of asymmetry
with the SIs. In future studies we will try to include cases with a wider range of lameness
severity.
This study is significant because it is the first study simultaneously evaluating KVs,
TSVs and KMVs in canine lameness and the first study evaluating naturally-occurring
canine forelimb lameness with the aid of IGA. The results suggest that in walking
individual dogs PVF, and %WD are the most important variables for identification of
forelimb lameness. Even though the study has a relatively small number of enrolled dogs,
the results give important insights in gait variable changes associated with forelimb
lameness, identify weaknesses in the present approach to IGA of individual patients, and
will provide guidance for future studies focused on gait analysis of individual dogs.
39
References
1. Sumner Smith G. Gait analysis and orthopedic examination. In: Textbook of Small
Animal Surgery.Vol 2. 2nd ed. Philadelphia: W.B. Saunders; 1993:1577–1586.
2. Newton CD, Nunamaker DM. Gait and Gait Analysis In: Textbook of small animal
orthopaedics. Philadelphia: Lippincott; 1985: 1084-87.
3. Quinn MM, Keuler NS, Lu Y, et al. Evaluation of agreement between numerical rating
scales, visual analogue scoring scales, and force plate gait analysis in dogs. Vet Surg VS
2007;36:360–367.
4. Waxman AS, Robinson DA, Evans RB, et al. Relationship between objective and
subjective assessment of limb function in normal dogs with an experimentally induced
lameness. Vet Surg 2008;37:241–246.
5. Kim J, Breur GJ. Temporospatial and kinetic characteristics of sheep walking on a
pressure sensing walkway. Can J Vet Res 2008;72:50–55.
6. Marsolais GS, McLean S, Derrick T, et al. Kinematic analysis of the hind limb during
swimming and walking in healthy dogs and dogs with surgically corrected cranial
cruciate ligament rupture. J Am Vet Med Assoc 2003;222:739–743.
7. Drüen S, Böddeker J, Meyer-Lindenberg A, et al. Computer-based gait analysis of
dogs: Evaluation of kinetic and kinematic parameters after cemented and cementless total
hip replacement. Vet Comp Orthop Traumatol VCOT 2012;34:445-449
8. Budsberg SC, Jevens DJ, Brown J, et al. Evaluation of limb symmetry indices, using
ground reaction forces in healthy dogs. Am J Vet Res 1993;54:1569–1574.

40
9. Torres BT, Moëns NMM, Al-Nadaf S, et al. Comparison of overground and treadmill-
based gaits of dogs. Am J Vet Res 2013;74:535–541.
10. Fanchon L, Valette J-P, Sanaa M, et al. The measurement of ground reaction force in
dogs trotting on a treadmill: an investigation of habituation. Vet Comp Orthop Traumatol
2006;19:81–86.
11. Kim J, Rietdyk S, Breur GJ. Comparison of two-dimensional and three-dimensional
systems for kinematic analysis of the sagittal motion of canine hind limbs during walking.
Am J Vet Res 2008;69:1116–1122.
12. Oosterlinck M, Bosmans T, Gasthuys F, et al. Accuracy of pressure plate kinetic
asymmetry indices and their correlation with visual gait assessment scores in lame and
nonlame dogs. Am J Vet Res 2011;72:820–825.
13. Voss K, Galeandro L, Wiestner T, et al. Relationships of body weight, body size,
subject velocity, and vertical ground reaction forces in trotting dogs. Vet Surg
2010;39:863–869.
14. Alshehabat MA. Instrumented gait analysis to characterize pelvic limb ataxia in dogs.
Purdue University Thesis 2012.
15. Evans R, Horstman C, Conzemius M. Accuracy and optimization of force platform
gait analysis in Labradors with cranial cruciate disease evaluated at a walking gait. Vet
Surg 2005;34:445–449.
16. Elmore M. Application of kinetic criteria to define lameness in individual dog. Phi
Zeta Day Purdue University 2013.

41
17. Holler PJ, Brazda V, Dal-Bianco B, et al. Kinematic motion analysis of the joints of
the forelimbs and hind limbs of dogs during walking exercise regimens. Am J Vet Res
2010;71:734–740.
18. Kapatkin AS, Arbittier G, Kass PH, et al. Kinetic gait analysis of healthy dogs on two
different surfaces. Vet Surg 2007;36:605–608.
19. Light VA, Steiss JE, Montgomery RD, et al. Temporal-spatial gait analysis by use of
a portable walkway system in healthy Labrador Retrievers at a walk. Am J Vet Res
2010;71:997–1002.
20. Goslow GE Jr, Seeherman HJ, Taylor CR, et al. Electrical activity and relative length
changes of dog limb muscles as a function of speed and gait. J Exp Biol 1981;94:15–42.
21. Carr JG, Millis DL, Weng H-Y. Exercises in canine physical rehabilitation: range of
motion of the forelimb during stair and ramp ascent. J Small Anim Pract 2013;54:409–
413.
22. Abdelhadi J, Wefstaedt P, Galindo-Zamora V, et al. Load redistribution in walking
and trotting Beagles with induced forelimb lameness. Am J Vet Res 2013;74:34–39.
23. Kim J, Kazmierczak KA, Breur GJ. Comparison of temporospatial and kinetic
variables of walking in small and large dogs on a pressure-sensing walkway. Am J Vet
Res 2011;72:1171–1177.
42
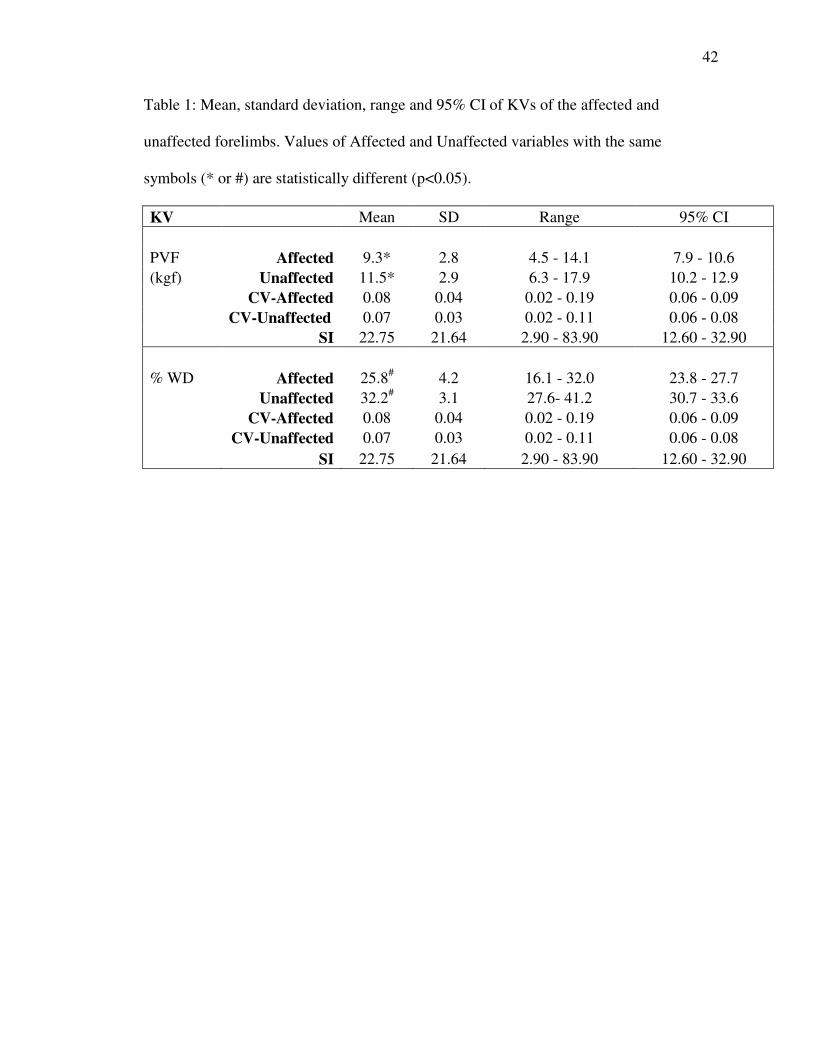
Table 1: Mean, standard deviation, range and 95% CI of KVs of the affected and
unaffected forelimbs. Values of Affected and Unaffected variables with the same
symbols (* or #) are statistically different (p<0.05).
KV Mean SD Range 95% CI
PVF Affected 9.3* 2.8 4.5 - 14.1 7.9 - 10.6
(kgf) Unaffected 11.5* 2.9 6.3 - 17.9 10.2 - 12.9
CV-Affected 0.08 0.04 0.02 - 0.19 0.06 - 0.09
CV-Unaffected 0.07 0.03 0.02 - 0.11 0.06 - 0.08
SI 22.75 21.64 2.90 - 83.90 12.60 - 32.90
% WD Affected 25.8# 4.2 16.1 - 32.0 23.8 - 27.7
Unaffected 32.2# 3.1 27.6- 41.2 30.7 - 33.6
CV-Affected 0.08 0.04 0.02 - 0.19 0.06 - 0.09
CV-Unaffected 0.07 0.03 0.02 - 0.11 0.06 - 0.08
SI 22.75 21.64 2.90 - 83.90 12.60 - 32.90
43
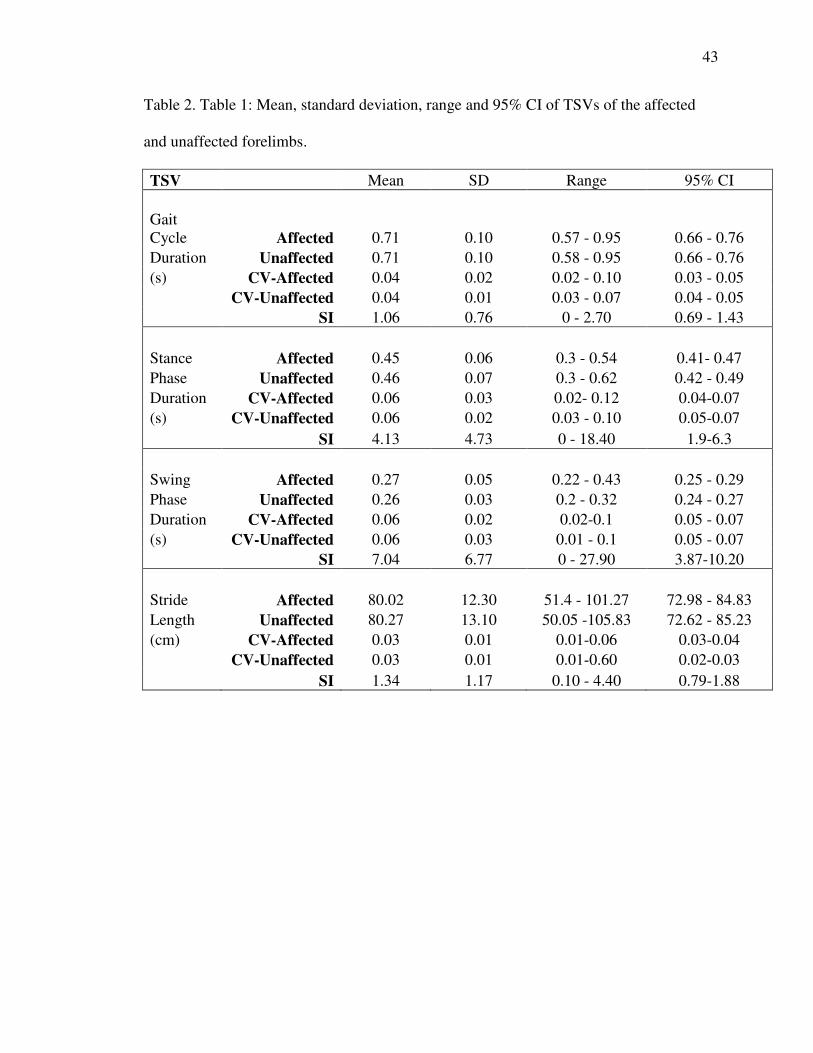
Table 2. Table 1: Mean, standard deviation, range and 95% CI of TSVs of the affected
and unaffected forelimbs.
TSV Mean SD Range 95% CI
Gait
Cycle Affected 0.71 0.10 0.57 - 0.95 0.66 - 0.76
Duration Unaffected 0.71 0.10 0.58 - 0.95 0.66 - 0.76
(s) CV-Affected 0.04 0.02 0.02 - 0.10 0.03 - 0.05
CV-Unaffected 0.04 0.01 0.03 - 0.07 0.04 - 0.05
SI 1.06 0.76 0 - 2.70 0.69 - 1.43
Stance Affected 0.45 0.06 0.3 - 0.54 0.41- 0.47
Phase Unaffected 0.46 0.07 0.3 - 0.62 0.42 - 0.49
Duration CV-Affected 0.06 0.03 0.02- 0.12 0.04-0.07
(s) CV-Unaffected 0.06 0.02 0.03 - 0.10 0.05-0.07
SI 4.13 4.73 0 - 18.40 1.9-6.3
Swing Affected 0.27 0.05 0.22 - 0.43 0.25 - 0.29
Phase Unaffected 0.26 0.03 0.2 - 0.32 0.24 - 0.27
Duration CV-Affected 0.06 0.02 0.02-0.1 0.05 - 0.07
(s) CV-Unaffected 0.06 0.03 0.01 - 0.1 0.05 - 0.07
SI 7.04 6.77 0 - 27.90 3.87-10.20
Stride Affected 80.02 12.30 51.4 - 101.27 72.98 - 84.83
Length Unaffected 80.27 13.10 50.05 -105.83 72.62 - 85.23
(cm) CV-Affected 0.03 0.01 0.01-0.06 0.03-0.04
CV-Unaffected 0.03 0.01 0.01-0.60 0.02-0.03
SI 1.34 1.17 0.10 - 4.40 0.79-1.88

44
Table 3 Table 1: Mean, standard deviation, range and 95% CI of KMVs of the affected
and unaffected forelimbs. Values of Affected and Unaffected variables with the same
symbols are statistically different (p<0.05).
KMV Mean SD Range 95% CI
Carpus - Affected 182.6 4.4 174.5 - 193.7 180.5 - 184.6
Peak Unaffected 179.8 9.6 147.7 - 192.2 175.2 - 184.4
extension CV-Affected 0.01 0.01 0 - 0.02 0 - 0.01
CV-Unaffected 0.02 0.01 0 - 0.04 0.02- 0.05
SI 3.8 5.2 0.1 - 22.2 1.4-6.3
Carpus - Affected 109.3 13.1 85 - 137.6 103.2 - 115.5
Peak Unaffected 108.3 13. 7 84.2 - 128.8 101.9 - 114.7
flexion CV-Affected 0.04 0.02 0.01 - 0.12 0.03 - 0.05
CV-Unaffected 0.04 0.02 0 - 0.09 0.02 - 0.05
SI 8.49 5.34 1.4 - 19.2 6.0 - 11.0
Carpus - Affected 73.3 14.7 44.2 - 98.6 66.4- 80.1
ROM Unaffected 71.5 16.0 38.7 - 99.0 64.0 – 79.0
CV-Affected 0.06 0.03 0 - 0.14 0.04 - 0.07
CV-Unaffected 0.05 0.04 0.02 - 0.17 0.05 - 0.09
SI 14.5 9.0 2.0 - 34.1 10.3 - 18.7
KMV Mean SD Range 95% CI
Elbow - Affected 146.5 11.3 121.9 – 168.0 141.3 - 151.8
Peak Unaffected 147.4 7.4 133.8 - 163.2 144.0 - 150.9
extension CV-Affected 0.03* 0.02 0 - 0.07 0.02 - 0.04
CV-Unaffected 0.02* 0.01 0 - 0.05 0.01 0.02
SI 5.9 5.6 0.20 - 20.7 3.2 - 8.5
Elbow - Affected 91.1 10.9 69.8 - 111.3 86.1 - 96.2
Peak Unaffected 88.5 11.8 70.8 - 112.0 83.0 - 94.1
flexion CV-Affected 0.03 0.02 0 - .10 0.02- 0.04
CV-Unaffected 0.06 0.11 0 - 0.53 0.00 - 0.10
SI 10.1 8.3 0.1 - 30.1 6.2 – 14.0
Elbow - Affected 55.4 9.1 33.1 - 73.5 51.2 - 59.6
ROM Unaffected 58.88 10.3 38.7 - 77.2 54.1 - 63.7
45
CV-Affected 0.08 0.04 0.04 - 0.18 0.06 - 0.09
CV-Unaffected 0.08 0.10 0.01- 0.51 0.03 - 0.13
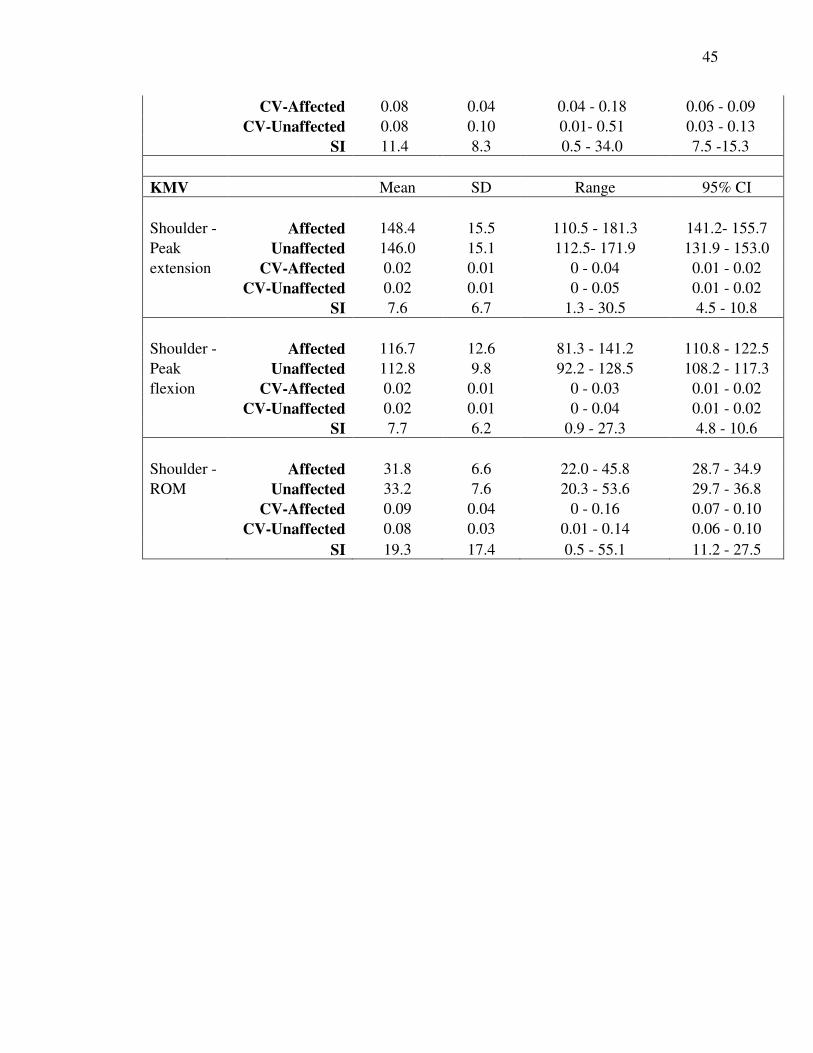
SI 11.4 8.3 0.5 - 34.0 7.5 -15.3
KMV Mean SD Range 95% CI
Shoulder - Affected 148.4 15.5 110.5 - 181.3 141.2- 155.7
Peak Unaffected 146.0 15.1 112.5- 171.9 131.9 - 153.0
extension CV-Affected 0.02 0.01 0 - 0.04 0.01 - 0.02
CV-Unaffected 0.02 0.01 0 - 0.05 0.01 - 0.02
SI 7.6 6.7 1.3 - 30.5 4.5 - 10.8
Shoulder - Affected 116.7 12.6 81.3 - 141.2 110.8 - 122.5
Peak Unaffected 112.8 9.8 92.2 - 128.5 108.2 - 117.3
flexion CV-Affected 0.02 0.01 0 - 0.03 0.01 - 0.02
CV-Unaffected 0.02 0.01 0 - 0.04 0.01 - 0.02
SI 7.7 6.2 0.9 - 27.3 4.8 - 10.6
Shoulder - Affected 31.8 6.6 22.0 - 45.8 28.7 - 34.9
ROM Unaffected 33.2 7.6 20.3 - 53.6 29.7 - 36.8
CV-Affected 0.09 0.04 0 - 0.16 0.07 - 0.10
CV-Unaffected 0.08 0.03 0.01 - 0.14 0.06 - 0.10
SI 19.3 17.4 0.5 - 55.1 11.2 - 27.5

46
Table 4. Area Under the Curve (AUC) with associated 95% CI of selected gait variables.
Variables with AUC and associated 95% CI > 0.5 are identified in bold.
Variable AUC 95% CI
KV
PVF 0.727 0.564 - 0.856
PVF-CV 0.536 0.367 - 0.699
%WD 0.922 0.793 - 0.983
TSV
Gait Cycle Duration 0.510 0.343 - 0.675
Gait Cycle Duration-CV 0.543 0.374 - 0.705
Stance Phase Duration 0.535 0.366 - 0.698
Stance Phase Duration-
CV
0.524 0.356 - 0.688
Swing Phase Duration 0.558 0.388 - 0.719
Swing Phase Duration-CV 0.511 0.344 - 0.676
Stride Length 0.525 0.357 - 0.689
Stride Length-CV 0.589 0.418 - 0.745
KMV
Carpus Peak Extension 0.537 0.373 - 0.696
Peak Extension-CV 0.675 0.509 - 0.814
Peak Flexion 0.505 0.343 - 0.667
Peak Flexion-CV 0.517 0.354 - 0.678

47
ROM 0.545 0.380 - 0.703
ROM-CV 0.583 0.416 - 0.736
Elbow Peak Extension 0.508 0.345 - 0.669
Peak Extension-CV 0.693 0.527 - 0.828
Peak Flexion 0.577 0.411 - 0.732
Peak Flexion-CV 0.515 0.352 - 0.676
ROM 0.608 0.441 - 0.758
ROM-CV 0.590 0.423 - 0.743
Shoulder Peak Extension 0.532 0.368 - 0.692
Peak Extension-CV 0.545 0.380 - 0.703
Peak Flexion 0.607 0.441 - 0.758
Peak Flexion-CV 0.500 0.338 - 0.662
ROM 0.545 0.380 - 0.703
ROM-CV 0.552 0.387 - 0.710

48
Figure 1: Graphic representation of joint angle changes during the gait cycle. Example is
a dog with severe forelimb lameness (grade 3 walk, grade 4 trot). Note curve differences
between joints. Graphs in the left column are from the left (affected) forelimb and graphs
in the right column are from the right (unaffected) forelimb.
49
CHAPTER 4: CONCLUSIONS, SIGNIFICANCE, FUTURE DIRECTIONS
The purpose of the research in this thesis was to characterize kinetic and kinematic
variables of dogs with forelimb lameness, and to discriminate lame from sound individual
dogs using a set of normal ranges, previously established in our laboratory.
The combined results of the comparison of mean gait variable values of the affected and
unaffected forelimb and the ROC analysis suggest that forelimb lameness is mostly
characterized by decreased PVF and %WD, and that therefore these variables may be
useful gait variables to identify forelimb lameness.
This is the first study evaluating cut-off values based on normal ranges. The normal
ranges used in this study were previously established in our laboratory. They were
derived from IGA data from 90 sound walking dogs of different body shape, body size
and body weight (1.5 - 60 kg) and based on the 95% CI of the mean of the gait variables.
The sensitivity and specificity of the normal ranges of gait variables used to detect
forelimb lameness in the data set of this study was determined and found to be less than
55% and 75% respectively (see Appendix). Thus, this analysis suggested that normal
ranges based on the 95% CI of the mean are not suitable for the detection of lameness.

50
Because the intended approach did not provide the robust criteria to discriminate dogs
with forelimb lameness from sound dogs, cut-off values using the gait data of the receiver
operating characteristics (ROC) analysis were established. Based on AUC, only PVF
(AUC 0.73, CI 0.564 - 0.856), %WD (AUC 0.92, CI 0.793 - 0.983), peak extension of the
carpus (AUC 0.68, CI 0.509 - 0.814) and peak extension of the elbow (AUC 0.69, CI
0.527 - 0.828) had discriminatory ability and only the AUC for PVF and %WD were
greater than 0.70. Cut off values for PVF (≤10.6; sensitivity 70% specificity 75%)
and %WD (≤29.7; sensitivity 90% specificity 85%) to be used to discriminate between
lame and sound individual walking dogs were determined.
In this study, the highest correlation was found between mean lameness score during
walking and the IGA variables PVF-SI (0.65), %WD-SI (0.65), stance phase duration-SI
(0.64), and swing phase duration-SI (0.65). This may suggest that asymmetry is the most
significant visual cue used for OGA. This moderate correlation is similar to other studies
and may reflect the lack of definitive criteria linking the two methods.
The significance of this study is that it is the first study to simultaneously evaluate KVs,
TSVs and KMVs in lame dogs. It is also the first time that forelimb lameness was
characterized using IGA and the provided cut-off values may be an important step
towards establishing robust criteria to discriminate lame from sound walking dogs.
This study has identified the need for areas of future study. The first and foremost
remains the need to refine the set of normal ranges. This will need to be done by
51
continually adding to the current set of normal dogs. Once the normal ranges have been
solidified they may be used to help compile a range of normal values that could be used
widely for gait analysis at multiple institutions. Cut off values could be performed, as in
this study, to provide a system of checking the normal ranges and comparing specificity
and sensitivity of the two systems. Ultimately, this could provide a standardized way to
analyze gait and could help make the challenging process of lameness detection that
much easier.

APPENDIX

52
APPENDIX
The purpose of the research in this thesis was to characterize kinetic and kinematic
variables in dogs with forelimb lameness, and to discriminate lame from sound individual
dogs using a set of previously established normal ranges. These normal ranges were
derived from 90 normal dogs of different body weight, body shape and body size and
were based on the 95% CI of the mean of the analyzed gait variables. The body weight of
these dogs ranged from 1.5-60 kg.
The sensitivity and specificity of the normal values of gait variables used to detect
forelimb lameness in the data set of the study group of Chapter 3 was determined and
found to be less than 53% and 70% respectively. Thus, this analysis suggested that
normal ranges based on the 95% CI of the mean are not suitable for the detection of
lameness. The results are summarized in Table 1, 2 and 3 of the Appendix.
Because our intended approach did not provide the robust criteria to discriminate dogs
with forelimb lameness from sound dogs, we established cut-off values using receiver
operating characteristics (ROC) analysis. The data of that study are presented in Chapter
3.

53
Table 1a. Sensitivity and specificity of normal ranges for being able to detect forelimb
lameness using KVs.
KV Normal Range Sensitivity
(Affected
Limb)
Specificity
(Unaffected
Limb)
PVF Based on BW 0.05 1
PVF - SI 4.17-18.17 0.05
% WD 25.37 – 34.23 0.45 1

54
Table 1b. Sensitivity and specificity of normal ranges for being able to detect forelimb
lameness using TSVs.
TSV Normal Range Sensitivity
(Affected
Limb)
Specificity
(Unaffected
Limb)
GCD 0.042 – 0.048 0.53 0.53
GCD- SI 0.606 – 0.94
0.32
Stance 0.05 – 0.058 0.25 0.75
Stance SI 1.266 – 2.072
0.3
Swing 0.053 - 0.06 0.55 0.6
Swing SI 2.153 – 3.649
0.25
Stride
0.03 – 0.034
0.25 0.65
Stride SI 0.658 – 1.104 0.3

55
Table 1c. Sensitivity and specificity of normal ranges for being able to detect forelimb
lameness using KMVs.
KMV Normal Range Sensitivity
(Affected
Limb)
Specificity
(Unaffected
Limb)
Shoulder Extension 149.47 – 155.09
Shoulder Flexion 119.92 – 124.38
Shoulder Range of Motion 28.67 – 31.58 0.4 0.7
Elbow Extension 145.55 – 149.38
Elbow Flexion 91.67 – 95.57
Elbow Range of Motion 52.38 – 55.31 0.25 0.75
Carpus Extension 181.76 – 184.60
Carpus Flexion 105.70 – 110.36
Carpus Range of Motion 72.96 – 79.07 0.5 0.5

VITA

56
VITA
Jennifer Carr received her Bachelor of Science degree from the University of Delaware in
2004. She then attended veterinary school at North Carolina State University, graduating
in 2008. She completed a rotating Internship in Small Animal Medicine and Surgery in
2009 at Texas A&M University. Following the completion of her internship, she
completed a surgical internship in Dallas in 2010 and an orthopedic fellowship in 2011.
She began a small animal surgery residency at Purdue University in 2011.