trabecular architecture in the forelimb epiphyses of
TRANSCRIPT

RESEARCH Open Access
Trabecular architecture in the forelimbepiphyses of extant xenarthrans(Mammalia)Eli Amson1,2* , Patrick Arnold3, Anneke H. van Heteren4, Aurore Canoville5 and John A. Nyakatura1,2
Abstract
Background: Bone structure has a crucial role in the functional adaptations that allow vertebrates to conduct theirdiverse lifestyles. Much has been documented regarding the diaphyseal structure of long bones of tetrapods.However, the architecture of trabecular bone, which is for instance found within the epiphyses of long bones, andwhich has been shown experimentally to be extremely plastic, has received little attention in the context of lifestyleadaptations (virtually only in primates). We therefore investigated the forelimb epiphyses of extant xenarthrans, theplacental mammals including the sloths, anteaters, and armadillos. They are characterised by several lifestyles anddegrees of fossoriality involving distinct uses of their forelimb. We used micro computed tomography data toacquire 3D trabecular parameters at regions of interest (ROIs) for all extant genera of xenarthrans (with replicates).Traditional, spherical, and phylogenetically informed statistics (including the consideration of size effects) were usedto characterise the functional signal of these parameters.
Results: Several trabecular parameters yielded functional distinctions. The main direction of the trabeculaedistinguished lifestyle categories for one ROI (the radial trochlea). Among the other trabecular parameters, it is thedegree of anisotropy (i.e., a preferential alignment of the trabeculae) that yielded the clearest functional signal. Forall ROIs, the armadillos, which represent the fully terrestrial and fossorial category, were found as characterised by agreater degree of anisotropy (i.e., more aligned trabeculae). Furthermore, the trabeculae of the humeral head of themost fossorial armadillos were also found to be more anisotropic than in the less fossorial species.
Conclusions: Most parameters were marked by an important intraspecific variability and by a size effect, whichcould, at least partly, be masking the functional signal. But for some parameters, the degree of anisotropy inparticular, a clear functional distinction was recovered. Along with data on primates, our findings suggest that atrabecular architecture characterised by a greater degree of anisotropy is to be expected in species in which therelevant epiphyses withstand a restricted range of load directions. Trabecular architecture therefore is a promisingresearch avenue for the reconstruction of lifestyles in extinct or cryptic species.
Keywords: Anisotropy, Bone, Epiphysis, Forelimb, Fossoriality, Functional adaptation, Mammals, Primates, Trabeculararchitecture, Xenarthra
* Correspondence: [email protected] Morphologie und Formengeschichte, Institut für Biologie, HumboldtUniversität zu Berlin, Philippstraße 13, 10115 Berlin, Germany2Bild Wissen Gestaltung. Ein Interdisziplinäres Labor, Humboldt Universität zuBerlin, Sophienstraße 22a, 10178 Berlin, GermanyFull list of author information is available at the end of the article
© The Author(s). 2017 Open Access This article is distributed under the terms of the Creative Commons Attribution 4.0International License (http://creativecommons.org/licenses/by/4.0/), which permits unrestricted use, distribution, andreproduction in any medium, provided you give appropriate credit to the original author(s) and the source, provide a link tothe Creative Commons license, and indicate if changes were made. The Creative Commons Public Domain Dedication waiver(http://creativecommons.org/publicdomain/zero/1.0/) applies to the data made available in this article, unless otherwise stated.
Amson et al. Frontiers in Zoology (2017) 14:52 DOI 10.1186/s12983-017-0241-x

BackgroundFunctional adaptations of bone structure reflect the life-style of vertebrates. Among tetrapods, the structure oflong bones’ midshaft was primarily studied, and clear pat-terns, related to the aquatic or aerial environments for in-stance, were recognised (e.g., [1–4]). In comparison, andin the context of lifestyle adaptations, trabecular architec-ture has received little attention. Trabeculae are bonystruts forming a lattice-like structure within skeletal ele-ments. Also called spongy bone or cancellous bone, tra-beculae are commonly found at the articular ends of longbones (epiphyses), where they form the core of the skeletalelement [5]. It was shown experimentally that trabecularbone adjusts accurately and sensitively throughout life tothe loads applied to the bone, as part of the ‘bone func-tional adaptation’, commonly referred to as ‘Wolff ’s law’(e.g., [6]; for a review see [7]). Trabecular parameters suchas the number of trabeculae, their mean thickness, or theirmain direction of orientation (i.e., their anisotropy), hencehave the potential to be highly insightful regarding thefunctional adaptations of a particular skeletal element.Comprising diverse archosaurs (mostly birds) and mam-
mals, the analysis of three-dimensional (3D) trabeculararchitecture with the largest taxonomic sampling was per-formed by Doube et al. [8], which was dedicated to thestudy of allometry (for a precursor study, see [9]; for atwo-dimensional analysis, see [10]). The study of earlyontogenetic stages in various taxa (horses and cow, [11];dog, [12]; human, [13]) has provided insightful elementsregarding the development of bone structure in relation totheir different life histories. Experimental analyses usednon-primate taxa (guinea fowl, [14]; potoroo, [15]; sheep,[6, 16]; mouse, [17, 18]; rabbit, [19]; dog, [20]) in order totest assumptions regarding bone functional adaptation.Almost all comparative functional analyses of 3D trabecu-lar structure, however, were investigated in primates,which allowed compelling palaeoanthropological infer-ences, related for instance to bipedality [21] or tool use[22]. An exception focuses on horses and extinct relatives[23] but is mostly descriptive and did not analyse the 3Dstructure of the trabeculae. Chirchir [24] did include twocarnivoran species in the dataset, but only investigated tra-becular mass. Most recently, Mielke et al. (under review)investigated the 3D trabecular architecture in the femoralhead of sciuromorphs (squirrels and close relatives), anddid find significant differences among the lifestyle categor-ies recognised therein. Extending our knowledge aboutnon-primate taxa will be necessary to reach a broader un-derstanding of trabecular architecture mechanical proper-ties and function. The forelimb of xenarthrans offers aparticularly appealing framework for that endeavour, as itcomprises clear-cut differences in its functional use.The most common approach to study 3D trabecular
architecture is to define a region of interest (ROI) and
describe quantitatively the trabecular bone that it com-prises using various parameters (e.g., [25]; but see alter-native whole epiphysis/bone approach [26] or ‘movingcube method’ [27]). Although not commonly acquired,one of these parameters is the main direction of anisot-ropy, which corresponds to the main orientation of thetrabeculae (e.g., [28]).The latter is a fairly good proxy forthe principal compressive strain (or principal load), atleast in a cantilever-like loaded bone (e.g., calcanei ofpotoroo [15]; carpal/tarsal joints of sheep [6]; knee jointof the guinea fowl [14]). But counter-examples exist forbones loaded in a more complex way [29], and extremepositions (e.g., squatting in humans [30, 31]) might havea preponderant influence. Nevertheless, the main orien-tation of the trabeculae having furthermore successfullydiscriminated between primate locomotor types [32], wecan assume that the comparison of the main direction oftrabecular anisotropy among taxa having various uses oftheir limbs likely is of great relevance. The quantitativeanalysis of 3D trabecular architecture in general, and thedirection of trabecular anisotropy in particular, has todate been conducted in relatively few taxa, but offeredvaluable insight into the functional significance of tra-becular morphology. We therefore consider it as apromising avenue for research focused on comparativeand evolutionary aspects of vertebrate morphology.Not only the xenarthrans are viewed as representing
one of the four primary placental clades [33], but theirlifestyles are also outstanding, involving classical exam-ples of functional adaptations. Some of the most prom-inent of these, the focus of this work, are those thatconcern the forelimb. Indeed, each of the main extantxenarthran clades, namely sloths (Tardigrada), anteaters(Vermilingua), and armadillos (Cingulata) (Fig. 1), fea-tures a highly distinct forelimb use. Armadillos representa textbook example of scratch-digging adaptation (e.g.,[34]). Their digging skills were previously classified intothree categories [35, 36], which can be abbreviated as‘least fossorial (mainly cursorial)’ (category 1), ‘often dig,but digging not essential to their alimentation’ (category2), and ‘burrowers and ant or termite eaters’ (category3). However, it was recently documented that Tolypeutes(three-banded armadillo), which was classified as theleast fossorial (category 1), is actually a burrower [37],emphasizing that all extant armadillos should be consid-ered as efficient diggers. Armadillos’ forelimb posture is,to our knowledge, not well documented, but they areoften regarded as unguligrade (Tolypeutes, Priodontes,the giant armadillo; see [38]) to sub-unguligrade (sensu[39]) for Dasypus (long-nosed armadillo) for instance(see tracks in [40]).Anteaters practice a unique digging style, the so-called
hook-and-pull [34, 41], well documented in Myrmeco-phaga (giant anteater) and Tamandua (lesser anteater;
Amson et al. Frontiers in Zoology (2017) 14:52 Page 2 of 17

[34, 41]). Cyclopes (the silky anteater) seems to perform,at least partly, an analogous motion, as it uses its fore-limb, especially its large claw, to pierce branches (Mont-gomery (1983) in [42]). Myrmecophaga sports a uniqueforelimb posture involving a vertical position of themanus and the transfer of the ground reaction force byflexed phalanges, approaching the ‘knuckle-walking’practiced in chimpanzees and gorillas [43]. In contrast,Tamandua and Cyclopes both use another unique pos-ture, the inverted-hand, during which the weight is es-sentially borne by the ulnar side of the hand (personalobservations and [38] for Tamandua; [43] for Cyclopes).All anteaters are capable climbers (even Myrmecophaga,[44]). Although never quantified, we here view the ant-eaters’ forelimb as of intermediate mobility, i.e., involvedin a greater range of movements than the armadillos,but not reaching the extreme mobility of sloths.Extant sloths, or “tree sloths” comprise two genera,
Bradypus (three-toed sloth) and Choloepus (two-toedsloth). The latter is assumed to be more closely relatedto the “ground sloths”; [45, 46]), so their numerous ad-aptations to a fully arboreal lifestyle and suspensory pos-ture are assumed to be convergently acquired [47–49].While there are some differences in the locomotion of
the two genera of sloths ([48, 50], for further referencessee [51]), we will assume that their common suspensoryposture involves similar movements and constraints, i.e.,a highly mobile limb mostly loaded in tension with vari-ous loading directions.These basic differences among the main clades of
xenarthrans allow us to hypothesise clear differences inthe loads withstood by their forelimb. In the sloths’ fore-limb, we assume that the loads are of more diverse di-rections than those of armadillos, and, in turn, that inarmadillos a main loading direction might be present(clearly greater than secondary loadings of different di-rections). We expect for the anteaters to be intermediatein that regard. The strenuous burrowing habits of arma-dillos have been suggested to be reflected in several pe-culiarities of their postcranium including but not limitedto the presence of xenarthrales [52]. We thereforehypothesize a distinct main loading direction (involvinglesser importance for the other loading directions) tooccur in the forelimbs of armadillos. Nevertheless, it isnoteworthy that anteaters, especially Myrmecophaga, arecapable of striking extremely strong blows with the fore-limb [53]. It is in this framework that we will interpretthe differences (if any) among the trabecular parameters
0
Ma
10
20
30
40
50
60
70
Zanclean
Maastrichtian
Danian
Selandian
Thanetian
Ypresian
Lutetian
Bartonian
Priabonian
Rupelian
Chattian
Aquitanian
Burdigalian
Langhian
Serravallian
Tortonian
Messinian
Upper
Paleocene
Eocene
Oligocene
Miocene
Pliocene
Pleistocene
Cre
tace
ous
Pal
eoge
neN
eoge
neQ
uat.
Dasyp
us n
ovem
cinctu
s
Dasyp
us hy
bridu
s
Euphr
actu
s sex
cinctu
s
Chaet
ophr
actu
s villo
sus
Zaedy
us p
ichiy
Chaet
ophr
actu
s vell
eros
us
Chlam
ypho
rus t
runc
atus
Calypt
ophr
actu
s ret
usus
Priodo
ntes
max
imus
Tolyp
eute
s tric
inctu
s (F1)
Cabas
sous
tato
uay
Tam
andu
a te
trada
ctyla
Myr
mec
opha
ga tr
idacty
la
Cyclop
es d
idacty
lus
Choloe
pus d
idacty
lus
Brady
pus t
orqu
atus
B. var
iegat
us
Cingulata Vermilingua Tardigrada
F2 F3
Fig. 1 Timetree including the species herein sampled (data from Gibb et al. [77]). The lifestyle categories (fully arboreal sloths, intermediateanteaters, and fully terrestrial and fossorial armadillos) and fossorial categories (F1, F2, and F3 for least, intermediate, and highly fossorial,respectively) are represented with coloured polygons
Amson et al. Frontiers in Zoology (2017) 14:52 Page 3 of 17

within regions of interest of the main epiphyses of theforelimb of armadillos, anteaters, and sloths.
MethodsSpecimens and functional categoriesOnly skeletally mature individuals, i.e., in which the epi-physeal (growth) plate of the studied epiphysis is re-sorbed (except in the distal radius of armadillos where aremnant of internal epiphyseal line was observed as per-sisting through adulthood in some species) were sam-pled from Museum collections (see list of abbreviations).In addition, specimens with apparent bone diseases orfrom zoos (as indicated by the specimen labels) were notsampled (only one specimen probably came from a zoo,Euphractus sexcinctus ZMB_85883, but for all parame-ters it fell either within the specific range or very closeto it), as it may influence bone structure. Both right andleft limbs were sampled, as handedness (if any) was un-known (but see its possible effect on trabecular parame-ters in [54]). Similarly, both sexes were sampledindifferently. All extant genera of xenarthrans arepresent in the final dataset, and replicates were acquiredfor most sampled species, representing in total (after ex-clusion of immature specimens) 17 species and 43 speci-mens (Fig. 1, Additional file 1). We sampled the scapula,humerus, and radius. The hand was not included in theanalysis because in the elements of the smaller taxa toofew trabeculae were observed, involving the exclusion ofan important proportion of the dataset.We defined two schemes of functional categorisations
(Fig. 1). The first involves one category per main life-style, the fully arboreal sloths, intermediate anteaters,and fully terrestrial and fossorial armadillos. The secondscheme, which only concerns the armadillos, involvesthree previously defined fossorial categories (see aboveand [35, 36]): category 1, the least fossorial three-bandedarmadillo Tolypeutes (but see [37]), category 2, an inter-mediate category comprising the Dasypodidae andEuphractinae, and category 3, the highly fossorial arma-dillos comprising the Chlamyphorinae and Tolypeutinaeexcept Tolypeutes. Both lifestyle and fossorial categorieswill be commonly referred to as functional categories.As defined here, these categories are either perfectly(lifestyle categories) or almost perfectly (fossorial cat-egories) matching phylogeny, i.e., neither lifestyles norfossoriality are represented by several convergent acqui-sitions (except in the two genera of sloths where an ar-boreal lifestyle was most likely acquired independently).This results in the fact that, strictly speaking, one cannotseparate a functional feature of one of the categoriesfrom a phylogenetic attribute (in other words, functionaland phylogenetic effects cannot be distinguished). How-ever, given the extreme sensitivity and plasticity of thetrabecular bone (e.g., [6, 55]), and given that Doube et
al. [8] did find that among their large dataset of amni-otes the phylogeny bore only minor influence on tra-becular parameters, we expect that the phylogeneticrelationships among xenarthrans will not conspicuouslyinfluence their trabecular architecture. Obtaining a sig-nificant phylogenetic signal (as defined by Blomberg etal. [56]) and observing a pattern in the traits’ distributionthat cannot obviously be attributed to functional differ-ences (i.e., within a functional category closely relatedspecies would be more similar to each other than toother species) would invalidate this hypothesis. That iswhy we tested for the presence of a phylogenetic signalwithin subsamples consisting of individual functionalcategories (see below).
Data acquisitionAll specimens were scanned using micro computed tom-ography (μCT) [Tomoscope Synergy Twin, ExperimentalRadiology Lab, Institute of General and InterventionalRadiology, Jena University Hospital; phoenix|X-rayNanotom m, Zoologische Staatssammlung München;phoenix∣X-ray v∣tome∣x s 240, Steinmann-Institut,Bonn; all Germany], with a resolution of 17–97 μm(mostly depending on the size of the object; see resolu-tions in Additional file 1). Differences in the resolutioncan influence the calculation of the trabecular parame-ters ([57] and references therein), hence our assessmentof the relative resolution, as explained below. In eachcase, the quality of the scans (resolution and contrast)was checked visually before and after the ROI extractionand thresholding (see below). Greyscale 16-bits stackswere hence obtained and processed with the Fiji package[58], a combination of ImageJ (in this case ImageJ2 v.1.51 g) and plugins [59, 60]. Quality assessment of thescans was done after the acquisition of the trabecular pa-rameters (because two of them are necessary to do so,the Connectivity and trabecular mean thickness (Tb.Th),see below). The number of specimens eventually ana-lysed (after this quality assessment) for some taxa is ra-ther low (Table 1), with a mean number of specimensper genus of 3.1, which can be viewed as a limitation ofthe present study.Successive ‘Re-slicing’ routines and in some cases
image flip were used to place all bones in the samestandard orientation: mediolateral in the X-axis, medialtowards the left of the image; anteroposterior in the Y-axis, anterior towards the top of the image; and proxi-modistal in the Z-axis, proximal towards the top of thestack. The scapula was oriented so that the greaterlength of glenoid cavity (from the side bordered by thepostscapular fossa to the side of the coracoid process)would be aligned on the Y-axis (anterior towards the topof the image), and lesser length (from subscapularborder to the scapular spine border) would be aligned
Amson et al. Frontiers in Zoology (2017) 14:52 Page 4 of 17

on the X-axis (medial towards left; see orientation of 3Dmodel in the Additional file 2). For the humerus, thehead was set to face downward (maximal curvature ofthe head is normal to the Y-axis), and the centres of theproximal and distal metaphyses were aligned on the Z-axis (proximal towards the top of the stack; see
Additional file 3). For the radius, the greatest mediolat-eral length of the distal trochlea was aligned on the X-axis, posterior side facing downward, and, as for the hu-merus, the centres of the proximal and distal metaphyseswere aligned on the Z-axis (see Additional file 4).The rest of the procedure was performed with the
BoneJ plugin [61]. Cubic ROIs were selected with the‘Fit Sphere’ routine, so that the largest cube included inthe sphere (referred to as ‘Inner Cube’ in the plugin)would be as large as possible but without including cor-tical bone. This acquisition of the ‘bulk’ of the trabeculaein the epiphyses was favoured over other methods in-volving a constant or scaled ROI volume (e.g., [25]), inorder to sample as much trabeculae as possible, whichwas necessary for the epiphyses of small-sized xenar-thrans that comprise a very limited number of trabecu-lae. Therefore, in order to sample functionally analogousregions in all species, this was applied across the wholedataset. For the glenoid cavity (scapula), this ROI wasplaced just proximal to the articular surface, and medio-laterally and anteroposteriorly centred relative to thecavity (Fig. 2a; Additional file 2). For the humerus, theproximal and distal ROIs were respectively centred inthe head and capitulum (Fig. 2b and c, respectively;Additional file 3). The proximal ROI of the radius wasplaced just distal to the proximal articular surface, andmediolaterally and anteroposteriorly centred relative tothe head (Fig. 2d; Additional file 4). The distal ROI ofthe radius was placed just proximal to middle of thetrochlea (the latter being strongly inclined in some taxa;Fig. 2e; Additional file 4).The extracted ROI (a cubic substack) was thresholded
with the ‘Optimise Threshold > Threshold Only’ routine.After purification of the substack (‘Purify’ routine), thecorresponding routines of BoneJ were then used tomeasure ten trabecular parameters, namely the degree ofanisotropy (DA), main direction of the trabeculae (hereincalled MDT; see also Mielke et al. (under review)), theConnectivity (only used for the scan quality assessment)and connectivity density (Conn.D), bone volume (BV),total volume of the ROI (TV), trabecular mean thickness(Tb.Th), trabecular mean spacing (Tb.Sp), bone surfacearea (BS), and average branch length (Av.Br.Len).DA (no units) involves the acquisition of eigenvectors
and eigenvalues, which define the ellipsoid with whichthe main, intermediate, and least orientation of the tra-becular anisotropy are represented (as defined by themean intercept length method [62]); DA = 1–1/(ε1/ε3),with ε1 and ε3 the greater and lesser eigenvalues, so if nopreferential alignment of the trabeculae is present DA =0 and if perfect alignment is present DA = 1; in otherstudies, ε1/ε3 is used directly (see ‘Discussion’ section).The MDT was associated with the 3D vector of the maindirection of orientation of the trabecular anisotropy
Table 1 Number of specimens included in the analysis (afterquality assessment of the scans, see Methods section)
Genera Species N
Cingulata 25
Cabassous 1
Cabassous tatouay 1
Calyptophractus 2
Calyptophractus retusus 2
Chaetophractus 5
Chaetophractus vellerosus 3
Chaetophractus villosus 2
Chlamyphorus 3
Chlamyphorus truncatus 3
Dasypus 2
Dasypus hybridus 1
Dasypus novemcinctus 1
Euphractus 3
Euphractus sexcinctus 3
Priodontes 5
Priodontes maximus 5
Tolypeutes 2
Tolypeutes tricinctus 1
Tolypeutes sp. 1
Zaedyus 2
Zaedyus pichiy 2
Vermilingua 12
Cyclopes 3
Cyclopes didactylus 3
Myrmecophaga 5
Myrmecophaga tridactyla 5
Tamandua 4
Tamandua tetradactyla 4
Tardigrada 6
Bradypus 4
Bradypus variegatus 2
Bradypus torquatus 1
Bradypus sp. 1
Choloepus 2
Choloepus didactylus 2
Total 43
Amson et al. Frontiers in Zoology (2017) 14:52 Page 5 of 17

(given by the first eigenvector, which is the first columnof the matrix outputted by the ‘Anisotropy’ routine). Anazimuth (or trend) and plunge (or inclination) was de-duced from the x, y, z eigenvector components using acustom R function (Additional file 5). This way, the MDTcan be represented in a stereographic projection (see [28];Fig. 3, using the RFOC package [63], see below), in whicha dot represents a vector departing from the centre of asphere and projected, as oriented here, on its lower hemi-sphere (positive on the Z-axis). According to our orienta-tion, the centre of the projection denotes the distaldirection (periphery is hence representing vectors perpen-dicular to the proximodistal axis), its right side (positiveon X-axis) denotes the lateral direction, and its upper side(positive on Y-axis) denotes the anterior direction.The Connectivity (discrete number) approximates the
number of trabeculae, and Conn.D is the connectivity perunit of volume (in mm−3). BV, in mm3, is the volume ofthe ROI occupied by bone. TV being also in mm3, BV/TVhas no units. The Tb.Th and Tb.Sp are both in mm. BS isin mm2, so its ratio to TV, BS/TV, is in mm−1. Once theabove-mentioned parameters were acquired, the stack wasskeletonised (with the ‘Skeletonise 3D’ routine) in orderto measure an additional parameter, the Av.Br.Len,which is in mm. All raw measurements are given in theAdditional file 1.
To assess the quality of the scans, we used the rela-tive resolution defined by Sode et al. [64] as the num-ber of pixels representing the average thickness of thetrabeculae (Tb.Th divided by scan resolution). Theaverage relative resolution for the whole dataset is8.1, the values spanning from 4.2 to 62.2. As recom-mended by Kivell et al. [57], these values roughlyequal or exceed clinical high-resolution scans, andwere hence considered as appropriate. The parametersof some small-sized taxa were clearly outlying,because of the small number of trabeculae includedin the corresponding ROI (even though the largestpossible ROI was selected, see above). Therefore, weused the values of the Connectivity parameter (whichapproximates the number of trabeculae) to set athreshold for each ROI below which the specimenswere excluded.Three-dimensional models (Additional files 2, 3 and 4)
were produced with the 3D viewer plugin [65] of Fiji.
Statistical analysesThe analyses involve traditional (non-phylogenetic), spher-ical, and phylogenetically informed statistics. All computa-tions were performed with R v. 3.4 [66]. Significancethreshold was set at 5% (Holm–Bonferroni method of cor-rection for multiple testing was applied when warranted).
Anterior
Medial
d
ec
a
b
Fig. 2 Selection of the regions of interest (ROIs). Transverse virtual sections (CT-scans in the X-Y plane) of the studied bones oriented as for the dataacquisition, where the area coloured in orange indicates the central (transverse) slice in the ROI. a glenoid fossa (scapula of Chlamyphorus truncatusZMB_Mam_6007), scale bar = 3 mm; (b) and (c) humeral head and capitulum, respectively (Cabassous tatouay SMNS-26661), scale bars = 5 mm; (d) and (e)radial head and trochlea, respectively (Euphractus sexcinctus SMNS-26660), scale bars = 2 mm. Three-dimensional (3D) renderings of the relevant bones(right bones seen in lateral view for the scapula and anterior view for the humerus and radius) are displayed as insets. The anatomical orientations(‘Anterior’, ‘Medial’) are only valid for the sections (not for the 3D renderings). ROIs were selected to be as large as possible but excluding the cortex. Notethat the slices displayed (centre of each ROI) do not appear as comprising the maximal quantity of trabeculae because the ROI selection was alwaysrestricted at its proximal or distal end. See also 3D models in Additional files 2, 3, 4
Amson et al. Frontiers in Zoology (2017) 14:52 Page 6 of 17

armadillosslothsanteaters
a
b
d
c
e
Anterior
Medial
Distal:
Projection’s vantage point:
(0;0)
(180;0)
(90;0)(270;0)90
(90;50)
(0;50)
p-value > 0.14
p-value > 0.09 p-value > 0.24
p-value < 9.05e-22p-value > 0.99
Fig. 3 (See legend on next page.)
Amson et al. Frontiers in Zoology (2017) 14:52 Page 7 of 17

Traditional statisticsPairwise comparisons among the functional categorieswere performed, when relevant, with the size-correctedtrabecular parameters. TV was used as a body size proxybecause it is directly measured on the specimens(contrary to body mass specific mean) and because itessentially scales isometrically to body mass in ourdataset: Slopes of ordinary least squares regressions (lmfunction) of TV against body mass (using specificmeans from [67–70]) for each ROI are all differentfrom 0 (p-values <1e-07) and not significantly differentfrom 1 (using the Student t distribution, pt function,p-values >0.24), except for the radial head for whichthe p-value >0.045. Size-correction was performed usingunpooled ordinary least squares regression ((Reduced)Major Axis regression was shown to be biased in such acase [71]) of each parameter against the body size proxy(TV), with both variables log-transformed. When theslope was significantly different from 0 (i.e., there is asignificant correlation with size), the residuals of theregression were recovered and considered to represent the‘size corrected’ parameter (e.g., [72]; see which parameterswere concerned for each ROI in Fig. 4 and Additional file 6).If the studied parameter of the functional categories wasnormally distributed (shapiro.test function) and thevariances were homogenous (bartlett.test function), atraditional analysis of variance (ANOVA) (aov function)and Tukey’s post hoc test (TukeyHSD function) wereused. If the variances were not found as homogeneous,several t-tests were used [for each pair of category, aLevene’s test (leveneTest function, car package [73]) wasused to determine if a Welch’s t-test should be used],and the p-values were corrected for multiple testing(p.adjust function). Departure from normality was some-times found and caused by outliers. In those cases, thelatter were excluded (outlier function, outliers package[74]). Boxplots were produced with the boxplot2 function(gplots package [75]).
Spherical statisticsThe main direction of the trabeculae, MDT, was visua-lised with stereographic projections (net and focpointfunctions, RFOC package [63]). The vectors (as defined
by the x, y, z eigenvector components) were normalised(i.e., made unit vectors), and if necessary, inversed (forall vectors to point distally, i.e., positive along the Z-axis). After that the equality of concentration was tested(spherconc.test function, same package), differencesamong functional categories were assessed with anANOVA for spherical data (Directional package, hcf.aovfunction [76]).
Phylogenetically informed statisticsIf warranted (see phylogenetic signal below), pairwisecomparisons were performed within a phylogeneticallyinformed framework. For terminal taxa (timetree tips,species in our case) represented by multiple specimens,the mean of each parameter was used in the subsequentoperations. Two specimens that were identified only upto the generic level were excluded. We used the time-tree of Gibb et al. [77], pruning the unstudied species(read.nexus and drop.tip functions, ape package [78]).Matching between the phylogeny and the parameterdata was checked with the name.check function (Geigerpackage [79]). A visualization of the timetree (Fig. 1) wasperformed with the geoscalePhylo function (strap package[80]). In order to decide whether phylogeneticallyinformed tests were warranted or not, we computedPagel’s lambda, a measure of phylogenetic signal(with the phylosig function of the phytools package [81]),using the residuals of a linear regression (lm function; see[82]) of, for each ROI, each parameter against the bodysize proxy TV (both log-transformed). The choice ofPagel’s lambda, of which a value of 1 denotes that the traitunder study evolved as expected under a Brownianmotion model, was motivated by the fact that thesubsequent analyses will use its value to phylogeneticallyinform the tests (see below). When a significantphylogenetic signal was detected, these residuals weremapped on the phylogeny (contMap function, phytoolspackage [81]) to visualise the evolutionary pattern of eachtrait. To test whether or not the parameters differ amongthe functional categories, we performed phylogeneticallyinformed analysis of covariance (ANCOVA) (usinggeneralised least squares linear models, gls functionof the nlme package [83]), with the body size proxy as a
(See figure on previous page.)Fig. 3 Main direction of the trabeculae (MDT) in regions of interest (ROIs) located in the epiphyses of the forelimb of xenarthrans. Stereographicprojections of the MDT colour-coded according to the lifestyle categories for each ROI, namely the glenoid cavity (a), humeral head (b), humeralcapitulum (c), radial head (d), and radial trochlea (e). The projections are on the lower hemisphere, which corresponds to the distal direction(symbolised on the upper left legend by a crossed circle). The smaller dots represent specimens for which the degree of anisotropy (DA) is below0.5, greater values being represented by the larger dots. Three-dimensional (3D) renderings of the relevant bones (right bones seen in lateral viewfor the scapula and anterior view for the humerus and radius) indicate the location of the ROIs and the perspective of the projections (‘eyesymbol’). The anatomical orientations (‘Anterior’, ‘Medial’, and ‘Distal’) are only valid for the stereographic projections (not for the 3D renderings).On the upper left smaller projection (used to indicate the anatomical direction) are labelled the pairs of coordinates that define the 3D vectors(azimuth; plunge), except for the centre (perfect distal orientation) for which the azimuth is irrelevant. The p-values indicate the significance ofthe difference among functional categories (ANOVA for spherical data)
Amson et al. Frontiers in Zoology (2017) 14:52 Page 8 of 17
covariate, and a within-group correlation structure basedon the optimised lambda value (see [82]; with the corPagelfunction, ape package [78]), because it is assumed that atransformation of the topology according to this valuemakes the parameter’s evolution best fit the Brownianmotion model [84]. The ‘maximum likelihood’ methodwas used, except when it was not able to recover theoptimised lambda. In the latter case, it is the ‘restrictedmaximum likelihood’ that was used (for the presentdataset the latter recovered reasonable values of lambdaand the resulting gls models yielded the same results asthe ‘maximum likelihood’ method when both methodscould have been employed). The residuals of the gls fitwere tested for normality (qqnorm) and homoscedasticity(plot function, to visualise the standardised residualsversus fitted values; see recommendation of [85]), and,when warranted, outliers were excluded and another fitwas performed. For those parameter-ROI couples for
which a significant phylogenetic signal was recovered, wemeasured again the phylogenetic signal (using size cor-rected values if warranted) but within two subsamples,one consisting of the largest functional category (i.e., fullyterrestrial and fossorial lifestyle, the armadillos) and theother of the least inclusive most speciose category (i.e.,intermediate fossorial category). This was performed inorder to roughly assess whether phylogeny is a factor in-trinsically affecting trabecular parameters. The phylogen-etic signal was not investigated in the other functionalcategories because of their small number of terminal taxathat would have likely resulted in little power for the tests.
ResultsMain direction of the trabeculae (MDT)The MDT (as given by the main direction of trabecularanisotropy) differs rather consistently among the ROIs(Fig. 3). For the glenoid cavity of the majority of species
arma sloth ant
−0.
40.
0
arma sloth
−1.
00.
01.
0
arma sloth
0.2
0.3
0.4
0.5
arma sloth
−0.
40.
00.
4
arma sloth
−0.
4−
0.1
0.1
arma sloth
−0.
20.
20.
6
arma sloth
−0.
6−
0.2
0.2
ant
n=19 n=6 n=7
ant ant
antantant
scDA [residuals] scConn.D [residuals] BV/TV [no units]
scBS/TV [residuals] scTb.Th Mean [residuals] scTb.Sp Mean [residuals]
scAv.Br.Len [residuals]
****
* *
**
****** p-value < 0.05
p-value < 0.01p-value < 0.001
****
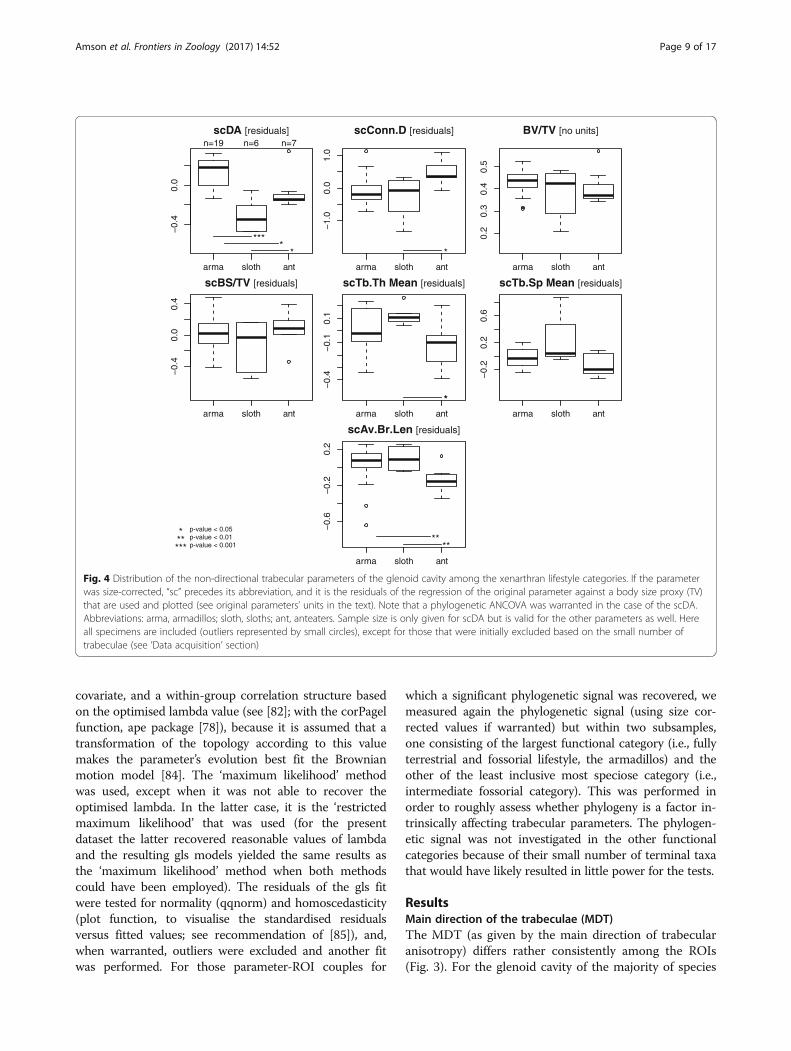
Fig. 4 Distribution of the non-directional trabecular parameters of the glenoid cavity among the xenarthran lifestyle categories. If the parameterwas size-corrected, “sc” precedes its abbreviation, and it is the residuals of the regression of the original parameter against a body size proxy (TV)that are used and plotted (see original parameters’ units in the text). Note that a phylogenetic ANCOVA was warranted in the case of the scDA.Abbreviations: arma, armadillos; sloth, sloths; ant, anteaters. Sample size is only given for scDA but is valid for the other parameters as well. Hereall specimens are included (outliers represented by small circles), except for those that were initially excluded based on the small number oftrabeculae (see ‘Data acquisition’ section)
Amson et al. Frontiers in Zoology (2017) 14:52 Page 9 of 17

(Fig. 3a), the MDT is mostly oriented proximodistally.The distinction among the lifestyle categories is poor.The sloths cluster with a slight anterolateral componentin their MDT, but partly overlap with the distribution ofarmadillos. Three anteaters feature an outstandinglyweaker distal component in their MDT. For the humeralhead (Fig. 3b), the MDT is consistently distoanterior,with no clear lifestyle categories distinction. The hu-meral capitulum (distal epiphysis, Fig. 3c) is the ROIwith the greatest variation in MDT, the directions beingclustered in two zones, one distoanteromedial and an-other distoposterolateral. Beside the fact that sloths areonly found in the former, there is no clear distinctionamong the lifestyle categories. The radial head’s ROI(Fig. 3d) is the one for which the MDTs are least dispar-ate among xenarthrans, most specimens featuring amostly proximodistal direction. Again, no clear distinc-tion is found among the lifestyle categories. Finally, andcontrary to previous ROIs, the radial trochlea (Fig. 3e)
discriminates lifestyle categories, as indicated by a spher-ical ANOVA (p-value <9.5e-22; other ROIs, p-values>0.09). While MDT in all specimens is again mostlyproximodistally oriented, the sloths feature a slight med-ial component, the anteaters a slight lateral component,and the armadillos a slight posterolateral component.One should note that in some cases a conspicuous intra-specific variability is observed. No clear difference isfound in any of the ROIs among the fossorial categories(not shown).
Non-directional trabecular parametersThe DA, Conn.D, BV/TV, BS/TV, Tb.Th, Tb.Sp, andAv.Br.Len show a rather large variation among xenar-thrans (Fig. 4; Table 2; Additional files 6 and 7). Most ofthese parameters for most of the ROIs were significantlycorrelated to body size (as demonstrated by the linearregressions against the body size proxy TV). Indeed,only the BV/TV of the glenoid cavity, humeral head and
Table 2 Mean xenarthran untransformed values of the non-directional trabecular parameters for each region of interest
DA Conn.D BV/TV BS/TV Tb.Th mean Tb.Sp mean Av.Br.Len.
(NU) (nb/mm3) (NU) (mm−1) (mm) (mm) (mm)
Glenoid
All 0.68 18.47 0.42 3.96 0.22 0.38 0.34
Armadillos 0.81 22.84 0.43 4.51 0.20 0.32 0.32
Anteaters 0.53 14.52 0.40 3.32 0.24 0.40 0.34
Sloths 0.44 9.24 0.38 2.97 0.27 0.55 0.39
Humeral head
All 0.52 11.68 0.43 3.36 0.26 0.46 0.38
Armadillos 0.60 12.35 0.41 3.38 0.25 0.47 0.38
Anteaters 0.40 11.59 0.45 3.43 0.26 0.41 0.37
Sloths 0.43 9.36 0.44 3.14 0.31 0.49 0.40
Humeral capitulum
All 0.66 9.90 0.47 3.32 0.32 0.48 0.42
Armadillos 0.77 10.63 0.48 3.57 0.31 0.47 0.44
Anteaters 0.51 10.06 0.47 3.24 0.32 0.44 0.39
Sloths 0.54 7.18 0.42 2.65 0.34 0.58 0.42
Radial head
All 0.77 7.95 0.47 3.57 0.28 0.42 0.42
Armadillos 0.87 5.71 0.50 3.84 0.30 0.41 0.45
Anteaters 0.74 11.25 0.45 3.53 0.26 0.38 0.38
Sloths 0.57 8.07 0.41 2.81 0.29 0.51 0.41
Radial trochlea
All 0.72 13.82 0.46 3.50 0.33 0.41 0.40
Armadillos 0.79 16.05 0.49 3.87 0.34 0.37 0.39
Anteaters 0.63 11.19 0.44 3.20 0.30 0.44 0.42
Sloths 0.56 8.75 0.40 2.39 0.30 0.52 0.40
Footnotes: Abbreviations: Av.Br.Len average branch length, BS bone surface, BV bone volume, Conn.D connectivity density, DA degree of anisotropy, Tb.Thtrabecular mean thickness, Tb.Sp trabecular mean spacing, NU no units
Amson et al. Frontiers in Zoology (2017) 14:52 Page 10 of 17

capitulum, and radial trochlea are not correlated to size(the radial head stands out among ROIs because BV/TVis affected by scaling, while Conn.D, Tb.Th and Tb.Spare not). Size was hence taken into account (when rele-vant) for the following comparisons. A significant phylo-genetic signal was found in only one parameter (DA),suggesting that the phylogenetic relationships amongxenarthrans do not preponderantly affect their trabecu-lar parameters.DA (no units) shows a significant phylogenetic signal
in all ROIs (p-values <0.03) except those of the radius(p-values >0.44). This parameter yielded a clear lifestyledistinction in all ROIs, which show the same pattern,namely that armadillos have a greater DA than non-armadillos (phylogenetic ANCOVA if warranted or size-corrected pairwise comparison; see boxplots in Fig. 4,Additional file 6; see all p-values in Additional file 8).Furthermore, for the radial head, the DA of anteaters issignificantly greater than in sloths, describing a gradientfrom the most fossorial armadillos with greatest DA tothe non-fossorial sloths with the lowest DA. Only in thehumeral capitulum, the phylogenetic ANCOVA yieldeda significant influence of size on DA. However, the twocategories (armadillos/non-armadillos) did not differ insize (t-test on TV), so the difference in the responsevariable (DA) can be directly imputed to the explanatoryvariable (lifestyle). Among armadillos, the DA signifi-cantly differs among fossorial categories only for thehumeral head. In the humeral head (Fig. 5), thehighly fossorial armadillos (category 3) feature a sig-nificantly greater DA than the intermediate ones (cat-egory 2). Surprisingly, Tolypeutes, argued to be theleast fossorial armadillo, feature one of the greatestDA of our sample. In the humeral capitulum and theradial head, the highly fossorial armadillos againfeature a greater DA than those of the intermediatecategory, but the difference is not found as significant(in these cases Tolypeutes falls within the range ofthe intermediate category). Both subsamples investi-gated to test the overall influence of phylogeny in ourdataset (see ‘Methods’ section) yielded a very lowlambda and non-significant p-value of the test for thepresence of a phylogenetic signal.Conn.D values (mm−3; size-corrected except for the
radial head) are essentially found as greater in anteatersthan in the other xenarthrans. This is significant in theglenoid cavity (Fig. 4). In the humeral ROIs and the ra-dial head (Additional file 6), only the comparison witharmadillos is found as significant, but this is explainedby the rather wide range of variation of sloths, which areessentially intermediate. There are no obvious differ-ences among the lifestyle categories for the radial troch-lea ROI. No differences were found among the fossorialcategories for any of the ROIs either.
BV/TV (no units) poorly discriminates the func-tional categories (i.e., neither the lifestyle nor thefossorial categories; Fig. 4, Additional file 6). For thehumeral ROIs, it is found as greater in armadillosthan in sloths (anteaters fall roughly in between, butwith a rather important range of variation), a comparisonthat is significant only for the humeral capitulum. Nosignificant differences were found among the lifestylecategories for the other ROIs or among the fossorialcategories for any of the ROIs. One can note that inthe supposedly least fossorial Tolypeutes, the BV/TVvalues are particularly low.BS/TV (mm−1) yields a functional discrimination but
that is not consistent across the studied ROIs. Amonglifestyle categories, it is only for the humeral head thatarmadillos have significantly lower values than the otherxenarthrans (Additional file 6). Among the fossorial cat-egories, and in the glenoid cavity, there is a clear gradi-ent with the lowest values for the least fossorialarmadillos to the highest values for the most fossorialones (the difference between categories 1 and 2 is how-ever not significant, with a p-value = 0.053).The Tb.Th and Tb.Sp (both in mm) yield no clear dis-
crimination among the lifestyle categories (Fig. 4, Add-itional file 7) or fossorial categories. This might beattributed to the strong size effect, consistently foundexcept for the radial head ROI. One should note, how-ever, that there is a tendency for the Tb.Th (normalised
1 2 3
−0.
10.
00.
10.
20.
3
n=2 n=12 n=8
Fossorial categories
p-value = 1.4e-02
scD
A [r
esid
uals
]Fig. 5 Differences in the size-corrected (using residuals of the regressionof the original parameter against a body size proxy, TV) degree ofanisotropy (scDA) of the humeral head among armadillo’s fossorialcategories: 1, supposedly least fossorial (only Tolypeutes); 2, intermediate(Dasypodidae and Euphractinae); and 3, highly fossorial (Chlamyphorinaeand Tolypeutinae except Tolypeutes). Only one pairwise comparison wasperformed and is indicated by the horizontal bar and p-value
Amson et al. Frontiers in Zoology (2017) 14:52 Page 11 of 17
with the body size proxy TV) of armadillos to be greaterthan that of other xenarthrans.Finally, the Av.Br.Len (mm) is essentially found as
lower in anteaters than in the other lifestyle categories.This is significant for the glenoid cavity (Fig. 4) andhumeral head, and only between the anteaters andarmadillos for the humeral capitulum and radial head(Additional file 6). In the latter cases, the sloths aregenerally intermediate. Among the fossorial categories, itis only in the radial head that a significant difference isfound, namely a greater Av.Br.Len in the highly fossorialarmadillos.
DiscussionThe chief goal of the present study is to characterise thetrabecular architecture of the main epiphyses of the fore-limb of xenarthrans, and by that means reaching a betterfunctional understanding of the trabecular parameters.Our expectation was for the influence of phylogenetic re-lationships to be marginally represented in the trabeculararchitecture of xenarthrans (or any other clade). Indeed,no significant phylogenetic signal was found in any of theparameters and for any ROIs, except for the DA. Again,one cannot strictly differentiate functional from phylogen-etic signal in our case, but we interpret this result as agood indication that the functional signal is preponderantin the trabecular architecture, as DA yielded by far theclearest differentiation among the functional categories.One cannot exclude that only DA is intrinsically affectedby phylogeny. However, we view this as unlikely, as closelyrelated taxa within functional categories did not resembleeach other more than less closely related taxa for this par-ameter (low lambda value and non-significant phylogen-etic signal in the studied subsamples). Since we alsoaccounted for size, which has an important (structural) ef-fect on the trabecular architecture [8, 86], we hence con-sider that the differences we found among the functionalcategories (either lifestyle or fossorial categories) are mostlikely of functional significance.As Doube et al. [8] found across mammals and birds,
and as Ryan and Shaw [86] found in primates, an import-ant scaling effect among the trabecular parameters wasobserved in xenarthrans. Furthermore, conspicuous intra-specific variability was observed in some cases, whichcould have masked the functional signal in those cases inwhich it was not recovered. This seems particularly obvi-ous for the MDT, which discriminated lifestyle categoriesonly in one ROI out of five (the radial trochlea).Previous analyses of xenarthran bone structure tackled
long bone mid-diaphysis (using 2D approaches [87–89]). They revealed that the midshaft of xenarthrans ischaracterized by a rather high global compactness (whencompared to the generalized mammalian condition) and,in some taxa, by the presence of a spongiosa that fills
the medullary cavity. On the whole, our observations onthe trabecular architecture at the epiphyses did not re-veal any major patterns that are departing from that ofother mammals, i.e., epiphyses filled with trabecularbone that is surrounded by a rather thin cortex. In thefollowing, relevant comparisons with other taxa forwhich 3D trabecular architecture was assessed (virtuallyonly primates) are performed for each of the studiedROIs (no comparative data were found for the humeralcapitulum).
Glenoid cavityThe MDT in the glenoid cavity of humans was estimatedbut never with a method directly comparable to the oneused herein. However, it was described that the trabeculaeare oriented radially, perpendicular to the subchondralplate (aligned along the mediolateral axis for human scap-ula orientation; [90–92]). The mostly proximodistally ori-ented trabeculae (usually with a high DA) of xenarthrans(Fig. 3a), especially armadillos, might reflect, as opposedto that of humans, their quadrupedal posture.
Humeral headThe humeral head (along with the humeral capitulum)was the ROI that yielded the best lifestyle discrimination.Several analyses also used a ROI representing the bulkof the trabeculae of the humeral head in primates [93–95]. In our analysis, DA is on the whole the only param-eter that consistently discriminates lifestyle categories,and for some ROIs, fossorial categories. A similar con-clusion was drawn by Fajardo and Müller [93], who in-vestigated the humeral (and femoral) head insuspensory-climbing and more quadrupedal primates.One should note that their overall values of degree ofanisotropy are lower than what we recovered (eigen-values ratio ranges from 1.12 to 1.44, which correspondsto a DA range of 0.11–0.31), their most anisotropic spe-cimen falling within the range of the sloths and anteaters(i.e., non-armadillo xenarthrans, which are less aniso-tropic than armadillos). In the orangutan, chimpanzee,and human [94] and in different human populations[95], relatively low DA values close to those found by Fa-jardo and Müller [93] (hence relatively low when com-pared to xenarthrans) were recovered. The anthropoiddataset of Ryan and Walker [96] is marked by slightlygreater DA values (using the alternative method “SVDDA”, which corresponds to a range of 0.32–0.53 for theDA according to our use), which is probably due to theiruse of a smaller ROI (1/10th the volume of the best-fitarticular surface sphere). A relatively low DA was alsofound in the dog ([97]; therein eigenvalues ratio = 1.30,so DA = 0.23), but one should note that the method usedby these authors is quite different (e.g., the ROI wasphysically extracted, etc.). Regarding a relationship with
Amson et al. Frontiers in Zoology (2017) 14:52 Page 12 of 17

lifestyle, the DA was found as higher in the more terres-trial primates by Fajardo and Müller [93]. In Scherf etal.’s [94] case the more terrestrial chimpanzee was thetaxon characterised by the lowest value. While therewere no significant differences between modern humansand the presumably more active Neolithic humans [95],the Neolithic females were found as having a greaterDA, which was interpreted as indicative of their morespecialised working routine. Ryan and Shaw [25] used amultivariate approach, and did not recover clear func-tional differences in the parameters of the humeral headof primates (as in [98]). However, the tendency was alsofor quadrupedal and terrestrial taxa (and some arborealtaxa) to have a more anisotropic trabecular architecture.All in all (except for the data of Scherf et al. [94]), thereseems to be a positive correlation (or relationship) be-tween DA and the presence of a main loading direction,which in turn might reflect a more restricted range ofmovements. This fits biomechanical expectations [99].Based on the comparison among armadillos’ fossorialcategories, we are further able to argue that an evengreater DA would be associated with a more deriveddigging adaptation, which might involve an even moredistinct main loading direction (i.e., magnitudes ofother loading directions are of much lesser importance).One should note, however, that Tolypeutes, argued tobe the least fossorial armadillo, featured among thegreatest DA values for the humeral head ROI. Thecorrelation just mentioned is, hence, either not validin this case, or this taxon is more fossorial than pre-viously thought, which has already been suggested byAttias et al. [37]. Although it concerned the femoralhead, one should note that the DA in non-leaping(arboreal) primates was found to be lower than in theleaping ones, with the slender loris featuring the lowestmean value [32].Conn.D was found to be greater in anteaters than in
the other xenarthrans. This is not easy to interpret func-tionally, as anteaters’ lifestyle is considered herein assomewhat intermediate between that of armadillos andthat of sloths. One can note that it is consistent that wealso found Av.Br.Len to be lower in anteaters, as moretrabeculae per unit of volume without significant changein their thickness or spacing implies that they areshorter. While to our knowledge Av.Br.Len was notmeasured in primates, it is relevant to compare their ab-solute values of Conn.D to those recovered in xenar-thrans. In human populations [95], they are much lower(4–5 per mm3 against 11.7 per mm3 on average inxenarthrans, Table 2). As humans’ ROIs are bigger thanthose of most xenarthrans, this might be due to scaling(isometrical slope for Conn.D is −3, Mielke et al. (underreview); however, this parameter scaled with positive al-lometry in Doube et al. [8]). The average xenarthran
value roughly equals the maximal average value of pri-mates recovered by Shaw and Ryan [98].Humeral head’s BV/TV was not found as functionally
discriminant in xenarthrans. But one can note that theprimate values’ range (ca. 0.13–0.41 [93–96, 98]) is lowerthan the average xenarthran value (0.43). The overallgreater bone fraction found in the humeral head ofxenarthrans might be related to other factors, as anoverarching functional difference between the two cladesis not obvious. Straehl et al. [88] analysed the bone hist-ology and structure of mid-diaphyseal sections of thehumerus and femur among xenarthrans. As their data,ours indicate that the humeral bone fraction (globalcompactness was measured therein) does not conspicu-ously differ among xenarthran clades or functional cat-egories. However, Straehl et al. [88] found thatarmadillos differ from the other xenarthrans in having ahumeral mid-diaphysis that is more compact when com-pared to that of the femur, and related that to their fos-sorial habits. It would hence be relevant to comparetrabecular architecture in both bones to check if a simi-lar pattern is observed at the epiphyses.BS/TV was found to be lower in armadillos. One might
expect that this feature relates to thicker (or less spaced)trabeculae, but that was not the case in our dataset. It isnoteworthy that armadillos’ normalised Tb.Th is con-spicuously greater than that of other xenarthrans. So, eventhough Tb.Th (after size correction) was not found as sig-nificantly different among the lifestyle categories, one canassume that there is a trend for armadillos to have thickertrabeculae, involving a lower BS/TV. This in turn can bemore easily understood functionally, as armadillos’ fore-limbs likely undergo the loads that are the largest in rela-tive magnitude among xenarthrans (maybe to theexception ofMyrmecophaga). Scherf et al. [94] found aver-age values for the orangutan and humans that are, as ex-pected, lower than in xenarthrans, because the isometricscaling is negative (slope of −1; however, one should notethat it scales with slight positive allometry in the femoralhead of mammals [8]), but the chimpanzee was charac-terised by greater values on average. As the latter taxon isassumed to be characterised by the most strenuous life-style, it seems inconsistent with our results (and also withScherf et al.’s [94] expectations).As in xenarthrans, the individual Tb.Th and Tb.Sp pa-
rameters in primates [25, 93] did not yield a clear func-tional discrimination. In great apes, however, Scherf et al.[94] found that the chimpanzee was characterized bylower Tb.Sp values. In Neolithic humans a tendency tothicker and less spaced trabeculae was pointed out [95].The higher (normalised) Tb.Th values in armadillos are inaccordance with this trend. The primate Tb.Th range ca.0.14–0.24 mm [93–96] falls below the average xenarthranvalue (0.26 mm), except for the values of Homo and Pongo
Amson et al. Frontiers in Zoology (2017) 14:52 Page 13 of 17

measured by Shaw and Ryan [98], which fall within thexenarthran range (xenarthran max. = 0.45 mm).
RadiusThe radial head was studied by Gebauer et al. [100] inhumans (males and females from 20 to 80 years old). Inthe latter, BV/TV ranges from 0.06 to 0.15, while inxenarthrans it ranges from 0.31 to 0.66 (Additional file 7).Even though the ROI is differently defined therein, itis clear from Gebauer et al.’s [100] figures thatxenarthrans’ radial head comprises relatively morebone than that of humans. While more data are necessaryto confirm this, it seems consistent to find a muchlower bone fraction in the non-weight bearing radialhead of humans.In the radial trochlea, the MDT is found to be mostly
proximodistal (therein called superior-inferior) inhumans [101]. The DA (therein the eigenvalues ratio isreported) was found to range from 0.33 to 0.45 (mean =0.41), while in xenarthrans values range from 0.48 to0.93. As for the comparison of the radial head, it seemsthat the fact that the distal radius of xenarthrans as awhole is weight bearing is reflected in their clearlygreater DA than in humans.An important limitation of our study is the different
resolutions at which the specimens were scanned acrossour dataset. Even if we followed published recommenda-tion on that regard (involving the relative resolution[57]), one can expect these resolution differences to biasour measurements, especially for those that directly re-late to the size of the pixels, namely BS (and its ratio toTV), Tb.Th, Tb.Sp, and Av.Br.Len. This could potentiallyexplain the fact that these parameters were the least dis-criminant in our analysis. Furthermore, the relevance ofAv.Br.Len in functional analyses is not straightforward,as the shape of the trabeculae, which can be from rod-like to plate-like, likely involves conspicuously differentmechanical properties ([102] and references therein).
ConclusionsWe present herein a dataset comprised of μCT-scan datacharacterizing the 3D trabecular architecture of the mainforelimb epiphyses of all extant genera of xenarthrans(armadillos, anteaters, and sloths). The important vari-ation observed in most of their trabecular parameters of-fers a unique insight in the functional relevance of theseparameters, as the forelimb of xenarthrans is character-ized by conspicuous differences in its functional use.Most parameters did not yield a phylogenetic signal,suggesting that the phylogenetic relationships amongxenarthrans are not preponderantly affecting their tra-becular architecture. Some trabecular parameters, thedegree of anisotropy (DA) in particular, were found tosignificantly differ among the functional categories, even
when body size and phylogeny were taken into account.This suggests that not only the diaphysis, but also theepiphyseal structure of long bones can yield an import-ant functional signal. Indeed, a greater DA seems to beconsistently acquired in the epiphyses of the morefossorial xenarthrans. As digging adaptations arewidespread among tetrapods, a future endeavour willbe to check whether a greater degree of anisotropyalso sets other fossorial taxa apart. This could con-firm the importance of this parameter for the practiceof strenuous activities such as digging. So far, onlyprimates were similarly investigated, so, given theresults reported herein, we expect that trabeculararchitecture will represent a promising research avenuethat will be key to reach a better understanding ofbone biomechanics in an ecological context as well asfor lifestyle/(palaeo)biological reconstructions (applicableboth to extinct and extant taxa for which ecological datais lacking).
Additional files
Additional file 1: Species/specimen list and raw data as measured withBoneJ [61]. Each worksheet corresponds to a region of interest. Note thatnot all parameters given therein were analysed. Abbreviations: See maintext and [103]. (XLSX 94 kb)
Additional file 2: Orientation of the scapula and location of its region ofinterest (ROI), the glenoid cavity. The 3D pdf includes the superimposedsurface models of the whole scapula (by default transparent), ROI (glenoidcavity, orange) and scale (cubic, black). The specimen’s orientation in thecoordinate system follows that used in the analyses (the lateral view was setto be by default). The example specimen: Chlamyphorus truncatusZMB_MAM_6007, right scapula. (PDF 8113 kb)
Additional file 3: Orientation of the humerus and location of its regionsof interest (ROIs). The 3D pdf includes the superimposed surface modelsof the whole humerus (by default transparent), ROIs (humeral head andcapitulum, orange) and scale (cubic, black). The specimen’s orientation inthe coordinate system follows that used in the analyses (the anteriorview was set to be by default). The example specimen: Cabassoustatouay SMNS-26661, right humerus. (PDF 16352 kb)
Additional file 4: Orientation of the radius and location of its regions ofinterest (ROIs). The 3D pdf includes the superimposed surface models ofthe whole radius (by default transparent), ROIs (radial head and trochlea,orange) and scale (cubic, black). The specimen orientation’s in thecoordinate system follows that used in the analyses (the anterior viewwas set to be by default). The example specimen: Euphractus sexcinctusSMNS-26660, right radius. (PDF 14211 kb)
Additional file 5: R script to convert eigenvector cosines (as outputted byBoneJ [61]) into azimuth and plunge. Made under R version 3.4.1 [66]. (R 1 kb)
Additional file 6: Distribution of the non-directional trabecular parametersof the regions of interest (ROIs) distal to the glenoid cavity (see Fig. 4 ofmain text) among the lifestyle categories. Box-plots describing the distribu-tion of the non-directional trabecular parameters of the regions of interest(ROIs) distal to the glenoid cavity (see Fig. 4 of main text) among the life-style categories. If the parameter was size-corrected, “sc” precedes its abbre-viation, and it is the residuals of the regression of the original parameteragainst a body size proxy (TV) that are used and plotted (see original param-eters’ units in the text). Note that a phylogenetic ANCOVA was warranted inthe cases of the scDA for the humeral ROIs (see main text). Abbreviations:arma, armadillos; sloth, sloths; ant, anteaters. Sample size is only given forscDA but is valid for the other parameters as well. (PDF 34 kb)
Amson et al. Frontiers in Zoology (2017) 14:52 Page 14 of 17

Additional file 7: Summary of the non-directional trabecular parametersvalues among xenarthrans for each region of interest. Excel workbookcontaining three worksheets, for the mean, minimum, and maximumvalues respectively of the non-directional trabecular parameters amongxenarthrans for each region of interest. Abbreviations: Av.Br.Len, aver-age branch length; BS, bone surface; BV, bone volume; Conn.D, connect-ivity density; DA, degree of anisotropy; Tb.Th, trabecular mean thickness;Tb.Sp, trabecular mean spacing; NU, no units. (XLSX 15 kb)
Additional file 8: P-values of the pairwise comparisons among lifestylecategories. Excel workbook containing two worksheets, one for thetraditional (non-phylogenetic) comparisons between each pair ofcategory for each ROI and parameter, and the other for thephylogenetically informed comparisons (given only when the latter arewarranted). Abbreviations: Av.Br.Len, average branch length; BS, bonesurface; BV, bone volume; Conn.D, connectivity density; DA, degree ofanisotropy; Tb.Th, trabecular mean thickness; Tb.Sp, trabecular meanspacing; NU, no units. (XLSX 11 kb)
AbbreviationsTrabecular parametersAv.Br.Len: Average branch length; BS: Bone surface; BV: Bone volume;Conn.D: Connectivity density; DA: Degree of anisotropy; MDT: Main directionof trabeculae; ROI: Region of interest; Tb.Sp: Trabecular mean spacing;Tb.Th: Trabecular mean thicknessInstitutionsCeNaK: Centrum für Naturkunde, Universität Hamburg, Germany;SMF: Naturmuseum Senckenberg, Frankfurt am Main, Germany;SMNS: Staatliches Museum für Naturkunde, Stuttgart, Germany;ZLHUB: Zoologische Lehrsammlung HU-Berlin; ZMB: Museum für NaturkundeBerlin, Germany; ZSM: Zoologische Staatssammlung München, Germany
AcknowledgementsThe (assistant) curators are thanked for allowing access to their collections:Thomas Kaiser and Nelson Ribeiro Mascarenhas (CeNaK); Irina Ruf and KatrinKrohmann (SMF); Stefan Merker (SMNS); Gerhard Scholtz (ZLHUB); FriederMayer and Christiane Funk (ZMB). We thank Detlef Willborn (ZMB) forpreparing some specimens prior to scanning. Bernhard Ruthensteiner(ZSM) is acknowledged for his assistance with CT-scanning. We thankFrédéric Delsuc for providing the timetree in .tree format. We acknow-ledge Michael Tsagris for providing the latest version of the spherconc.t-est function (Directional package, now included in the latest version ofthe package). Emmanuel Paradis is thanked for his help with the apepackage. Jan Wölfer and Maja and Falk Mielke are acknowledged forinsightful discussions. Finally, we thank the two anonymous reviewers fortheir particularly useful comments.
FundingEA was funded by the Alexander von Humboldt Foundation. JAN receivedfunding from the German Research Council (DFG EXC 1027).
Availability of data and materialsAll data generated or analysed during this study are included in thispublished article and its supplementary information files.
Authors’ contributionsEA and JAN conceived the study. AC, AvH, EA, and PA acquired the rawdata. EA analysed the data, performed the analyses, and drafted themanuscript. All authors critically read the manuscript and gave their finalapproval.
Ethics approval and consent to participateNot applicable
Consent for publicationNot applicable
Competing interestsThe authors declare that they have no competing interests.
Publisher’s NoteSpringer Nature remains neutral with regard to jurisdictional claims inpublished maps and institutional affiliations.
Author details1AG Morphologie und Formengeschichte, Institut für Biologie, HumboldtUniversität zu Berlin, Philippstraße 13, 10115 Berlin, Germany. 2Bild WissenGestaltung. Ein Interdisziplinäres Labor, Humboldt Universität zu Berlin,Sophienstraße 22a, 10178 Berlin, Germany. 3Institut für Spezielle Zoologieund Evolutionsbiologie mit Phyletischem Museum,Friedrich-Schiller-Universität Jena, Erbertstraße 1, 07743 Jena, Germany.4Sektion Mammalogie, Zoologische Staatssammlung München, StaatlicheNaturwissenschaftliche Sammlungen Bayerns, Münchhausenstraße 21, 81247Munich, Germany. 5Steinmann Institute for Geology, Mineralogy, andPaleontology, University of Bonn, Nußallee 8, D-53113 Bonn, Germany.
Received: 24 August 2017 Accepted: 8 November 2017
References1. de Ricqlès A, de Buffrénil V. Bone histology, heterochronies and the return
of tetrapods to life in water: were are we. In: Mazin J, Buffrénil V, editors.Secondary adaptation of tetrapods to life in water. München: Verlag DrFriedrich Pfeil; 2001. p. 289–310.
2. Houssaye A, Waskow K, Hayashi S, Lee AH, Hutchinson JR. Biomechanicalevolution of solid bones in large animals: a microanatomical investigation.Biol J Linn Soc. 2015;117:350–71.
3. Currey JD, Alexander RM. The thickness of the walls of tubular bones. JZool. 1985;206:453–68.
4. Canoville A, Laurin M. Evolution of humeral microanatomy and lifestyle inamniotes, and some comments on palaeobiological inferences. Biol J LinnSoc. 2010;100:384–406.
5. Francillon-Vieillot H, de Buffrénil V, Castanet J, Géraudie J, Meunier FJ, Sire J-Y,et al. Microstructure and mineralization of vertebrate skeletal tissues. In: CarterJG, editor. Skeletal biomineralization: patterns, processes and evolutionarytrends, vol. 1. New York: Van Nostrand Reinhold; 1990. p. 471–530.
6. Barak MM, Lieberman DE, Hublin J-J. A Wolff in sheep’s clothing: Trabecularbone adaptation in response to changes in joint loading orientation. Bone.2011;49:1141–51.
7. Kivell TL. A review of trabecular bone functional adaptation: what have welearned from trabecular analyses in extant hominoids and what can weapply to fossils? J Anat. 2016;228:569–94.
8. Doube M, Klosowski MM, Wiktorowicz-Conroy AM, Hutchinson JR,Shefelbine SJ. Trabecular bone scales allometrically in mammals and birds.Proc R Soc B. 2011;278:3067–73.
9. Mullender M, Huiskes R, Versleyen H, Buma P. Osteocyte density andhistomorphometric parameters in cancellous bone of the proximal femur infive mammalian species. J Orthop Res. 1996;14:972–9.
10. Dumont M, Laurin M, Jacques F, Pellé E, Dabin W, de Buffrénil V. Innerarchitecture of vertebral centra in terrestrial and aquatic mammals: a two-dimensional comparative study. J Morphol. 2013;274:570–84.
11. Gorissen BMC, Wolschrijn CF, van Vilsteren AAM, van Rietbergen B, vanWeeren PR. Trabecular bone of precocials at birth; are they prepared to runfor the wolf(f)? J Morphol. 2016;277:948–56.
12. Wolschrijn CF, Weijs WA. Development of the trabecular structure within theulnar medial coronoid process of young dogs. Anat Rec Part A. 2004;278A:514–9.
13. Cunningham CA, Black SM. Anticipating bipedalism: Trabecular organizationin the newborn ilium. J Anat. 2009;214:817–29.
14. Pontzer H, Lieberman DE, Momin E, Devlin MJ, Polk JD, Hallgrímsson B, etal. Trabecular bone in the bird knee responds with high sensitivity tochanges in load orientation. J Exp Biol. 2006;209:57–65.
15. Biewener AA, Fazzalari NL, Konieczynski DD, Baudinette RV. Adaptivechanges in trabecular architecture in relation to functional strain patternsand disuse. Bone. 1996;19:1–8.
16. Mittra E, Rubin C, Qin YX. Interrelationship of trabecular mechanical andmicrostructural properties in sheep trabecular bone. J Biomech. 2005;38:1229–37.
17. Lambers FM, Koch K, Kuhn G, Ruffoni D, Weigt C, Schulte FA, et al.Trabecular bone adapts to long-term cyclic loading by increasing stiffnessand normalization of dynamic morphometric rates. Bone. Elsevier Inc. 2013;55:325–34.
Amson et al. Frontiers in Zoology (2017) 14:52 Page 15 of 17

18. Carlson KJ, Lublinsky S, Judex S. Do different locomotor modes duringgrowth modulate trabecular architecture in the murine hind limb? IntegrComp Biol. 2008;48:385–93.
19. van der Meulen MCH, Morgan TG, Yang X, Baldini TH, Myers ER, Wright TM,et al. Cancellous bone adaptation to in vivo loading in a rabbit model.Bone. 2006;38:871–7.
20. Goldstein SA, Matthews LS, Kuhn JL, Hollister SJ. Trabecular boneremodeling: An experimental model. J Biomech. 1991;24:135–50.
21. Rook L, Bondioli L, Köhler M, Moya-sola S, Macchiarelli R. Oreopithecus was abipedal ape after all: evidence from the iliac cancellous architecture. ProcNatl Acad Sci. 1999;96:8795–9.
22. Skinner MM, Stephens NB, Tsegai ZJ, Foote AC, Nguyen NH, Gross T,et al. Human-like hand use in Australopithecus africanus. Science.2015;347:395–9.
23. Thomason JJ. The relationship of trabecular architecture to inferred loadingpatterns in the third metacarpals of the extinct equids Merychippus andMesohippus. Paleobiology. 1985;11:323–35.
24. Chirchir H. A comparative study of trabecular bone mass distribution incursorial and non-cursorial limb joints. Anat Rec. 2015;298:797–809.
25. Ryan TM, Shaw CN. Unique suites of trabecular bone features characterizelocomotor behavior in human and non-human anthropoid primates. PLoSOne. 2012;7:e41037.
26. Gross T, Kivell TL, Skinner MM, Nguyen NH, Pahr DH. A CT-image-basedframework for the holistic analysis of cortical and trabecular bonemorphology. Palaeontol Electron. 2014;17:1–13.
27. Saparin P, Scherf H, Hublin J, Fratzl P, Weinkamer R. Structural adaptation oftrabecular bone revealed by position resolved analysis of proximal femoraof different primates. Anat Rec. 2011;294:55–67.
28. Ketcham RA, Ryan TM. Quantification and visualization of anisotropy intrabecular bone. J Microsc. 2004;213:158–71.
29. Skedros JG, Baucom SL. Mathematical analysis of trabecular “trajectories” inapparent trajectorial structures: the unfortunate historical emphasis on thehuman proximal femur. J Theor Biol. 2007;244:15–45.
30. Hammer A. The structure of the femoral neck: a physical dissection withemphasis on the internal trabecular system. Ann Anat Elsevier. 2010;192:168–77.
31. Heřt J. A new attempt at the interpretation of the functional architecture ofthe cancellous bone. J Biomech. 1994;27:239–42.
32. Ryan TM, Ketcham RA. Angular orientation of trabecular bone in thefemoral head and its relationship to hip joint loads in leaping primates. JMorphol. 2005;265:249–63.
33. Gaudin TJ, Croft DA. Paleogene Xenarthra and the evolution of southAmerican mammals. J Mammal. 2015;96:622–34.
34. Hildebrand M. Digging of quadrupeds. In: Hildebrand M, editor. Functionalvertebrate morphology. Cambridge: Cambridge University Press; 1985. p. 89–109.
35. Vizcaíno SF, Milne N. Structure and function in armadillo limbs (Mammalia:Xenarthra: Dasypodidae). J Zool. 2002;257:117–27.
36. Vizcaíno SF, Fariña RA, Mazzetta GV. Ulnar dimensions and fossoriality inarmadillos. Acta Theriol. 1999;44:309–20.
37. Attias N, Miranda FR, Sena LMM, Tomas WM, Mourão GM. Yes, they can!Three-banded armadillos Tolypeutes sp. (Cingulata: Dasypodidae) dig theirown burrows. Zoologia. 2016;33:1–8.
38. Pocock RI. The external characters of the south American edentates. ProcZool Soc London Wiley Online Library. 1924;1924:983–1031.
39. Brown JC, Yalden DW. The description of mammals - 2 limbs andlocomotion of terrestial mammals. Mamm Rev. 1973;3:107–34.
40. Murie OJ, Elbroch M. Family Dasypodidae: armadillos. A field guide toanimal tracks. 2005.
41. Kley NJ, Kearney M. Adaptations for digging and burrowing. In: Hall BK,editor. Fins into limbs: evolution, development, and transformation.Chicago: University of Chicago Press; 2007. p. 284–309.
42. Hayssen V, Miranda F, Pasch B. Cyclopes didactylus (Pilosa: Cyclopedidae).Mamm Species. 2012;44:51–8.
43. Orr CM. Knuckle-walking anteater: a convergence test of adaptation forpurported knuckle-walking features of African Hominidae. Am J PhysAnthropol. 2005;128:639–58.
44. Young RJ, Coelho CM, Wieloch DR. A note on the climbing abilities of giantanteaters, Myrmecophaga tridactyla (Xenarthra, Myrmecophagidae). Bol doMus Biol Mello Leitão. 2003;15:41–6.
45. Gaudin TJ. Phylogenetic relationships among sloths (Mammalia,Xenarthra, Tardigrada): the craniodental evidence. Zool J Linnean Soc.2004;140:255–305.
46. Amson E, de Muizon C, Gaudin TJ. A reappraisal of the phylogeny of theMegatheria (Mammalia: Tardigrada), with an emphasis on the relationships ofthe Thalassocninae, the marine sloths. Zool J Linnean Soc. 2016;179:217–36.
47. Coutier F, Hautier L, Cornette R, Amson E, Billet G. Orientation of the lateralsemicircular canal in Xenarthra and its links with head posture andphylogeny. J Morphol. 2017;278:704–17.
48. Nyakatura JA. The convergent evolution of suspensory posture andlocomotion in tree sloths. J Mamm Evol. 2012;19:225–34.
49. Gaudin TJ. The ear region of edentates and the phylogeny of theTardigrada (Mammalia, Xenarthra). J Vertebr Paleontol. 1995;15:672–705.
50. Nyakatura JA, Fischer MS. Functional morphology of the muscular sling atthe pectoral girdle in tree sloths: convergent morphological solutions tonew functional demands? J Anat. 2011;219:360–74.
51. Amson E, Nyakatura JA. The postcranial musculoskeletal system ofxenarthrans: insights from over two centuries of research and futuredirections. J Mamm Evol. 2017:1–26.
52. Gaudin TJ, Biewener AA. The functional morphology of xenarthrousvertebrae in the armadillo Dasypus novemcinctus (Mammalia, Xenarthra). JMorphol. 1992;214:63–81.
53. Haddad V, Reckziegel GC, Neto DG, Pimentel FL. Human death caused by agiant anteater (Myrmecophaga tridactyla) in Brazil. Wilderness Environ Med.2014;25:446–9.
54. Perchalski B, Placke A, Sukhdeo SM, Shaw CN, Gosman JH, Raichlen DA, etal. Asymmetry in the cortical and trabecular bone of the human humerusduring development. Anat Rec. 2017. doi:10.1002/ar.23705.
55. Vico L, Collet P, Guignandon A, Lafage-Proust M-H, Thomas T, Rehailia M, etal. Effects of long-term microgravity exposure on cancellous and corticalweight-bearing bones of cosmonauts. Lancet. 2000;355:1607–11.
56. Blomberg SP, Garland T, Ives AR. Testing for phylogenetic signal incomparative data: behavioral traits are more labile. Evolution. 2003;57:717–45.
57. Kivell TL, Skinner MM, Lazenby R, Hublin J-J. Methodological considerationsfor analyzing trabecular architecture: an example from the primate hand. JAnat. 2011;218:209–25.
58. Schindelin J, Arganda-Carreras I, Frise E, Kaynig V, Longair M, Pietzsch T, etal. Fiji: an open-source platform for biological-image analysis. Nat Methods.2012;9:676–82.
59. Schindelin J, Rueden CT, Hiner MC, Eliceiri KW. The ImageJ ecosystem:an open platform for biomedical image analysis. Mol Reprod Dev. 2015;82:518–29.
60. Schneider CA, Rasband WS, Eliceiri KW. NIH image to ImageJ: 25 years ofimage analysis. Nat Methods Nature Publishing Group. 2012;9:671–5.
61. Doube M, Kłosowski MM, Arganda-Carreras I, Cordelières FP, Dougherty RP,Jackson JS, et al. BoneJ: free and extensible bone image analysis in ImageJ.Bone. 2010;47:1076–9.
62. Harrigan TP, Mann RW. Characterization of microstructural anisotropy inorthotropic materials using a second rank tensor. J Mater Sci. 1984;19:761–7.
63. Lees JM. RFOC: graphics for spherical distributions and earthquake focalmechanisms. R Package version. 2007;0–1.
64. Sode M, Burghardt AJ, Nissenson RA, Majumdar S. Resolution dependenceof the mon-metric trabecular structure indices. Bone. 2008;42:728–36.
65. Schmid B, Schindelin J, Cardona A, Longair M, Heisenberg M. A high-level3D visualization API for java and ImageJ. BMC bioinformatics. BioMedCentral Ltd. 2010;11:274.
66. R Development Core Team. R : a language and environment for statisticalcomputing. Vienna: R Foundation for Statistical Computing; 2013.
67. Tacutu R, Craig CT, Budovsky A, Wuttke D, Lehmann G, Taranukha D, et al.Human ageing genomic resources: integrated databases and tools for thebiology and genetics of ageing. Nucleic Acids Res. 2013;41:D1027–33.
68. Smith P, Owen RD. Calyptophractus retusus (Cingulata: Dasypodidae). MammSpecies. 2017;49:57–62.
69. Abba AM, Superina M. Dasypus hybridus (Cingulata: Dasypodidae). MammSpecies. 2016;48:10–20.
70. Hayssen V. Bradypus variegatus (Pilosa: Bradypodidae). Mamm Species. 2010;42:19–32.71. Hansen TF, Bartoszek K. Interpreting the evolutionary regression: the
interplay between observational and biological errors in phylogeneticcomparative studies. Syst Biol. 2012;61:413–25.
72. Pfaff C, Martin T, Ruf I. Bony labyrinth morphometry indicates locomotoradaptations in the squirrel-related clade (Rodentia, Mammalia). Proc R Soc B.2015;282:20150744.
73. Fox J, Weisberg S. An {R} companion to applied regression. Second.Thousand Oaks (CA): Sage; 2011.
Amson et al. Frontiers in Zoology (2017) 14:52 Page 16 of 17

74. Komsta L. Processing data for outliers. R News. 2006;6:10–3.75. Warnes GR, Bolker B, Bonebakker L, Gentleman R, Huber W, Liaw A, et al. Gplots:
various R programming tools for plotting data. R package version. 2009;2:1.76. Tsagris M, Athineou G, Sajib A. Directional: directional statistics. R
package version. 2016;277. Gibb GC, Condamine FL, Kuch M, Enk J, Moraes-Barros N, Superina M, et al.
Shotgun mitogenomics provides a reference phylogenetic framework andtimescale for living xenarthrans. Mol Biol Evol. 2016;33:621–42.
78. Paradis E, Claude J, Strimmer K. APE: analyses of phylogenetics andevolution in R language. Bioinformatics. 2004;20:289–90.
79. Harmon LJ, Weir JT, Brock CD, Glor RE, Challenger W. GEIGER: investigatingevolutionary radiations. Bioinformatics. 2008;24:129–31.
80. Bell MA, Lloyd GT. Strap: an R package for plotting phylogenies againststratigraphy and assessing their stratigraphic congruence. Palaeontology.2015;58:379–89.
81. Revell LJ. Phytools: an R package for phylogenetic comparative biology (andother things). Methods Ecol Evol. 2012;3:217–23.
82. Revell LJ. Phylogenetic signal and linear regression on species data.Methods Ecol Evol. 2010;1:319–29.
83. Pinheiro J, Bates D, DebRoy S, Sarkar D, R Core Team. Nlme: linear andnonlinear mixed effects models. R package version 3. 2016:1–128.
84. Freckleton RP, Harvey PH, Pagel M. Phylogenetic analysis and comparativedata: a test and review of evidence. Am Nat. 2016;160:712–26.
85. Mundry R. Statistical issues and assumptions of phylogenetic generalizedleast squares. Modern phylogenetic comparative methods and theirapplication in evolutionary biology. Heidelberg: Springer; 2014. p. 131–53.
86. Ryan TM, Shaw CN. Trabecular bone microstructure scales allometrically inthe primate humerus and femur. Proc R Soc B. 2013;280:20130172.
87. Amson E, de Muizon C, Laurin M, Argot C, de Buffrénil V. Gradualadaptation of bone structure to aquatic lifestyle in extinct sloths from Peru.Proc R Soc B. 2014;281:20140192.
88. Straehl FR, Scheyer TM, Forasiepi AM, MacPhee RDE, Sánchez-Villagra MR.Evolutionary patterns of bone histology and bone compactness inxenarthran mammal long bones. Farke AA, editor. PLoS One. 2013;8:e69275.
89. Amson E, de Muizon C, Domning DP, Argot C, de Buffrénil V. Bonehistology as a clue for resolving the puzzle of a dugong rib in the Piscoformation, Peru. J Vertebr Paleontol. 2015;35:e922981.
90. Mansat P, Barea C, Hobaltho M-C, Darmana R, Mansat M. Anatomic variationthe glenoid of the mechanical properties of the glenoid. J Shoulder ElbSurg. 1998;7:109–15.
91. Anglin C, Tolhurst P, Wyss UP, Pichora DR. Glenoid cancellous bonestrength and modulus. J Biomech. 1999;32:1091–7.
92. Frich LH, Odgaard A, Dalstra M. Glenoid bone architecture. J Shoulder ElbSurg. 1998;7:356–61.
93. Fajardo RJ, Müller R. Three-dimensional analysis of nonhuman primatetrabecular architecture using micro-computed tomography. Am J PhysAnthropol. 2001;115:327–36.
94. Scherf H, Harvati K, Hublin J. A comparison of proximal humeral cancellousbone of great apes and humans. J Hum Evol Elsevier Ltd. 2013;65:29–38.
95. Scherf H, Wahl J, Hublin J, Harvati K. Patterns of activity adaptation inhumeral trabecular bone in Neolithic humans and present-day people. AmJ Phys Anthropol. 2016;159:106–15.
96. Ryan TM, Walker A. Trabecular bone structure in the humeral and femoralheads of anthropoid primates. Anat Rec. 2010;293:719–29.
97. Hu JH, Ding M, SØballe K, Bechtold JE, Danielsen CC, Day JS, et al. Effects ofshort-term alendronate treatment on the three-dimensional microstructural,physical, and mechanical properties of dog trabecular bone. Bone. 2002;31:591–7.
98. Shaw CN, Ryan TM. Does skeletal anatomy reflect adaptation to locomotorpatterns? Cortical and trabecular architecture in human and nonhumananthropoids. Am J Phys Anthropol. 2012;147:187–200.
99. Currey JD. The mechanical adaptations of bones. Princeton: PrincetonUniversity Press; 1984.
100. Gebauer M, Barvencik F, Mumme M, Beil FT, Vettorazzi E, Rueger JM, et al.Microarchitecture of the radial head and its changes in aging. Calcif TissueInt. 2010;86:14–22.
101. Newitt DC, Majumdar S, Van Rietbergen B, Von Ingersleben G, Harris ST,Genant HK, et al. In vivo assessment of architecture and micro-finiteelement analysis derived indices of mechanical properties of trabecularbone in the radius. Osteoporos Int. 2002;13:6–17.
102. Doube M. The ellipsoid factor for quantification of rods, plates, andintermediate forms in 3D geometries. Front Endocrinol. 2015;6:1–5.
103. BoneJ. http://bonej.org/. Accessed 18 Aug 2017.
• We accept pre-submission inquiries
• Our selector tool helps you to find the most relevant journal
• We provide round the clock customer support
• Convenient online submission
• Thorough peer review
• Inclusion in PubMed and all major indexing services
• Maximum visibility for your research
Submit your manuscript atwww.biomedcentral.com/submit
Submit your next manuscript to BioMed Central and we will help you at every step:
Amson et al. Frontiers in Zoology (2017) 14:52 Page 17 of 17