customer satisfaction survey 2015 report - land … final report 2015...taxi needs to put more...
TRANSCRIPT

CUSTOMER SATISFACTION SURVEY
2015
December 2015

Co
pyr
igh
t ©
2013
Th
e N
iels
en C
om
pan
y. C
on
fid
enti
al a
nd
pro
pri
etar
y.
22
TABLE OF CONTENT
Background and design
Public transportation Users
Non – Public transportation users
Taxi vs hire and drive car services
Perception on public transport
Public perception on Suruhanjaya Pengangkutan Awam Darat (SPAD)

Co
pyr
igh
t ©
2014
Th
e N
iels
en C
om
pan
y. C
on
fid
enti
al a
nd
pro
pri
etar
y.
33
BACKGROUND AND DESIGN

4
PROGRAM BACKGROUND AND OBJECTIVESUnder the Government Transformation Programme (GTP), public transportation has beenidentified as one of the key pillar in driving national’s growth.
In order to gauge the effectiveness of public transportation initiatives, SPAD would like tounderstand general perceptions and satisfaction of public transportation among Greater KlangValley “Rakyat”.
The report will provide SPAD with actionable insights and strategically guide in crafting next actionsteps.
Programme objectives:
Measure customer satisfaction and future expectations
Prioritize areas of improvements
Understanding the needs for public transportation

5
PROGRAM DESIGN
Methodology Intercept - Face to Face – Computer Aided Paper Interview
Questionnaire structure Structured questionnaire of 15- 20 minutes
Sampling Plann=2,150(Location based sampling with nationality and time period quotas)
Fieldwork location Greater Klang Valley
Fieldwork period 30th October – 8th December
Target respondents• Users of public transportation in the past 3 months• Non-users of public transportation in the past 3 months
Co
pyr
igh
t ©
2013
Th
e N
iels
en
Co
mp
any.
Co
nfi
den
tial
an
d p
rop
riet
ary.
6
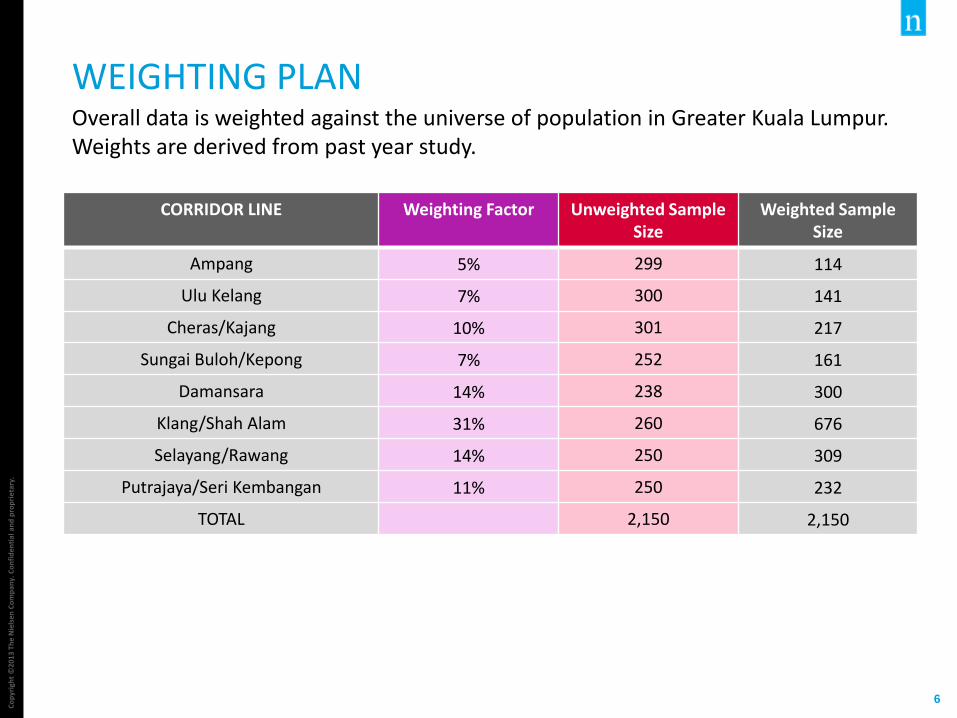
WEIGHTING PLANOverall data is weighted against the universe of population in Greater Kuala Lumpur. Weights are derived from past year study.
CORRIDOR LINE Weighting Factor Unweighted Sample Size
Weighted Sample Size
Ampang 5% 299 114
Ulu Kelang 7% 300 141
Cheras/Kajang 10% 301 217
Sungai Buloh/Kepong 7% 252 161
Damansara 14% 238 300
Klang/Shah Alam 31% 260 676
Selayang/Rawang 14% 250 309
Putrajaya/Seri Kembangan 11% 250 232
TOTAL 2,150 2,150

Co
pyr
igh
t ©
2013
Th
e N
iels
en
Co
mp
any.
Co
nfi
den
tial
an
d p
rop
riet
ary.
7
COVERAGE AND SAMPLING
CORRIDOR LINE PT USERS NON-PT USERS Total
Ampang 80 34 114
Ulu Kelang 98 43 141
Cheras/Kajang 151 66 217
Sungai Buloh/Kepong 98 63 161
Damansara 180 120 300
Klang/Shah Alam 461 215 676
Selayang/Rawang 199 110 309
Putrajaya/Seri Kembangan 145 87 232
TOTAL 1,412 738 2,150
PEAK VS NON PEAK PT USERS
Peak hours (7am – 10am & 5pm – 8pm)
703
Off peak hours (10am – 5pm)
709
NATIONALITY PT USERS NON-PT USERS
Malaysian 1,083 637
Non-Malaysian 329 101

Co
pyr
igh
t ©
2014
Th
e N
iels
en C
om
pan
y. C
on
fid
enti
al a
nd
pro
pri
etar
y.
88
PUBLIC TRANSPORTATION USERS

Co
pyr
igh
t ©
2013
Th
e N
iels
en
Co
mp
any.
Co
nfi
den
tial
an
d p
rop
riet
ary.
9
PUBLIC TRANSPORTATION USER’S PROFILEAge group is evenly spread across. However, compare to previous year, gender and race are skewed towards female and Malay.
Gender
37% 63%
Malay
Chinese
Indian
Others
RaceAge Group
19 and below
20-29
30-39
40 and above
13%
18%
39%
30%
Single
Married
55%
45%
72%
15%
12%
1%
5%19% 23%
35%
18%
SEC ERM1,000
below
SEC DRM1,000-RM2,000
SEC CRM2,001-RM3,000
SEC BRM3,001-RM5,000
SEC ARM5,001
above
Monthly household income
Co
pyr
igh
t ©
2013
Th
e N
iels
en
Co
mp
any.
Co
nfi
den
tial
an
d p
rop
riet
ary.
10
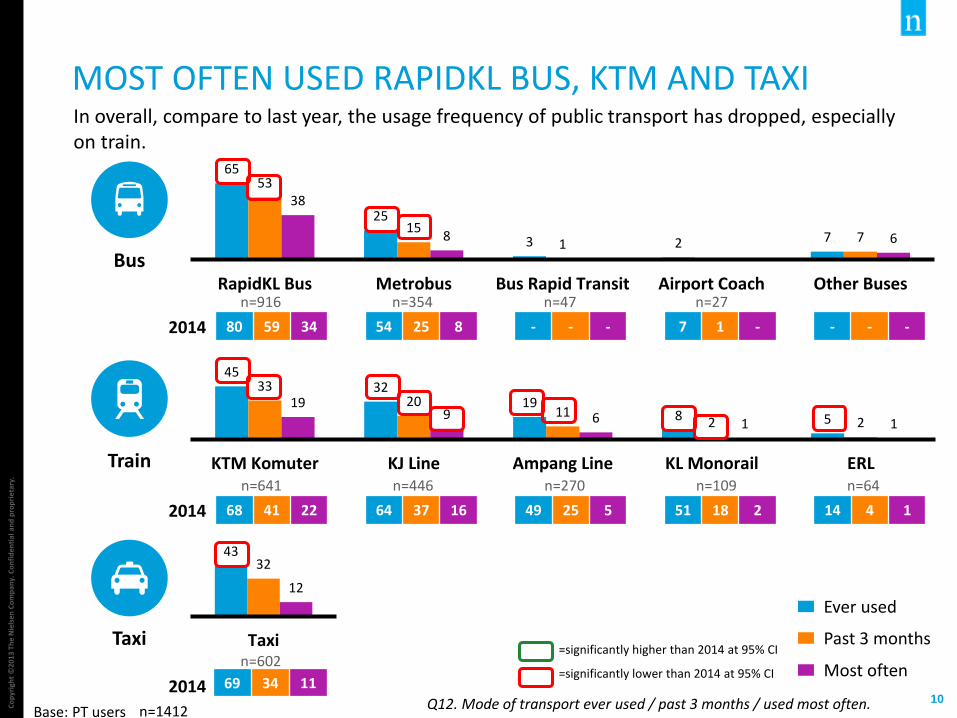
MOST OFTEN USED RAPIDKL BUS, KTM AND TAXIIn overall, compare to last year, the usage frequency of public transport has dropped, especially on train.
Q12. Mode of transport ever used / past 3 months / used most often.
65
25
3 2 7
53
151 7
38
8 6
RapidKL Bus Metrobus Bus Rapid Transit Airport Coach Other Buses
4532
198 5
3320
112 2
199 6 1 1
KTM Komuter KJ Line Ampang Line KL Monorail ERL
4332
12
Taxi
Train
Bus
Taxi
Ever used
Past 3 months
Most often
68 41 22 64 37 16 49 25 5 51 18 2 14 4 1
69 34 11
2014 80 59 34 54 25 8 - - - 7 1 - - - -
2014
2014
Base: PT users n=1412
n=916 n=354 n=47 n=27
n=641 n=446 n=270 n=109 n=64
n=602=significantly higher than 2014 at 95% CI
=significantly lower than 2014 at 95% CI
Co
pyr
igh
t ©
2013
Th
e N
iels
en
Co
mp
any.
Co
nfi
den
tial
an
d p
rop
riet
ary.
12
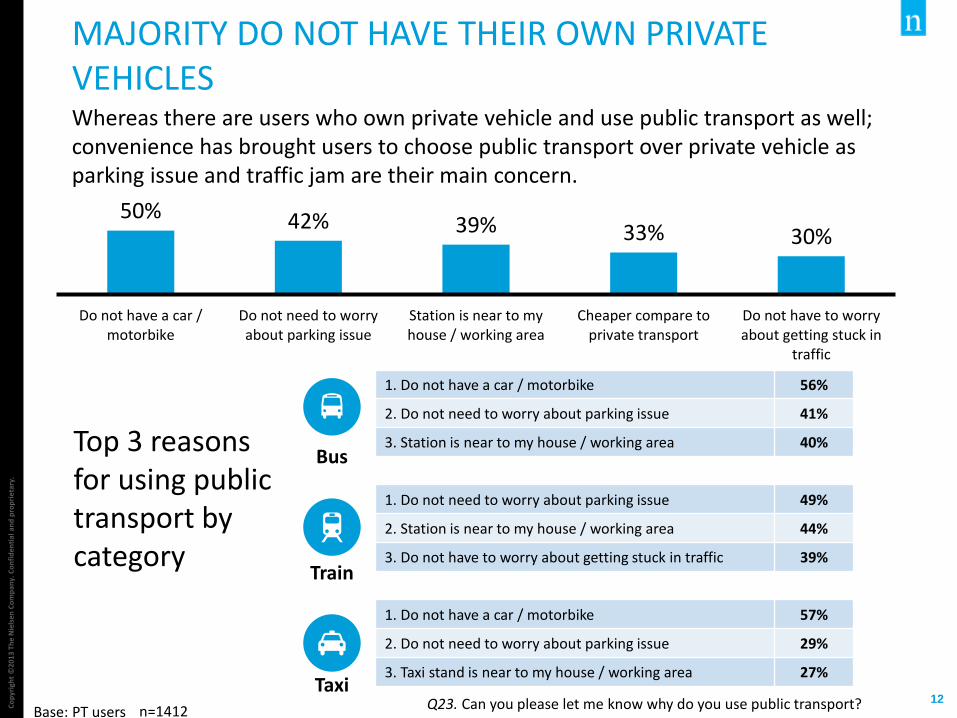
MAJORITY DO NOT HAVE THEIR OWN PRIVATE VEHICLESWhereas there are users who own private vehicle and use public transport as well; convenience has brought users to choose public transport over private vehicle as parking issue and traffic jam are their main concern.
50% 42% 39% 33% 30%
Do not have a car /motorbike
Do not need to worryabout parking issue
Station is near to myhouse / working area
Cheaper compare toprivate transport
Do not have to worryabout getting stuck in
traffic
Q23. Can you please let me know why do you use public transport?
Train
Bus
1. Do not have a car / motorbike 56%
2. Do not need to worry about parking issue 41%
3. Station is near to my house / working area 40%
1. Do not need to worry about parking issue 49%
2. Station is near to my house / working area 44%
3. Do not have to worry about getting stuck in traffic 39%
1. Do not have a car / motorbike 57%
2. Do not need to worry about parking issue 29%
3. Taxi stand is near to my house / working area 27%
Top 3 reasons for using public transport by category
TaxiBase: PT users n=1412

Co
pyr
igh
t ©
2013
Th
e N
iels
en
Co
mp
any.
Co
nfi
den
tial
an
d p
rop
riet
ary.
13
INTERCHANGEABILITY BETWEEN PUBLIC TRANSPORT IS HIGHMajority of users walk to bus/train station and they need to switch PT to reach their destination
Q15a/b. When you are travelling using public transportation, where is the origin and ending of your trip?Q16. Imagine on your daily trip, how many types of transportation do you use to reach your destination?Q17. When you are using public transport, what time do you start traveling and time to reach your destination?Base: PT users n=1412
First PT used
Second PT used
Third PT used
Forth PT used
88% of the PT users uses
more than one PT
28% of the PT users uses
more than three PT
End destination
Walking
RapidKL Bus KTM Komuter LRT
RapidKL BusLRT Taxi
RapidKL Bus Taxi Walking
School / College / University
Shopping Mall / Super & Hypermart
Office/Workplace
63%
32%
19%
10%
38%
18%
16%
10%
37%
13%
16%
7%
15%
RapidKL Bus
13%
Car / Motorcycle / Bicycle
11%
Top 3 methods used when commuting with public transport
40% of the PT users uses
more than two PT

Co
pyr
igh
t ©
2014
Th
e N
iels
en C
om
pan
y. C
on
fid
enti
al a
nd
pro
pri
etar
y.
1616
CUSTOMER SATISFACTION SCORE ON PUBLIC TRANSPORTATION
Co
pyr
igh
t ©
2013
Th
e N
iels
en
Co
mp
any.
Co
nfi
den
tial
an
d p
rop
riet
ary.
17
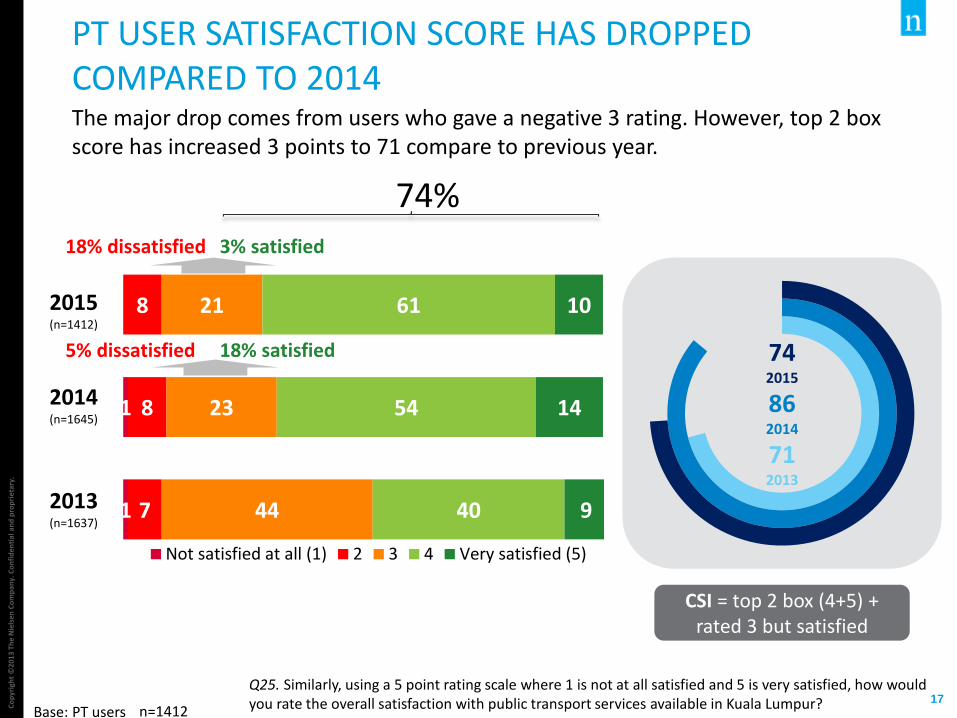
PT USER SATISFACTION SCORE HAS DROPPED COMPARED TO 2014The major drop comes from users who gave a negative 3 rating. However, top 2 box score has increased 3 points to 71 compare to previous year.
Q25. Similarly, using a 5 point rating scale where 1 is not at all satisfied and 5 is very satisfied, how would you rate the overall satisfaction with public transport services available in Kuala Lumpur?
1
1
8
8
7
21
23
44
61
54
40
10
14
9
Not satisfied at all (1) 2 3 4 Very satisfied (5)
CSI = top 2 box (4+5) + rated 3 but satisfied
2015(n=1412)
2014(n=1645)
2013(n=1637)
742015
862014
712013
3% satisfied18% dissatisfied
Base: PT users n=1412
18% satisfied5% dissatisfied
74%

Co
pyr
igh
t ©
2013
Th
e N
iels
en
Co
mp
any.
Co
nfi
den
tial
an
d p
rop
riet
ary.
18
LOWER SATISFACTION SCORE IS MAINLY CONTRIBUTED BY TAXITaxi needs to put more effort in improving the service where satisfaction score dropped.
RapidKL Bus
Metrobus
Ampang Line
KJ Line
KTM Komuter
KL Monorail
ERL
Taxi
1
8
4
3
2
7
8
14
17
16
20
20
26
18
15
21
65
68
70
65
56
72
49
54
9
12
7
13
10
10
29
10
Not satisfied at all (1) 2 3 4 Very satisfied (5)
74
81
77
78
67
82
77
64
SCORE (T2B)
n=539
n=114
n=78
n=127
n=265
n=15*
n=10*
n=176
65
60
70
83
61
62
76
74
2015 2014
Base: PT users n=1412
=significantly higher than 2014 at 95% CI
=significantly lower than 2014 at 95% CI
Q25. Similarly, using a 5 point rating scale where 1 is not at all satisfied and 5 is very satisfied, how would you rate the overall satisfaction with public transport services available in Kuala Lumpur? * Small base

Co
pyr
igh
t ©
2013
Th
e N
iels
en
Co
mp
any.
Co
nfi
den
tial
an
d p
rop
riet
ary.
20
LESS LIKELY TO USE PUBLIC TRANSPORT IN THE FUTURECorresponding to the lower satisfaction score, the likelihood to use PT in future has also dropped compared to 2014.
Q27a. Using the scale of 1 to 5, where 1 is highly unlikely and 5 is highly likely. How likely are you to continue using public transport in Kuala Lumpur in future.
0
1
1
2
31
19
55
53
12
25
Highly unlikely (1) 2 3 4 Highly likely (5)
Likelihood to use= Top 2 Box (4+5)
672015
782014
2015(n=1412)
2014(n=1645)
Base: PT users n=1412

Co
pyr
igh
t ©
2013
Th
e N
iels
en
Co
mp
any.
Co
nfi
den
tial
an
d p
rop
riet
ary.
21
ALMOST ALL PUBLIC TRANSPORTATIONS ARE AFFECTEDThe drop in the likelihood to use PT in future score is contributed by the ratings of urban rail and taxi.
Q27a. Using the scale of 1 to 5, where 1 is highly unlikely and 5 is highly likely. How likely are you to continue using public transport in Kuala Lumpur in future.
RapidKL Bus
Metrobus
Ampang Line
KJ Line
KTM Komuter
KL Monorail
ERL
Taxi
1
2
1
3
29
14
27
27
38
6
8
38
59
74
52
55
49
82
50
45
11
11
18
18
11
13
42
14
Highly unlikely (1) 2 3 4 Highly likely (5)
70
85
70
73
60
94
92
59
SCORE (T2B)
76
70
92
90
68
94
76
86
2015 2014
Base: PT users n=1412
n=539
n=114
n=78
n=127
n=265
n=15*
n=10*
n=176
=significantly higher than 2014 at 95% CI
=significantly lower than 2014 at 95% CI
* Small base

Co
pyr
igh
t ©
2013
Th
e N
iels
en
Co
mp
any.
Co
nfi
den
tial
an
d p
rop
riet
ary.
22
PRICE IS THE MAIN CONCERN
Q26. Why would you give a rating of on overall satisfaction with public transport services available in Kuala Lumpur?
63%
37%
6% 3% 3%
The price is expensive Public transport is slowand not on time
The public transport iscrowded
Drive attitude is poor The service is poor
Train
Bus
1. The price is expensive 39%
2. Public transport is slow and not on time 34%
3. The public transport is crowded 7%
1. The price is expensive 52%
2. Public transport is slow and not on time 30%
3. The public transport is crowded 6%
1. The price is expensive 75%
2. Public transport is slow and not on time 19%
3. Price is inaccurate 4%
Top 3 reasons for giving a low rating on public transport
Taxi
Base: PT users n=1412
With the current price increase in PT, users are not satisfied with the service offered by PT

Co
pyr
igh
t ©
2013
Th
e N
iels
en
Co
mp
any.
Co
nfi
den
tial
an
d p
rop
riet
ary.
24
MAJORITY WILL CONTINUE TO USE PUBLIC TRANSPORT IF CONCERNS ARE ADDRESSED
Q20a. If your concerns were addressed, how likely are you going to use public transport?
9 39 42 10
Very unlikely (1) 2 3 4 Very likely (5)
Likelihood to continue using
= Top 2 Box (4+5)
522015
2015(n=1412)
Base: PT users n=1412

Co
pyr
igh
t ©
2013
Th
e N
iels
en
Co
mp
any.
Co
nfi
den
tial
an
d p
rop
riet
ary.
25
WHAT DRIVES IMPROVEMENT ON OVERALL SATISFACTION SCORE?
Q24a. Statement on experience in using public transport in Kuala Lumpur. Please use the rating from 1 to 5.Base: PT users n=1412
Frequency of service is sufficient
2014
642015
65
Value for money
2014
882015
72
Interior cleanliness of public transport
2014
672015
71
Clarity of the route map
2014
792015
68
Clarity of the fare
2014
762015
71
Time saving on travel
2014
-2015
67
Focus on improving frequency of service and price perceptions for 2016 overall satisfaction score
1 2 3
4 5 6

Co
pyr
igh
t ©
2014
Th
e N
iels
en C
om
pan
y. C
on
fid
enti
al a
nd
pro
pri
etar
y.
2727
NON - PUBLIC TRANSPORTATION USERS

Co
pyr
igh
t ©
2013
Th
e N
iels
en
Co
mp
any.
Co
nfi
den
tial
an
d p
rop
riet
ary.
28
PROFILE OF NON PUBLIC TRANSPORT USERS
Gender
59% 41%
Malay
Chinese
Indian
Others
RaceAge Group
19 and below
20-29
30-39
40 and above
5%
23%
37%
35%
Single
Married
40%
60%
76%
13%
11%
0%
1% 10%
22%
45%
23%
SEC ERM1,000
below
SEC DRM1,000-RM2,000
SEC CRM2,001-RM3,000
SEC BRM3,001-RM5,000
SEC ARM5,001
above
Monthly household income
Co
pyr
igh
t ©
2013
Th
e N
iels
en
Co
mp
any.
Co
nfi
den
tial
an
d p
rop
riet
ary.
29
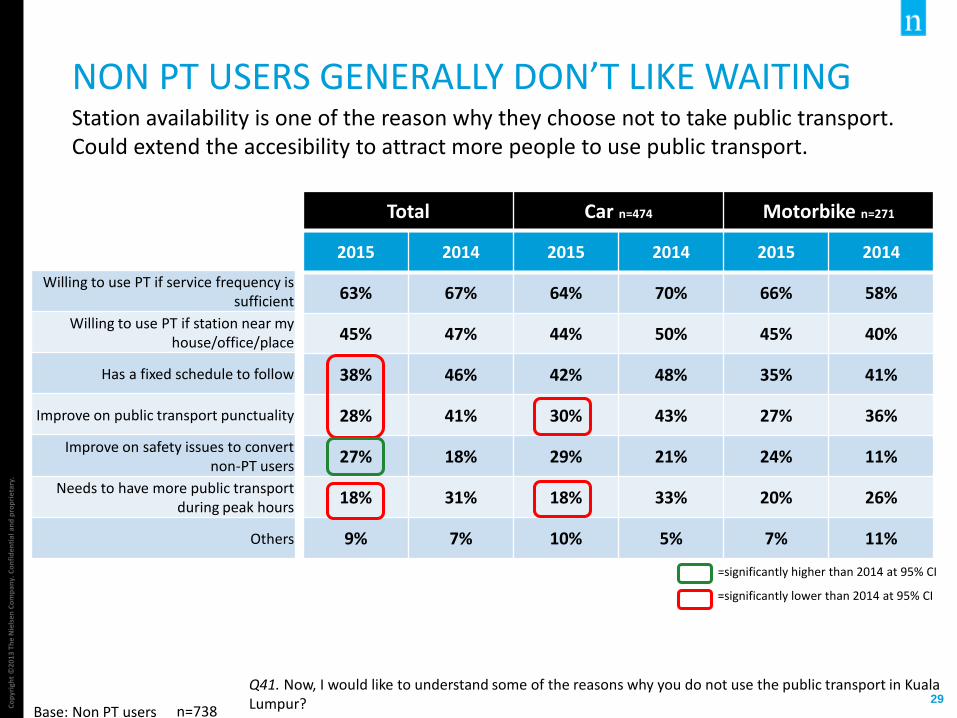
NON PT USERS GENERALLY DON’T LIKE WAITINGStation availability is one of the reason why they choose not to take public transport. Could extend the accesibility to attract more people to use public transport.
Q41. Now, I would like to understand some of the reasons why you do not use the public transport in Kuala Lumpur?
Willing to use PT if service frequency is sufficient
Willing to use PT if station near my house/office/place
Has a fixed schedule to follow
Improve on public transport punctuality
Improve on safety issues to convertnon-PT users
Needs to have more public transport during peak hours
Others
Base: Non PT users n=738
2015 2014 2015 2014 2015 2014
63% 67% 64% 70% 66% 58%
45% 47% 44% 50% 45% 40%
38% 46% 42% 48% 35% 41%
28% 41% 30% 43% 27% 36%
27% 18% 29% 21% 24% 11%
18% 31% 18% 33% 20% 26%
9% 7% 10% 5% 7% 11%
Total Car n=474 Motorbike n=271
=significantly higher than 2014 at 95% CI
=significantly lower than 2014 at 95% CI

Co
pyr
igh
t ©
2013
Th
e N
iels
en
Co
mp
any.
Co
nfi
den
tial
an
d p
rop
riet
ary.
30
OVERALL SATISFACTION HAS INCREASED AMONG NON PT USERSNon PT users perception towards public transport has improved significantly.
Q43a. I understand that you have not taken any public transport in the past 3 months, however I would like to understand your perception on public transport system in Kuala Lumpur, with a 5 point rating scale, whereby 1 is not at all satisfied and 5 is very satisfied, can you please let me know your overall satisfaction with public transport services available in Kuala Lumpur?
1
1
13
15
10
37
36
37
46
45
49
3
4
3
Not satisfied at all (1) 2 3 4 Very satisfied (5)
Total
Car owners
Motorcycle owners
2015
49 32
49 30
52 39
2014
Base: Non PT users n=738
=significantly higher than 2014 at 95% CI
=significantly lower than 2014 at 95% CI

Co
pyr
igh
t ©
2013
Th
e N
iels
en
Co
mp
any.
Co
nfi
den
tial
an
d p
rop
riet
ary.
31
LIKELIHOOD SCORE HAS IMPROVED COMPARED TO PREVIOUS YEARExtension of accesibility is recommended in order to drive more users as the likeliness to use public transport has increased significantly.
Q42. With a rating scale of 1 to 5, where 1 is unlikely to consider and 5 is likely to consider. If there was a train / LRT / Monorail / BRT / Bus station within 1km from your home / work place, how likely would you to use public transport.
1
1
1
14
16
11
46
45
46
34
33
37
5
5
5
Not satisfied at all (1) 2 3 4 Very satisfied (5)
Total
Car owners
Motorcycle owners
2015
39 31
38 30
42 34
2014
Base: Non PT users n=738
=significantly higher than 2014 at 95% CI
=significantly lower than 2014 at 95% CI

Co
pyr
igh
t ©
2014
Th
e N
iels
en C
om
pan
y. C
on
fid
enti
al a
nd
pro
pri
etar
y.
3232
TAXI VS RIDE SHARING E-BOOKING APPS

Co
pyr
igh
t ©
2013
Th
e N
iels
en
Co
mp
any.
Co
nfi
den
tial
an
d p
rop
riet
ary.
33
AWARENESS AND USAGE RATE OF RIDE SHARING E-BOOKING APPS SERVICE IS STILL LOWMajority of the users know ride sharing e-booking apps from friends and relatives. 2 out of 10 users perceive ride sharing e-booking apps to be legal.
Q28. Are you aware of any ride sharing e-booking apps (e.g. GrabCar / Uber) in Kuala Lumpur? Q29. From which sources, do you know about ride sharing e-booking apps (e.g. GrabCar / Uber)?Q32. Do you use ride sharing e-booking apps (e.g. GrabCar / Uber)?Q33. How often do you use ride sharing e-booking apps (e.g. GrabCar / Uber)? Q37. Which of the following statement best describe ride sharing e-booking apps (e.g. GrabCar/Uber) in Malaysia.
Heard from friends and relatives
Read articles and reviews on the web/forum
Read the information on social media
Saw online ads on website / social networks
Saw app’s logo or ads on taxi
Sources to know about ride sharing
e-booking apps
57%
24%
21%
13%
17%
Base: PT users n=1412
Awareness
Currently use
People’s perception on ride sharing e-booking apps
2
10
n=148
* Small base
6 out of 10 are not aware of the legality on ride sharing e-booking
apps

Co
pyr
igh
t ©
2013
Th
e N
iels
en
Co
mp
any.
Co
nfi
den
tial
an
d p
rop
riet
ary.
34
Reasons to prefer Taxi
Easy and convenient to get 43%
Legal and monitored 32%
It is safer to use taxi 22%
Reasons to prefer ride sharing services
Cheaper than taxi 49%
Easy and convenient to get 34%
More comfortable 32%
PUBLIC TRANSPORT USERS STILL PREFER TAXIUsers perceive both taxi ride sharing e-booking apps are convenient to use. Whereas users mentioned taxi is legal and monitored, and it is more safe to use.
Q30. If you are travelling to a destination, which of the following mode of transport would you prefer? Q31. Why do you prefer … when you are travelling?n=148
Preference on Taxi vs Ride Sharing E-Booking Apps n=148
* Small base
79%
21%
Base: Aware of ride sharing e-booking apps
80%
20%
78%
22%
Total Male Female
Users who prefer ride sharing e-booking apps
Users who prefer taxi
Co
pyr
igh
t ©
2013
Th
e N
iels
en
Co
mp
any.
Co
nfi
den
tial
an
d p
rop
riet
ary.
35
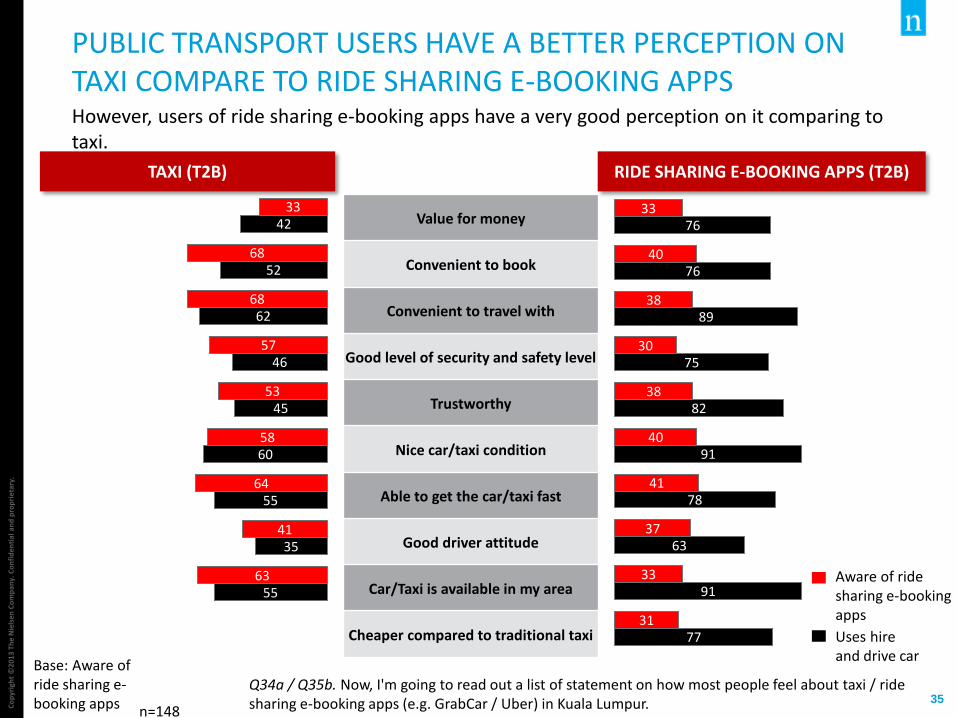
PUBLIC TRANSPORT USERS HAVE A BETTER PERCEPTION ON TAXI COMPARE TO RIDE SHARING E-BOOKING APPSHowever, users of ride sharing e-booking apps have a very good perception on it comparing to taxi.
33
40
38
30
38
40
41
37
33
31
76
76
89
75
82
91
78
63
91
77
Value for money
Convenient to book
Convenient to travel with
Good level of security and safety level
Trustworthy
Nice car/taxi condition
Able to get the car/taxi fast
Good driver attitude
Car/Taxi is available in my area
Cheaper compared to traditional taxi
Q34a / Q35b. Now, I'm going to read out a list of statement on how most people feel about taxi / ride sharing e-booking apps (e.g. GrabCar / Uber) in Kuala Lumpur.
33
68
68
57
53
58
64
41
63
42
52
62
46
45
60
55
35
55
RIDE SHARING E-BOOKING APPS (T2B)TAXI (T2B)
Base: Aware of ride sharing e-booking apps n=148
Aware of ride sharing e-booking apps
Uses hire and drive car

Co
pyr
igh
t ©
2013
Th
e N
iels
en
Co
mp
any.
Co
nfi
den
tial
an
d p
rop
riet
ary.
36
USERS WILL CONTINUE USING RIDE SHARING E-BOOKING APPS
Q36a. Using the scale of 1 to 5, where 1 is highly unlikely and 5 is highly likely, how likely are you going to continue using ride sharing e-booking apps (e.g. GrabCar/Uber)?
23 64 13
Highly unlikely (1) 2 3 4 Highly likely (5)
Likelihood to continue use= Top 2 Box (4+5)
Base: Ride sharing e-booking apps users n=22*
* Small base
772015
People will move towards using ride sharing e-booking apps if they have started using the service.
Co
pyr
igh
t ©
2014
Th
e N
iels
en C
om
pan
y. C
on
fid
enti
al a
nd
pro
pri
etar
y.
3737
PERCEPTION ON PUBLIC TRANSPORT

Co
pyr
igh
t ©
2013
Th
e N
iels
en
Co
mp
any.
Co
nfi
den
tial
an
d p
rop
riet
ary.
38Q45a. Would like to understand your perception of public transport in Kuala Lumpur. I'm going to read out a list of statements, please use the rating from 1 to 5 where 1 is strongly disagree and 5 is strongly agree.
74
67
67
66
66
65
65
65
64
63
62
There is a comprehensive public transport network in Kuala Lumpur
The government is committed on improving public transport in Kuala Lumpur
The public transport in Kuala Lumpur is modern and up to date
Most people in Kuala Lumpur will use public transport at least once every 3 months
It's easy to transfer from one train system to another
The public transport network has improved in the past few years
Using public transport in Kuala Lumpur offers good value for money
The public transport network is very safe to use and offers good security
Using public transport is often quicker than making the same journey by car
The public transport network in Kuala Lumpur is better than in most other South East Asian capital cities
It is easy for me to take public transport to get to and from where I live
SCORE (T2B)
2014
67
55
48
56
58
56
69
59
44
36
53
PT USERS NON PT USERS
2015 2014 2015 2014
79 77 66 48
71 61 59 42
71 56 59 32
70 63 59 40
69 67 59 40
68 64 60 39
71 79 54 49
68 70 57 37
67 53 59 26
68 41 54 26
67 64 52 30
2015
Base: All Respondents n=2150
=significantly higher than 2014 at 95% CI
=significantly lower than 2014 at 95% CI
NON PT USERS PERCEPTION TOWARDS PUBLIC TRANSPORT HAS INCREASED SIGNIFICANTLYHowever, the PT users perception on value of money has dropped compare to previous year which mainly due to the recent price hike in public transport.
Co
pyr
igh
t ©
2014
Th
e N
iels
en C
om
pan
y. C
on
fid
enti
al a
nd
pro
pri
etar
y.
4040
PUBLIC PERCEPTION ON SURUHANJAYA PENGANGKUTAN AWAM DARAT (SPAD)

Co
pyr
igh
t ©
2013
Th
e N
iels
en
Co
mp
any.
Co
nfi
den
tial
an
d p
rop
riet
ary.
41
SPAD NEEDS TO IMPROVE ON AWARENESSThe awareness of SPAD has dropped compare to previous year. Recommend to continue advertising on public transport and newspaper/magazine which is the main source of information for public.
Q47. Are you aware of Suruhanjaya Pengangkutan Awam Darat (SPAD), it is a Government authority in charge of public transport system in Malaysia? Q49. From which sources, do you know about Suruhanjaya Pengangkutan Awam Darat (SPAD)?
Ads in public transport
Friends / Colleagues / Relatives
Newspaper / Magazine
Sharing of social network (Facebook, Twitter, Blog, Instagram)
Official Suruhanjaya Pengangkutan Awam Darat (SPAD) website
Radio
Outdoor billboards on the road
Ads in building or elevator
47%
41%
34%
20%
18%
15%
15%
8%
Source of awareness
Base: Malaysian n=1720
32%are aware of
SPAD
34%43%
2013 20152014

Co
pyr
igh
t ©
2013
Th
e N
iels
en
Co
mp
any.
Co
nfi
den
tial
an
d p
rop
riet
ary.
42
SPAD INITIATIVE IS KNOWN AMONG THOSE WHO ARE AWAREBus rapid transit, TR1MA and increasing KTM capacity are the top 3 initiatives people knows.
Q48. If you are aware of Suruhanjaya Pengangkutan Awam Darat (SPAD), are you aware of any initiatives SPAD did to improve the public transport system?
73% knows about
initiatives SPAD did to improve
PT system
Bus rapid transit (BRT)
Teksi rakyat 1 Malaysia - TR1MA
Increase KTM Komuter capacity and ridership numbers
Increase LRT and monorail capacity and efficiency
Increase and integrate existing rail network in Klang Valley (KVMRT)
High speed rail (HSR)
GO-KL city bus - Malaysia's first free bus service
Malaysia-Singapore rapid transit system (RTS)
Bus stop enhancement program
Interim stage bus support fund (ISBSF)
MeterOn mobile app
37%
33%
32%
29%
26%
21%
18%
18%
17%
15%
10%
SPAD initiatives
Base: Malaysians who are aware of SPAD n=546

Co
pyr
igh
t ©
2013
Th
e N
iels
en
Co
mp
any.
Co
nfi
den
tial
an
d p
rop
riet
ary.
43
PUBLIC ARE CLEAR ON SPAD RESPONSIBILITIESNo much difference among PT and Non PT users as both segments has high understanding on SPAD’s duty.
Q50. Now, I'm going to read out some statement about SPAD, please let me know if the statement is true or false, there is no right or wrong answer just answer based on what you feel.
2015 2014 2015 2014 2015 2014
96% 81% 96% 82% 96% 79%
88% 89% 90% 91% 84% 84%
88% 66% 89% 65% 86% 68%
85% 68% 88% 68% 81% 68%
The Land Public Transport Commission in Malaysia
Responsible for the development of public transport in Malaysia
An organization you can directly address your thoughts on public transport in Malaysia
Responsible for drawing up policies, planning, regulating all aspects of train, bus and taxi services in Malaysia
Total PT Users Non PT Users
Base: Aware of SPAD n=546
=significantly higher than 2014 at 95% CI
=significantly lower than 2014 at 95% CI
Public Perceptions on SPAD

Co
pyr
igh
t ©
2013
Th
e N
iels
en
Co
mp
any.
Co
nfi
den
tial
an
d p
rop
riet
ary.
44
SPAD NEEDS TO IMPROVE / RE-LOOK ON PRICE AND TIMETABLE
Q51. What suggestion can you give on how Suruhanjaya Pengangkutan Awam Darat (SPAD) can improve?Base: Aware of SPAD n=558
Total PT users Non PT users
20% 21% 20%
20% 21% 18%
14% 14% 14%
10% 16% 4%
10% 9% 11%
9% 6% 12%
7% 8% 6%
8% 5% 10%
7% 9% 5%
6% 5% 7%
5% 3% 8%
8% 8% 8%
Lower the price of public transport
Increase the frequency of public transport
Improve the schedule of public transport
Better regulation on the taxi pricing
Increase the monitoring/control of public transport
Improve the safety level of public transport
Improve the attitude of public transport drivers
Raise awareness of consumers on road safety
Improve the public transport with new vehicles
Improve the road conditions
Expand the reach of public transport
Others
What Should SPAD Improve On?

Co
pyr
igh
t ©
2014
Th
e N
iels
en C
om
pan
y. C
on
fid
enti
al a
nd
pro
pri
etar
y.
4545
KEY SUMMARY

Co
pyr
igh
t ©
2013
Th
e N
iels
en
Co
mp
any.
Co
nfi
den
tial
an
d p
rop
riet
ary.
46
KEY SUMMARY
Overall satisfaction score on PT users has dropped as compared to2014, mainly due to the price hike in public transport, which wasannounced during the survey period.
Main reason for people to use public transport is because, they do nothave any private transport. However, those who own a privatetransport but continue to use public transport are due to the concernof traffic jam and limited parking space.
Likelihood to use public transport in future has dropped. Urban railand Taxi score has a huge dropped which contributed to the drop oflikelihood score.
Pricing is the main reason of satisfaction drop follow by publictransport being slow and not on time. Needs to look into bothattributes as it is the two main drivers.
01
02
03
04

Co
pyr
igh
t ©
2013
Th
e N
iels
en
Co
mp
any.
Co
nfi
den
tial
an
d p
rop
riet
ary.
47
RECOMMENDATION
TO REGAIN CUSTOMER SATISFACTION...
Needs to focus more on frequency of service and the price of public transport as it is the top two factors.
Reschedule the timetable and have more number of public transport available.
Provide incentives or rebates to frequent users to solve the price issue.
Better regulation apply to taxi as the overall score has dropped the most.
Taxi in particular has the highest drop among all public transport, needs to pay more attention on improving the service.
Co
pyr
igh
t ©
2013
Th
e N
iels
en
Co
mp
any.
Co
nfi
den
tial
an
d p
rop
riet
ary.
48
RECOMMENDATION
ENCOURAGE NON - PT USERS TO USE PUBLIC TRANSPORT...
Overall satisfaction and likelihood to try public transport has increased compare to previous year.
Increasing the reach by providing more locations available for public transport.
Similar to PT users, reschedule the timetable, have more number of public transports available.