custom transit services - north shore disability ... efficiency review transit system performance 37...
TRANSCRIPT

TransLink Efficiency Review
Transit System Performance 33
CUSTOM TRANSIT SERVICES
Custom transit services cater to people with special needs who are generally unable to use
conventional transit. Eligibility to use custom transit is based on criteria determined by each transit
agency. In B.C., public transit agencies, including TransLink’s predecessor, BC Transit, became
involved in providing custom transit service in both Vancouver and Victoria in 1980. This
represented the first time that the BC government directly committed funds to transit operators for
the delivery of transportation services for the disabled. Previously, these specialized services were
supplied by local service groups on a non-profit basis.
The new custom transit service, using vans to provide door-to-door service (HandyDART), was
expanded across Metro Vancouver but remained a separate and parallel service to the conventional
transit system. While regional in scope, the service was delivered under contract by seven non-
profit societies and private companies in eight service areas. For cost efficiency, contractors used
local taxi companies to supplement van service to transport some ambulatory passengers as well as
serve trips made before and after core business hours. BC Transit also introduced a taxi scrip
program whereby registrants were eligible to pre-purchase taxi coupons good for on-demand taxi
rides, with the costs shared 50:50 between the user and the transit authority.
In 2008, TransLink restructured its custom transit services with the express intent of improving both
the quality of customer service and operations management, and set out to reduce its service areas
from eight to three. After a competitive procurement process, a private company, MVT Canadian
Bus, was awarded the contract for all three areas. It should also be noted that a three month labour
disruption occurred from October 2009 to January 2010 during which only medically necessary trips
were accommodated by the contractor.
Five-Year Trend
The following table presents the key measure of service performance between 2006 and 2010 for
TransLink’s custom transit system.
TABLE 4-3: CUSTOM TRANSIT SERVICE STATISTICS, 2006 TO 2010
2006 2007 2008 2009 2010 % CHANGE
2006-10
Total Operating Cost (million)1 $25.5 $28.1 $33.9 $39.4 $44.2 73.2%
Revenue Hours (million) .52 .55 .59 .52 .59 14.3%
Revenue Kilometres (million) 8.45 8.80 9.36 8.67 9.87 16.8%
Passengers (million) 1.36 1.42 1.49 1.34 1.47 7.4%
Passenger Revenue (million)12
$1.17 $1.90 $1.88 $1.67 $2.06 75.9%
Vehicles 292 337 337 362 338 15.8%
Source: CUTA Canadian Transit Fact Books, 2006 to 2010 1 Excludes Taxiscrip costs
12
TransLink changed its method of fare allocation in 2007 to include pre-paid media that was not included in 2006.

TransLink Efficiency Review
Transit System Performance 34
Custom Transit costs have risen sharply
TransLink’s restructuring of custom transit service has come at a high cost. The total program cost
(HandyDART, non-dedicated supplemental taxi services and Taxi Scrip) increased during the past five
years from $27.4 million in 2006 to $46.7 million in 2010 or by 70.4%. By comparison, the total cost
of operating conventional transit services increased 50.7% over the same period.
Expenditures on operations increased by 72.4% over the five year period, while maintenance and
fuel rose 53.8% and 23.4% respectively. However, administration almost tripled, growing from $0.6
million in 2006 to $2.4 million in 2010. The big increase in administration costs occurred in 2008 and
2009, reflecting the major changeover to the consolidated system and the introduction of new
technologies. However, administration costs were reduced in 2010 by more than $200,000.
In discussions with management, roughly 40% of the cost increase is attributed to higher labour
costs, including salaries, wages and benefits. Another 35% is due to the establishment of new
functions, such as the Access Transit office, the call centre, on-road supervision and the introduction
of new technologies, including mobile data terminals, automated vehicle location systems, and
advanced scheduling, dispatching and operations management software. The remaining is due to
service expansion.
Source: CUTA Canadian Transit Fact Books
$21.7M
$1.9M$1.3M
$1.8M$.6M
Operations Taxi Scrip Maintenance Fuel Administration
$37.5M
$2.5M
$2.1M$2.2M
$2.4M
2010
Operations Taxi Scrip Maintenance Fuel Administration
$37.5M
$2.5M
$2.1M$2.2M
$2.4M
2010
Operations Taxi Scrip Maintenance Fuel Administration
2006 $27,401,798
2010 $46,670,651
FIGURE 4-18: TRANSLINK CUSTOM TRANSIT, GROWTH IN OPERATING COSTS, 2006 AND 2010

TransLink Efficiency Review
Transit System Performance 35
Service and ridership grew moderately
The level of custom transit service
as measured by vehicle revenue
hours available to customers grew
by 14.3% between 2006 and 2010.
Revenue passengers (HandyDART
including non-dedicated
supplemental taxis) carried
increased at a lower rate of 8.8%
from 1.2 million to 1.3 million over
this period. This latter increase may
be somewhat understated due to
the absence of non-essential trips
for one week and after effects of
the labour strike in 2010.
Preliminary figures for 2011 indicate
revenue passengers increased by 4% over 2010. However, management also observed that the
introduction of the new SkyTrain line between Richmond and Vancouver has attracted trips and
resulted in a decline in service requests from this corridor.
At the same time, aging of the region’s population does not appear to have translated into a
growing number of custom transit registrants. Active registrants have remained basically the same
at around 22,000 per year since 2006.
Fare revenue and average fares have increased
CUTA’s reported revenue from custom transit users increased 76% between 2006 and 2010, in part
due to a fare increase in 2008. TransLink, however, advises that prior to 2008, they did not attribute
any revenue to custom transit from pre-paid fare media accepted on HandyDART. As a result, fare
revenues in 2006 and 2007 were understated. Using the new method of allocation, TransLink
estimates the actual growth in revenue was 25%. The revised average fare grew from $1.31 in 2006
to $1.55 in 2010 or by 18%.
Source: CUTA Canadian Transit Fact Books
FIGURE 4-19: TRANSLINK CUSTOM TRANSIT, RIDERSHIP, 2006-2010
1.10
1.15
1.20
1.25
1.30
2006 2007 2008 2009 2010
Mill
ion
s o
f P
asse
nge
rs

TransLink Efficiency Review
Transit System Performance 36
Custom Transit Performance
This section focuses primarily on the custom transit’s performance between 2006 and 2010 based
on the five key performance indicators.
Cost efficiency has declined
Total operating cost per hour (excluding taxi scrip) increased significantly (51.5%) from $49.08 in
2006 to $74.37 in 2010. The cost of labour was a major driver in pushing up costs. This includes
salaries, wages and benefits paid by
the contractor as well as overhead
costs at Coast Mountain Bus
Company, which manages the
custom transit service on behalf of
TransLink.
With operating costs increasing
sharply and ridership growing
slowly, cost per revenue passenger
grew from $21.66 to $34.48 over
the five year period. This
represented an increase of 59.2%,
which is over nine times the rate of
inflation (6.4%) over this period.
Ridership is up but productivity has declined
Passengers per hour, an important
productivity measure, declined
slightly from 2.27 to 2.16, even after
the introduction of new technology.
Door-to-door transportation by its
nature has relatively low volumes as
it is hard to group many rides. The
strike’s impact on ridership may
have contributed to this decrease.
Management reports that, while
cross-boundary trips have increased
as a result of the consolidation of
operators, they remain a very small
percentage of total trips and thus
are unlikely to have an affect.
Source: CUTA Canadian Transit Fact Books
FIGURE 4-20: TRANSLINK CUSTOM TRANSIT, COST PER PASSENGER & HOUR, 2006-2010
0%
10%
20%
30%
40%
50%
60%
2006 2007 2008 2009 2010
Cu
mu
lati
ve G
row
th Cost perPassenger
Cost per Hr
Inflation
Source: CUTA Canadian Transit Fact Books
FIGURE 4-21: TRANSLINK CUSTOM TRANSIT, PASSENGERS PER HOUR, 2006-2010
2.00
2.05
2.10
2.15
2.20
2.25
2.30
2.35
2.40
2006 2007 2008 2009 2010
Pas
sen
gers
pe
r H
r

TransLink Efficiency Review
Transit System Performance 37
Cost recovery is very low
Based on CUTA numbers, the revenue to cost ratio increased slightly from 4.3% to 4.4%. However,
using TransLink’s revised revenue allocation for custom transit in 2006 and 2007, the cost recovery
declined from 6% to 4.4%. Regardless, cost recovery remains very low.
Administration cost ratio has more than doubled
The proportion of administration
costs to total costs more than
doubled from 2.2% in 2006 to 5.1%
in 2010 due to the much higher
growth in administration relative to
total service cost. The increase in
this indicator reflects the
restructuring of the HandyDART
service, including the move to
professional management and
introduction of new technology.
How Does TransLink’s Performance Compare to its Peers?
This section compares TransLink’s custom transit service performance to those of the Toronto (TTC),
Edmonton, Calgary and Victoria (BC Transit) transit systems. While all four peer systems provide
custom transit service similar to TransLink, the comparison group represent a mix of service delivery
models that include privately operated services delivered under contract (TransLink and Victoria); a
mix of publicly operated and privately operated services (Toronto and Edmonton); and, a mixed
model of non-profit and privately operated service under contract (Calgary Transit). A description of
each of the peer systems is provided below.
As a result of the variety of service delivery systems in place, the diversity of vehicles used and some
inconsistencies in reporting, comparisons between the peers is challenging. A number of omissions
and anomalies were observed that required some follow-ups and adjustments.
Source: CUTA Canadian Transit Fact Books
FIGURE 4-22: TRANSLINK CUSTOM TRANSIT, GROWTH IN COSTS, 2006-2010
0%
50%
100%
150%
200%
250%
300%
2006 2007 2008 2009 2010
Cu
mu
lati
ve G
row
th
Total Cost
Admin Cost
Inflation
TransLink Efficiency Review
Transit System Performance 38
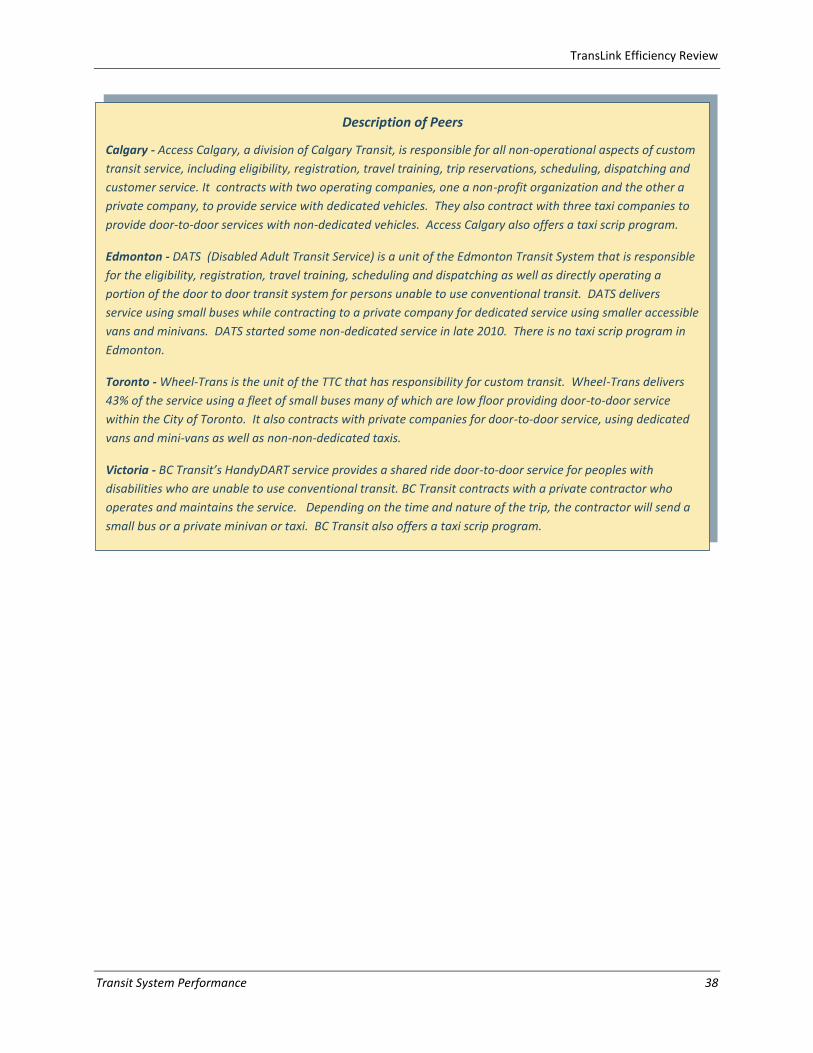
Description of Peers
Calgary - Access Calgary, a division of Calgary Transit, is responsible for all non-operational aspects of custom
transit service, including eligibility, registration, travel training, trip reservations, scheduling, dispatching and
customer service. It contracts with two operating companies, one a non-profit organization and the other a
private company, to provide service with dedicated vehicles. They also contract with three taxi companies to
provide door-to-door services with non-dedicated vehicles. Access Calgary also offers a taxi scrip program.
Edmonton - DATS (Disabled Adult Transit Service) is a unit of the Edmonton Transit System that is responsible
for the eligibility, registration, travel training, scheduling and dispatching as well as directly operating a
portion of the door to door transit system for persons unable to use conventional transit. DATS delivers
service using small buses while contracting to a private company for dedicated service using smaller accessible
vans and minivans. DATS started some non-dedicated service in late 2010. There is no taxi scrip program in
Edmonton.
Toronto - Wheel-Trans is the unit of the TTC that has responsibility for custom transit. Wheel-Trans delivers
43% of the service using a fleet of small buses many of which are low floor providing door-to-door service
within the City of Toronto. It also contracts with private companies for door-to-door service, using dedicated
vans and mini-vans as well as non-non-dedicated taxis.
Victoria - BC Transit’s HandyDART service provides a shared ride door-to-door service for peoples with
disabilities who are unable to use conventional transit. BC Transit contracts with a private contractor who
operates and maintains the service. Depending on the time and nature of the trip, the contractor will send a
small bus or a private minivan or taxi. BC Transit also offers a taxi scrip program.

TransLink Efficiency Review
Transit System Performance 39
Mixed performance when compared to peers
Compared to the other systems, TransLink had the second highest growth in hours and kilometres of
service after Toronto between 2006 and 2010. At the same time, its increase in revenue passengers
was the lowest in the group and its cost growth was the highest.
Cost efficiency has deteriorated compared to peers
TransLink’s cost efficiency (cost per
revenue hour) changed from being
the second best performer in 2006
to second last in 2010. Total
operating cost per hour rose from
$49.08 to $74.37 over this period,
an increase of 51.5%. This growth
rate was well ahead of the others,
which ranged from 5.9% to 28.8%.
In 2010, TransLink’s cost per hour
exceeded all but Toronto and was
7% lower than the comparator
average. This is largely because
Toronto’s high cost skews the
average. Toronto delivers about half
of its service in-house using operators who are paid the same wage rate as conventional bus drivers
and low floor small buses, which appear to have higher maintenance costs.
Source: CUTA Canadian Transit Fact Books
$40
$60
$80
$100
$120
2006 2007 2008 2009 2010
Co
st p
er
Hr
($)
Toronto
Calgary
Edmonton
Victoria
TransLinkAverage
Source: CUTA Canadian Transit Fact Books
FIGURE 4-24: TRANSLINK CUSTOM TRANSIT VS. COMPARATORS, COST PER HOUR, 2006-2010
FIGURE 4-23: TRANSLINK CUSTOM TRANSIT 2010 PERFORMANCE VS. PEERS
6.6%
-21.4%
-19.8%
-2.4%
5.2%
-25% -20% -15% -10% -5% 0% 5% 10%
Cost per Hour
Cost per Passenger
Passengers per Hr
% Cost Recovery
% Admin to Total Costs
Percent Favourable (Unfavourable) vs. Peer Average

TransLink Efficiency Review
Transit System Performance 40
TransLink’s recent restructuring together with labour and other cost increases explain part of its
high cost. However, it is notable that TransLink makes less use of non-dedicated vehicles (taxis and
vans), which typically are less costly than dedicated vehicles, compared to Toronto, Calgary or
Victoria.
Relative cost effectiveness has also declined
TransLink’s custom program cost
effectiveness (total cost including
taxi scrip per revenue passenger)
also shifted from second best
performer in 2006 to second last
after Toronto in 2010. Cost per
passenger increased by 58.6% from
$20.08 in 2006 to $31.85 in 2010,
which was $5.61 or 21.4% higher
than the comparator average.
TransLink’s five year increase was
more than double that Victoria,
which had the next highest growth
(24.5%), and still higher than the
others, which ranged from 1.4% to
21.1%. TransLink’s modest growth
in passengers carried compared to
cost growth explains the change in
this indicator.
In terms of passengers per hour,
TransLink slipped from second to
last in 2006 into last place in 2010.
Revenue passengers per hour went
from 2.27 in 2006 to 2.16 in 2010, a
decline of 4.8%. Only two systems,
TransLink and Victoria recorded a
decline in this indicator. All the
others posted increases ranging
from 1.1% to 9.9%.
In 2010, TransLink’s passengers per hour were 19.87% lower that the comparator average. Toronto
rated the best in this category due to its compact and dense service area. TransLink also had the
lowest average speed, 16.6 kph, while the peer group ranged from 22.4 to 20.4 kph.
Source: CUTA Canadian Transit Fact Books
1.5
2.0
2.5
3.0
3.5
2006 2007 2008 2009 2010
Pas
sen
gers
pe
r H
r
Toronto
Calgary
EdmontonVictoria
TransLink
Average
Source: CUTA Canadian Transit Fact Books
FIGURE 4-25: TRANSLINK CUSTOM TRANSIT VS. COMPARATORS, COST PER REVENUE PASSENGER, 2006-2010
FIGURE 4-26: TRANSLINK CUSTOM TRANSIT VS. COMPARATORS, PASSENGERS PER HR, 2006-2010
$15
$20
$25
$30
$35
2006 2007 2008 2009 2010
Co
st p
er
Pas
sen
ger
($)
Toronto
Calgary
Edmonton
Victoria
TransLink
Average

TransLink Efficiency Review
Transit System Performance 41
Source: CUTA Canadian Transit Fact Books
TransLink’s low utilization (and speed) do not appear to have improved with the move to a single
operator, although 2010 ridership may have been affected by the labour disruption. While the
introduction of new technologies at MVT should help to improve productivity in the future, there is
no evidence of this yet.
Relative cost recovery is low
TransLink’s cost recovery (revenue
to cost ratio) at 4.42% ranked fourth
within the group and was 2.4
percentage points lower than the
comparator average. Only BC
Transit Victoria, with a fully
integrated fare system, had lower
cost recovery (4.35%). Calgary led
this category with a cost recovery of
9.4%.
Administration cost13 ratio lower than peers
TransLink had the lowest
percentage of administration costs
to total costs in the group in both
2006 and 2010. The increase in its
administration cost ratio over the
five year period was 2.9 percentage
points, reflecting relatively equal
growth in both administration and
total spending. At the same time,
this was the highest growth
recorded in the group. The only
other system to see an increase was
Calgary. In both Toronto and
Edmonton, the proportion of
administration spending declined
-2.8 and -1.1 percentage points respectively.
13
BC Transit Victoria did not report administration costs in its CUTA reporting and therefore is not available for comparison in this category.
Source: CUTA Canadian Transit Fact Books
FIGURE 4-27: TRANSLINK CUSTOM TRANSIT VS. COMPARATORS, % OPERATING COST RECOVERY, 2006-2010
FIGURE 4-28: TRANSLINK CUSTOM TRANSIT VS. COMPARATORS, ADMIN % OF OPERATING COSTS, 2006-2010
3%
4%
5%
6%
7%
8%
9%
10%
2006 2007 2008 2009 2010
% C
ost
Re
cove
ry
Toronto
Calgary
Edmonton
VictoriaTransLink
Average
0%
5%
10%
15%
20%
25%
30%
2006 2007 2008 2009 2010
Ad
min
as
a %
of
Tota
l C
ost
Toronto
Calgary
Edmonton
TransLink
Average

TransLink Efficiency Review
Transit System Performance 42
Summary of Findings
The major restructuring of TransLink’s custom transit program in 2008 has resulted in cost increases
far in excess of the rate of service expansion and inflation. The consolidation of operations to one
contractor does not appear to have produced any economies of scale. Instead, slippage has
occurred in service cost efficiency and effectiveness, as well as productivity. TransLink’s
performance relative to its peers has also deteriorated. The declines are across the board in all
indicators. As a result, a costly service has become even more expensive. Cost increases have more
than offset increased revenues from the fare increase. Section 6 of this report examines what might
be done to improve this situation.
TransLink Efficiency Review
Efficiency Evaluation 91
CUSTOM TRANSIT
While Custom Transit represents a relative small percentage of TransLink’s total operating
expenditures (8%), the significant increase in its cost from 2006 to 2010 coupled with modest gains
in usage and weakened performance warrant its examination.
In 2007, TransLink embarked on a strategy to increase the availability and effectiveness of custom
transit56 that included:
setting up “Access Transit” to provide a single point of contact for accessible services,
including one call number for eligibility, registration, information, booking a trip and
registering a commendation or complaint;
consolidating seven custom transit contractors57 into three larger contracts to provide
consistency of business practices across the region and improved cross boundary travel; and,
improving business and management practices.
This appears to have resulted in a substantial cost increase. In fairness, some of the cost increase
associated with this program, including service expansion and the introduction of new technology,
was anticipated by TransLink. Others, including the extent of labour cost increases, were not. The
consolidation of the three contracts into one has resulted in a single collective agreement, which
resulted in wages migrating to the highest level of the prior contractors and, according to
management, a combination of preferential terms and conditions from the prior agreements, all of
which have contributed to the cost increase.
The restructuring and consolidation of custom transit into a single regional operator in 2009 has not
yet resulted in expected cost efficiencies or improvements in service effectiveness. The public
subsidy per passenger carried in 2010 exceeded $30.00. Benefits from the significant investment in
new technologies intended to improve productivity are also not yet evident. Similarly, customer
perception of improvements to service quality have been difficult to measure due to the lingering
effects of the three month transit strike.
TransLink management report that they are seeking to improve performance, which includes
trimming administration and supervisory costs. They are also looking at changing the future fleet
mix by acquiring a higher proportion of smaller (micro) buses that should better reflect the
passenger volumes carried. Taking advantage of the more centralized operations, the size of the
fleet will also be adjusted to reduce the number of spare vehicles, which, at 31% in 2010, was the
highest in the peer comparison group.
56
Access Transit, TransLink, May 9, 2007 57
This excludes Taxi scrip.

TransLink Efficiency Review
Efficiency Evaluation 92
Management are also confident that improved productivity will come with the investment in the
new technologies, which include mobile data terminals for operators and Trapeze scheduling and
dispatching software to manage operations. Management also advise that integrated voice
response (IVR) is being added to notify customers prior to vehicle pick up times. In future origin-
destination patterns will be analyzed to improve service.
What Can be Done to Improve Efficiency?
SHORT TERM
Increase use of non-dedicated vehicles
TransLink makes the lowest use of non-dedicated vehicles amongst the peer comparison group.
Increasing the use of non-dedicated vehicles, such as taxis, could be done relatively quickly and
would offer cost savings. While it is acknowledged there maybe concerns over service quality, these
can be managed.
For some trips, HandyDART could also consider using accessible minivans, which have lower capital
costs, are less expensive to operate and maintain, and are typically more manoeuvrable, improving
average speed. Both Edmonton and Toronto use such vehicles. TTC reports the costs per
passenger carried in sedans and accessible taxis are less than half the cost of service provided by
Wheel-Trans.58
Reduce last minute cancellations
Last minute cancellations, which are an issue for all custom transit systems, result in unproductive
service and cost that could be reallocated to other clients. TransLink is embarking on an awareness
program of letters to persons who cancel without advance notice to try to reduce cancellations and
reallocate service hours more productively. To increase the success of this campaign, a financial
incentive (i.e., charging the base fare) could be considered.
Review eligibility criteria
Toronto, which is currently seeking ways to reduce its custom transit costs, has proposed to revise
its eligibility criteria eliminating ambulatory dialysis registrants. They anticipate that this would
result in 800 fewer registrants and eliminate 200,000 trips per year at a cost saving of $5 million.59
Toronto also propose to actively promote integration of their clients into the conventional transit
system with a target of diverting 20,000 trips in 2012. Both initiatives are intended to reallocate
demand to the lower cost conventional transit service rather than suppress demand.
TransLink could review its eligibility criteria to determine the practicality of diverting some clients
and trips to conventional transit, including setting targets for trip diversion. Diverting greater
58
TTC Service Efficiency Study – Final Report, Toronto Transit Commission, November 2011 59
City of Toronto, City Budget 2012: Toronto Transit Commission, Operating Budget Analyst Notes.

TransLink Efficiency Review
Efficiency Evaluation 93
numbers of users to the conventional system may be key to the program’s long term financial
sustainability and its ability to focus service on those most in need. Here, the call centre needs to
play a greater role in encouraging the use of alternatives for customers.
LONGER TERM
Review service delivery strategy
In the longer term, consideration should be given to better promoting competition and injecting
healthy economic tension into the contractual process. It is suggested that a full post-mortem be
undertaken of the restructuring and consolidation process, including whether expected cost
efficiencies and improvements in effectiveness have been achieved, before the next request for
proposals.
Based on the peer review, Calgary with its model of acting as a brokerage for custom transit services
and having several different service providers under separate contracts, appears to be the more cost
efficient and effective system. It may be appropriate for TransLink to consider this service model in
the future.
For example, when TransLink next seeks proposals, they could allow the contract to be separated
into packages as originally intended and/or by different lines of business. It makes sense that the
call centre be the decision point for assigning to trips to the most cost effective and most
appropriate contractor for the service. At present, TransLink’s contractor is responsible for the call
centre and makes the decision of whether to use an in-house vehicle or use an outside taxi
company.
FLEET
Over the past five years, there has been a significant renewal of the fleet, with over 800 new
conventional buses and 160 community shuttle vehicles received. Average age has declined and it is
now among the newest fleets in Canada. At the same time, there has been an increase in the
number of spare vehicles that are available to back up the peak service requirement. TransLink’s
policy for spares now ranges from a low of 18% of peak vehicles for diesels to a high of 25% for CNG,
small buses and trolleys. Actual spare vehicles exceed these policy levels. While the policy ratios
are on the high side, they are not out of line with industry practice and peer agencies.
Nevertheless, TransLink should seek to have the lowest possible spare vehicle ratio by carefully
managing their fleet. Excessive spare vehicles add costs to the system. Not only are fleet
acquisition capital costs higher but additional costs result for maintenance, cleaning and insurance.
Space in increasingly cramped depots is also needed to accommodate added spare vehicles and
comes at a significant cost, particularly if expansions or new facilities are required as a result.
The current spare vehicle ratio for diesel buses is around 30%. With no other use, they are assigned
as spares, until either buses are retired or funding allows service expansion to proceed. Until then,