curtailment and market price risk - aws-dewi.ul.com · albany, new york | barcelona, spain |...
TRANSCRIPT

Albany, New York | Barcelona, Spain | Bangalore, India | Curitiba, Brazil | awstruepower.com | +1 518-213-0044 ©2013 AWS Truepower, LLC
Feb 5, 2014
Curtailment and Market Price Risk Understanding Key Sensitivities
Whitney Wilson Manager of Performance Engineering Frank Kreikebaum, Ph.D. Consultant

Albany, New York | Barcelona, Spain | Bangalore, India | Curitiba, Brazil | awstruepower.com | +1 518-213-0044 ©2013 AWS Truepower, LLC
Albany New York, USA
Barcelona Spain
Bangalore India
• Consulting for private developers, utilities, investors and lenders, government and non-government agencies, plant owner/operators, and manufacturers.
• Experts in meteorology, spatial analysis, environment, and engineering
• Seasoned project managers and field technicians • Services include: Resource Assessment, Energy
Assessment, Independent Engineering, Due Diligence, Performance Assessment, Forecasting, Grid Integration, Research, Policy, and Planning Studies.
• Established in 1983; 30 years of renewable energy industry experience
• Independent assessments on over +100,000 MW • Project roles in over 80 countries • Over 100 professional staff • Offices in New York, Barcelona, Bangalore, and
Curitiba. *Partnerships in Buenos Aires, Warsaw and Istanbul.
Company Snapshot
Curitiba Brazil
Warsaw Poland (*)
Istanbul Turkey (*)
Buenos Aires Argentina (*)

Albany, New York | Barcelona, Spain | Bangalore, India | Curitiba, Brazil | awstruepower.com | +1 518-213-0044 ©2013 AWS Truepower, LLC
Agenda
• What is Curtailment • Price Mechanisms and Risk – Revenue Potential • Sensitivities That Can Affect Curtailment and Revenue Potential • Case Study – ERCOT

Albany, New York | Barcelona, Spain | Bangalore, India | Curitiba, Brazil | awstruepower.com | +1 518-213-0044 ©2013 AWS Truepower, LLC
Curtailment is the reduction of power output from a generation facility. Curtailment is required to maintain safe and reliable operation of the plant and the electric grid.
Project Curtailment
Grid Curtailment

Albany, New York | Barcelona, Spain | Bangalore, India | Curitiba, Brazil | awstruepower.com | +1 518-213-0044 ©2013 AWS Truepower, LLC
Overview of Project Curtailments
Directional Curtailment (Wind Sector Management)
Wildlife Curtailment (Bats, Eagles)
Environmental Curtailment (Icing, Noise)
PPA Curtailment (Injection Limit and Point of
Interconnection)

Albany, New York | Barcelona, Spain | Bangalore, India | Curitiba, Brazil | awstruepower.com | +1 518-213-0044 ©2013 AWS Truepower, LLC
Overview of Grid Curtailments
Negative Price (Bid Strategy, Contractual)
Base-load or Over-generation
(Coal and Nuclear Cycling, Hydro)
Deliverability (Constraints, Interface
Limits)
Reliability Curtailment (Unknown Grid Issues)
SPS Curtailment (Known Grid Issues)

Albany, New York | Barcelona, Spain | Bangalore, India | Curitiba, Brazil | awstruepower.com | +1 518-213-0044 ©2013 AWS Truepower, LLC
Market Mechanisms
Purchase Mechanisms by Risk
Highest Merchant
Mid High Hedged Merchant
Mid Low PPA With Variable Rate (TOD/Seasonal)
Lowest PPA With Fixed Rate
Outside of price stability, many PPAs and hedges will contain a clause that reimburses a facility for curtailed energy. Merchant projects are subject to both the revenue potential and the lost revenue potential from curtailed energy. This presentation will focus on sensitivities that can affect the bottom line of Merchant projects.

Albany, New York | Barcelona, Spain | Bangalore, India | Curitiba, Brazil | awstruepower.com | +1 518-213-0044 ©2013 AWS Truepower, LLC
Locational Marginal Price
Locational Marginal Price (or Nodal Price) is set by the highest price generator required to serve the load. LMP = Marginal Cost of Energy + Marginal Cost of Congestion + Marginal Cost of Losses As marginal cost of congestion is a component of market price, congestion can drive the Revenue Potential of a Merchant Project. If a project is located on the demand side of congestion, the LMP price will increase, while the high supply side of congestion will see a decrease in potential.

Albany, New York | Barcelona, Spain | Bangalore, India | Curitiba, Brazil | awstruepower.com | +1 518-213-0044 ©2013 AWS Truepower, LLC
Locational Marginal Price – Taxi Analogy Low Congestion = Low LMP
High Congestion = High LMP

Albany, New York | Barcelona, Spain | Bangalore, India | Curitiba, Brazil | awstruepower.com | +1 518-213-0044 ©2013 AWS Truepower, LLC
Sensitivities Driving Price and Curtailment Level
Price and Curtailment Level
System Build-
out
Fuel Price
Bid Strategy
Data and Tool
Quality Accurate curtailment and revenue potential estimates depend on a full understanding of the electric grid and transmission market. Sensitivity around each of the key inputs can adjust the overall estimate.

Albany, New York | Barcelona, Spain | Bangalore, India | Curitiba, Brazil | awstruepower.com | +1 518-213-0044 ©2013 AWS Truepower, LLC
Case Study Background of Base Case • AWS Truepower Hourly Virtual Met Mast (VMM) Data Per Project • VMM + Energy Production with AWST Regional Losses and Site Specific Turbines • 2015 ERCOT Load
Data
• Security Constrained Unit Commitment • PLEXOS Software Package Tools
• Natural Gas Prices Aggregated from Multiple Sources • Coal and Uranium from Plexos and EIA Fuel Price
• ERCOT Transmission Plan Projects (including CREZ) and appropriate Stability Limits • 2015 Generation Queue and Scheduled Retirements • ERCOT System Files (Acquired through FERC CEII)
System Build-out
• Allow Negative Bidding for PTC and REC value • REC Assumed $3/MWh and PTC at $23/MWh • PTC was Removed for Plants Beyond 10 Years of Operation • 2015 Queue Projects Assumed to Meet 2013 PTC “Start of Construction”
Bid Strategy

Albany, New York | Barcelona, Spain | Bangalore, India | Curitiba, Brazil | awstruepower.com | +1 518-213-0044 ©2013 AWS Truepower, LLC
Case Study Selection of Facilities
• Facility 1 is non-constrained and has limited neighboring facilities. • Facility 2 is affected by a 2015 Queue projects near the current POI and
constraints on the W-N transfer. • Facility 3 is a Queue Project expected to come online in 2015.
Facility 1 is on the low end of curtailment in the region, but is generally representative of the curtailment and variation level seen across ERCOT. As such, Facility 1 was selected to represent the typical project Facility 2 is a in a high penetration region with constraint issues. As such, Facility 2 has been selected to be generally representative of a worst case scenario. Facility 3 is a queue project, which represents new projects coming online.

Albany, New York | Barcelona, Spain | Bangalore, India | Curitiba, Brazil | awstruepower.com | +1 518-213-0044 ©2013 AWS Truepower, LLC
Case Study Results of Base Case
Facility 1 Facility 2 Facility 3
% Curtailed 0.29% 7.36% 0.40%
Revenue ($/MW) 66,362 48,427 68,651
Average ERCOT Curtailment in Base Case = 1.05% Standard Deviation = 5.03 % Average Revenue in Base Case = $69,410/MW
For the following sensitivity analysis, the base case was maintained as a control and only one sensitivity area was changed in each system run.

Albany, New York | Barcelona, Spain | Bangalore, India | Curitiba, Brazil | awstruepower.com | +1 518-213-0044 ©2013 AWS Truepower, LLC
Case Study Data Sensitivity
• A single representative normalized 8760 was applied to all facilities.
• The normalized 8760 was used with the plant rated capacity.
Same Time Varying Data
• All hourly steps were set to a net capacity factor (CF) of 45%. • This is the “old” way of completing system studies.
Fixed Capacity Factor
Neither sensitivity uses the specific turbine power curve for the site.
Albany, New York | Barcelona, Spain | Bangalore, India | Curitiba, Brazil | awstruepower.com | +1 518-213-0044 ©2013 AWS Truepower, LLC
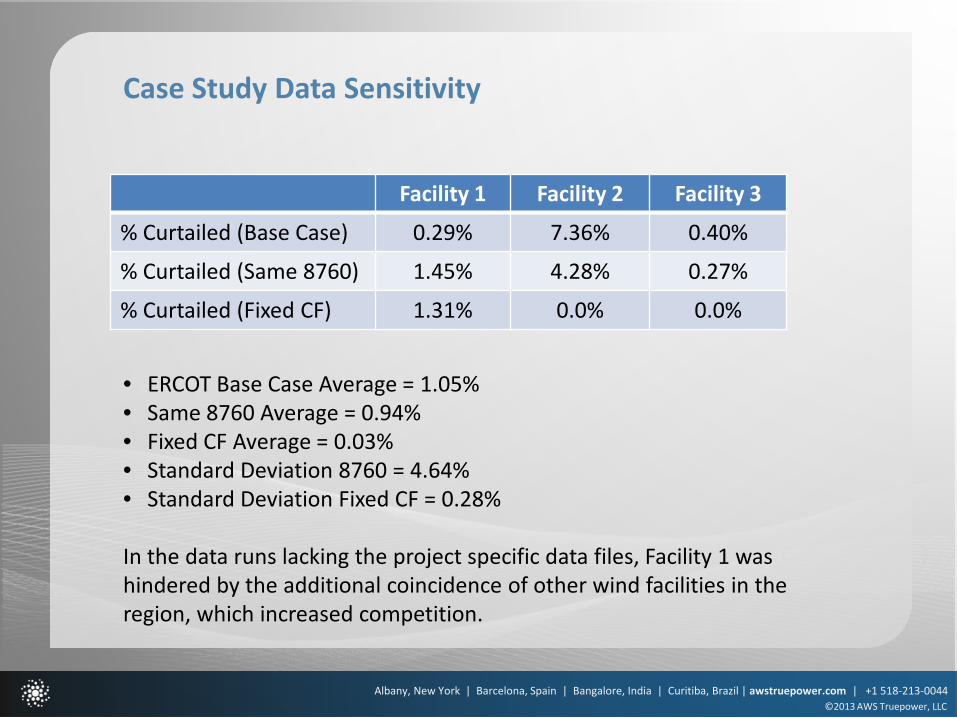
Case Study Data Sensitivity
Facility 1 Facility 2 Facility 3
% Curtailed (Base Case) 0.29% 7.36% 0.40%
% Curtailed (Same 8760) 1.45% 4.28% 0.27%
% Curtailed (Fixed CF) 1.31% 0.0% 0.0%
• ERCOT Base Case Average = 1.05% • Same 8760 Average = 0.94% • Fixed CF Average = 0.03% • Standard Deviation 8760 = 4.64% • Standard Deviation Fixed CF = 0.28%
In the data runs lacking the project specific data files, Facility 1 was hindered by the additional coincidence of other wind facilities in the region, which increased competition.

Albany, New York | Barcelona, Spain | Bangalore, India | Curitiba, Brazil | awstruepower.com | +1 518-213-0044 ©2013 AWS Truepower, LLC
Case Study Data Sensitivity
$/MW Facility 1 Facility 2 Facility 3
Revenue (Base Case) 66,362 48,427 68,651
Revenue (Same 8760) 50,108 62,255 53,587
Revenue (Fixed CF) 68,401 87,901 72,888
• Base Case Average = $69,410/MW • Same 8760 Average =$69,812/MW • Fixed CF Average = $92,355/MW
The Fixed CF data has the wind facility producing at 45% CF at all hours of the day. This mean that facilities are producing less energy during low LMP prices and more energy during peak LMP prices.

Albany, New York | Barcelona, Spain | Bangalore, India | Curitiba, Brazil | awstruepower.com | +1 518-213-0044 ©2013 AWS Truepower, LLC
Case Study Fuel Price Sensitivity
• Natural gas futures are one of the most difficult input parameters to estimated throughout project life.
• Natural gas prices were increased to twice the base case level to show a high natural gas price scenario.
Fuel Price

Albany, New York | Barcelona, Spain | Bangalore, India | Curitiba, Brazil | awstruepower.com | +1 518-213-0044 ©2013 AWS Truepower, LLC
Case Study Fuel Price Sensitivity
Facility 1 Facility 2 Facility 3
% Curtailed (Base Case) 0.29% 7.36% 0.40%
% Curtailed (High Fuel) 0.0% 1.27% 0.40%
• ERCOT Base Case Average = 1.05% • High Fuel Average = 1.02% • Standard Deviation High Fuel = 5.20%
Facility 3 does not change, because the curtailment is not driven by the cost of neighboring generators. The curtailment at Facility 3 represents base-load curtailment.

Albany, New York | Barcelona, Spain | Bangalore, India | Curitiba, Brazil | awstruepower.com | +1 518-213-0044 ©2013 AWS Truepower, LLC
Case Study Fuel Price Sensitivity
$/MW Facility 1 Facility 2 Facility 3
Revenue (Base Case) 66,362 48,427 68,651
Revenue (High Fuel) 86,650 67,478 90,627
• Base Case Average = $69,410/MW • High Fuel Average = $95,390/MW
LMP Prices are set by the highest price generator required to meet the load. Thus, major increases in natural gas not only reduce curtailment, they also affect the nodal prices and merchant revenue potential of the facility.

Albany, New York | Barcelona, Spain | Bangalore, India | Curitiba, Brazil | awstruepower.com | +1 518-213-0044 ©2013 AWS Truepower, LLC
Case Study System Build-out Sensitivity
• Generation build-out sensitivity was studied by assuming that queue projects expected to be online in 2015 were not built or were built beyond 2015.
System Build-out

Albany, New York | Barcelona, Spain | Bangalore, India | Curitiba, Brazil | awstruepower.com | +1 518-213-0044 ©2013 AWS Truepower, LLC
Case Study Build-out Sensitivity
Facility 1 Facility 2 Facility 3
% Curtailed (Base Case) 0.29% 7.36% 0.40%
% Curtailed (Build-out) 0.08% 0.64% Not Online
• ERCOT Base Case Average = 1.05% • Build-Out Average = 0.28% • Standard Deviation Build-Out = 0.93%
Facility 2 constraints have been minimized due to the elimination of the 2015 queue facility from the local system.
Albany, New York | Barcelona, Spain | Bangalore, India | Curitiba, Brazil | awstruepower.com | +1 518-213-0044 ©2013 AWS Truepower, LLC
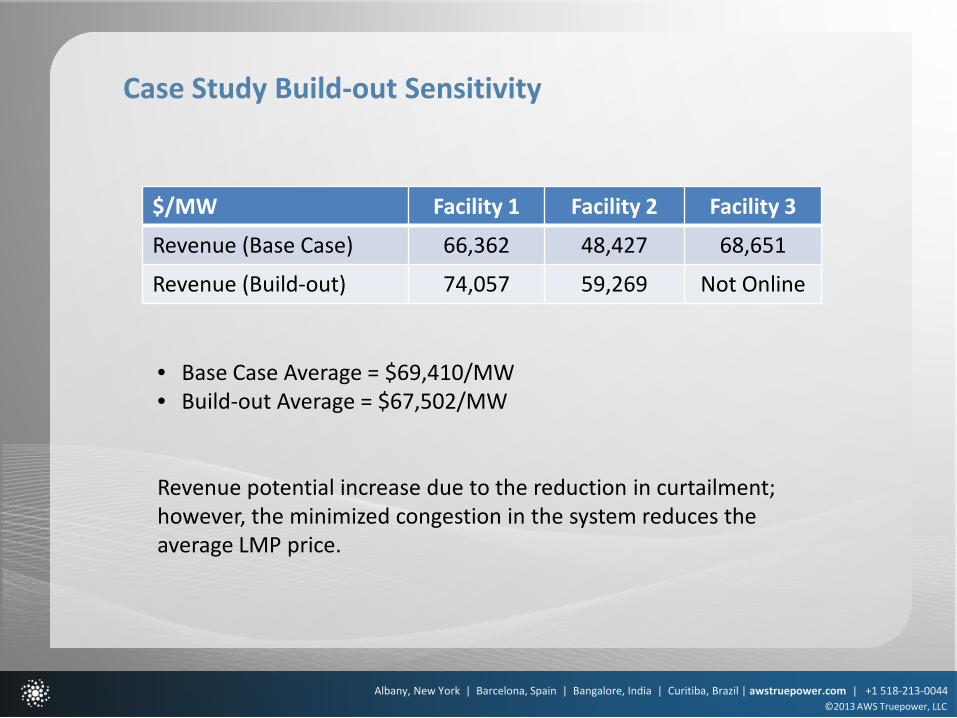
Case Study Build-out Sensitivity
$/MW Facility 1 Facility 2 Facility 3
Revenue (Base Case) 66,362 48,427 68,651
Revenue (Build-out) 74,057 59,269 Not Online
• Base Case Average = $69,410/MW • Build-out Average = $67,502/MW
Revenue potential increase due to the reduction in curtailment; however, the minimized congestion in the system reduces the average LMP price.

Albany, New York | Barcelona, Spain | Bangalore, India | Curitiba, Brazil | awstruepower.com | +1 518-213-0044 ©2013 AWS Truepower, LLC
Case Study Background of Base Case
• Projects coming online in 2015 were not considered to have completed the 2013 PTC; thus, no PTC was assigned to new projects.
• 2015 projects bid at $-3/MWh (REC only)
Bid Strategy

Albany, New York | Barcelona, Spain | Bangalore, India | Curitiba, Brazil | awstruepower.com | +1 518-213-0044 ©2013 AWS Truepower, LLC
Case Study Bid Strategy Sensitivity
Facility 1 Facility 2 Facility 3
% Curtailed (Base Case) 0.29% 7.36% 0.40%
% Curtailed (Bid Strategy) 0.23% 1.07% 5.89%
• ERCOT Base Case Average = 1.05% • Bid Strategy Average = 1.70% • Standard Deviation Bid Strategy = 10.05%
By eliminating the PTC on the new facilities coming online near Facility 2, a reduction in curtailment is seen. Facility 3 shows that by having a higher bid in value, the project will more often be the most expensive choice and will be curtailed.

Albany, New York | Barcelona, Spain | Bangalore, India | Curitiba, Brazil | awstruepower.com | +1 518-213-0044 ©2013 AWS Truepower, LLC
Case Study Bid Strategy Sensitivity
$/MW Facility 1 Facility 2 Facility 3
Revenue (Base Case) 66,362 48,427 68,651
Revenue (Bid Strategy) 63,060 51,039 67,183
• Base Case Average = $69,410/MW • Bid Strategy Average = $69,018/MW

Albany, New York | Barcelona, Spain | Bangalore, India | Curitiba, Brazil | awstruepower.com | +1 518-213-0044 ©2013 AWS Truepower, LLC
Conclusions
• Curtailment and Revenue Potential can vary based on input assumptions
• Data quality is important to have the highest accuracy on estimates
• Addressing appropriate input assumptions and financier’s key sensitivities is important prior to initiating a study.
• Understanding the sensitivities and study inputs is important when determining appetite for curtailment and final financial model numbers.