“current trends in smart city initiatives: some stylised facts.” cities
TRANSCRIPT

Politecnico di Torino
Porto Institutional Repository
[Article] Current trends in Smart City initiatives: some stylised facts
Original Citation:P. Neirotti; A. De Marco; A.C. Cagliano; G. Mangano; F. Scorrano (2014). Current trends in SmartCity initiatives: some stylised facts. In: CITIES, vol. 38, pp. 25-36. - ISSN 0264-2751
Availability:This version is available at : http://porto.polito.it/2522888/ since: December 2013
Publisher:Elsevier
Published version:DOI:10.1016/j.cities.2013.12.010
Terms of use:This article is made available under terms and conditions applicable to Open Access Policy Article("Public - All rights reserved") , as described at http://porto.polito.it/terms_and_conditions.html
Porto, the institutional repository of the Politecnico di Torino, is provided by the University Libraryand the IT-Services. The aim is to enable open access to all the world. Please share with us howthis access benefits you. Your story matters.
(Article begins on next page)
1
Current trends in Smart City initiatives: some stylised facts
Paolo Neirottia
Alberto De Marcob
Anna Corinna Caglianoc
Giulio Manganod
Francesco Scorranoe
a Department of Management and Production Engineering, Politecnico di Torino, Corso
Duca degli Abruzzi 24, 10129, Torino (TO), Italy, [email protected]
b Department of Management and Production Engineering, Politecnico di Torino, Corso
Duca degli Abruzzi 24, 10129, Torino (TO), Italy, [email protected]
c Department of Management and Production Engineering, Politecnico di Torino, Corso
Duca degli Abruzzi 24, 10129, Torino (TO), Italy, [email protected]
d Corresponding Author, Department of Management and Production Engineering,
Politecnico di Torino, Corso Duca degli Abruzzi 24, 10129, Torino (TO), Italy,
[email protected], Telephone: +39 0110907205
e Department of Management and Production Engineering, Politecnico di Torino, Corso
Duca degli Abruzzi 24, 10129, Torino (TO), Italy, [email protected]
Cites, Vol 38, pp. 25-36.
2
Abstract
The concept of Smart City (SC) as a mean of enhancing the quality of life of citizens
has gained increasing importance in policy makers‟ agendas. However, a shared
definition of SC is not yet available, and it is hard to identify common global trends.
This paper is an attempt to provide a comprehensive understanding of the notion of SC
through a taxonomy of pertinent application domains, namely: natural resources and
energy, transport and mobility, buildings, living government, and economy and people.
It also explores the diffusion of smart initiatives via an empirical study that has the aim
of investigating the ratio of domains covered by a city's best practices to the total of the
potential domains of smart initiatives. The paper also has the aim of understanding the
role that various economic, urban, demographic, and geographical variables could have
in influencing planning approaches to create a smarter city. The results have revealed
that the evolution patterns of an SC depend to a great extent on its local context factors.
Economic development and structural urban variables are in particular likely to
influence a city's digital path, the geographical location to affect the SC strategy, and
the density of the population, together with the associated congestion problems, might
be important components in determining the routes for SC implementation. This work
provides policy makers and city managers with useful guidelines to define and drive
their SC strategy and planning actions for the most appropriate implementation
domains.
3
Introduction
Current cities are complex systems that are characterised by massive numbers of
interconnected citizens, businesses, different modes of transport, communication
networks, services and utilities. Population growth and increased urbanization raise a
variety of technical, social, economic and organisational problems that tend to
jeopardize the economic and environmental sustainability of cities. The rapid growth
faced by several cities has generated traffic congestion, pollution and increasing social
inequality (Kim and Han, 2012). In this context, a debate has emerged on the way new
technology-based solutions, as well as new approaches to urban planning and living,
can assure future viability and prosperity in metropolitan areas (Alawadhi et al., 2012;
Dirks et al., 2009; Nam and Pardo, 2011; Nijaki and Worrel, 2012). In this discussion,
the concept of Smart Cities (SCs) (Hollands, 2008) has been the subject of increasing
attention and it now appears as a new paradigm of intelligent urban development and
sustainable socio-economic growth, whose origin can be traced back to the Smart
Growth Movement of the late „90s (Harrison and Donnelly, 2011). However, despite the
rise in SCs in the urban planners‟ debate on the future of cities, the diffusion of SC
initiatives in countries with different needs and contextual conditions (e.g. in either
developed or developing nations) makes it difficult to identify shared definitions and
common current trends at a global scale. There is still in fact no general consensus on
the meaning of the term SC or on what its describing attributes are. However, there is
wide agreement about the fact that SCs are characterized by a pervasive use of
Information and Communication Technologies (ICT), which, in various urban domains,
help cities make better use of their resources. However, ICT-based solutions can be
considered as just one of the various input resources for projects and approaches to
urban planning and living that have the aim of improving the economic, social and
4
environmental sustainability of a city. This implies that those cities that are more
equipped with ICT systems are not necessarily better cities, and that the number of
“smart” initiatives launched by a municipality is not an indicator of city performance,
but could instead result in an intermediate output that reflects the efforts made to
improve the quality of life of the citizens.
As a consequence of the lack of a common view, investigating the diffusion patterns of
SC initiatives around the world may help to generate a better understanding of the
characteristics and future trends of SCs and contribute to the current debate. The
importance of this analysis lies in the awareness that various obstacles tend to slow
down the diffusion process of SC initiatives. According to recent evidence (The
Economist, 2013), most of the companies on the market for ICT solutions for cities
have not met their revenue targets from 2010 to 2013.
Because of the obstacles that slow down ICT diffusion, and the central role of political,
economic and cultural contexts in shaping the way cities try to become smarter, it can
be expected that there is not just one unique paradigm of SC evolution throughout the
world. As a result, the aim of this research activity was to investigate whether, and how,
the emerging models of SCs differ from the concept of SC developed by city planners,
technology visionaries and academicians.
This work is an attempt to fill the research gap in the diffusion of SCs through an
empirical study on the role that SC initiatives play on the functional domains of urban
living. The role of economic, urban, demographic, and geographical factors on the
planning approach to the building of a smarter city is investigated by analysing the
coverage ratio that SC initiatives have in relation to the extent of their application
domains. The paper may thus be considered as a support for local policy-makers and
5
city managers as it articulates the value proposition of SCs in a basket of appropriate
initiatives and applications.
The remainder of this paper is structured as follows. The key elements that characterise
the notion of SC in the literature are examined and integrated in an extended taxonomy
of SC application domains. On the basis of this taxonomy, a sample of 70 international
cities has been analysed through the lens of a Coverage Index (CI), which takes into
account the number of application domains wherein cities have launched their projects.
The relationship between the CI and the economic, social, geographic, demographic and
environmental characteristics of a city allows one to find common points and
differences in the way the SC paradigm is applied throughout the world. The
implications of these analyses are discussed in the final part of the paper with the aim of
providing policy-makers with recommendations on the levers that are likely to foster SC
initiatives. Finally, possible future research directions are discussed.
Literature review on the Smart City notion
This section is aimed at clarifying the meaning of SC by discussing its characterizing
features and their application domains. To this end, a categorization of the possible
domains of an SC has been proposed to represent the patterns of SC initiatives in the
empirical work presented in this paper.
The characterizing attributes of SC
One part of the SC literature stresses the need for citywide planning and control, and the
central function of ICT systems as the city digital nervous systems that obtains data
from heterogeneous sources (e.g. sewers, parking spaces, security cameras, school
thermostats, traffic lights, etc.). Many SCs are thus sophisticated systems that “sense
and act” (REF, (Hall, 2000; Marsa-Maestre et al., 2008), and in which a great volume of
6
real-time information is processed and integrated across multiple processes, systems,
organisations and value chains to optimise operations and inform authorities on
incipient problems. The role that ICT plays in cities is the same one that these
technologies have in organizations and that has been largely described in Information
Systems literature and organization studies: improving productivity (i.e. output divided
input) through automatic routine processes and by powering managers‟ decision-
making, planning and control activities. In cities, ICT is likely to contribute
substantially to solve the emerging problems of urban living. For example, a mixture of
the right data and of the right policies and interventions can make morning traffic run
more smoothly, or spread out the evening peak energy use.
According to this view of SCs, the deployment of ICT should not be identified with the
concept of SC, since smart initiatives do not only entail technology changes, but also
investments in human capital and changes in urban living practices and conditions. In
other words, ICT is a General Purpose Technology (Bresnhan and Traitenberg, 1995),
which is complementary to human and organizational capital and whose usage is shaped
by political choices and by the urban ecosystem of the citizens, technology vendors and
local authorities, depending on the city‟s needs and habits. As such, the same ICT
system can exhibit different patterns of usage across cities to reflect different needs and
conditions in their local contexts. This directs interest towards studying the various
diffusion patterns of SC initiatives around the world.
Since ICT is unable to transform cities without human capital, another body of studies
has focused on the role of human capital in improving city liveability. As such, SC
initiatives can also include human capital investments that are aimed at fostering a city‟s
capacity for learning and innovation, by supporting and motivating the local population
7
in education and by improving their own life and attracting and retaining other valuable
inputs from outside, i.e.: talented and highly educated figures, investments from
innovative enterprises, investors and entrepreneurs with the financial and human capital
to start-up new enterprises (Caragliu et al., 2009; Correia and Wünstel, 2011; Giffinger
et al., 2007; Hollands, 2008; Rios, 2008; Toppeta, 2010).
Finally, in previous studies, the adjective “smart” also referred to the government of a
city and its capacity to generate innovation in the way services and communication are
delivered to the local population (Gonzales and Rossi, 2011).
Application domains of the SC
Basically, the various positions in the debate agree on the fact that an SC should be able
to optimise the use and exploitation of both tangible (e.g. transport infrastructures,
energy distribution networks, natural resources) and intangible assets (e.g. human
capital, intellectual capital of companies, and organisational capital in public
administration bodies). The various approaches to the definition of SC are mainly
related to two different factors, namely the way cities can steer themselves to achieve
this goal of optimisation, and the domains that are more critical for a cleverer usage of
urban resources. Some planners, who have echoed Le Corbusier‟s dictum that a “house
is a machine for living in”, see cities as factories for life, on the basis of a broad use of
ICT that enables central planning and an integrated view of the processes that
characterize urban operations. Consequently, the emphasis of this approach is on
production and the distribution of energy, transportation and logistics, waste
management and pollution control, and it looks at the way ICT can harness information
processing in these fields.
8
The other positions instead view the ways of building SCs as being based more on
bottom-up approaches in which cities provide access to data and allow citizens to make
their own decisions. Consequently, they stress the importance of investments in “soft”
urban living domains wherein ICT plays a more limited role in enabling sustainability
and handling “transactions”, which is thus related to welfare and social inclusion
policies (e.g. the assistance of disabled citizens), culture and education.
This variety of visions and facets about the SC concept is an expression of the multitude
of urban living domains to which technology and policy interventions can be applied.
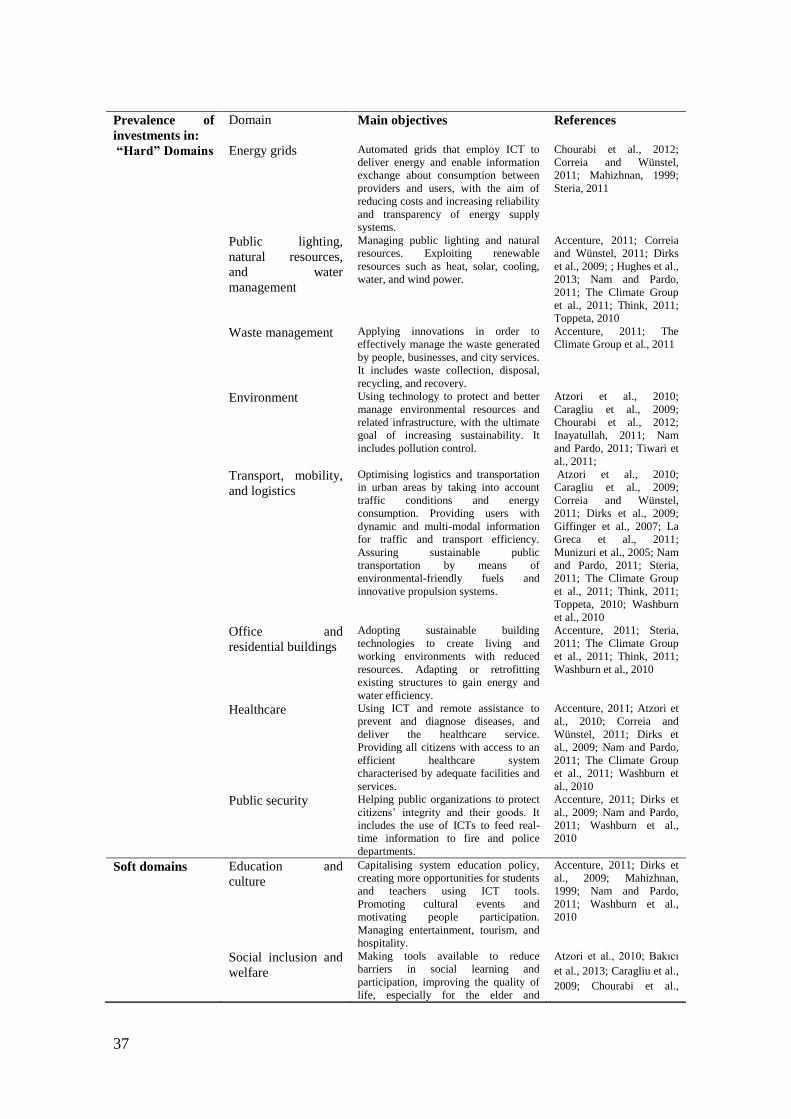
Table 1 provides an overview of the domains that are illustrated in various streams of
literature, relevant to the topic of urban development. As can be seen in this table, the
domains in which urban development policies are applicable can be classified as “hard”
or “soft”, in relation to the importance that the ICT systems have as key enabling
technologies. Specifically, hard domains refer to office and residential buildings, energy
grids, natural resources, energy and water management, waste management,
environment, transport, mobility and logistics. In these settings, an improvement in
sustainability relies on the deployment of ICT systems, along with the introduction of
appropriate policy interventions and urban planning. In other words, hard domains are
the city settings in which the vision of a city that senses and acts can be the most
applicable, thanks to the use of sensors, wireless technologies and software solutions to
handle “big data” (McKinsey Global Institute, 2011; McAfee and Brynjolfsson, 2012).
--- Table 1 around here ---
By contrast, soft domains include areas such as education, culture, policies that foster
entrepreneurship, innovation and social inclusion, as well as communication between
9
local public administrations and the citizens (e-government). In these areas, ICT has a
more limited role and is not necessarily aimed at processing and integrating real-time
information. This is the case of education, where processes are not based to any great
extent on handling transactions. In other cases, such as the one of innovation and social
inclusion policies, SC initiatives are not characterised by new technology deployment
but rather by public interventions aimed at creating the right societal and institutional
conditions (e.g. incentives, ad-hoc organizational bodies, etc.). In the case of culture,
public involvement could be aimed at improving the exploitation and attractiveness of a
city‟s cultural heritage. In the case of policies that foster human capital and innovation
capabilities, the role of the local policies in creating the right institutional condition
could mean, for example, the establishment and support of local incubators for hi-tech
start-ups and their connection to global-scaled innovation systems. Fields such as
healthcare and public safety can be positioned somewhere in - between hard and soft
domains, as SC interventions in these settings can be characterized by the deployment
of sensors and wireless technologies (e.g. the use of such technologies to automate the
remote assistance of patients outside hospitals) or by the deployment of practices and
campaigns aimed at creating social values. For instance, the city of Yokoama, Japan,
has created the “Creative City Yokoama Office”, wherein artists and other creative
individuals can meet up, and exhibitions, performances, workshops and similar events
can take place (Sasaki, 2010). Moreover, Chicago, through the “Empowerment Zone
Program”, has improved the quality of the healthcare services delivered to the poorest
areas of the city (Oakley and Tsao, 2007).
10
Conceptual framework
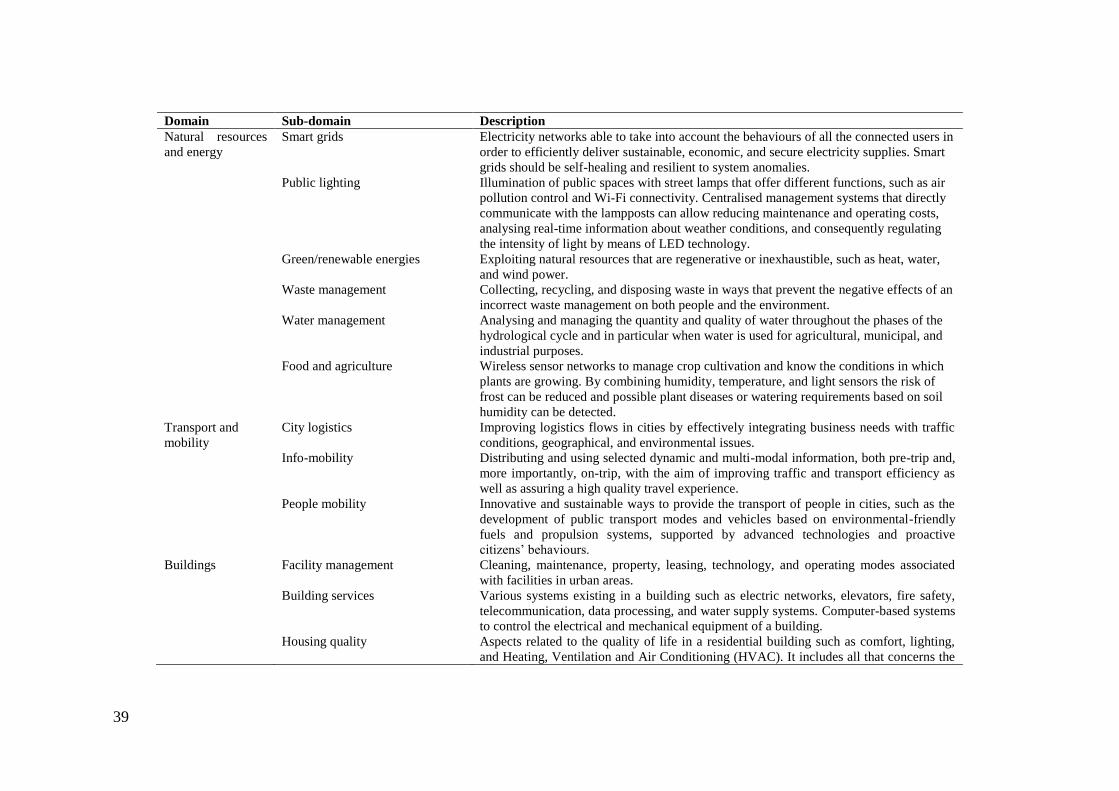
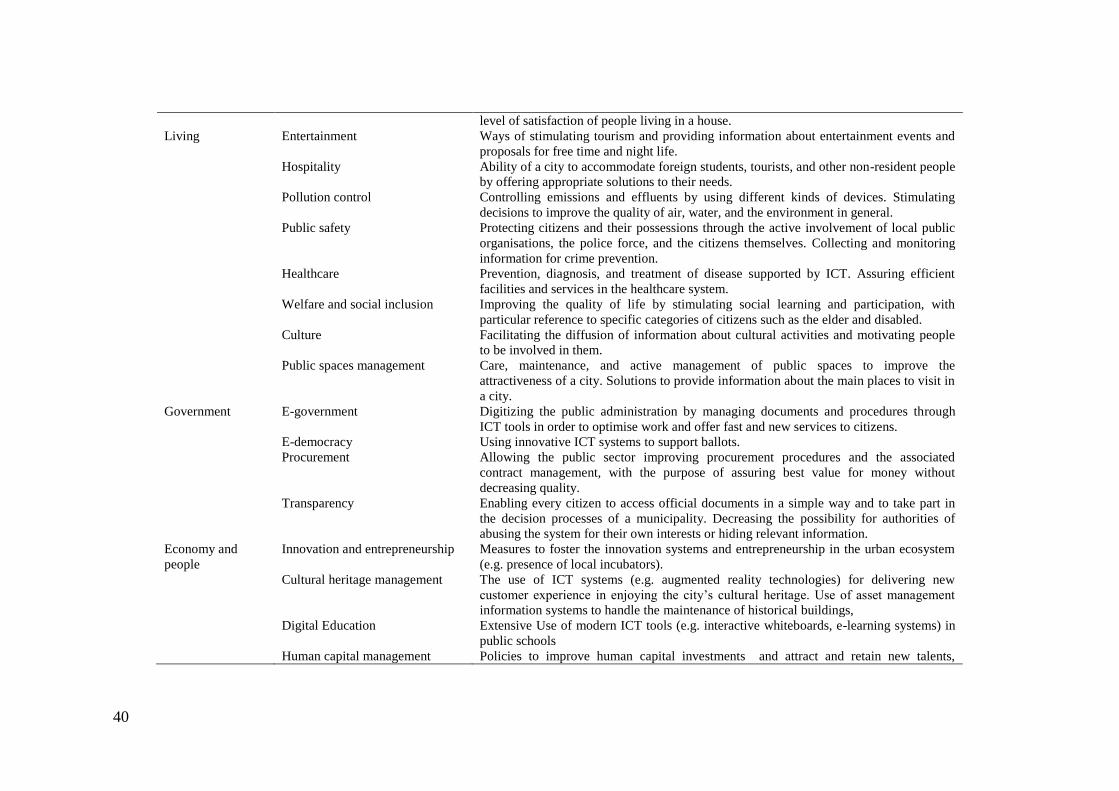
The application domains illustrated in Table 1 have been grouped into six categories,
which in turn include some sub fields. Table 2 illustrates this aggregation. The search
for a high-level taxonomy instead of a fine-grained classification can be traced back to
our intent to develop insights into the international trends in SC initiatives at a macro
level. To this end, the CI takes into account the fields of a given domain that have been
covered by initiatives launched by municipalities. In other words, a CI index equal to 1
in a given domain means that the city has recently launched at least one smartness
intervention in each area that makes up the domain (i.e. the subfields in table 2). An
aggregated CI can be computed from the linear combination of the CIs in each of the six
domains above.
--- Table 2 around here ---
The number of urban living domains covered by the spectrum of a city‟s projects
reflects the effort made to improve sustainability at various economic, social and
environmental levels, and can be interpreted as the consequence of the needs a city has
towards that specific direction and the amount of resources that it uses for this purpose.
As such, a comprehensive empirical exploration of the antecedents and impact of SC
would imply an analysis of the impact of the coverage ratio of SC initiatives on the
actual indicators of sustainability and quality of life in the city. Therefore, a CI should
be interpreted as an intermediate factor between input and performance variables at a
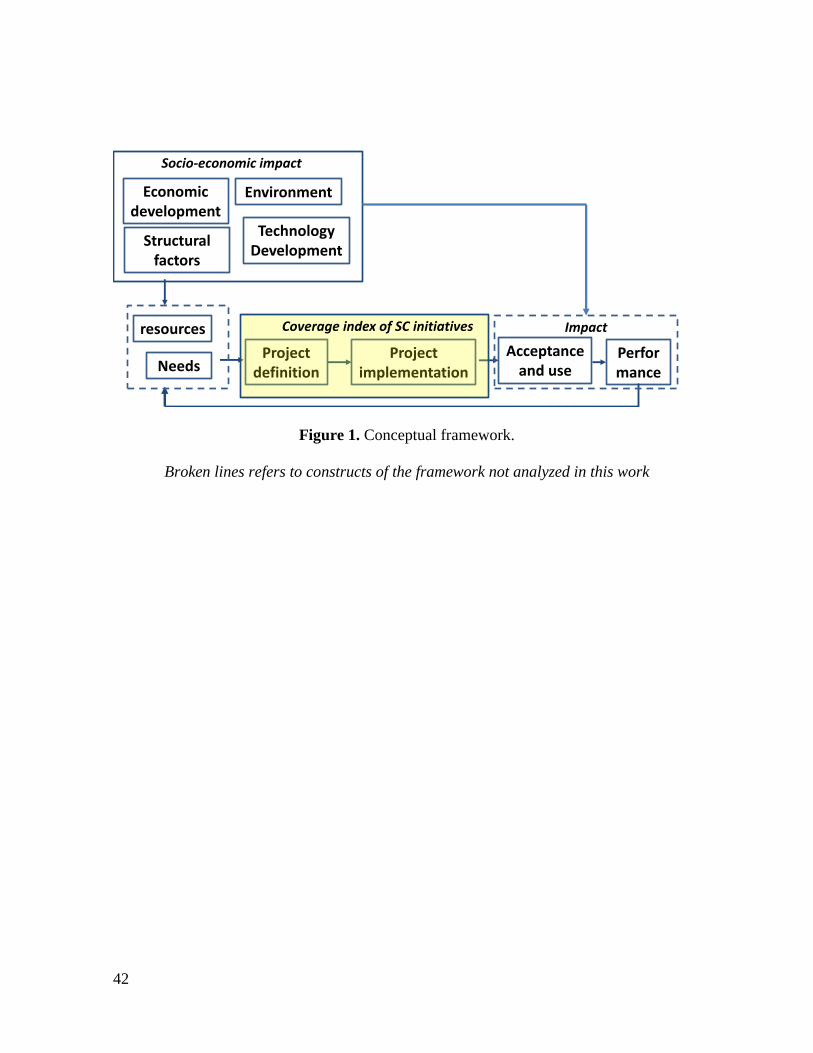
city level. Figure 1 illustrates the meaning of a CI in relation to a more comprehensive
analysis framework, and clarifies the focal point of the present analysis .
11
---- Figure 1 around here ----
Context variables that characterise the development trends of Smart Cities
A variety of factors can influence the way cities choose to develop SC initiatives. In this
paper, we choose to focus on four groups of contextual conditions that have key
importance on the resources and the needs of investing in SC cities (see figure 1). The
following subsections discuss how and why these conditions are expected to be relevant
for the development of SC trends around the world.
Structural factors: size and demographic density
City size can be relevant for the development patterns of SC initiatives for a variety of
reasons. First, large cities attract more human capital (Elvery, 2010) and can usually
rely on a greater implementation of infrastructural resources for electricity, water and
telecommunication infrastructures. Large cities also have critical masses of ICT users,
and this may favour a more rapid scaling up and breaking-even for new digital services.
This, for example, is the case of infomobility services for urban public transportation,
such as BusChecker in London (REF), which are commercialized using a software
application for smartphones that is sold for around £3.00. Being a niche market (not
every citizen has a smartphone or is willing to pay £3.00 for a mobile application), this
business is more likely to only have sufficiently high volumes of users in large cities.
However, large size can also be associated with barriers to SC initiatives. For example,
small towns might be ideal settings for pilot projects, as they can deal with shorter
installation times when projects requiring investments in distributed infrastructures (e.g.
street lighting, smart waste) are needed. As such, they can more easily attract
technology vendors who are willing to undertake the experimentation of new
12
technologies, and who, in some cases, can even willing to license the technology free of
charge in the start-up phase of the initiative.
Large cities often have a high demographic density, which can be another relevant
variable in the assessment of SC trends throughout the world. Large and dense cities
ease the flow of knowledge and ideas by putting a greater number of people in contact,
by facilitating social interactions (Glaeser and Gottlieb, 2006), and by generating ideas
and innovation. Furthermore, cities with high a demographic density have traditionally
made a greater effort to develop their local public transportation systems (Jun et al.,
2013), and, as a consequence, they are now in more favourable conditions for the
launching of SC initiatives in these settings. However, over a certain threshold,
demographic density and size lead to diseconomies in many settings, such as in
transportation, real estate, security, and energy consumption. Thus, these diseconomies
make dense cities less smart, but in the same way, they make them potentially more
interested in introducing ICT based initiatives aimed at mitigating the congestion
problems induced by such diseconomies.
Economic development
A city‟s GDP and its growth rate may influence the development of SC initiatives for
several reasons, related mainly to the local economic conditions and development rate.
Cities and countries with a higher GDP growth rate undergo a higher economic
expansion, which influences the financial resources that are available for investments in
new transportation, utility and telecommunications infrastructures, and in education.
Furthermore, cities with a greater economic development appear more attractive to
those people who wish to increase their standard of life (Cheshire and Magrini, 2006;
Lambiri et al., 2007) and they are thus in a better position to develop their human
13
capital. Human capital is crucial for the enacting of SC initiatives, since citizens with
more human capital are more likely to be end-users (or active contributors in the
development stage) of new software tools aimed at improving the quality of urban life.
Technology development
Technology development and diffusion follow path-dependant dynamics. This implies
that systems and organizations that have started to invest earlier in a technology
trajectory are in more favourable conditions to further develop or adopt emerging
technologies belonging to the same trajectory. This principle also holds true for the case
of cities that adopt the ICT that characterizes the actual trends of SC initiatives.
Specifically, the diffusion of Internet access and the use of Internet-based services
among the local population represent a relevant proxy of the development of an
Information Society (Beniger, 1986) and, as such, they can facilitate the enactment of
smart initiatives in many urban settings. On the other hand, a limited diffusion could
reflect a digital divide that hinders the achievement of a critical mass of users. This
could jeopardize the development of a variety of SC initiatives and restrain their
economic and societal value. This can be the case, for example, of car sharing
initiatives, participatory sensing (Beniger, 1986), or issue tracking systems (e.g. the case
of StreetBump in Boston or Fixmystreet, etc.). Cities with a digital divide are less
favourable settings for economic sustainability at the local level of these initiatives.
The budget for R&D investments in both private and public expenditure represents
another proxy of technology and human capital development. Moreover, high R&D
investments reflect a higher weight of hi-tech and service sectors on their industrial
composition. The countries and cities in which these sectors are more developed are

14
more likely to produce or effectively deploy those technologies that enable many SC
initiatives.
Environmental-friendly policies
Environmental sustainability represents a fundamental determinant of urban living
quality. The availability of green spaces is an important dimension of smartness, as it
can generate many types of socio-economic benefits (Del Saz-Salazarand Menéndez,
2007; Jim, 2013). As cities with such attributes can face lower marginal costs for the
further development of SC initiatives aimed at improving their environmental
sustainability, they can rely on a more developed infrastructure than polluted cities with
limited green areas.
Thus, although the costs for more polluted cities to adopt smart initiatives in
transportation, energy and urban planning can be higher, their relative advantage, as
well as the effort spent by local policy-makers to enact initiatives aimed at mitigating
pollution, can be more evident, given their relevance in public opinion and in the
political agenda. It is thus worth analysing whether SC development trends that are
expected to affect environmental issues involve green cities as well as cities with a more
critical level of pollution (Glaeser, 2011; Zheng et al., 2010).
Other country-specific factors
The chances of a city increasing its level of smartness also depends on some country-
specific variables that go beyond its economic, technological and environmental
development rate. In particular, country-specific factors can capture a complex array of
institutional variables (i.e. type of political leadership, types of strategic guidelines in
the current political agenda, etc.), cultural variables, morphological and climatic
15
conditions (e.g. that have a weight in determining the needs and the approaches to the
development of an SC policy).
As far as political conditions are concerned, centralization in decision-making power at
the political level, political risk, and the level of corruption can influence a city‟s
capability of implementing SC projects. For example, in a country with a moderate-high
political risk, multinational ICT enterprises may be more reluctant to enter public-
private partnerships, due to the higher economic and political uncertainties. These
factors certainly play a role in explaining the considerable number of SC initiatives
adopted in some large Asian cities (e.g.: Singapore, Seoul and Hong Kong), which have
reported a unique combination of favourable conditions for investment in the current SC
trends over the last decade: a centralized governance favouring shorter decision-making
processes for public investments and more rapid development times for their execution,
a high economic development rate, a low political risk, and unique weather conditions
that determine particular needs, with special regard to transportation systems
(Mahizhnan, 1999).
Country factors can also point out the differences in the political agenda that can
influence the way SC policies are designed and planned. For example, the focus on a
knowledge society in the European Union‟s Lisbon political agenda (Johansson et al.,
2006) could lead European cities to put greater emphasis on those policies that foster
human capital, education and entrepreneurship.

16
Methodology
Sample characteristics
The empirical analysis was conducted on a sample of 70 cities that have claimed to have
developed projects and best practices in one or more of the SC domains listed in Table
2. The analysis adopted to identify these cities and their related best practices was
carried out referring to city rankings1 on the quality of life, awards (e.g. the Intelligent
Community of the Year given by the Intelligent Community Forum), research centres
(e.g. MIT‟s Senseable CityLab), technology analysts (i.e. Gartner and Forrester) and the
web sites of the main ICT multinational enterprises involved in SC projects (IBM,
Siemens, Cisco, ABB, Alcatel-Lucent, Toshiba). Eighteen of these seventy cities are
located in North-America, twenty one in Asia, five in South America, twenty five in
Europe and one in Africa. Most of the observations are related to cities with less than 3
million citizens.
Measures
Coverage of the Smart City’s domains
A value of either 1 or 0 was assigned to each specific domain and sub-category reported
in Table 2, depending on whether a city reports best practices in that specific context, or
not. In order to avoid subjective judgements, all five authors independently assigned
their scores and the resulting score used for the analysis was the most frequent one.
The Coverage Index (CI) was then calculated for each of the six domains listed in table
2. An aggregate CI was then computed as the sum of the six indices calculated at the
1 The Siemens‟ Green City Index about environmental aspects; the European Cities and Regions of the
Future ranking proposed by the Financial Times; the Ranking of European medium-sized cities report
proposed by Vienna University of Technology; Mercer‟s Quality of Living survey and the Economist‟s
World‟s Most Liveable Cities.
17
level of the individual domains. The CI is an expression of the number of domains
covered by the best practices of an SC. In other words, the CI is an indication of the
ability of an SC to develop projects and consolidate best practices in a smaller or larger
spectrum of vertical domains.
The CI is used to study the impacts on the development of SC initiatives in the
identified application domains pertaining to the social, geographic, demographic, and
environmental variables that describe the reference context of an urban area. To this
end, a linear regression analysis was performed assuming CI as the dependent variable.
Computations were performed using the SPSS Statistics software tool.
The antecedents of the coverage of SC initiatives were operationalized through
variables collected from public databases (Census, 2010a; International Monetary Fund,
2010; Census, 2010b; Eurostat, 2012; The World Bank, 2012). Table 3 reports these
measures and their related sources, along with their descriptive statistics.
--- Table 3 around here ---
Findings
The data analysis had two objectives. First, when the descriptive statistics were
analysed, the goal was twofold: i) to identify the fields with the greatest diffusion of SC
initiatives throughout the world; ii) to detect commonalities and differences in the
patterns of SC trends across continents.
The second step of the empirical study involved a more comprehensive analysis on how
the contextual factors discussed in the conceptual model could influence the different
dimensions of the CI. This was obtained through a regression analysis on the different
layers of the CI.
Coverage indices in the six SC domains

18
Table 3 reports an exploratory analysis for the CI observed at the level of the six
domains identified in Table 2. The domains with the highest CI are Transportation and
Mobility and Natural Resources and Energy. Government is the domain in which the
cities included in the sample report the lowest number of initiatives.
In order to identify higher-level factors, the coverage indices in each domain were
analysed using factor analysis at an exploratory level. The factor analysis highlighted
two dimensions that confirmed the separation into hard vs. soft domains discussed in
Table 1. Each item showed the greatest weight for only one factor, thereby supporting
the discriminant validity of the measures. For example, the first factor identified by the
analysis refers to “hard domains”, as it encompasses the Natural Resources and Energy,
Transportation and Mobility and Buildings domains. The second factor refers to those
domains where the support of the technology to the projects is almost absent, or it is
more limited and is not aimed at enabling the city‟s sensing and acting capability. This
factor encompasses the following domains: i) Living, ii) Smart Government; iii)
Economy. The score for these two dimensions were computed as two variables that
consisted of the sum of the items that resulted to be associated to the related factor. It is
worth noticing that the variables that express the two dimensions identified by the factor
analysis are negatively correlated (Spearman coefficient -0.212; p-value<0.05). The
negative correlation highlights that cities that invest in hard domains are also less likely
to invest heavily in soft domains, and vice versa. This result can be considered as
evidence which supports the idea that there is no dominant worldwide SC model, but
there are at least two models: one focused on the technology vision and one that stresses
the soft aspects. The lower mean for the variable used to measure the soft dimensions
19
reflects the fact that a smaller percentage of cities in the sample follows this second SC
model than the percentage of cities that follow the technology-based approach.
--- Table 4 around here ---
Diffusion rates of initiatives in the sub-domains
Figure 2 is a further illustration of the diffusion of SC initiatives. About two thirds of
the sample reports the development of projects in the field of renewable energies and
half of the sample refers to mobility systems, which represent the areas where enabling
technologies are more mature. As can be seen in Table 3, the domains with a lower IC
are those related to Government, tourism and culture. Among the hard domains, the
fields with the lowest diffusion are the ones in which the enabling technologies are in
their early stage of commercial development (e.g. public lighting, water management
and agriculture), and where there are few best practices to finance their investments
through public-private partnerships .
--- Figure 2 around here ---
Cross-continent patterns of SC development trends
ANOVA analyses have shown significant differences across continents, in relation to
the coverage indices for Transport and Mobility, Government, and Economy and
People. Asian cities have paid particular attention to the Transport and Mobility
domain, whereas they report lower CI in the soft Government and Economy and People
domains. This result confirms the trends highlighted in recent studies (Ng and Hills,
2003; Tsou and Cheng, 2012; Thynell et al., 2013; Dahiya, 2012) on the patterns of
urbanization of large Asian cities. Countries such as India, China, Taiwan, Singapore
20
and Korea have encountered a mix of conditions over the last few decades that favours
investments in these settings: i) a high level of pollution, due to the fact they lag behind
international markets in terms of environmental standards and regulations; ii) a
considerable economic development that has made it critical for large cities to alleviate
congestion and reduce pollution through investments in new physical infrastructures.
On the other hand , European cities have so far emphasized softer aspects of the SC
concept. This trend reflects that EU policies support R&D and human capital
investments as a consequence of the so-called Lisbon Agenda, as well as a lower
investment capacity due to the current financial and economic crisis. The Lisbon
Agenda in fact encourages governments to increase their spending on R&D and
education, to support innovation and research and to promote ICTs (Winden et al.,
2007).
Finally, both North and South American cities systematically exhibit lower coverage
rates of smart initiatives than their European and Asian counterparts. In particular, there
is still a substantial lack of environmental regulation in South America (Castello 2011).
--- Figure 3 around here ---
Antecedents of CI
Regression analyses are performed to understand the influence of contextual variables
on the CI. The effect of contextual variables on the CI has in particular been analysed at
different levels: firstly by considering the coverage of all the SC domains, and then by
analysing the coverage of each single domain, as well as their aggregate measures at the
the hard and soft domain levels identified in the factor analysis.
--- Table 5 around here ---
21
Structural factors
Despite expectations, the city size (with reference to the size of the population) has not
been found to be a significant predictor of the CI. This might be due to the above-
mentioned existence of contrasting arguments that suggest a possible positive
relationship between city size and attitude to SC investments. Urban demographic
density instead showed a significant positive effect on the aggregate coverage index
(model 1). Demographic density was found to have a significant and positive effect on
Hard Domains (model 2), and in particular on the Transport and Mobility and Buildings
domains. This result underlines the fact that dense urban agglomerations face more
critical needs in order to build new infrastructures to reduce congestion in transportation
and energy use in buildings. Such cities usually have large commercial and residential
buildings in which the deployment of ICT solutions for the automation, heating and
cooling, and facility management of homes leads to a more efficient maintenance and a
reduction in the total cost of ownership.
Environmental variables
The regression also shows a negative effect of pollution on the CI related to the
aggregate domains (model 1) and on that related to the hard domains. In other words,
pollution - measured as carbon emissions – reduces the intention of a municipality to
enact smart initiatives in hard domains. This applies in particular to the Transport and
Mobility domain (model 5). Although speculative, a probable explanation is that the
most polluted cities are located in developing countries in which complete awareness of
the SC concept has not yet been established and the capabilities and the financial
resources for investments in new physical and ICT infrastructure to support mobility are
still limited.
22
Economic and technology-related variables
The expectation was that cities with more advanced technological and economic
development are likely to be more active in launching and implementing SC initiatives.
Contrasting evidence has emerged in support of this expectation. On the one hand, it has
been found that cities in richer countries (in terms of GDP per capita) are more active in
hard domains (model 2), but are less active in projects aimed at fostering their
innovation capabilities and human capital (model 6) than cities in countries with a lower
economic development. In a similar way, cities in countries with a greater use of
Internet services among the local population are more active in launching initiatives in
soft domains, and, in particular, in the Government (model 8) and Economy fields
(model 9). This confirms the crucial importance of the telecommunication and human
capital infrastructure in enacting e-government and e-democracy initiatives based on
increased transparency and citizens‟ empowerment. The growth rates in the GDP result
do not show any significant influence on the model specifications, as their effect is
probably covered by the geographical localization dummies (and by the fact that Asian
cities have a higher economic growth).
On the other hand, the R&D expenditure result shows a negative effect on the aggregate
CI and in particular on the number of fields covered in the Natural Resources and
Energy domain (model 4). One explanation of this evidence, although speculative, is
that under a certain threshold, national investments in R&D in countries with a low
R&D attitude could substitute R&D investments at the city level in the physical
infrastructure for the SC.
23
Other country-specific effects
As expected, cities in the American and Asian regions have exhibited a lower coverage
of soft domains, related to human capital and government practices, than European
cities. This is likely the consequence of the EU policies enacted to meet the Lisbon
agenda with regard to improvements in a knowledge-based society and economy. As far
as “hard” domains are concerned, namely transportation, buildings, energy and natural
resources, no significant geographical differences have emerged, except the negative
effect of South American cities, That is, South-American cities are less active in all the
hard domains considered in the analysis, thereby showing persistence in their structural
weaknesses in relation to their transportation, electricity and telecommunication
networks.
Finally, cities in countries with a lower degree of transparency in public administration
processes are more likely to sustain e-government initiatives, which shows that SC
trends are exploited in some domains to invert their structural attitude.
Discussion
In the era of knowledge economy, urban areas should not only adjust redistribute their
local wealth, but also invest in the quality of life of their citizens. In this context, SC is a
wide notion that encompasses many different socio-environmental aspects and ICT
applications. However, it has so far received limited attention by academic empirical
researchers . Despite the recent growing interest in the topic, public administrations still
need support to structure the concept of the smartness of a city, to capture its
implications, to identify benchmarks at the international level, and to find improvement
opportunities.

24
In this scenario of limited empirical evidence and hype on SCs, this paper can be
considered a first attempt to provide a comprehensive definition of the SC concept and
an empirical assessment of current trends at the international level. In doing so, the
paper proposes a definition of SC that is based on a combination of both academic and
the practitioner literature.
From a theoretical perspective, the exploration of taxonomies that are relevant for the
definition of an SC and its application domains allows comprehensive knowledge to be
acquired of such a notion. This knowledge goes beyond the focus of ICT vendors on
digitalization, and also takes into consideration some of the aspects that are related to
soft components that have crucial importance on the urban, social and economic
development of a city, such as human capital.
As far as its empirical contribution is concerned, the paper essentially highlights three
key issues. First, there is no dominant design for SCs, as economic development and
structural urban variables are important in influencing the way cities design their
digitalization paths. In this context, a path dependency effect can be highlighted, as
wealthier cities and those with more “open” democracies exhibit higher investments in
fields that are related to the development of innovative capabilities. Furthermore, a
negative correlation between the scope of SC interventions in hard and soft domains has
been reported: cities that are more active in the domains that are aimed at improving
their capacity to “sense and act” through ICT systems are less likely to differentiate the
initiatives launched for soft domains related to human capital, cultural heritage, and
innovation.
The second key issue concerns the influence of geographical variables. Again, this
observation reflects the principle that each country follows its own smartness strategy,
25
due to the importance of its local socio-economic and cultural background. On the basis
of this evidence, it is possible to claim that the exportation of best practices may not
occur easily.
Finally, the number of city domains covered by smart initiatives does not seem to be
correlated to the size of a city, considered in terms of population, but it is significantly
correlated to the demographic density. This shows that both large and small cities
exhibit some strengths and weaknesses in terms of innovation capabilities. Basically,
small cities represent a good “ecosystem” to launch new experimentation at a limited
scale and may exhibit less inertia stemming from past investments in ICT
infrastructures. On the other hand, large cities usually face more critical needs and
problems that entail digitalization endeavours and they can attract technology vendors
more easily as they can offer a larger potential market of more educated citizens.
However, density is a factor of developing SC initiatives, as it increases problems
related to urban congestion at various levels of the physical infrastructure (e.g.
transportation, energy distribution, waste and water management, etc.).
Policy implications
Overall, this study provides policy makers and city managers with useful general
guidelines and suggests some practical implications. On the one hand, the proposed
definition offers a systemic and practical perspective of the SC notion as the CI enables
a preliminary assessment to be made in order to direct the SC planning efforts towards
the appropriate application domains and initiatives. In other words, the analysis of the
relationships between the CI and the selected contextual variables can help identify the
main factors that enable the development of projects which could contribute towards
increasing the smartness of a city.
26
Moreover, a practical approach has been proposed to identify the actual efforts that are
made to increase the smartness level of a city, to set strategic objectives, and to select
effective actions in order to achieve the predetermined targets.
In addition, three further conclusions can be drawn, based on the findings of this work.
Firstly, the negative correlation between hard and soft domains is an indicator that many
municipalities and their technology vendors mainly focus on technology, and not on
people. However, complementarities between ICT systems and the human/relational
capital of the local population should be achieved to facilitate the building of a
comprehensive approach for the SC evolution.
Secondly, those cities that have planned a broader portfolio of investments in smart
initiatives are not necessarily better or more liveable cities. Rather than reaching a good
level of democracy and quality of life, these cities could turn into panoptical
environments in which the citizens are persistently observed and scrutinized. For
example, their vulnerability and resilience could be put at risk as their digital systems
could be more easily paralyzed by hackers or bugs. By requiring greater accessibility to
real-time information through electronic devices, and by using taxation to entail
investments in digital infrastructure, these cities could follow new unintended paths
towards social divide. Policy-makers and city planners should therefore take
vulnerability, resilience, financial sustainability and social inclusion into consideration
in their approaches to build cleverer cities.
Thirdly, the policy makers of cities that show less technological and economic
development should find ways of breaking the path dependency on technology adoption
in order to reduce the delay in implementing the SC paradigm. To this end, cities should
enact “bottom-up” approaches that are not just based on the deployment of complex
27
technological platforms, but rather on harnessing the collective intelligence and
creativity of their citizens. For example, smart phones rather than infrastructure sensors
could offer an alternative way of collecting mass user-centric real-time data. The way
these bottom-up approaches can be developed is still unclear, but possible directions for
future research have been pointed out.
Future research could also be directed towards overcoming some limitations inherent to
the present study, concerning an extension of the sample and the introduction of life
quality indicators to help assess the impact of SC strategies and their consistency with
local urban contexts.
Conclusion
This work can be considered a preliminary contribution to the development of empirical
research in order to obtain a better understanding of the current phenomena of SCs.
To this end, six main domains and the associated sub-domains of SC deployment have
been classified (i.e.: natural resources and energy, transport and mobility, buildings,
living, government, as well as economy and people) and a CI has been defined as the
ratio of domains covered by a city‟s best practices to the total of the potential domains
or sub-domains. A dataset of contextual variables has been collected and regression
analyses have been conducted in order to understand the relationship between various
geographical, urban, demographical, human capital, environmental and technology-
related variables, and the dependent CI variable.
The results of this study have revealed that there is no unique global definition of SC ,
and that the current trends and evolution patterns of any individual SC depend to a great
extent on the local context factors. City policy makers are therefore urged to try to
understand these factors in order to shape appropriate strategies for their SCs. This
28
study is in particular based on a framework that could also be applied to make a better
selection of investment opportunities in periods of limited financial resources and to
prioritize SC initiatives in the various domains and sub-domains of potential
implementation, considering their ability to maximize the benefits associated with the
specific competitive characteristics of an SC.
References
Accenture (2011). Building and Managing an Intelligent City.
http://www.accenture.com/SiteCollectionDocuments/PDF/Accenture-Building-
Managing-Intelligent-City.pdf > Accessed 08.03.2013.
Alawadhi, S., Aldama-Nalda, A., Chourabi, H., Gil-Garica, J.R., Leung, S., Mellouli,
S., Nam, T., Pardo, T.A., Scholl, H.J., & Walker, S. (2012). Building Understanding of
Smart City Initiatives. Electronic Government, 7443, 40-43.
Allen, K., & Moules, J. (2012). Entrepreneurs leap aboard data revolution, Financial
Time, December the 10th
2012.
Altuna, N., Dell‟Era, C., & Verganti, R. (2012). The Contribution Of Technology
Epiphanies In The Development of Smart Cities: Innovative Solutions Supporting The
Mobility In The City Environment, In The 13th International CINet Conference
Continuous Innovation Across Boundaries, 16-18 September, Rome, Italy.
Atzori, L., Iera, A., & Morabito, G. (2010). The Internet of Things: A survey. Computer
Networks, 54(15), 2787-2805.
Bakıcı, T., Almirall, E., & Wareham, J. (2013). A Smart City Initiative: The Case of
Barcelona. Journal of Knowledge Economy, 4(2), 135-148.
Beniger, J.R., (1986). The control revolution: Technological and economic origins of
the information society. Cambridge, Mass: Harward University.
29
Caragliu, A., Del Bo, C., & Nijkamp, P. (2009). Smart Cities in Europe. In the 3rd
Central European Conference in Regional Science – CERS 2009, 7-9 October Košice,
Slovak Republic.
Castello, M.G. (2011). Brazilian policies on climate change: The missing link to cities.
Cities, 28(6), 498-504.
Census. (2010a). Household Internet Usage in and outside of the Home by State <
http://www.census.gov/compendia/statab/2012/tables/12s1156.pdf> Accessed
4.11.2012.
Census (2010b). 2010 Census: State Population Profile Maps. <
http://www.census.gov/2010census > Accessed 10.12.2013.
Cheshire, P., & Magrini S. (2006). Population growth in European cities: Weather
matters –but only nationally. Regional Studies, 40(1), 23–37.
Chourabi, H., Nam, T., Walker, S., Gil-Garcia, J.R., Mellouli, S., Nahon, K., Pardo,
T.A., & Scholl, H.J. (2012) Understanding Smart City Initiatives: An Integrative
Framework. In the 45th Hawaii International Conference on System Sciences, 4-7
January Maui, HI, 2289–2297.
Correia, L. M., & Wünstel, K. (2011). Smart Cities Applications and Requirements.
White Paper of the Experts Working Group, Net!Works European Technology
Platform. <http://www.scribd.com/doc/87944173/White-Paper-Smart-Cities-
Applications> Accessed 22.02.2013.
Craig, R. (2012). European Cities and Region of the Future. Financial Times
<http://www.fdiintelligence.com/Rankings/European-Cities-and-Regions-of-the-
Future-2012-13?ct=true> Accessed 20.02.2012
30
Cramer, J. C. (1998). Population growth and air quality in California. Demography,
35(1), 45–56.
Cramer, J. C. (2002). Population growth and local air pollution: methods, models, and
Results, Population and development review. 28, 22–52.
D‟Ovidio, M., & Pratel, M. (2013). Social innovation and institutionalisation in the
cognitive-cultural economy: Two contrasting experices from Southern Europe, Cities,
33, 69-76.
Dahiya, B. (2012). Cities in Asia 2012: Demographics, economics, poverty,
environment and governance, Cites 29(S2), S44-S61.
Dirks, S., & Keeling, M. (2009). A Vision of Smarter Cities: How Cities Can Lead the
Way into a Prosperous and Sustainable Future. IBM Global Business Services, Somers.
Dirks, S., Keeling, M., & Dencik J. (2009). How smart is your city. IBM Institute for
Business Value. <http://www-03.ibm.com/press/attachments/IBV_Smarter_Cities_-
_Final.pdf > Accessed 8.01.2013.
Elvery J.A., (2010). City size and skill intensity. Regional Science and Urban
Economics. 40(6), 367-379.
European Commission. (2010). Europe 2020 - A strategy for smart, sustainable and
inclusive growth. Communication from the Commission, Brussels 3.3.2010.
Eurostat (2012). Region, Metropolitan regions and Cities
<http://epp.eurostat.ec.europa.eu/portal/page/portal/region_cities/introduction>
Accessed 13.11.2013.
Giffinger, R., Fertner, C., Kramar, H., Kalasek, R., Pichler-Milanović, N. & Meijers, E.
(2007). Smart Cities: Ranking of European Medium-Sized Cities. Vienna, Austria:
Centre of Regional Science (SRF), Vienna University of Technology.

31
<http://www.smart-cities.eu/download/smart_cities_final_report.pdf> Accessed
10.03.2013.
Glaeser E. (2011). Triumph of the city. The penguin press, USA.
Glaeser E., & Gottlieb J.D. (2006). Urban Resurgence and the Consumer City. Urban
Studies, 43(8), 1275-1299.
González, J. A., & Rossi, A. (2011). New trends for smart cities, Open Innovation
Mechanism in Smart Cities. European Commission within the ICT Policy Support
Programme <http://opencities.net/sites/opencities.net/files/content-
files/repository/D2.2.21%20New%20trends%20for%20Smart%20Cities.pdf> Accessed
15.01.2013.
Grewal, P.S., & Grewal P.S. (2013). Can cities become self relian in energy? A
technological scenario analysis for Cleveland, Ohio, Cities, 31 404-411.
Hall, R. E. (2000). The vision of a smart city. In the 2nd International Life Extension
Technology Workshop, 28 September, Paris, France.
Harrison, C., & Donnelly, I. A. (2011). A theory of smart cities. In the 55th Annual
Meeting of the International Society for the Systems Sciences, 17- 22 July 2011, The
University of Hull, Hull, U.K.
Harrison, C., Eckman, B., Hamilton, R., Hartswick, P., Kalagnanam, J., Paraszczak, J.
& Williams, P. (2010). Foundations for Smarter Cities. IBM Journal of Research and
Development, 54(4), 1-16 .
Hollands, R.G. (2008). Will the real smart city please stand up? Intelligent, progressive
or entrepreneurial?. City, 12(3), 303-319.
Hughes, S., Pincetl, S., & Boone, C. (2013). Triple exposure: Regulatory, climatic, and
political drivers of water management in Los Angeles. Cities, 32, 51-69.
32
Inayatullah, S. (2011). City Futures in Transformation: Emerging Issues and Case
Studies. Futures, 43(7), 654-611.
Intelligent Community Forum (2012). Intelligent Communities of the year 2008-2012
< http://www.intelligentcommunity.org> Accessed 18.02.2013.
International Monetary Fund. (2010). World Economic Outlook Database
<http://www.imf.org/external/pubs/ft/weo/2010/02/weodata/index.aspx> Accessed
5.12.2012.
Jim, C.Y. (2013). Socioeconomic effect on perception of urban green spaces in
Guangzhou, China. Cities, 21(31), 123-131.
Jun, M.Y., Kwon, J.H., & Jeong, J.E. (2013). The effects of high-density suburban
development on commuter mode choices in Seoul, Korea. Cities, 31, 230-238.
Johansson, B., Karlosson, C., Backman, M., & Juusola, P. (2006). The Lisbon Agenda
from 2000 to 2010, Cesis Paper No. 106.
Kanter, R. M., & Litow, S.S. (2009). Informed and interconnected: A manifesto for
smarter cities. Harvard Business School General Management, Unit Working Paper,
09-141.
Kim, H.M., & Han, S.S. (2012) City profile: Seoul. Cites, 29(2), 142-154.
La Greca, P., Barbarossa, L., Ignaccolo, M., Inturri, G., & Martinico, F. (2011). The
density dilemma. A proposal for introducing smart growth principles in a sprawling
settlement within Catania Metropolitan Area. Cities, 28(6), 527-535.
Lefton, R., & Weiss, D. (2010). Oil dependence is a dangerous habit. Center for
Amerinca progress. <http://www.americanprogress.org/issues/2010/01/
oil_imports_security.html>.
33
Lever, W. (2002). Correlating the knowledge-base of cities with economic growth,
Urban Studies, 39(5/6), 859-870.
Lambiri D., Biagi B., & Royuela V. (2007). Quality of life in the economic and urban
economic literature. Social Indicators Research, 84(1), 1-25.
Mahizhnan, A. (1999). Smart cities. The Singapore case. Cities, 16 (1), 13-18.
Marsa-Maestre, I., Lopez-Carmona, M. A., Velasco, J. R., & Navarro, A. (2008).
Mobile agents for service personalization in smart environments. Journal of Networks,
3(5), 30-41.
Munuzuri, J., Larraneta, J., Onieva, L., & Cortes P. (2005). Solutions applicable by
local administrations for urban logistics improvement. Cities, 22(1), 15-28.
Nam, T., & Pardo, T.A. (2011). Conceptualizing Smart City with Dimensions of
Technology, People, and Institutions. In the 12th Annual International Conference on
Digital Government Research, 12-15 June 12 - 15 College Park, MD.
Ng, M.K., & Hills, P. (2003). World cities or great cities? A comparative study of 5
Asian Metropolises, Cities, 20(3), 151-165.
Nijaki, L.K., & Worrel G. (2012). Procurement for sustainable local economic
development. International Journal of Public Sector Management, 25(2),133-153.
Oakley, D., & Tsao, H. (2007). Socioeconomic gains and spillover effects of
geographically targeted initiatives to combat economic distress: An examination of
Chicago‟s Empowerment Zone. Cities, 24(2), 43-59.
Odendaal, N. (2003). Information and Communication Technology and Local
Governance : Understanding the Difference between Cities in Developed and Emerging
Economies. Computers, Environment and Urban Systems, 27(6), 585-607.
34
Partridge, H. (2004). Developing a human perspective to the digital divide in the smart
city. In the Biennial Conference of Australian Library and Information Association, 21-
24 September, Queensland, Australia.
Riecken, G., & Yavas, U. (2001). Improving quality of life in a region. International
Journal of Public Sector Management, 14(7), 556-568.
Rios, P. (2008). Creating “the smart city”.
<http://archive.udmercy.edu:8080/bitstream/handle/10429/393/2008_rios_smart.pdf?se
quence=1 > Accessed 01.04.2013.
Sasaki, M. 2010. Urban regeneration through cultural creativity and social inclusion:
rethinking creative city theory through a Japanese case study, Cities, 27(S1), S3-S9.
Saz-Salazar del, S., & Menéndez, L. G. (2007). Estimating the non-market benefits of
an urban park: does proximity matter. Land Use Policy, 24 (1), 296–305.
Shi, A. (2003). The impact of population pressure on global Carbon dioxide emissions,
1975–1996: Evidence from pooled cross-country data. Ecological Economics, 44(1),
24–42.
Siemens, (2012). Green City Index
<http://www.siemens.com/entry/cc/en/greencityindex.htm> Accessed 23.10.2012.
Steria-Smart City (2011). Smart Cities will be enabled by Smart IT. <
http://www.steria.com/uk/fileadmin/assets/media/STE3899Smart_Cities_brochure_08_
APP.PDF > Accessed 10.02.2013.
Tabanick, B.G., & Fidell, L.S. (2001). Using Multivariate Statistics. 3rd
Ed. Harper
Collins, New York.
The Climate Group, ARUP, Accenture, & The University of Nottingham (2011).
Information Marketplaces The New Economics of Cities. <
35
http://www.theclimategroup.org/_assets/files/information_marketplaces_05_12_11.pdf>
Accessed 01.04.2013.
The European House Ambrosetti, ABB (2012). Smart Cities in Italia:un‟opportunità
nello spirito del Rinascimento per una nuova qualità della vita. ABB Power and
Opportunity for a Better World.
The World Bank (2012) Indicators < http://data.worldbank.org/indicator > Accessed
11.01.2013.
Think (2011). Smart Cities Initiative: How to Foster a Quick Transition towards Local
Sustainable Energy Systems.
<http://www.symple.tm.fr/uploaded/pdf/THINK_smart_cities.pdf> Accessed
02.04.2013.
Thynell, M., Mohan, D., & Tiwari, G. (2010). Sustainable transport and the
modernization of urban transport in Delhi and Stockholm. Cities, 27(6), 421-429.
Tiwari, R., Cervero, R, & Schipper, L. (2011). Driving CO2 reduction by Integrating
Transport and Urban Design strategy. Cities, 28(5), 394-405.
Toppeta, D. (2010). The Smart City vision: How Innovation and ICT can build smart,
"liveable", sustainable cities. The Innovation Knowledge Foundation. Think!Report,
005/2010.
Tsou, K.W., & Cheng, H.T. (2013). The effect of multiple urban network structures on
retail patterns- A cease study in Taipei, Taiwan. Cities, 32, 13-23
Traz-Ryan, B., Velosa, A., & Jacobs, A. (2011). Hype Cycle for Smart City
Technologies and Solutions, 2011. Gartner, < http://www.gartner.com/id=1754915 >
Accessed 13.05.2013.
Tukey, J.W. (1977). Exploratory Data Analysis, Addison-Wesley, Reading, MA.

36
Winden, W. van, Berg, L. van den., & Pol, P. (2007). European cities in the knowledge
economy: towards a typology. Urban Studies, 44(3), 525-549.
Washburn, D., Sindhu, U., Balaouras, S., Dines, R. A., Hayes, N. M., & Nelson, L. E.
(2010). Helping CIOs Understand “Smart City” Initiatives: Defining the Smart City, Its
Drivers, and the Role of the CIO. Cambridge, MA: Forrester Research, Inc. <
http://public.dhe.ibm.com/partnerworld/pub/smb/smarterplanet/forr_help_cios_und_sm
art_city_initiatives.pdf > Accessed 05.05.2013.
Yigitcanlar, T., & Lonnqvist, A. (2013). Benchmarking knowledge-based urban
development performance: Results from the international comparison of Helsinki.
Cities, 31, 357-369.
Zheng, S., Wang R., Glaeser, E., & Kahn, M. (2010). The greenness of China:
household carbon diozide emissions and urban development. Journal of Economic
Geography, 11(5), 761-792.
37
Prevalence of
investments in:
Domain Main objectives References
“Hard” Domains Energy grids Automated grids that employ ICT to
deliver energy and enable information
exchange about consumption between
providers and users, with the aim of
reducing costs and increasing reliability
and transparency of energy supply
systems.
Chourabi et al., 2012;
Correia and Wünstel,
2011; Mahizhnan, 1999;
Steria, 2011
Public lighting,
natural resources,
and water
management
Managing public lighting and natural
resources. Exploiting renewable
resources such as heat, solar, cooling,
water, and wind power.
Accenture, 2011; Correia
and Wünstel, 2011; Dirks
et al., 2009; ; Hughes et al.,
2013; Nam and Pardo,
2011; The Climate Group
et al., 2011; Think, 2011;
Toppeta, 2010
Waste management Applying innovations in order to
effectively manage the waste generated
by people, businesses, and city services.
It includes waste collection, disposal,
recycling, and recovery.
Accenture, 2011; The
Climate Group et al., 2011
Environment Using technology to protect and better
manage environmental resources and
related infrastructure, with the ultimate
goal of increasing sustainability. It
includes pollution control.
Atzori et al., 2010;
Caragliu et al., 2009;
Chourabi et al., 2012;
Inayatullah, 2011; Nam
and Pardo, 2011; Tiwari et
al., 2011;
Transport, mobility,
and logistics Optimising logistics and transportation
in urban areas by taking into account
traffic conditions and energy
consumption. Providing users with
dynamic and multi-modal information
for traffic and transport efficiency.
Assuring sustainable public
transportation by means of
environmental-friendly fuels and
innovative propulsion systems.
Atzori et al., 2010;
Caragliu et al., 2009;
Correia and Wünstel,
2011; Dirks et al., 2009;
Giffinger et al., 2007; La
Greca et al., 2011;
Munizuri et al., 2005; Nam
and Pardo, 2011; Steria,
2011; The Climate Group
et al., 2011; Think, 2011;
Toppeta, 2010; Washburn
et al., 2010
Office and
residential buildings Adopting sustainable building
technologies to create living and
working environments with reduced
resources. Adapting or retrofitting
existing structures to gain energy and
water efficiency.
Accenture, 2011; Steria,
2011; The Climate Group
et al., 2011; Think, 2011;
Washburn et al., 2010
Healthcare Using ICT and remote assistance to
prevent and diagnose diseases, and
deliver the healthcare service.
Providing all citizens with access to an
efficient healthcare system
characterised by adequate facilities and
services.
Accenture, 2011; Atzori et
al., 2010; Correia and
Wünstel, 2011; Dirks et
al., 2009; Nam and Pardo,
2011; The Climate Group
et al., 2011; Washburn et
al., 2010
Public security Helping public organizations to protect
citizens‟ integrity and their goods. It
includes the use of ICTs to feed real-
time information to fire and police
departments.
Accenture, 2011; Dirks et
al., 2009; Nam and Pardo,
2011; Washburn et al.,
2010
Soft domains Education and
culture Capitalising system education policy,
creating more opportunities for students
and teachers using ICT tools.
Promoting cultural events and
motivating people participation.
Managing entertainment, tourism, and
hospitality.
Accenture, 2011; Dirks et
al., 2009; Mahizhnan,
1999; Nam and Pardo,
2011; Washburn et al.,
2010
Social inclusion and
welfare Making tools available to reduce
barriers in social learning and
participation, improving the quality of
life, especially for the elder and
Atzori et al., 2010; Bakıcı
et al., 2013; Caragliu et al.,
2009; Chourabi et al.,

38
disabled. Implementing social policies
to attract and retain talented people.
2012; Correia and
Wünstel, 2011; Giffinger
et al., 2007; Mahizhnan,
1999; Toppeta, 2010
Public administration
and (e-) government
Promoting digitised public
administration, e-ballots and ICT-based
transparency of government activities in
order to enhance citizens empowerment
and involvement in public management.
Accenture, 2011; Bakıcı et
al., 2013; Caragliu et al.,
2009; Chourabi et al.,
2012; Correia and
Wünstel, 2011; Dirks et
al., 2009; Giffinger et al.,
2007; Odendaal, 2003;
Steria, 2011; Think, 2011;
Toppeta, 2010; Washburn
et al., 2010
Economy Facilitating innovation,
entrepreneurship and integrating the
city in national and global markets.
Bakıcı et al., 2013;
Caragliu et al., 2009;
Chourabi et al., 2012;
Correia and Wünstel,
2011; Giffinger et al.,
2007; Mahizhnan, 1999;
Toppeta, 2010
Table 1. Classified literature on the domains of a Smart City
39
Domain Sub-domain Description
Natural resources
and energy
Smart grids Electricity networks able to take into account the behaviours of all the connected users in
order to efficiently deliver sustainable, economic, and secure electricity supplies. Smart
grids should be self-healing and resilient to system anomalies.
Public lighting Illumination of public spaces with street lamps that offer different functions, such as air
pollution control and Wi-Fi connectivity. Centralised management systems that directly
communicate with the lampposts can allow reducing maintenance and operating costs,
analysing real-time information about weather conditions, and consequently regulating
the intensity of light by means of LED technology.
Green/renewable energies Exploiting natural resources that are regenerative or inexhaustible, such as heat, water,
and wind power.
Waste management Collecting, recycling, and disposing waste in ways that prevent the negative effects of an
incorrect waste management on both people and the environment.
Water management Analysing and managing the quantity and quality of water throughout the phases of the
hydrological cycle and in particular when water is used for agricultural, municipal, and
industrial purposes.
Food and agriculture Wireless sensor networks to manage crop cultivation and know the conditions in which
plants are growing. By combining humidity, temperature, and light sensors the risk of
frost can be reduced and possible plant diseases or watering requirements based on soil
humidity can be detected.
Transport and
mobility
City logistics Improving logistics flows in cities by effectively integrating business needs with traffic
conditions, geographical, and environmental issues.
Info-mobility Distributing and using selected dynamic and multi-modal information, both pre-trip and,
more importantly, on-trip, with the aim of improving traffic and transport efficiency as
well as assuring a high quality travel experience.
People mobility Innovative and sustainable ways to provide the transport of people in cities, such as the
development of public transport modes and vehicles based on environmental-friendly
fuels and propulsion systems, supported by advanced technologies and proactive
citizens‟ behaviours.
Buildings Facility management Cleaning, maintenance, property, leasing, technology, and operating modes associated
with facilities in urban areas.
Building services Various systems existing in a building such as electric networks, elevators, fire safety,
telecommunication, data processing, and water supply systems. Computer-based systems
to control the electrical and mechanical equipment of a building.
Housing quality Aspects related to the quality of life in a residential building such as comfort, lighting,
and Heating, Ventilation and Air Conditioning (HVAC). It includes all that concerns the
40
level of satisfaction of people living in a house.
Living Entertainment Ways of stimulating tourism and providing information about entertainment events and
proposals for free time and night life.
Hospitality Ability of a city to accommodate foreign students, tourists, and other non-resident people
by offering appropriate solutions to their needs.
Pollution control Controlling emissions and effluents by using different kinds of devices. Stimulating
decisions to improve the quality of air, water, and the environment in general.
Public safety Protecting citizens and their possessions through the active involvement of local public
organisations, the police force, and the citizens themselves. Collecting and monitoring
information for crime prevention.
Healthcare Prevention, diagnosis, and treatment of disease supported by ICT. Assuring efficient
facilities and services in the healthcare system.
Welfare and social inclusion Improving the quality of life by stimulating social learning and participation, with
particular reference to specific categories of citizens such as the elder and disabled.
Culture Facilitating the diffusion of information about cultural activities and motivating people
to be involved in them.
Public spaces management Care, maintenance, and active management of public spaces to improve the
attractiveness of a city. Solutions to provide information about the main places to visit in
a city.
Government E-government Digitizing the public administration by managing documents and procedures through
ICT tools in order to optimise work and offer fast and new services to citizens.
E-democracy Using innovative ICT systems to support ballots.
Procurement Allowing the public sector improving procurement procedures and the associated
contract management, with the purpose of assuring best value for money without
decreasing quality.
Transparency Enabling every citizen to access official documents in a simple way and to take part in
the decision processes of a municipality. Decreasing the possibility for authorities of
abusing the system for their own interests or hiding relevant information.
Economy and
people
Innovation and entrepreneurship Measures to foster the innovation systems and entrepreneurship in the urban ecosystem
(e.g. presence of local incubators).
Cultural heritage management The use of ICT systems (e.g. augmented reality technologies) for delivering new
customer experience in enjoying the city‟s cultural heritage. Use of asset management
information systems to handle the maintenance of historical buildings,
Digital Education Extensive Use of modern ICT tools (e.g. interactive whiteboards, e-learning systems) in
public schools
Human capital management Policies to improve human capital investments and attract and retain new talents,
41
avoiding human capital flight (brain drain).
Table 2. Classification of Smart City domains and sub-domains
42
Figure 1. Conceptual framework.
Broken lines refers to constructs of the framework not analyzed in this work
Project definition
Project implementation
Acceptanceand use
PerformanceNeeds
resources
Economicdevelopment
Environment
Technology Development
Structuralfactors
Coverage index of SC initiatives Impact
Socio-economic impact

43
Context variable Unit Mean StDev Coeff. of
Variation Min Max Source
Structural factors
Population # inhabitants 2,334,386 3,049,843 1.31 52,497 13,185,502 Census, 2010 [3]; Eurostat [4]
City area Squared Km 617 970 1.57 18 6,598 Census, 2010 [3]; Eurostat [4]
Demographic Density # inhabitants/ Km2 5,447 6,394 1.17 436 42,363 Census, 2010 [3];
Eurostat [4]
Development of Environment
protection policies
Carbon emissions per capita ton/inhabitant 7.16 4.54 0.63 0.70 22.20 Economist Intelligence Unit,
2009-2011
Economic development
GDP per capita $/inhabitant 35,926 18,079 0.50 2,800 70,927 Economist Intelligence Unit,
2009-2011
Unemployment rate % 7.51 3.61 0.48 2.00 21.00 Eurostat [4]
Country GDP per capita $/inhabitant 35,204 17,076 0.49 1,160 59,400 International Monetary Fund,
2010 [2]
Country GDP growth % 4.01 3.08 0.77 -4.00 15.00 World Bank [6]
Technological development
Households with Internet access % 60.33 23.15 0.38 8.00 99.00 Eurostat [4];
Intelligent Community
Forum, 2009-2012 [5]
Country R&D expenditure % GDP 2.15 0.97 0.45 0.10 3.72 World Bank [6]
Country-specific variables
Corruption Perceptions Index (CPI) Score measuring
level of corruption
in the public sector
as perceived by a
6.63 2.13 0.32 2.40 9.30 Transparency International
[7]
44
the informed view
of a panel of
experts and
analysts
Table 3. Variables describing the urban context variables included in the conceptual framework:
descriptive statistics and sources employed
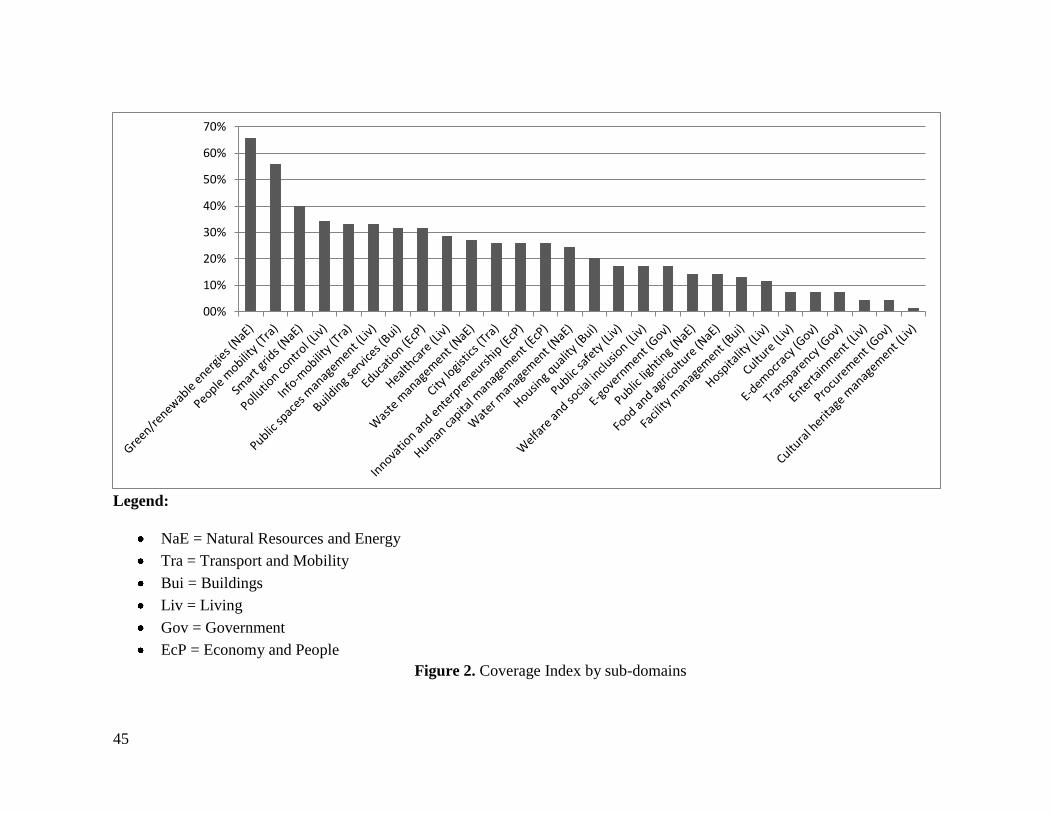
45
Legend:
NaE = Natural Resources and Energy
Tra = Transport and Mobility
Bui = Buildings
Liv = Living
Gov = Government
EcP = Economy and People
Figure 2. Coverage Index by sub-domains
00%
10%
20%
30%
40%
50%
60%
70%

46
** = p-value < 0.01 in the ANOVA
* = p-value < 0.05 in the ANOVA
Figure 3. Coverage Index by region
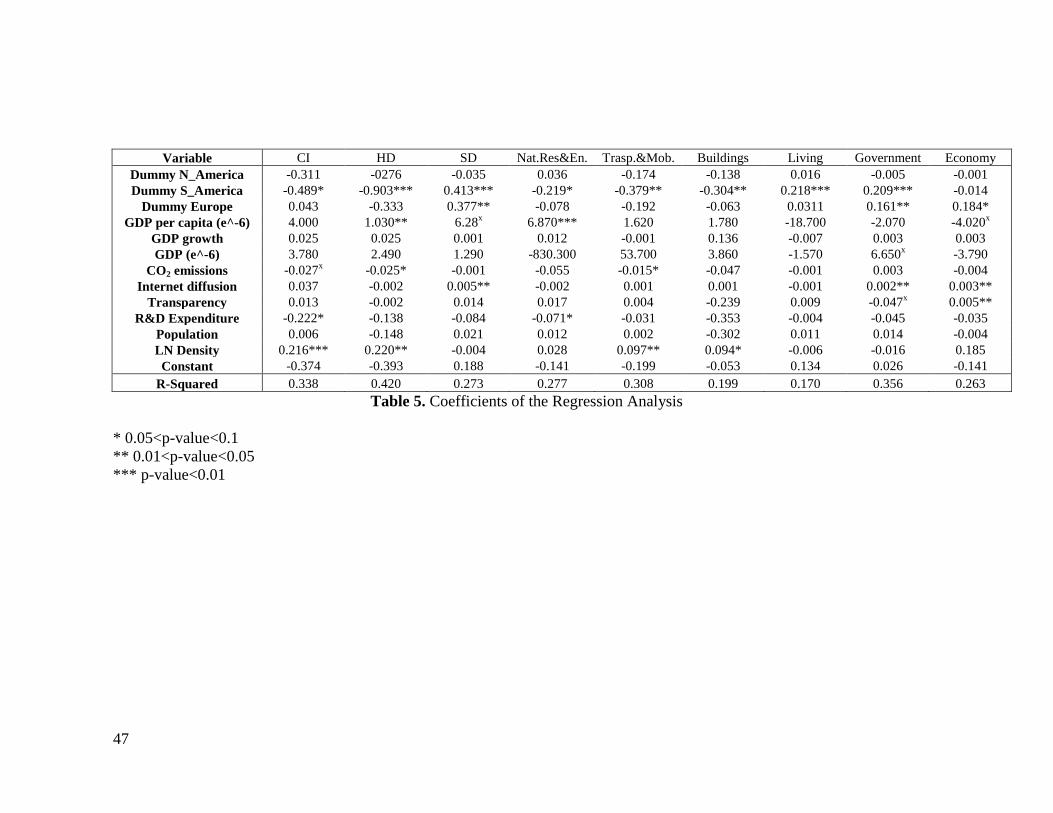
47
Variable CI HD SD Nat.Res&En. Trasp.&Mob. Buildings Living Government Economy
Dummy N_America -0.311 -0276 -0.035 0.036 -0.174 -0.138 0.016 -0.005 -0.001
Dummy S_America -0.489* -0.903*** 0.413*** -0.219* -0.379** -0.304** 0.218*** 0.209*** -0.014
Dummy Europe 0.043 -0.333 0.377** -0.078 -0.192 -0.063 0.0311 0.161** 0.184*
GDP per capita (e^-6) 4.000 1.030** 6.28x 6.870*** 1.620 1.780 -18.700 -2.070 -4.020
x
GDP growth 0.025 0.025 0.001 0.012 -0.001 0.136 -0.007 0.003 0.003
GDP (e^-6) 3.780 2.490 1.290 -830.300 53.700 3.860 -1.570 6.650x -3.790
CO2 emissions -0.027x -0.025* -0.001 -0.055 -0.015* -0.047 -0.001 0.003 -0.004
Internet diffusion 0.037 -0.002 0.005** -0.002 0.001 0.001 -0.001 0.002** 0.003**
Transparency 0.013 -0.002 0.014 0.017 0.004 -0.239 0.009 -0.047x 0.005**
R&D Expenditure -0.222* -0.138 -0.084 -0.071* -0.031 -0.353 -0.004 -0.045 -0.035
Population 0.006 -0.148 0.021 0.012 0.002 -0.302 0.011 0.014 -0.004
LN Density 0.216*** 0.220** -0.004 0.028 0.097** 0.094* -0.006 -0.016 0.185
Constant -0.374 -0.393 0.188 -0.141 -0.199 -0.053 0.134 0.026 -0.141
R-Squared 0.338 0.420 0.273 0.277 0.308 0.199 0.170 0.356 0.263
Table 5. Coefficients of the Regression Analysis
* 0.05<p-value<0.1
** 0.01<p-value<0.05
*** p-value<0.01