current and future economic impacts of the texas oil and ... · pdf filecurrent and future...
TRANSCRIPT

Jerry S. Rawls College of Business and Bob L. Herd Department of Petroleum Engineering
Current and Future Economic Impacts of the
Texas Oil and Gas Pipeline Industry

Report Prepared For:
Texas Pipeline Association
Austin, Texas
July 2014
Report Prepared By:
Bradley T. Ewing, Ph.D, Rawls Professor of Energy Economics
Area of Energy, Economics & Law, Jerry S. Rawls College of Business, Texas Tech University
Marshall C. Watson, Ph.D., P.E., Roy Butler Chair/Department Chair
Bob L. Herd Department of Petroleum Engineering, Edward E. Whitacre Jr. College of Engineering, Texas
Tech University
Terry McInturff, J.D., Professor of Practice and Chair
Area of Energy, Economics & Law, Rawls College of Business, Texas Tech University
Daan Liang, Ph.D., Associate Professor
Department of Construction Engineering and Engineering Technology, Edward E. Whitacre Jr. College of
Engineering, Texas Tech University
Additional Researchers and Contributors:
Tariq Ali, Doctoral Student in Petroleum Engineering
Roland O. Ezewu, Doctoral Student in Petroleum Engineering
Ibegbuna Ezisi, Doctoral Student in Petroleum Engineering
Inquiries and questions may be directed to Dr. Bradley Ewing by phone at
806-834-3939 or by email [email protected]. Additionally, Dr. Marshall Watson may be reached
by phone at 806-834-7894 or by email [email protected].
The authors wish to thank the many members of the TPA that provided invaluable discussion and
information that helped bring this study to fruition. We also thank Kellie Estes, Director of Operations,
Center of Energy Commerce, for help in managing and organizing many of the details associated with
this study.

Table of Contents
Page
Introduction
1
Objectives and Methodological Approach
2
Overview of Production and Forecast Pipeline Takeaway Capacities
3
Engineering Analysis – The Basis for Economic Activity
5
Anadarko Basin
9
East Texas Basin
13
Fort Worth Basin
19
Texas Gulf Coast Basin
23
Permian Basin
28
Texas Total
33
Economic Impacts of the Texas Pipeline Industry
37
Economic Impact: 2013
39
Economic Impacts: 2024
42
Summary
47
References and Sources of Information
48

Executive Summary
This study provides estimates of the 2013 economic impact of the Texas oil and gas pipeline industry
and projections for the year 2024. In addition to the current and future impact studies, a petroleum
engineering-based analysis provides further information regarding the pipeline industry, the backbone
for economic activity in the oil and gas sector. The focus of this study is on the value creation and the
economic sustainability that lies in the economic contributions of Texas pipelines. For purposes of this
study, economic output refers to the value of all industrial production in a region (i.e., gross revenues),
following the convention used by the U.S. Bureau of Labor Statistics (BLS) and Bureau of Economic
Analysis (BEA); jobs are defined as the average annual number of jobs in a sector, industry, or region,
while labor income consists of all forms of employment income, including employee compensation
(wages and benefits) and proprietor income; and value added indicates the addition to gross state
product.
The oil and gas pipeline industry expenditures related to ongoing operations and construction, are an
important driver of economic activities in the state of Texas and beyond. The industry’s activities
generate and sustain jobs, income and output, and contribute to state and local government revenues.
The industry also provides substantially to the gross state product of Texas.
In the year 2013, the total economic impact from Texas pipeline operations and construction include:
Over $33 billion in economic output
More than 165,000 jobs
Over $18.7 billion in additional gross state product
Over $1.6 billion in state and local government revenues
By the year 2024, depending on economic conditions, projections demonstrate that the total economic
impact from Texas pipeline operations and construction will generate between:
$30-41.4 billion in economic output (in today’s dollars)
150,000-206,000 jobs
$17-23.4 billion in additional gross state product (in today’s dollars)
$1.5-2.0 billion in state and local government revenues (in today’s dollars)
Between the current year and 2024, the Texas pipeline industry will generate cumulative economic
impacts (in today’s dollars) of around $374 billion in economic output, $212 billion in additional gross
state product, and contribute $19.5 billion in state and local government revenues. Additionally, the
industry will sustain an average of around 171,000 jobs per year in the state of Texas.
The activities of the Texas pipeline industry, which include the transportation of hydrocarbons from
sources of exploration and production to refineries and end-users, are one component of the substantial
job creation, investment, and overall economic growth.
Texas plays and reservoirs will help sustain economic activity and growth in the coming years:
Several potential and confirmed Resource Plays (media terms "shale gas/oil"), which have been identified throughout Texas, cover very large areas (multiple counties) as opposed to conventional, non-Resource Plays, which cover, at best, a few thousand acres
Wells in a confirmed Resource Play exhibit a repeatable statistical distribution, thus offering predictable performance in a given geological subset
The above two points result in long-term (i.e., decades of) drilling activity, thus sustaining or increasing production
Drilling activity and production is an important factor in providing current and future economic benefits:
The State of Texas has the greatest rig count of any U.S. state or world region (48 percent of the total rigs running in the U.S. and 25 percent of the total world rig count)
A rapidly increasing number of wells in target plays and reservoirs being drilled are horizontal
Texas’ individual well productivity has improved dramatically since 2011 due to improved technology in horizontal drilling and hydraulic fracturing
Drilling efficiencies are being realized in all U.S. Resource Plays
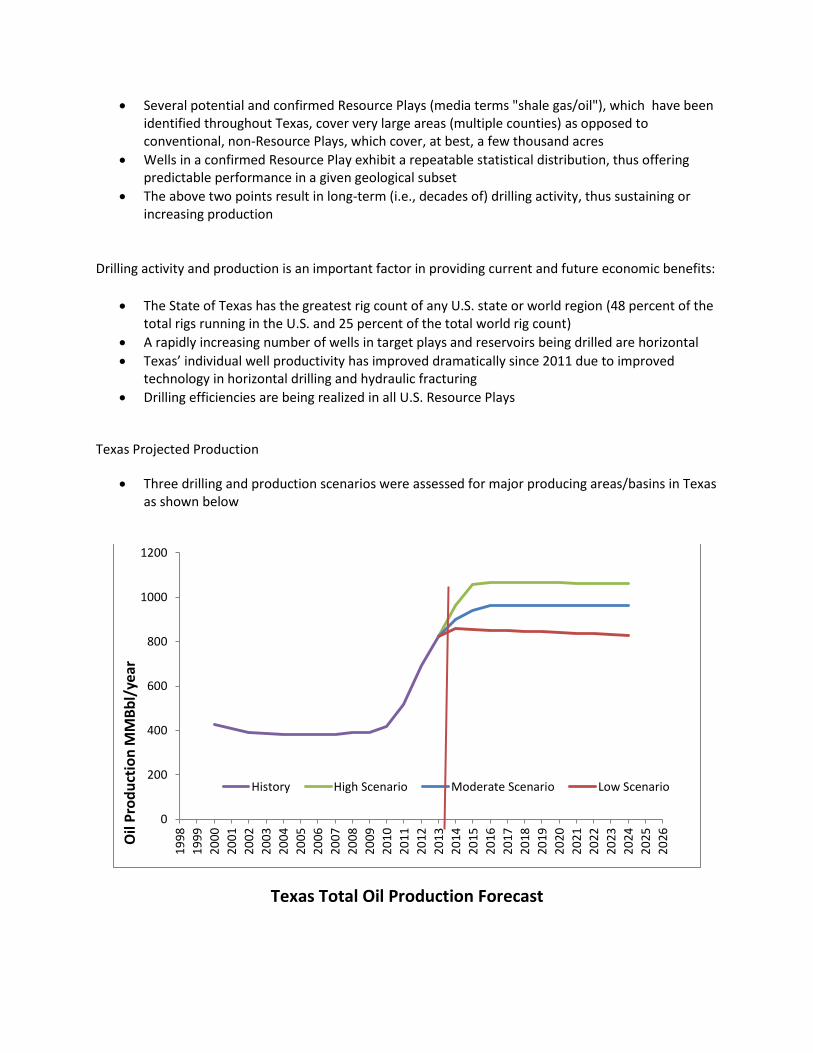
Texas Projected Production
Three drilling and production scenarios were assessed for major producing areas/basins in Texas as shown below
Texas Total Oil Production Forecast
0
200
400
600
800
1000
1200
19
98
19
99
20
00
20
01
20
02
20
03
20
04
20
05
20
06
20
07
20
08
20
09
20
10
20
11
20
12
20
13
20
14
20
15
20
16
20
17
20
18
20
19
20
20
20
21
20
22
20
23
20
24
20
25
20
26
Oil
Pro
du
ctio
n M
MB
bl/
year
History High Scenario Moderate Scenario Low Scenario

Texas Total Gas Production Forecast
Summary of current production and takeaway capacities
Oil Gas
Basin Current Production (Mbbls/d)
Pipeline takeaway capacity
(Mbbls/d)
Current Production
(Bcf/d)
Pipeline takeaway capacity (Bcf/d)
Anadarko 110 Not available 2.1 2.54
East Texas 65 Not available 4.0 3.61
Texas Gulf Coast 1200 16002 3.7 4.83
Fort Worth 65 244 5.3 5.84
Permian 1580 16802 3.3 2.84
Total 3020 3300 18.4 19.5
1 Energy Transfer Partners (ETP) and Survey Results 2 RBN Energy Data 3 ETP 4 Survey Results, less than 100% responding but considered representative of most of the capacity
Other
Total gas flared in Texas is currently approximately 160 MMcf/d as compared to less than 30 MMcf/d prior to 2010
This report did not include the effect of an 8-10$/MMbtu gas price, which would greatly influence substantial increases in drilling and production in the dry gas area of the Eagle Ford, Haynesville and Barnett shale plays.
0
1000
2000
3000
4000
5000
6000
7000
8000
9000
10000
19
98
19
99
20
00
20
01
20
02
20
03
20
04
20
05
20
06
20
07
20
08
20
09
20
10
20
11
20
12
20
13
20
14
20
15
20
16
20
17
20
18
20
19
20
20
20
21
20
22
20
23
20
24
20
25
20
26
Gas
Pro
du
ctio
n B
cf/y
ear
History High ScenarioModerate Scenario Low Scenario

An Economic Interpretation
The state of Texas competes to attract and retain companies engaged in the exploration, production,
processing and refining of oil and natural gas. As shown in this study, Texas has confirmed Resource
Plays and Reservoirs that can result in long-term drilling activity and increased production. The pipeline
transportation system is a key component in the realization of value and the associated economic
benefits that will come from the continued growth and expansion of the oil and gas industry. A pipeline
system capable of effectively handling increased levels of oil and gas activity is necessary for companies
to economically operate in Texas. From this standpoint, the ability to retain and attract oil and gas
investments requires a pipeline system that can manage the flow of hydrocarbons in a timely and cost-
effective manner. Accordingly, as shown in this study, the economic benefits attributable to the
pipeline system in Texas are substantial. Moreover, the upstream and downstream segments of the
energy industry (i.e., exploration, production and refining activities) will generate additional economic
benefits for Texas, provided that these companies have an efficient and effective means of transporting
their product.

1
Introduction
This report provides estimates of the positive economic impact of the oil and gas pipeline industry on
the state of Texas. The oil and gas industry in Texas is characterized by a highly integrated supply chain
centered on pipeline transportation and supporting infrastructure. By connecting upstream to
downstream oil and gas activities, pipelines play a significant role in value creation and economic
sustainability in the state.
The economic benefits of the pipeline industry result in substantial highly compensated employment,
investment and economic growth. The economic impact of the pipeline industry is derived from the
transportation of hydrocarbons from sources of exploration and production to refineries and end-users.
This core activity, in turn, leads to a number of non-core but very critical supply chain activities such as
the construction of pipelines, processing plants, meter stations, compressors, fractionators and
equipment manufacturing. The secondary effects of the pipeline industry include the numerous
expansions and continuing operations of suppliers to the industry as well as wholesale, retail, real estate
and housing, and financial services, etc., which benefit from the increased dollars generated.
A unique feature of this study is the inclusion of the petroleum engineering and geophysical factors
analysis that characterize Texas. Well productivity has improved dramatically since 2011 due to
improved technology in horizontal drilling and multi-stage hydraulic fracturing. Drilling efficiencies are
being realized in all U.S. Resource Plays and Texas is no exception, thus vast improvements in efficiency
are not only being realized but expected in and throughout the state. It is these factors that have led
current state of production and that have contributed to the many economic benefits to the state.
However, the realization of these benefits depends on a pipeline transportation system that will play a
vital role in the future development of the Texas economy. The economic benefits arising from the
existence and continuing operations of the oil and gas pipeline industry are quantified in terms of
employment, labor income (including proprietor’s income), value added, and output (i.e., gross
revenues). Additionally, this study provides a comprehensive analysis of the tax base associated with
the industry. Specifically, this study estimates economic impact for the year ending 2013 and provides
projections for the year 2024.

2
Objectives and Methodological Approach
The major objective of this study is to quantify the economic impact of the Texas oil and gas pipeline
industry. Specifically, these impacts are in the form of jobs created and sustained, economic output as
measured by the value of all industrial production in an area or region, value added to state gross
domestic product, and various forms of state and local government revenues generated from the
activities associated with this industry. The methodological approach of this research combines
elements from the fields of both energy economics and petroleum engineering.
The research utilizes the IMPLAN economic impact modeling software. To fully capture the underlying
factors of economic activity in Texas, historical economic and petroleum engineering data have been
collected and analyzed. The study includes analyses of key underlying petroleum engineering aspects of
the oil and gas supply chain combined with economic analysis, to estimate the impacts of the industry.
The study is unique in that it blends expertise in energy economics and petroleum engineering to
provide an engineering-based economic impact model that takes into account the geological,
engineering, and economic nature of the industry.

3
Overview of Production Forecast and Pipeline Takeaway Capacities
The objective of the engineering assessment was to take the historical activity and production, build a
model to project ten years forward, and then compare that with pipeline takeaway capacities. Pipeline
takeaway capacities were based on surveys conducted by the Texas Pipeline Association (TPA), and
other published studies of which only 2 (Permian and Texas Gulf coast Basins) existed for oil pipeline
takeaways. The surveys conducted by the TPA were not completed by all entities; thus resulted in less
than 100% of the true takeaway capacity. However, the total capacities summed up for each basin from
the surveys, may be representative of the relative take away from each basin. Production profiles were
projected as a function of drilling activity and knowledge of the type of play or formation predominantly
being drilled. The five major Texas Basins and their respective major plays are as follows:
Anadarko Basin – Granite Wash and the Cleveland Formation
East Texas Basin – Cotton Valley, Haynesville, and Bossier
Permian Basin – Cline, Spraberry, Wolfberry, Wolfcamp, Bone Spring, and Avalon
Texas Gulf Coast Basin – Eagle Ford
Fort Worth Basin- Barnett
These basins were selected on the basis of having the most drilling, development and production
activity. The objective of this study was to access each basin’s production, rig activity and pipeline
takeaway capacity. The locations of these basins and others are illustrated in Figure 1.1.
Figure 1.1: Descriptive Map of all Basins in Texas (Source: Jackson School of Geosciences)

4
All of these plays are either considered or may potentially be a Resource Play as defined by the Society
of Petroleum Evaluation Engineers (SPEE). The SPEE parameters stated in its book, “Monograph 3;
Guidelines for Practical Evaluation of Underdeveloped Reserves in Resource Plays,” are as follows:
The following “Tier 1” characteristics are nearly always observed in Resource Plays:
1. Wells exhibit a repeatable statistical distribution of estimated ultimate recoveries
(EURs).
2. Offset well performance is not a reliable predictor of undeveloped location
performance.
3. A continuous hydrocarbon system exists that is regional in extent.
4. Free hydrocarbons (non-sorbed) are not held in place by hydrodynamics.
If the reservoir being evaluated satisfies these four criteria, there is a very good chance the
reservoir is a Resource Play. Conversely, if any one of these characteristics is absent, it is quite
likely the reservoir is NOT a Resource Play. The Tier 1 criteria are listed in order of significance,
and both geological and engineering data must support these criteria.
The Tier 1 criteria possess aspects of engineering and geology, and determining whether a
reservoir is a Resource Play requires consideration of both. The geological depositional model
needs to describe a reservoir with regional extent, while the engineering data needs to show
statistically repeatable EURs over time. Obviously, sufficient time is required to arrive at these
conclusions; time for historical data to accumulate, and time to analyze the data. As a practical
matter, it is anticipated that Resource Plays will encompass more than 100 completed wells in
the reservoir. There are two rationales for this. First, developing a usable statistical model in a
Resource Play typically requires about 100 wells. Second, a reservoir that has sufficient areal
extent to be considered a Resource Play will likely encompass a minimum of 100 wells.
Although the following “Tier 2” reservoir characteristics are not required, these are commonly
observed in Resource Plays:
5. Requires extensive stimulation to produce at economic rates.
6. Produces little in-situ water (except for Coalbed Methane and Tight Oil Reservoirs).
7. Does not exhibit an obvious seal or trap.
8. Low permeability (< 0.1 md).
Resource Plays have also been sometimes called “Unconventional Plays” and/or reservoirs. These
Resource Plays are important to this study as they result in long term sustained activity.
In accessing the above Basins and Texas total, we made 10 year conservative projections for three
different scenarios for hydrocarbon production and rig count. These scenarios are:
Scenario 1 (High Scenario): Anticipating stable oil prices in excess of $100/bbl and increasing gas
prices resulting in continued or increased drilling activity

5
Scenario 2 (Moderate Scenario): Anticipating oil prices in the $70-$90 range with some level of
instability and gas prices in the current $4/MMBtu (Million British thermal units) range.
Scenario 3 (Low Scenario): A collapse in oil & gas prices resulting in minimal activity.
In Scenario 1, we did not include the effect of an 8-10$/MMBtu gas price which would greatly influence
drilling and production in the Dry Gas area of the Eagle Ford, Haynesville and Barnett. The Eagle Ford
and Haynesville drilling could be substantial by several orders of magnitude over what we projected in
Scenario 1. However, due to data limitations, an assessment of the associated drilling and production
impact is not feasible at this time.
Engineering Analysis – The Basis for Economic Activity
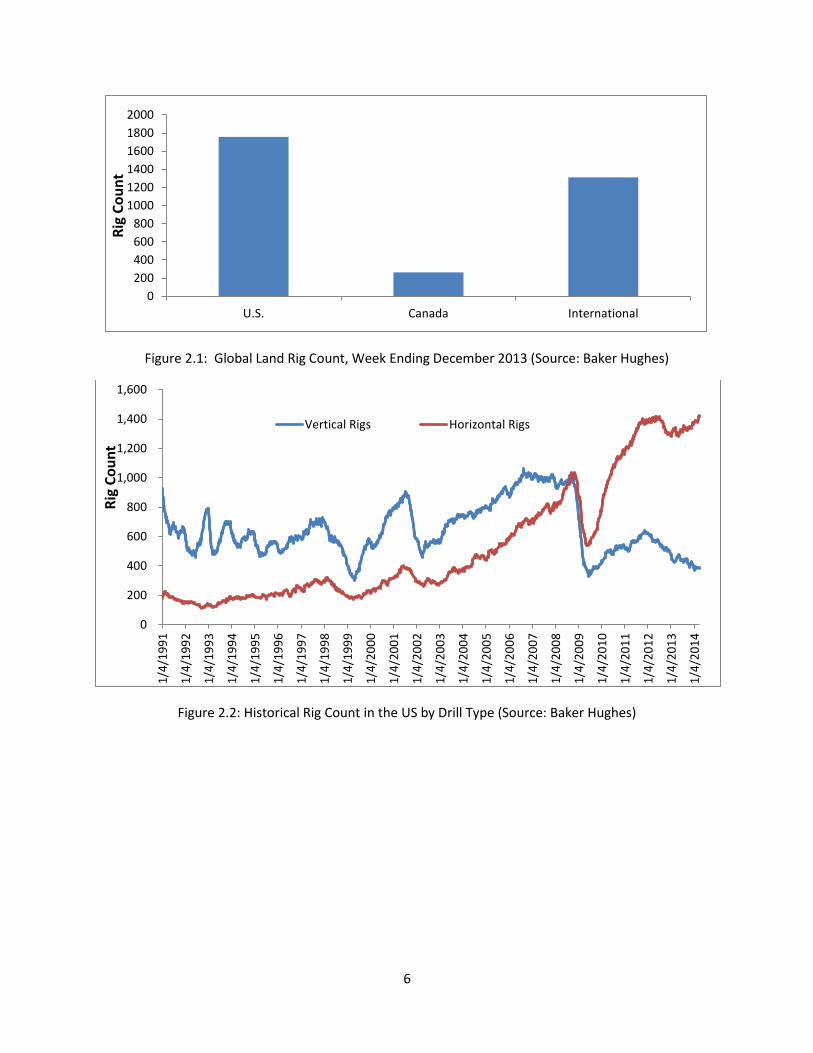
The United States has the highest number of rotary rigs with 1757 or 53% of the world’s total rigs in
operation as of December 2013 (Figure 2.1). The state of Texas has the highest number of rigs with 835
as of December 27, 2013. This represents 48% of total rigs running in the United States, and 25% of
total world rig count.
An increasing percentage of the wells in the U.S. are being drilled horizontally as a result of the
advancement of hydraulic fracturing and horizontal drilling technology. This is illustrated in the
increasing trend of horizontal rig utilization since the 2008 recession, as shown in Figure 2.2. Officially,
the National Bureau of Economic research (NBER) dates the beginning of the U.S. recession in 2007Q4
and ending 2009Q2. The effect in the oil and gas industry was generally felt in 2008. Thus, for purposes
of this report, we refer to this period as the 2008 recession. In fact, in the last two years, most of the
rigs in the U.S. are drilling directional/horizontally versus vertically. Over the last year, the number of
horizontal and directional rotary rigs increased by 84 rigs (31%) and the number of rigs drilling vertically
decreased by 90 (19%) as shown in Figure 2.3. The historical trend in the U.S. Rig Count (Figure 2.2) is
closely mirrored and influenced by the trend in Texas Rig Count (Figure 2.4). Thus, it is fair to conclude
that Texas, having the highest number of rigs in operation, as shown in Figure 2.5, has the most drilling
activity in the U.S.
The closing gap between total rig count and rigs drilling for oil, as shown in Figures 2.6 and 2.7, indicates
operator’s preferential drive for hydrocarbon liquid, especially in the post-2008 recessionary period.
The reason for this is after 2008, natural gas prices never quite recovered while oil prices quickly
recovered back to pre-2008 prices, and then continued to increase thereafter. Oil and gas companies
refocused capital budgets to oil (liquids) prone basins. The areas that benefited the most were the
Permian Basin, Bakken Play (Williston Basin), and the Eagle Ford (Texas Gulf Coast Basin).
6
Figure 2.1: Global Land Rig Count, Week Ending December 2013 (Source: Baker Hughes)
Figure 2.2: Historical Rig Count in the US by Drill Type (Source: Baker Hughes)
0
200
400
600
800
1000
1200
1400
1600
1800
2000
U.S. Canada International
Rig
Co
un
t
0
200
400
600
800
1,000
1,200
1,400
1,600
1/4
/19
91
1/4
/19
92
1/4
/19
93
1/4
/19
94
1/4
/19
95
1/4
/19
96
1/4
/19
97
1/4
/19
98
1/4
/19
99
1/4
/20
00
1/4
/20
01
1/4
/20
02
1/4
/20
03
1/4
/20
04
1/4
/20
05
1/4
/20
06
1/4
/20
07
1/4
/20
08
1/4
/20
09
1/4
/20
10
1/4
/20
11
1/4
/20
12
1/4
/20
13
1/4
/20
14
Rig
Co
un
t
Vertical Rigs Horizontal Rigs

7
Figure 2.3: US Rotary Rig by Drill Type (Source: Baker Hughes)
Figure 2.4: Historical Rig Count of Texas (Source: Baker Hughes)
477
1286
387
1370
0
200
400
600
800
1000
1200
1400
1600
Vertical Horizontal
Rig
Co
un
t
2012 YTD
2013 YTD
0
100
200
300
400
500
600
700
800
900
1,000
19
87
19
88
19
89
19
90
19
91
19
92
19
93
19
94
19
95
19
96
19
97
19
98
19
99
20
00
20
01
20
02
20
03
20
04
20
05
20
06
20
07
20
08
20
09
20
10
20
11
20
12
20
13
Rig
Co
un
t
Texas Total

8
Figure 2.5: US Rig Count (Source: Baker Hughes)
Figure 2.6: US States Land Rig Count Trend Closely Mirrored by Texas Rig Count (Source: Baker Hughes)
0
100
200
300
400
500
600
700
800
900 R
ig C
ou
nt
YTD 2012 YTD 2013
0
500
1000
1500
2000
2500
2/1
1/2
01
1
4/1
1/2
01
1
6/1
1/2
01
1
8/1
1/2
01
1
10
/11
/20
11
12
/11
/20
11
2/1
1/2
01
2
4/1
1/2
01
2
6/1
1/2
01
2
8/1
1/2
01
2
10
/11
/20
12
12
/11
/20
12
2/1
1/2
01
3
4/1
1/2
01
3
6/1
1/2
01
3
8/1
1/2
01
3
10
/11
/20
13
12
/11
/20
13
2/1
1/2
01
4
Rig
Co
un
t
U.S. Total Texas Total Texas Oil Rigs U.S. Oil Rig

9
Figure 2.7: Historical Offshore Rig Count (Source: Baker Hughes)
Historical production data were sourced from the Railroad Commission of Texas and DrillingInfoTM. Rig
count data was mostly obtained from Baker HughesTM. Pipeline takeaway capacities were obtained
from published data and collated surveys conducted by the TPA. Detailed explanations of all major five
Basins analyzed in this study are discussed in the text.
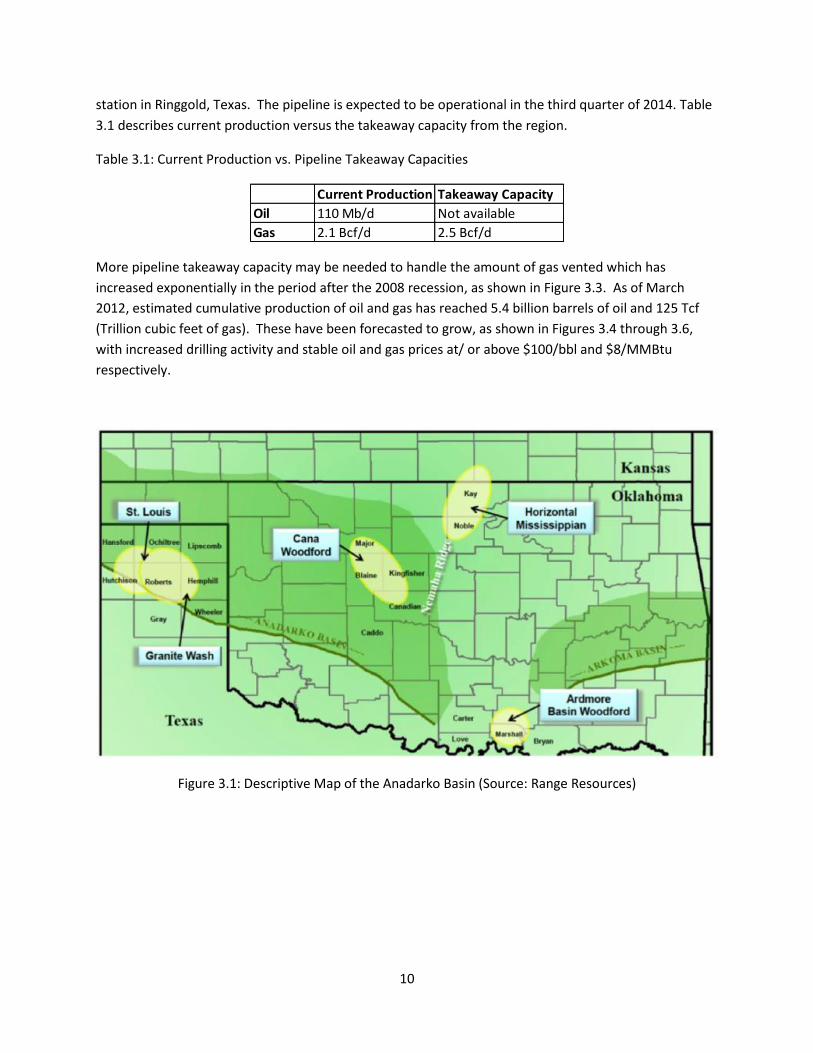
Anadarko Basin
The Anadarko Basin encompasses both Texas (Texas Panhandle) and Oklahoma with more of the oil and
gas production emanating from Oklahoma, as shown in Figure 3.1. Current oil and gas production in the
Texas portion is about 110 Mb/d (Thousand barrels per day) and 2.1 Bcf/d (Billion cubic feet per day)
respectively. Survey results received from the TPA indicate a pipeline takeaway capacity of about 2.5
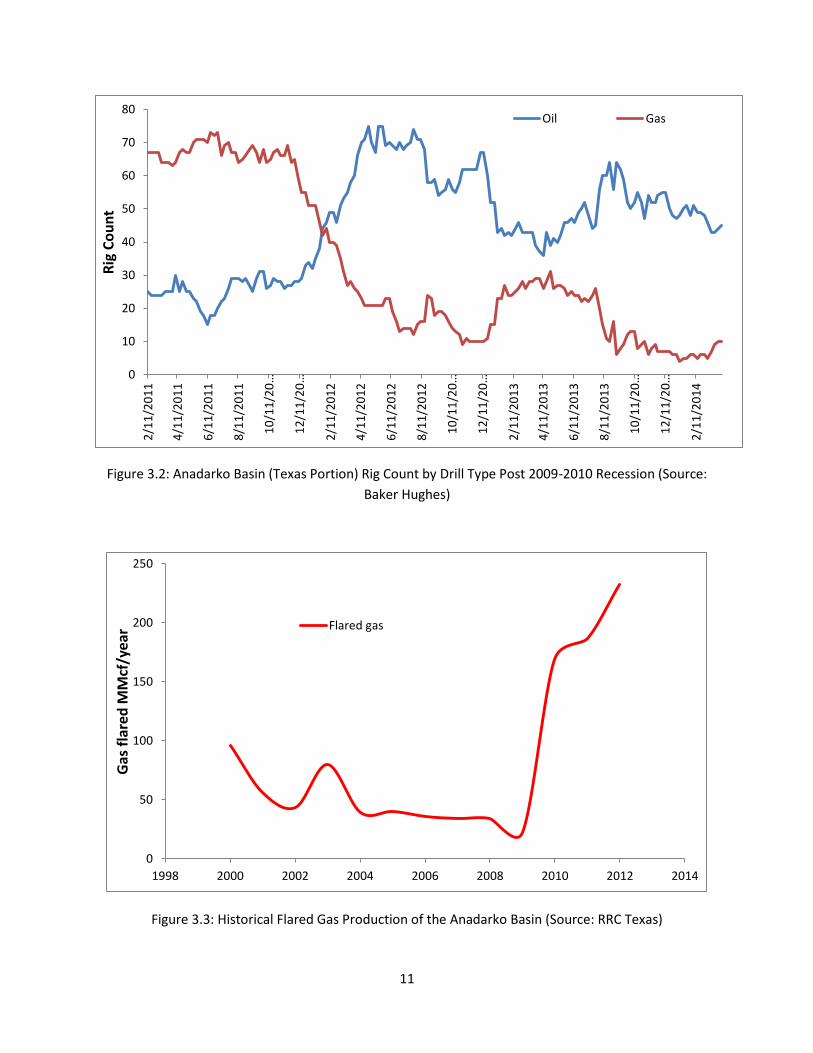
Bcf/d for gas. Figure 3.2 shows an increasing oil rig count as operators focused capital expenditure on
liquid rich assets due to falling gas prices post 2008 recession. There was no data for oil takeaways from
the survey results received. We presume that the current mode of oil transportation is via rail.
However, in the third quarter of 2013, Sunoco Logistics completed a successful “open season” for a new
proposed pipeline; Granite Wash Extension Pipeline. An open season is a process by which project
sponsors propose a package of key terms and design parameters for a potential pipeline project to
prospective customers and solicit bids for contracting capacity on that project. The pipeline is expected
to move 70Mb/d of crude from the Granite Wash play in the northeastern Texas Panhandle and
portions of western Oklahoma. It will originate from Wheeler County, Texas and terminate at Sunoco’s
0
20
40
60
80
100
120
140
160
180
200
01
/07
/00
08
/07
/00
03
/07
/01
10
/07
/01
05
/07
/02
12
/07
/02
07
/07
/03
02
/07
/04
09
/07
/04
04
/07
/05
11
/07
/05
06
/07
/06
01
/07
/07
08
/07
/07
03
/07
/08
10
/07
/08
05
/07
/09
12
/07
/09
07
/07
/10
02
/07
/11
09
/07
/11
04
/07
/12
11
/07
/12
06
/07
/13
01
/07
/14
Rig
Co
un
t
U.S. Offshore Total GoM Gas GoM Oil GOM
10
station in Ringgold, Texas. The pipeline is expected to be operational in the third quarter of 2014. Table
3.1 describes current production versus the takeaway capacity from the region.
Table 3.1: Current Production vs. Pipeline Takeaway Capacities
More pipeline takeaway capacity may be needed to handle the amount of gas vented which has
increased exponentially in the period after the 2008 recession, as shown in Figure 3.3. As of March
2012, estimated cumulative production of oil and gas has reached 5.4 billion barrels of oil and 125 Tcf
(Trillion cubic feet of gas). These have been forecasted to grow, as shown in Figures 3.4 through 3.6,
with increased drilling activity and stable oil and gas prices at/ or above $100/bbl and $8/MMBtu
respectively.
Figure 3.1: Descriptive Map of the Anadarko Basin (Source: Range Resources)
Current Production Takeaway Capacity
Oil 110 Mb/d Not available
Gas 2.1 Bcf/d 2.5 Bcf/d
11
Figure 3.2: Anadarko Basin (Texas Portion) Rig Count by Drill Type Post 2009-2010 Recession (Source:
Baker Hughes)
Figure 3.3: Historical Flared Gas Production of the Anadarko Basin (Source: RRC Texas)
0
10
20
30
40
50
60
70
80
2/1
1/2
01
1
4/1
1/2
01
1
6/1
1/2
01
1
8/1
1/2
01
1
10
/11
/20
…
12
/11
/20
…
2/1
1/2
01
2
4/1
1/2
01
2
6/1
1/2
01
2
8/1
1/2
01
2
10
/11
/20
…
12
/11
/20
…
2/1
1/2
01
3
4/1
1/2
01
3
6/1
1/2
01
3
8/1
1/2
01
3
10
/11
/20
…
12
/11
/20
…
2/1
1/2
01
4
Rig
Co
un
t Oil Gas
0
50
100
150
200
250
1998 2000 2002 2004 2006 2008 2010 2012 2014
Gas
fla
red
MM
cf/y
ear Flared gas

12
Figure 3.4: Anadarko Total Rig Count Forecast
Figure 3.5: Anadarko Oil Production Forecast
0
20
40
60
80
100
120D
ec-
05
De
c-0
6
De
c-0
7
De
c-0
8
De
c-0
9
De
c-1
0
De
c-1
1
De
c-1
2
De
c-1
3
De
c-1
4
De
c-1
5
De
c-1
6
De
c-1
7
De
c-1
8
De
c-1
9
De
c-2
0
De
c-2
1
De
c-2
2
De
c-2
3
De
c-2
4
De
c-2
5
Rig
Co
un
t
History High Moderate
0
5
10
15
20
25
30
35
40
19
98
19
99
20
00
20
01
20
02
20
03
20
04
20
05
20
06
20
07
20
08
20
09
20
10
20
11
20
12
20
13
20
14
20
15
20
16
20
17
20
18
20
19
20
20
20
21
20
22
20
23
20
24
20
25
20
26
Oil
Prp
du
ctio
n M
Bb
l/Ye
ar
History High Scenario Moderate Scenario Low Scenario
13
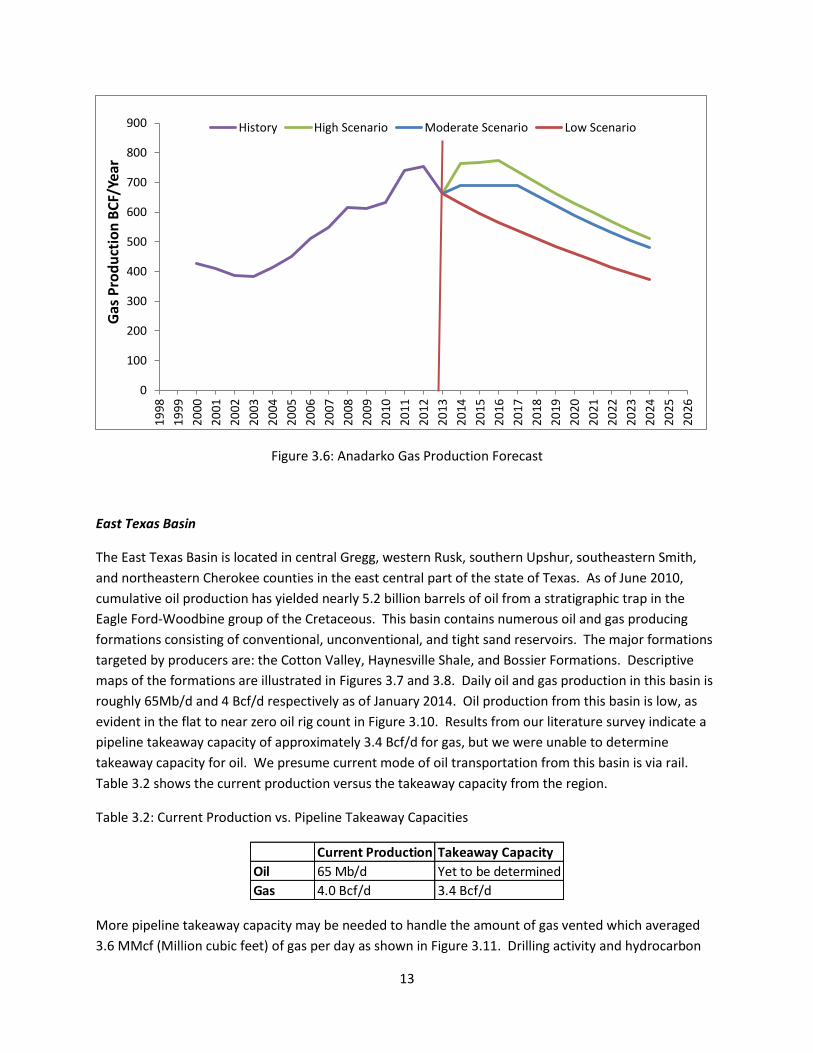
Figure 3.6: Anadarko Gas Production Forecast
East Texas Basin
The East Texas Basin is located in central Gregg, western Rusk, southern Upshur, southeastern Smith,
and northeastern Cherokee counties in the east central part of the state of Texas. As of June 2010,
cumulative oil production has yielded nearly 5.2 billion barrels of oil from a stratigraphic trap in the
Eagle Ford-Woodbine group of the Cretaceous. This basin contains numerous oil and gas producing
formations consisting of conventional, unconventional, and tight sand reservoirs. The major formations
targeted by producers are: the Cotton Valley, Haynesville Shale, and Bossier Formations. Descriptive
maps of the formations are illustrated in Figures 3.7 and 3.8. Daily oil and gas production in this basin is
roughly 65Mb/d and 4 Bcf/d respectively as of January 2014. Oil production from this basin is low, as
evident in the flat to near zero oil rig count in Figure 3.10. Results from our literature survey indicate a
pipeline takeaway capacity of approximately 3.4 Bcf/d for gas, but we were unable to determine
takeaway capacity for oil. We presume current mode of oil transportation from this basin is via rail.
Table 3.2 shows the current production versus the takeaway capacity from the region.
Table 3.2: Current Production vs. Pipeline Takeaway Capacities
More pipeline takeaway capacity may be needed to handle the amount of gas vented which averaged
3.6 MMcf (Million cubic feet) of gas per day as shown in Figure 3.11. Drilling activity and hydrocarbon
0
100
200
300
400
500
600
700
800
900
19
98
19
99
20
00
20
01
20
02
20
03
20
04
20
05
20
06
20
07
20
08
20
09
20
10
20
11
20
12
20
13
20
14
20
15
20
16
20
17
20
18
20
19
20
20
20
21
20
22
20
23
20
24
20
25
20
26
Gas
Pro
du
ctio
n B
CF/
Year
History High Scenario Moderate Scenario Low Scenario
Current Production Takeaway Capacity
Oil 65 Mb/d Yet to be determined
Gas 4.0 Bcf/d 3.4 Bcf/d
14
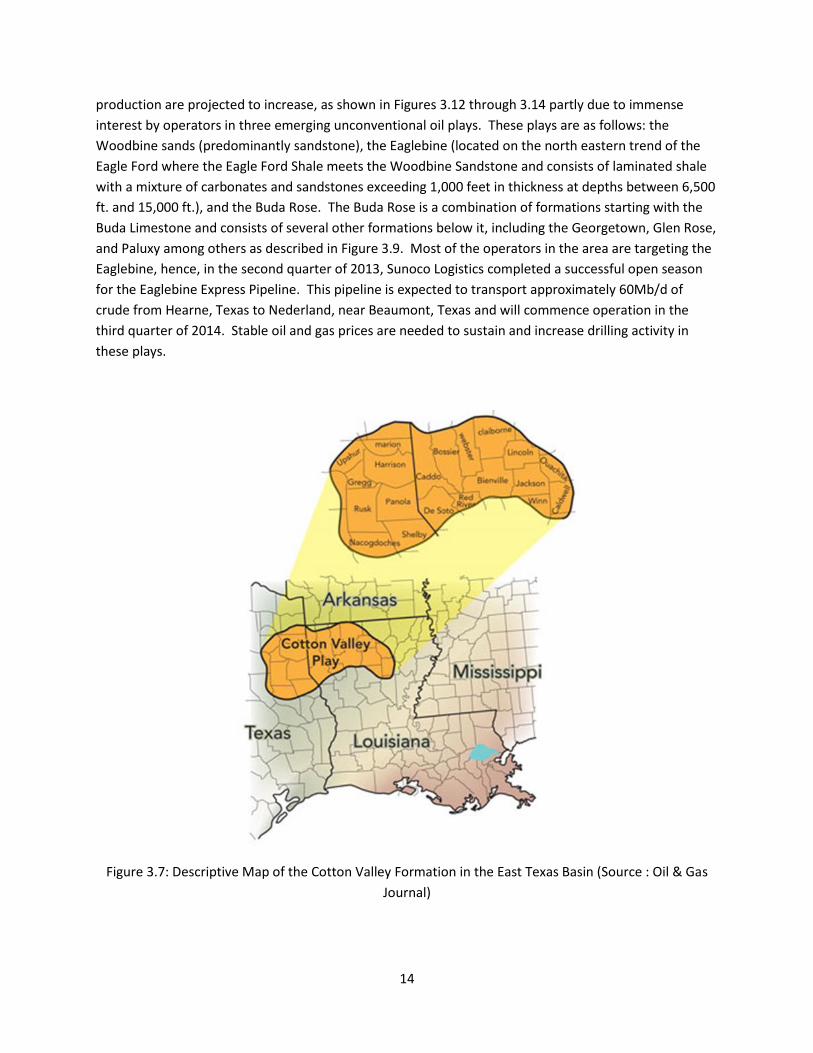
production are projected to increase, as shown in Figures 3.12 through 3.14 partly due to immense
interest by operators in three emerging unconventional oil plays. These plays are as follows: the
Woodbine sands (predominantly sandstone), the Eaglebine (located on the north eastern trend of the
Eagle Ford where the Eagle Ford Shale meets the Woodbine Sandstone and consists of laminated shale
with a mixture of carbonates and sandstones exceeding 1,000 feet in thickness at depths between 6,500
ft. and 15,000 ft.), and the Buda Rose. The Buda Rose is a combination of formations starting with the
Buda Limestone and consists of several other formations below it, including the Georgetown, Glen Rose,
and Paluxy among others as described in Figure 3.9. Most of the operators in the area are targeting the
Eaglebine, hence, in the second quarter of 2013, Sunoco Logistics completed a successful open season
for the Eaglebine Express Pipeline. This pipeline is expected to transport approximately 60Mb/d of
crude from Hearne, Texas to Nederland, near Beaumont, Texas and will commence operation in the
third quarter of 2014. Stable oil and gas prices are needed to sustain and increase drilling activity in
these plays.
Figure 3.7: Descriptive Map of the Cotton Valley Formation in the East Texas Basin (Source : Oil & Gas
Journal)
15
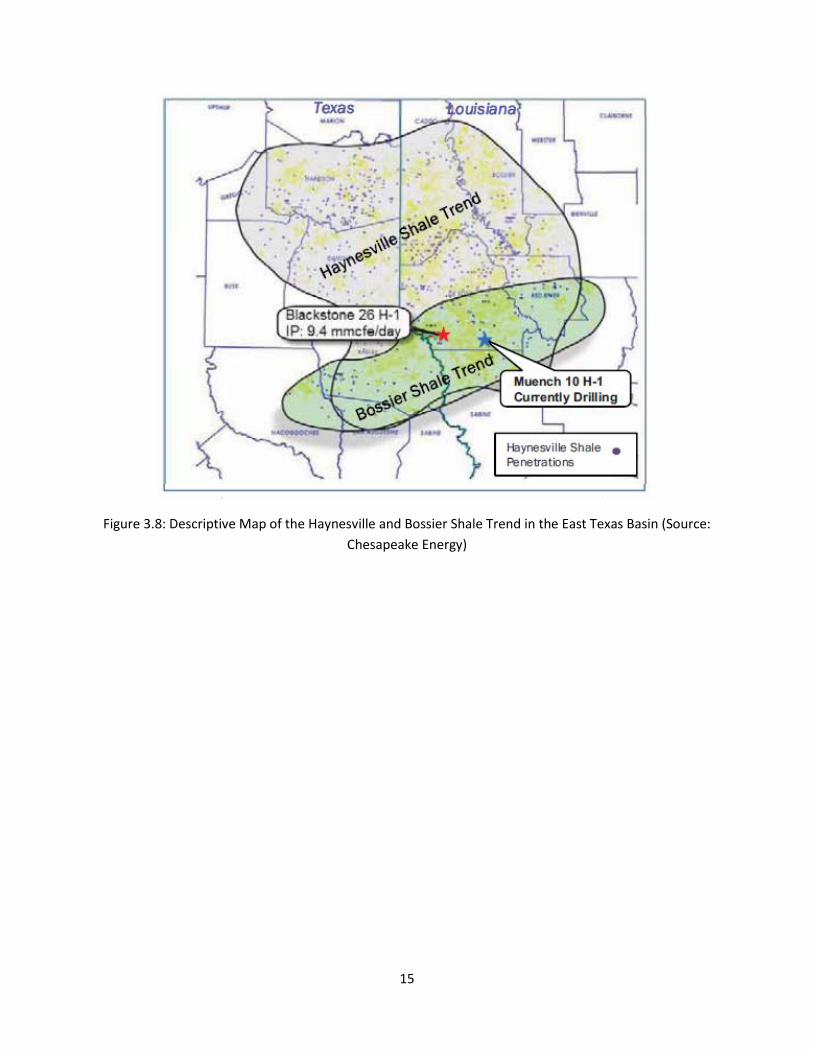
Figure 3.8: Descriptive Map of the Haynesville and Bossier Shale Trend in the East Texas Basin (Source:
Chesapeake Energy)

16
Figure 3.9: Stratigraphic Map of Target Plays in the East Texas Basin (Source: Forestar group)
Figure 3.10: East Texas Basin Rig Count 2011-present (Source: Baker Hughes)
0
20
40
60
80
100
120
140
160
180
2/1
1/2
01
1
4/1
1/2
01
1
6/1
1/2
01
1
8/1
1/2
01
1
10
/11
/20
11
12
/11
/20
11
2/1
1/2
01
2
4/1
1/2
01
2
6/1
1/2
01
2
8/1
1/2
01
2
10
/11
/20
12
12
/11
/20
12
2/1
1/2
01
3
4/1
1/2
01
3
6/1
1/2
01
3
8/1
1/2
01
3
10
/11
/20
13
12
/11
/20
13
2/1
1/2
01
4
Rig
Co
un
t
Oil Gas

17
Figure 3.11: Historical Flared Gas Production in the East Texas Basin (Source: Railroad Commission)
Figure 3.12: East Texas Basin Rig Count Forecast
0
500
1,000
1,500
2,000
2,500
3,000
3,500
4,000
1998 2000 2002 2004 2006 2008 2010 2012 2014
Gas
fla
red
, Mcf
/d
Time (Years)
Gas flared
0
20
40
60
80
100
120
140
De
c-0
5
De
c-0
6
De
c-0
7
De
c-0
8
De
c-0
9
De
c-1
0
De
c-1
1
De
c-1
2
De
c-1
3
De
c-1
4
De
c-1
5
De
c-1
6
De
c-1
7
De
c-1
8
De
c-1
9
De
c-2
0
De
c-2
1
De
c-2
2
De
c-2
3
De
c-2
4
De
c-2
5
Rig
Co
un
t
History High Moderate

18
Figure 3.13: East Texas Basin Oil Production Forecast
Figure 3.14: East Texas Basin Oil Production Forecast
0
5
10
15
20
25
30
35
40
19
98
19
99
20
00
20
01
20
02
20
03
20
04
20
05
20
06
20
07
20
08
20
09
20
10
20
11
20
12
20
13
20
14
20
15
20
16
20
17
20
18
20
19
20
20
20
21
20
22
20
23
20
24
20
25
20
26
Oil
Pro
du
ctio
n M
MB
bl/
Year
History High Scenario Moderate Scenario Low Scenario
0
200
400
600
800
1000
1200
1400
1600
1800
2000
19
98
19
99
20
00
20
01
20
02
20
03
20
04
20
05
20
06
20
07
20
08
20
09
20
10
20
11
20
12
20
13
20
14
20
15
20
16
20
17
20
18
20
19
20
20
20
21
20
22
20
23
20
24
20
25
20
26
Gas
Pro
du
ctio
n B
CF/
Year
History High Scenario Moderate Scenario Low Scenario

19
Fort Worth Basin
The Fort Worth Basin is a shallow, north-south elongated trough encompassing roughly 15,000 square
miles in north central Texas. It is one of several foreland basins associated with the late Paleozoic
Ouachita Orogeny, which is a major event of thrust-fold deformation resulting from collisional tectonics
during the formation of Pangea. There are other basins in this trend which include: the Black Warrior,
Arkoma, Kerr, Val Verde and Marfa Basins. The Mississippian Barnett Shale serves as source, seal, and
reservoir to a world class unconventional natural gas accumulation in the basin, and is currently the
largest onshore natural gas field in Texas. The most actively drilled area is the Newark East Field. These
are illustrated in Figures 3.15 and 3.16.
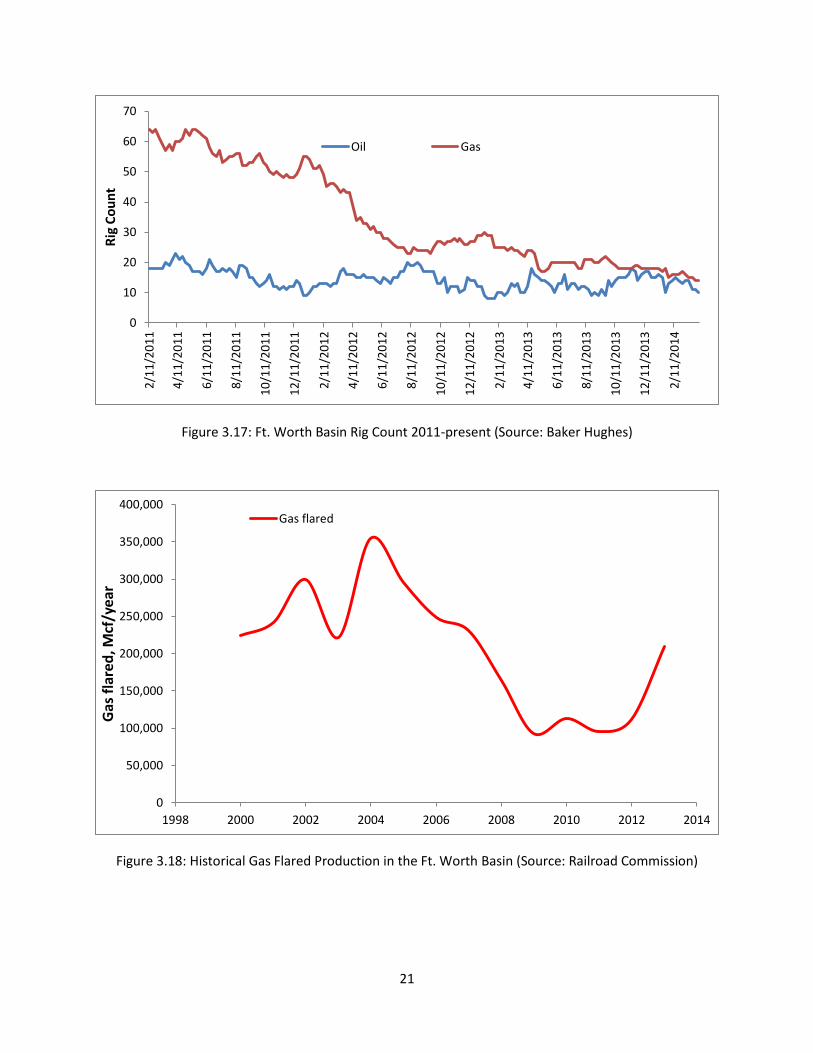
At the end of 2010, cumulative gas production reached 9 Tcf. The Fort Worth Basin is predominantly a
gas producing basin with some condensate production. As can be seen in Figure 3.17, this region has
not experienced increased drilling in the years following the recession. Current daily gas production is
roughly 5.3 Bcf/d, and average daily oil production is about 65Mb/d. Survey results received indicate
takeaway capacity for oil at 24Mb/d and about 5.8 Bcf/d for gas. This is shown in Table 3.3. Some of
the produced gas has been flared as shown in Figure 3.18.
Table 3.3: Current Production vs. Pipeline Takeaway Capacities
Most of the forecast shown in Figures 3.19 through 3.21 are quite pessimistic due to declining drilling
activity, dictated by falling gas prices in the period since the 2008 recession. This basin would likely
experience increased drilling activity and development with increased and stable gas prices at/above
$8/MMBtu, which would necessitate more pipeline construction.
Current Production Takeaway Capacity
Oil 65Mb/d 24Mb/d
Gas 5.3 Bcf/d 5.8 Bcf/d

20
Figure 3.15: Descriptive Structure Map of the Barnett Shale in the Ft. Worth Basin (Source: Fishpetco,
2007)
Figure 3.16: Descriptive Cross-section of the Barnett Shale in the Ft. Worth Basin (Source: Grieser et al.,
2005)
21
Figure 3.17: Ft. Worth Basin Rig Count 2011-present (Source: Baker Hughes)
Figure 3.18: Historical Gas Flared Production in the Ft. Worth Basin (Source: Railroad Commission)
0
10
20
30
40
50
60
70
2/1
1/2
01
1
4/1
1/2
01
1
6/1
1/2
01
1
8/1
1/2
01
1
10
/11
/20
11
12
/11
/20
11
2/1
1/2
01
2
4/1
1/2
01
2
6/1
1/2
01
2
8/1
1/2
01
2
10
/11
/20
12
12
/11
/20
12
2/1
1/2
01
3
4/1
1/2
01
3
6/1
1/2
01
3
8/1
1/2
01
3
10
/11
/20
13
12
/11
/20
13
2/1
1/2
01
4
Rig
Co
un
t
Oil Gas
0
50,000
100,000
150,000
200,000
250,000
300,000
350,000
400,000
1998 2000 2002 2004 2006 2008 2010 2012 2014
Gas
fla
red
, Mcf
/yea
r
Gas flared

22
Figure 3.19: Ft. Worth Basin Rig Count Forecast
Figure 3.20: Historical Oil Production Forecast in the Ft. Worth Basin
0
20
40
60
80
100
De
c-0
4
De
c-0
5
De
c-0
6
De
c-0
7
De
c-0
8
De
c-0
9
De
c-1
0
De
c-1
1
De
c-1
2
De
c-1
3
De
c-1
4
De
c-1
5
De
c-1
6
De
c-1
7
De
c-1
8
De
c-1
9
No
v-2
0
No
v-2
1
No
v-2
2
No
v-2
3
No
v-2
4
No
v-2
5
Rig
Co
un
t
History High Moderate
0
5
10
15
20
25
30
19
98
19
99
20
00
20
01
20
02
20
03
20
04
20
05
20
06
20
07
20
08
20
09
20
10
20
11
20
12
20
13
20
14
20
15
20
16
20
17
20
18
20
19
20
20
20
21
20
22
20
23
20
24
20
25
20
26
Oil
Pro
du
ctio
n M
MB
bl/
year
History High Scenario Moderate Scenario Low Scenario

23
Figure 3.21: Historical Gas Production Forecast in the Ft. Worth Basin
Texas Gulf Coast Basin
The Gulf Coast region can be described as a physiographic province extending from Texas to Florida and
encompassing the coastal plain, low hills and deltas of the Gulf of Mexico. The sediments consist of
coastal plain deposits and thick land-derived sediments prograding from the Mississippi River Delta
system, which ultimately transitions to evaporite and carbonate deposits offshore. The main formation
targeted by operators is the Eagle Ford. This is a sedimentary shale rock formation stretching 400 miles
from just northwest of Houston to an area south of San Antonio and all the way into Mexico, as shown
in Figure 3.22.
Due to falling gas prices, the liquid rich window of the Eagle Ford has seen increased drilling activity and
development, with more oil drilling rigs running than gas. This rig count disparity is illustrated in Figure
3.23. As of December 2013, crude oil production was about 1.2MMb/d (Million barrels per day) from
the Eagle Ford. Production is expected to exceed 1.5MMb/d by 2015. Several pipeline infrastructures
have been constructed and include the following:
Kinder Morgan Crude/Condensate (KMCC) Pipeline - with a capacity of 300Mb/d, transports
crude oil and condensates from the Eagle Ford Formation to Galena Park, Texas on the Houston
Ship Channel
0
500
1000
1500
2000
25001
99
8
19
99
20
00
20
01
20
02
20
03
20
04
20
05
20
06
20
07
20
08
20
09
20
10
20
11
20
12
20
13
20
14
20
15
20
16
20
17
20
18
20
19
20
20
20
21
20
22
20
23
20
24
20
25
20
26
Gas
Pro
du
ctio
n B
cf/y
ear
History High Scenario Moderate Scenario Low Scenario
24
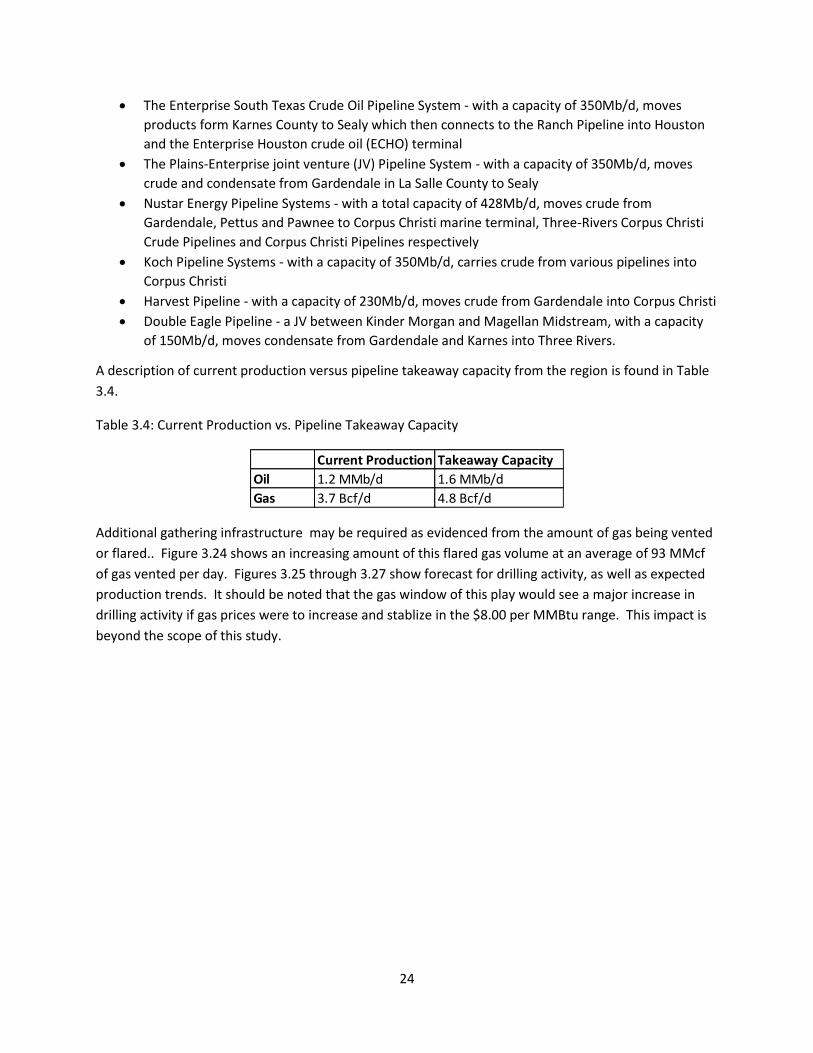
The Enterprise South Texas Crude Oil Pipeline System - with a capacity of 350Mb/d, moves
products form Karnes County to Sealy which then connects to the Ranch Pipeline into Houston
and the Enterprise Houston crude oil (ECHO) terminal
The Plains-Enterprise joint venture (JV) Pipeline System - with a capacity of 350Mb/d, moves
crude and condensate from Gardendale in La Salle County to Sealy
Nustar Energy Pipeline Systems - with a total capacity of 428Mb/d, moves crude from
Gardendale, Pettus and Pawnee to Corpus Christi marine terminal, Three-Rivers Corpus Christi
Crude Pipelines and Corpus Christi Pipelines respectively
Koch Pipeline Systems - with a capacity of 350Mb/d, carries crude from various pipelines into
Corpus Christi
Harvest Pipeline - with a capacity of 230Mb/d, moves crude from Gardendale into Corpus Christi
Double Eagle Pipeline - a JV between Kinder Morgan and Magellan Midstream, with a capacity
of 150Mb/d, moves condensate from Gardendale and Karnes into Three Rivers.
A description of current production versus pipeline takeaway capacity from the region is found in Table
3.4.
Table 3.4: Current Production vs. Pipeline Takeaway Capacity
Additional gathering infrastructure may be required as evidenced from the amount of gas being vented
or flared.. Figure 3.24 shows an increasing amount of this flared gas volume at an average of 93 MMcf
of gas vented per day. Figures 3.25 through 3.27 show forecast for drilling activity, as well as expected
production trends. It should be noted that the gas window of this play would see a major increase in
drilling activity if gas prices were to increase and stablize in the $8.00 per MMBtu range. This impact is
beyond the scope of this study.
Current Production Takeaway Capacity
Oil 1.2 MMb/d 1.6 MMb/d
Gas 3.7 Bcf/d 4.8 Bcf/d

25
Figure 3.22: Descriptive Map of the Eagle Ford Shale, showing areas prospective for oil, dry gas and wet
gas/condensate (Source: Energy Information Administration)
Figure 3.23: Texas Gulf Coast Rig Count (Source: Baker Hughes)
0
50
100
150
200
250
2/1
1/2
01
1
4/1
1/2
01
1
6/1
1/2
01
1
8/1
1/2
01
1
10
/11
/20
11
12
/11
/20
11
2/1
1/2
01
2
4/1
1/2
01
2
6/1
1/2
01
2
8/1
1/2
01
2
10
/11
/20
12
12
/11
/20
12
2/1
1/2
01
3
4/1
1/2
01
3
6/1
1/2
01
3
8/1
1/2
01
3
10
/11
/20
13
12
/11
/20
13
2/1
1/2
01
4
Rig
Co
un
t
Oil Gas

26
Figure 3.24: Historical Flared Gas Production in the Texas Gulf Basin (Source: Texas RRC)
Figure 3.25: Texas Gulf Coast Basin Rig Count Forecast
0
10,000
20,000
30,000
40,000
50,000
60,000
70,000
80,000
90,000
100,000
1998 2000 2002 2004 2006 2008 2010 2012 2014
Gas
fla
red
, Mcf
/d
Time (Years)
Gas flared
0
20
40
60
80
100
120
140
160
180
200
220
240
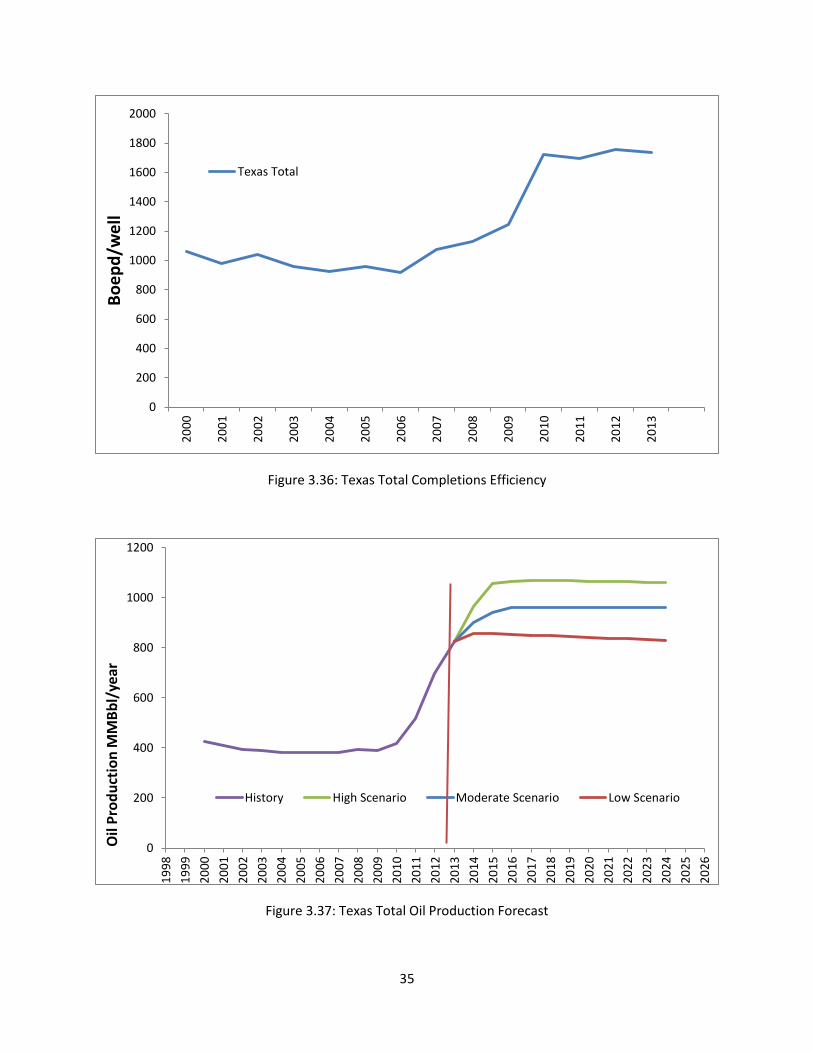
260
De
c-0
5
De
c-0
6
De
c-0
7
De
c-0
8
De
c-0
9
De
c-1
0
De
c-1
1
De
c-1
2
De
c-1
3
De
c-1
4
De
c-1
5
De
c-1
6
De
c-1
7
De
c-1
8
De
c-1
9
De
c-2
0
De
c-2
1
De
c-2
2
De
c-2
3
Rig
Co
un
t
History High Moderate

27
Figure 3.26: Texas Gulf Coast Basin Oil Production Forecast
Figure 3.27: Texas Gulf Coast Basin Gas Production Forecast
0
100
200
300
400
500
600
700
19
98
19
99
20
00
20
01
20
02
20
03
20
04
20
05
20
06
20
07
20
08
20
09
20
10
20
11
20
12
20
13
20
14
20
15
20
16
20
17
20
18
20
19
20
20
20
21
20
22
20
23
20
24
20
25
20
26
Oil
Pro
du
ctio
n M
MB
bl/
year
History High Scenario Moderate Scenario Low Scenario
0
500
1000
1500
2000
2500
3000
3500
19
98
19
99
20
00
20
01
20
02
20
03
20
04
20
05
20
06
20
07
20
08
20
09
20
10
20
11
20
12
20
13
20
14
20
15
20
16
20
17
20
18
20
19
20
20
20
21
20
22
20
23
20
24
20
25
20
26
Gas
Pro
du
ctio
n B
CF/
Ye
ar
History High Scenario Moderate Scenario Low Scenario

28
Permian Basin
The Permian Basin is an oil and gas producing area located in West Texas and the adjoining area of
southeastern New Mexico. It covers an area approximately 250 miles wide and 300 miles long. The
various producing formations include the following: the Yates, San Andres, Clear Fork, Spraberry,
Wolfcamp, Yeso, Bone Spring, Avalon, Canyon, Morrow, Devonian and Ellenburger. As of April 2014, it
has produced over 29 Billion barrels of oil and 75 Tcf of gas. The basin currently produces about 1.58
MMb/d of oil and 3.3 Bcf/d of gas. Figure 3.28 describes the three component parts making up the
Permian: the Delaware Basin, Central Basin Platform, and the Midland Basin.
Figure 3.28: Descriptive Map of the Permian Basin (Source: Drillinginfo)
The current crude oil pipeline takeaway capacity from the Permian Basin is about 1.19 MMb/d and
comprises of the following pipelines in Table 3.5.
29
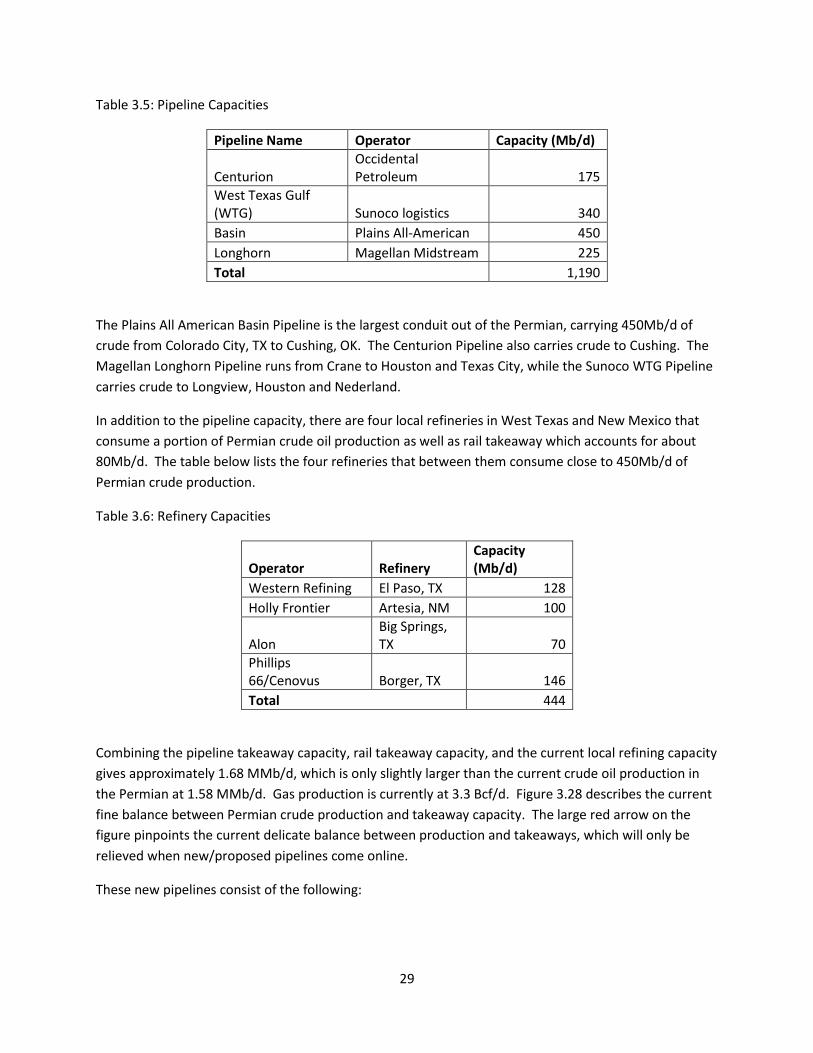
Table 3.5: Pipeline Capacities
Pipeline Name Operator Capacity (Mb/d)
Centurion Occidental Petroleum 175
West Texas Gulf (WTG) Sunoco logistics 340
Basin Plains All-American 450
Longhorn Magellan Midstream 225
Total 1,190
The Plains All American Basin Pipeline is the largest conduit out of the Permian, carrying 450Mb/d of
crude from Colorado City, TX to Cushing, OK. The Centurion Pipeline also carries crude to Cushing. The
Magellan Longhorn Pipeline runs from Crane to Houston and Texas City, while the Sunoco WTG Pipeline
carries crude to Longview, Houston and Nederland.
In addition to the pipeline capacity, there are four local refineries in West Texas and New Mexico that
consume a portion of Permian crude oil production as well as rail takeaway which accounts for about
80Mb/d. The table below lists the four refineries that between them consume close to 450Mb/d of
Permian crude production.
Table 3.6: Refinery Capacities
Operator Refinery Capacity (Mb/d)
Western Refining El Paso, TX 128
Holly Frontier Artesia, NM 100
Alon Big Springs, TX 70
Phillips 66/Cenovus Borger, TX 146
Total 444
Combining the pipeline takeaway capacity, rail takeaway capacity, and the current local refining capacity
gives approximately 1.68 MMb/d, which is only slightly larger than the current crude oil production in
the Permian at 1.58 MMb/d. Gas production is currently at 3.3 Bcf/d. Figure 3.28 describes the current
fine balance between Permian crude production and takeaway capacity. The large red arrow on the
figure pinpoints the current delicate balance between production and takeaways, which will only be
relieved when new/proposed pipelines come online.
These new pipelines consist of the following:

30
Bridge Tex Pipeline, a JV between Occidental Petroleum and Magellan Midstream, is expected to
come online sometime in the middle of 2014 with a capacity of 300Mb/d of crude from
Colorado City to Houston
Sunoco Logistics’ Permian Express II Pipeline is expected to come online mid-2015, with a
capacity of 200Mb/d of crude also from Colorado City to Nederland
The current Longhorn Pipeline operated by Magellan, is expected to expand to 275Mb/d from
its current 225Mb/d.
Figure 3.28: Permian Crude Takeaway Capacity (Source: RBN Energy)
Table 3.7 describes the current production versus the takeaway capacity from the region for both oil and
gas. The takeaway capacity for oil was obtained from literature surveys while gas takeaways were based
on the survey results from the TPA.
Table 3.7: Production vs Takeaway Capacities
More pipeline takeaway capacity will be needed to handle the flared gas in this basin. Figure 3.29
describes the average amount of gas vented per day since year 2000. In 2013, an average of 62 MMcf/d
Current Production Takeaway Capacity
Oil 1.58 MMb/d 1.68 MMb/d
Gas 3.3 Bcf/d 2.8 Bcf/d

31
was vented. Figures 3.30 through 3.32 show drilling and production forecasts up to 2024. Note that the
lack of a significant increase in rigs in the Permian may result from a decline in vertical well drilling which
is being offset by relatively more horizontal drilling. It is expected, however, that a significant increase
in the number of rigs will occur in the near future.
Figure 3.29: Historical Flared Gas in the Texas Portion of the Permian Basin (Source: Texas RRC)
Figure 3.30: Texas Portion of the Permian Basin Rig Count Forecast
0
10,000
20,000
30,000
40,000
50,000
60,000
70,000
1998 2000 2002 2004 2006 2008 2010 2012 2014
Gas
fla
red
, Mcf
/d
Time (Years)
Gas flared
0
100
200
300
400
500
600
History High Moderate

32
Figure 3.31: Texas Portion of the Permian Basin Oil Production Forecast
Figure 3.32: Texas Portion of the Permian Basin Gas Production Forecast
0
50
100
150
200
250
300
350
400
450
19
98
19
99
20
00
20
01
20
02
20
03
20
04
20
05
20
06
20
07
20
08
20
09
20
10
20
11
20
12
20
13
20
14
20
15
20
16
20
17
20
18
20
19
20
20
20
21
20
22
20
23
20
24
20
25
20
26
Oil
Pro
du
ctio
n M
MB
bl/
year
History High Scenario Moderate Scenario Low Scenario
0
200
400
600
800
1000
1200
1400
19
98
19
99
20
00
20
01
20
02
20
03
20
04
20
05
20
06
20
07
20
08
20
09
20
10
20
11
20
12
20
13
20
14
20
15
20
16
20
17
20
18
20
19
20
20
20
21
20
22
20
23
20
24
20
25
20
26
Gas
Pro
du
ctio
n B
cf/y
ear
History High Scenario Moderate Scenario Low Scenario

33
Texas Total
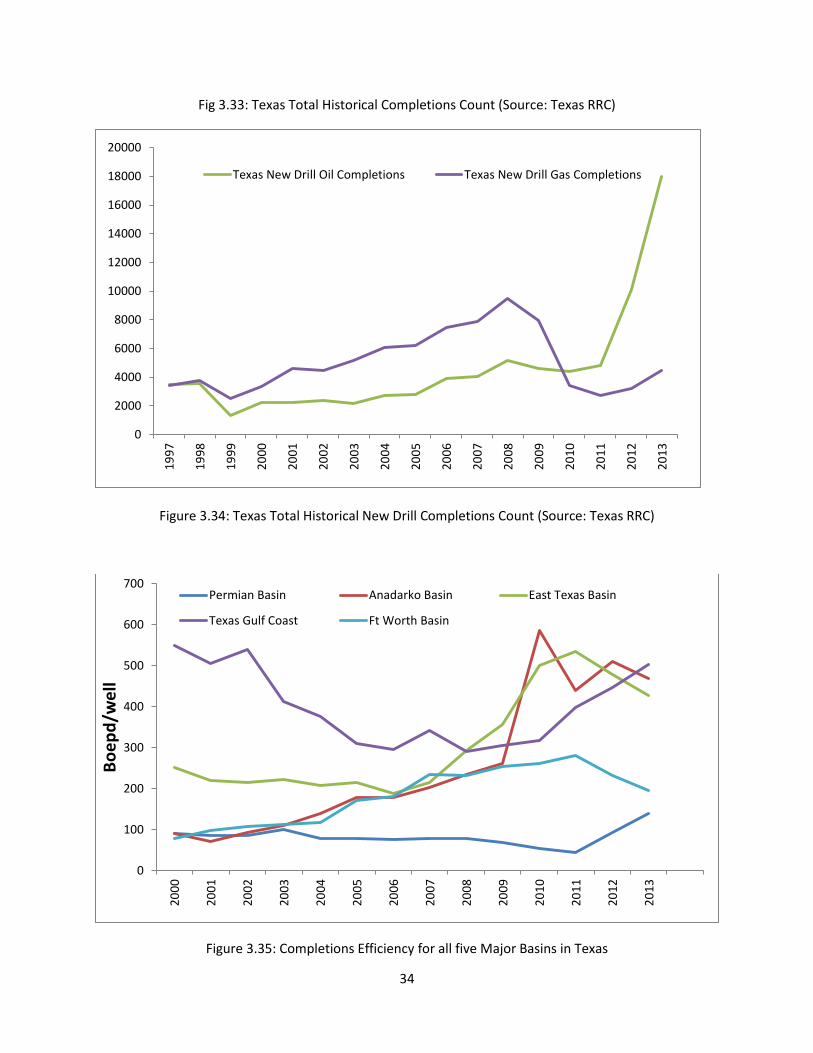
An increasing number of wells shown in Figures 3.33 and 3.34 were completed in Texas post 2008
recession, with almost 25,000 total completions in 2013 alone. Over 19,000 of these new completions
were oil wells. As seen in Figures 3.33 and 3.34, there was a dramatic drop in drilling activity or the
number of wells completed during the 2008 recession. However, oil well completions count quickly
recovered and surpassed pre-2008 levels by 2011. The reason for this is that after the 2008 recession,
natural gas prices never recovered while oil prices quickly recovered back to pre-2008 prices, and then
continued to increase. Oil and gas companies in Texas refocused capital budgets to oil (liquid) prone
basins. The two areas that benefited the most were the Permian Basin, and the Eagle Ford (Texas Gulf
Coast Basin). Thus, while other Texas gas shale plays such as the Barnett and the Haynesville saw a
sustained drop in rig count and drilling activity, the Permian Basin and the Eagle Ford more than
compensated for that drop.
Also, of the five basins discussed in this study, the Permian and Texas Gulf Coast Basins continue to see
increased horizontal drilling and sustained development. This has resulted in increased completion
efficiencies following the 2008 recession, represented as BOEPD (barrels of oil equivalent per day) for all
basins (see Figures 3.35 and 3.36). BOE is obtained by dividing the gas in Mcf by 6, and then adding that
value to the barrels of oil. The increased efficiencies are due to improved development in horizontal
drilling and hydraulic fracturing.
The Fort Worth (Barnett Shale) and East Texas (Haynesville Shale) Basins are gas prone and have not
experienced much growth in drilling activity. The northwest portion of the Eagle Ford is liquid prone, as
is the Permian Basin, thus will continue to see an expanding drilling program, as long as oil prices remain
at or above $80/bbl. Figures 3.37 and 3.38 show production forecasts through the year 2024.
0
5000
10000
15000
20000
25000
30000
19
97
19
98
19
99
20
00
20
01
20
02
20
03
20
04
20
05
20
06
20
07
20
08
20
09
20
10
20
11
20
12
20
13
Texas Total Completions Texas Oil Completions
34
Fig 3.33: Texas Total Historical Completions Count (Source: Texas RRC)
Figure 3.34: Texas Total Historical New Drill Completions Count (Source: Texas RRC)
Figure 3.35: Completions Efficiency for all five Major Basins in Texas
0
2000
4000
6000
8000
10000
12000
14000
16000
18000
20000
19
97
19
98
19
99
20
00
20
01
20
02
20
03
20
04
20
05
20
06
20
07
20
08
20
09
20
10
20
11
20
12
20
13
Texas New Drill Oil Completions Texas New Drill Gas Completions
0
100
200
300
400
500
600
700
20
00
20
01
20
02
20
03
20
04
20
05
20
06
20
07
20
08
20
09
20
10
20
11
20
12
20
13
Bo
ep
d/w
ell
Permian Basin Anadarko Basin East Texas Basin
Texas Gulf Coast Ft Worth Basin
35
Figure 3.36: Texas Total Completions Efficiency
Figure 3.37: Texas Total Oil Production Forecast
0
200
400
600
800
1000
1200
1400
1600
1800
2000
20
00
20
01
20
02
20
03
20
04
20
05
20
06
20
07
20
08
20
09
20
10
20
11
20
12
20
13
Bo
ep
d/w
ell
Texas Total
0
200
400
600
800
1000
1200
19
98
19
99
20
00
20
01
20
02
20
03
20
04
20
05
20
06
20
07
20
08
20
09
20
10
20
11
20
12
20
13
20
14
20
15
20
16
20
17
20
18
20
19
20
20
20
21
20
22
20
23
20
24
20
25
20
26
Oil
Pro
du
ctio
n M
MB
bl/
year
History High Scenario Moderate Scenario Low Scenario

36
Figure 3.38: Texas Total Gas Production Forecast
0
1000
2000
3000
4000
5000
6000
7000
8000
9000
10000
19
98
19
99
20
00
20
01
20
02
20
03
20
04
20
05
20
06
20
07
20
08
20
09
20
10
20
11
20
12
20
13
20
14
20
15
20
16
20
17
20
18
20
19
20
20
20
21
20
22
20
23
20
24
20
25
20
26
Gas
Pro
du
ctio
n B
cf/y
ear
History High Scenario Moderate Scenario Low Scenario

37
Economic Impacts of Texas Oil and Gas Pipeline
The transportation of oil and gas in Texas entails a number of different specialized activities. These
activities generate significant economic benefits by creating and sustaining jobs, income, value added
and output. In addition, the industry provides important state and local government revenues that
benefit the citizens of the state.
A set of economic models, referred to as input-output (I-O) models by economists, was constructed to
measure the economic impact of the oil and gas pipeline industry on the Texas economy. The basis of
an economic impact model is the spending patterns of individuals and businesses in the region being
studied. In particular, expenditures by firms engaged in the ongoing operations and construction of oil
and gas pipeline on equipment and supplies occur within the state and elsewhere, while oil and gas
pipeline employees tend to spend the majority of their income more locally. Economists generally
categorize the economic impacts from these expenditures into two types of effects: direct and
secondary. Direct effects represent those expenditures within the region of the industry being studied.
Direct effects lead to secondary effects in the form of business-to-business transactions in the region
(e.g., to restore inventory) referred to as indirect effects and also to new income in the form of wages
and salaries, rent and interest payments, payments to proprietors and stockholders for investment, etc.
also known as induced effects. For purposes of this study, economic output (i.e., gross revenues) refers
to the value of all industrial production (i.e., mining, services, retail trade, manufacturing, etc.) in the
state, following the convention used by the U.S. Bureau of Labor Statistics (BLS) and Bureau of Economic
Analysis (BEA), jobs are defined as the average annual number of jobs in a sector, industry, or region,
while labor income consists of all forms of employment income, including employee compensation
(wages and benefits) and proprietor income, and value added indicates the addition to Gross State
Product.
The economic model identifies the “linkages” within the economy that exist between businesses (or
enterprises) and other businesses, and businesses (or enterprises) and final consumers. From the
economic model, a set of industrial sector “economic multipliers” unique to the state economy are
calculated. These multipliers are used to provide a comprehensive assessment of the economic impact
of the oil and gas pipeline industry. Specifically, the economic impact analysis provides information as
to the number of jobs created and sustained by the ongoing operation of the industry, the income
added to the state economy from the industry’s operations, which includes household income or
earnings, and the total output (in dollars) that industry contributes to the economy. Similarly, economic
impacts are generated from the construction of new pipeline and related infrastructure (i.e., plants,
meter stations, etc.); however, unlike ongoing operations, construction related impacts are shorter-
lived, typically assumed to last one year in an economic impact analysis. An interesting feature of the
Texas pipeline industry is that, given the current energy outlook, it is possible that major construction
projects will continue to arise throughout the foreseeable future, thus providing economic benefits over
a number of years.
For purposes of this report, the economic models were constructed for 2013, the last full year for which
all data are available, and for the year 2024, which represents a future reference point 10 years from

38
now. For the latter, we consider three different scenarios corresponding to various economic
environments.
To estimate the economic impact and contribution of the Texas oil and gas pipeline industry in 2013 we
follow the convention of first estimating industry sales and using “data internal to the model to identify
all backward linkages in the study area related to the subject.” (IMPLAN.com) Construction related
impacts are derived from estimates of construction expenditures for net new pipeline mileage utilizing
data from Oil and Gas Journal annual cost survey. Pipeline mileage data (historical, current and net
new) come from the Railroad Commission of Texas. The analysis was conducted using the IMPLAN
Version 3.0 software package. 2012 values were updated to reflect the information obtained and
estimated for 2013. The conversion to 2013 values was accomplished through a set of extrapolations
(economic time series analysis) and validated using the engineering-related data. For purposes of this
study, and following convention of economic impact research, the core sector was defined as pipeline
transportation or new non-residential construction (pipeline other than sewer and water) where, for the
latter, local purchase percentage is adjusted to reflect actual expenditure information obtained from the
Texas Pipeline Association.
In order to estimate the 2024 projected impacts of the Texas oil and gas pipeline industry it was
necessary to first compute the value of oil and gas produced and transported through the system.
Commodity price data for West Texas Intermediate crude oil ($/BBL) and natural gas (Henry Hub,
$/million Btu) are utilized for this purpose and obtained from the Energy Information Agency. Following
convention, we assume that typical (average) gas sold in Texas is 1,100 per SCF and the corresponding
equivalency conversion factor is thus 1.1 such that, for example, the 2013 annual price of $3.73/MMBtu
corresponds to $4.103 per MCF. Valuing oil is straightforward using the 2013 annual price of $97.98.
The value of oil and gas produced is utilized in estimating industry sales and entered into the economic
contribution impact model. For purposes of this analysis, we also follow the convention of holding
technology constant over the projection horizon, which typically has the effect of making the projections
quite conservative. Additionally, all future dollar figures are discounted to present value and production
changes (i.e., changes in the amounts of oil and gas transported in the system) are in real terms.
Further, future construction is assumed to remain in the same proportion (i.e., grows at the same rate)
relative to industry sales as historically observed.

39
Economic Impact: 2013
2013 Economic Impacts from Operations
The following table summarizes the 2013 operations-related impacts of the pipeline industry for the
state of Texas. There were 16,000 jobs in the Texas pipeline industry in 2013 and over $10.8 billion of
gross output value generated from ongoing operations. Total impacts (i.e., direct, indirect and induced)
from pipeline operations generated and/or sustained 111,000 jobs in Texas. Moreover, the operations-
related activities of the industry generated $24.5 billion in output, and contributed more than $14.3
billion in total gross state product, i.e., value added. The existence of the pipeline industry generates
substantial economic activity and economic benefits to Texas.
Impact Type Employment Labor Income Total Value Added Output
Direct Effect 16,175 $10,080,027,352 $6,040,407,712 $10,836,525,349
Indirect Effect 22,515 $1,431,902,421 $2,407,917,696 $4,295,192,430
Induced Effect 72,267 $3,252,601,002 $5,869,364,670 $9,372,805,965
Total Effect 110,956 $14,764,530,775 $14,317,690,078 $24,504,523,744
Note: Labor income, total value added and output are measured in current dollars ($).
Pipeline transportation operations-related activity impacts various sectors differently. The following
table illustrates the impacts for the top ten sectors in Texas, ranked by employment. The values clearly
illustrate the demand for workers in these sectors is quite high and varied. These sectors benefit greatly
from the presence of the oil and gas pipeline industry across Texas.
Description Employment Labor Income Value Added Output
Transport by pipeline 16,175 $10,080,027,352 $6,004,407,712 $10,836,525,349
Food services and drinking places 8,717 $193,617,996 $295,152,420 $505,373,981
Employment services 5,731 $179,315,284 $199,863,193 $234,024,897
Real estate establishments 3,996 $86,785,897 $395,811,006 $500,496,409
Maintenance and repair construction of
nonresidential structures 3,803 $241,772,590 $271,525,798 $560,552,259
Offices of physicians, dentists, and other health
practitioners 3,748 $328,789,672 $335,461,039 $479,315,144
Private hospitals 3,216 $252,262,209 $277,965,650 $455,136,587
40
Wholesale trade businesses 2,703 $247,083,145 $432,746,250 $630,022,320
Retail Stores - General merchandise 2,443 $70,874,412 $120,361,449 $147,869,284
Securities, commodity contracts, investments,
and related activities 2,356 $96,010,046 $83,891,516 $341,114,982
Note: Labor income, total value added and output are measured in current dollars ($).
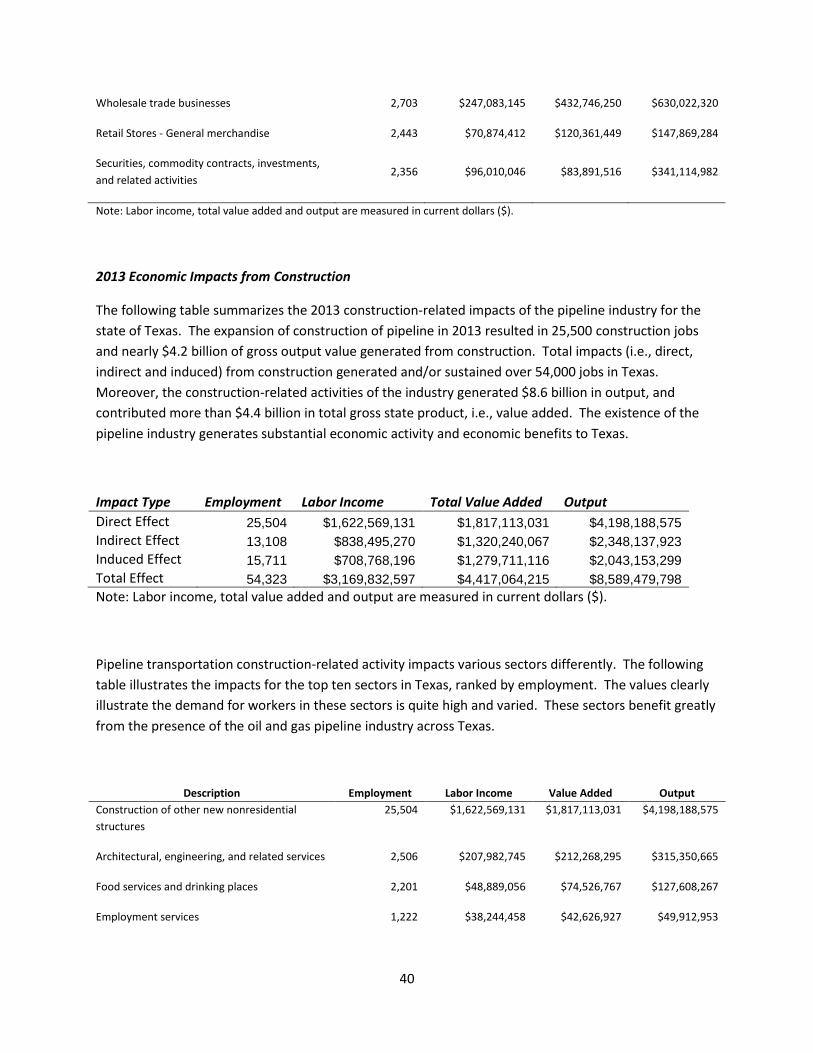
2013 Economic Impacts from Construction
The following table summarizes the 2013 construction-related impacts of the pipeline industry for the
state of Texas. The expansion of construction of pipeline in 2013 resulted in 25,500 construction jobs
and nearly $4.2 billion of gross output value generated from construction. Total impacts (i.e., direct,
indirect and induced) from construction generated and/or sustained over 54,000 jobs in Texas.
Moreover, the construction-related activities of the industry generated $8.6 billion in output, and
contributed more than $4.4 billion in total gross state product, i.e., value added. The existence of the
pipeline industry generates substantial economic activity and economic benefits to Texas.
Impact Type Employment Labor Income Total Value Added Output
Direct Effect 25,504 $1,622,569,131 $1,817,113,031 $4,198,188,575
Indirect Effect 13,108 $838,495,270 $1,320,240,067 $2,348,137,923
Induced Effect 15,711 $708,768,196 $1,279,711,116 $2,043,153,299
Total Effect 54,323 $3,169,832,597 $4,417,064,215 $8,589,479,798
Note: Labor income, total value added and output are measured in current dollars ($).
Pipeline transportation construction-related activity impacts various sectors differently. The following
table illustrates the impacts for the top ten sectors in Texas, ranked by employment. The values clearly
illustrate the demand for workers in these sectors is quite high and varied. These sectors benefit greatly
from the presence of the oil and gas pipeline industry across Texas.
Description Employment Labor Income Value Added Output
Construction of other new nonresidential
structures
25,504 $1,622,569,131 $1,817,113,031 $4,198,188,575
Architectural, engineering, and related services 2,506 $207,982,745 $212,268,295 $315,350,665
Food services and drinking places 2,201 $48,889,056 $74,526,767 $127,608,267
Employment services 1,222 $38,244,458 $42,626,927 $49,912,953

41
Wholesale trade businesses 1,092 $99,838,798 $174,859,622 $254,572,893
Real estate establishments 1,075 $23,341,091 $106,453,480 $134,608,648
Offices of physicians, dentists, and other health
practitioners 825 $72,364,024 $73,832,339 $105,493,498
Private hospitals 708 $55,520,725 $61,177,829 $100,171,616
Services to buildings and dwellings 677 $15,674,733 $20,006,092 $35,883,718
Securities, commodity contracts, investments,
and related activities 670 $27,294,819 $23,849,627 $96,976,017
Note: Labor income, total value added and output are measured in current dollars ($).
2013 Total Economic Impacts from Pipeline Operations and Construction Activities
The following table summarizes the 2013 operations- and construction-related impacts of the pipeline
industry for the state of Texas. The total pipeline impacts in 2013 resulted in 41,679 direct jobs and
$15.0 billion of gross output. Overall, the total impacts (i.e., direct, indirect and induced) from
operations and construction generated and/or sustained over 165,000 jobs in Texas. Moreover, the
pipeline-related activities generated $33.1 billion in output, and contributed more than $18.7 billion in
total gross state product, i.e., value added. The existence of the pipeline industry generates substantial
economic activity and economic benefits to Texas.
Impact Type Employment Labor Income Total Value Added Output
Direct Effect 41,679 $11,702,596,483 $7,857,520,743 $15,034,713,924
Indirect Effect 35,623 $2,270,397,691 $3,728,157,763 $6,643,330,353
Induced Effect 87,978 $3,961,369,198 $7,149,075,786 $11,415,959,265
Total Effect 165,280 $17,934,363,372 $18,734,754,292 $33,094,003,542
Note: Labor income, total value added and output are measured in current dollars ($).
The preceding discussion and tables highlighted the economic benefits created and sustained by the
ongoing operations and recent expansions (i.e., construction) associated with the Texas oil and gas
pipeline industry. When interpreting impact results it is important to recognize that leakages occur in
all economies in that not all monies spent are entirely contained within the study area. Generally
speaking, the larger the study area, the more able the model is to capture the spending and
consequently reduce leakages. Moreover, standard economic impact analysis follows the convention
used by the U.S. Bureau of Labor Statistics (BLS) and Bureau of Economic Analysis (BEA) in which jobs are
defined as the average annual number of jobs in a sector, industry, county or region over a period of
time such as a month or year. For example, a 40 hour per week job lasting is equivalent to two part-
time jobs.

42
The Texas pipeline industry also generates other economic benefits that are not measured in terms of
current jobs, income, value added and output. The IMPLAN economic impact model provides estimates
for taxes on production and imports, property, and various other taxes. In 2013, the operations and
construction activities of the Texas pipeline industry accounted for $1,632,713,679 in state and local
government revenues.
Economic Impacts: 2024
Future projections of 2024 economic impacts utilize the underlying engineering analysis for the three
different scenarios for hydrocarbon production and rig count. These scenarios represent a range of
economic environments and are defined as:
Scenario 1 (High Forecast Scenario): Anticipating stable oil prices in excess of $100/Bbl and
increasing gas prices resulting in continued or increased drilling activity
Scenario 2 (Moderate Forecast Scenario): Anticipating oil prices in the $70-$90 range with some
level of instability and gas prices in the current $4/MMBtu range.
Scenario 3 (Low Forecast Scenario): A collapse in oil & gas prices resulting in minimal activity.
Additionally, all future dollar figures are discounted to present value (i.e., reported in today’s dollars).
2024 Projected Economic Impacts from Operations and Construction
High Forecast Scenario
The following table summarizes the 2024 projected operations-related impacts of the pipeline industry
for the state of Texas in the High Forecast Scenario. The Texas pipeline industry will have nearly 20,000
direct jobs in 2024 and over $13.5 billion of gross output value will be generated from ongoing
operations. Total impacts from pipeline operations (i.e., direct, indirect and induced) will generate
and/or sustain over 138,000 jobs in Texas. Moreover, the operations-related activities of the industry
will generate $30.6 billion in output, and contribute $17.9 billion in total gross state product, i.e., value
added. The existence of the pipeline industry will generate substantial economic activity and economic
benefits to Texas.
Operations
Impact Type Employment Labor Income Total Value Added Output
Direct Effect 19,845 $12,593,517,132 $7,546,604,324 $13,538,650,528
Indirect Effect 28,129 $1,788,952,256 $3,008,340,325 $5,366,213,559
Induced Effect 90,287 $4,063,648,342 $7,332,911,107 $11,709,947,640
Total Effect 138,261 $18,446,117,731 $17,887,855,756 $30,614,811,727
Note: Labor income, total value added and output are in present value (i.e., in today’s dollars).

43
The following table summarizes the corresponding 2024 projected construction-related impacts of the
pipeline industry for the state of Texas. The expansion of construction of pipeline in 2024 will result in
nearly 32,000 construction direct jobs and $5.2 billion of gross output value will be generated from
construction. Total impacts from construction (i.e., direct, indirect and induced) will generate and/or
sustain over 67,000 jobs in Texas. Moreover, the construction-related activities of the industry will
generate over $10.7 billion in output, and contribute more than $5.5 billion in total gross state product,
i.e., value added. The existence of the pipeline industry generates substantial economic activity and
economic benefits to Texas.
Construction
Impact Type Employment Labor Income Total Value Added Output
Direct Effect 31,870 $2,027,586,176 $2,270,691,086 $5,246,117,997
Indirect Effect 16,380 $1,047,795,983 $1,649,791,344 $2,934,267,576
Induced Effect 19,633 $885,687,130 $1,599,145,774 $2,553,154,319
Total Effect 67,883 $3,961,069,288 $5,519,628,204 $10,733,539,892
Note: Labor income, total value added and output are in present value (i.e., in today’s dollars).
The following table summarizes the projected 2024 operations- and construction-related impacts of the
pipeline industry for the state of Texas. The total pipeline projected impacts in 2024 will result in over
51,700 direct jobs and $18.8 billion of gross output. Overall, total impacts from pipeline operations and
construction (i.e., direct, indirect and induced) will generate and/or sustain over 206,000 jobs in Texas.
Moreover, the pipeline-related activities will generate $41.3 billion in output, and contribute more than
$23.4 billion in total gross state product, i.e., value added. The existence of the pipeline industry will
generate substantial economic activity and economic benefits to Texas.
Total of Operations & Construction
Impact Type Employment Labor Income Total Value Added Output
Direct Effect 51,716 14,621,103,308 9,817,295,410 18,784,768,524
Indirect Effect 44,509 2,836,748,239 4,658,131,669 8,300,481,136
Induced Effect 109,920 4,949,335,472 8,932,056,880 14,263,101,959
Total Effect 206,145 22,407,187,019 23,407,483,960 41,348,351,619
Note: Labor income, total value added and output are in present value (i.e., in today’s dollars).
The Texas pipeline industry also generates other economic benefits that are not measured in terms of
current jobs, income, value added and output. The IMPLAN economic impact model provides estimates
for taxes on production and imports, property, and various other taxes. In 2024, the operations and
construction activities of the Texas pipeline industry will account for $2,039,549,916 (in today’s dollars)
in state and local government revenues.

44
Moderate Forecast Scenario
The following table summarizes the 2024 projected operations-related impacts of the pipeline industry
for the state of Texas in the Moderate Forecast Scenario. The Texas pipeline industry will have 17,000
direct jobs in 2024 and almost $11.7 billion of gross output value will be generated from ongoing
operations. Total impacts from operations (i.e., direct, indirect and induced) will generate and/or
sustain over 119,000 jobs in Texas. Moreover, the operations-related activities of the industry will
generate $26.4 billion in output, and contribute $15.4 billion in total gross state product, i.e., value
added. The existence of the pipeline industry will generate substantial economic activity and economic
benefits to Texas.
Operations
Impact Type Employment Labor Income Total Value Added Output
Direct Effect 17,089 $10,844,372,803 $6,498,438,032 $11,658,234,315
Indirect Effect 24,222 $1,540,480,311 $2,590,504,595 $4,620,887,062
Induced Effect 77,747 $3,499,238,307 $6,314,425,187 $10,083,524,434
Total Effect 119,058 $15,884,091,421 $15,403,367,814 $26,362,645,810
Note: Labor income, total value added and output are in present value (i.e., in today’s dollars).
The following table summarizes the corresponding 2024 projected construction-related impacts of the
pipeline industry for the state of Texas. The expansion of construction of pipeline in 2024 will result in
over 27,000 direct construction jobs and $4.5 billion of gross output value will be generated from
construction. Total impacts from construction (i.e., direct, indirect and induced) will generate and/or
sustain over 58,000 jobs in Texas. Moreover, the construction-related activities of the industry will
generate over $9.2 billion in output, and contribute more than $4.7 billion in total gross state product,
i.e., value added. The existence of the pipeline industry generates substantial economic activity and
economic benefits to Texas.
Construction
Impact Type Employment Labor Income Total Value Added Output
Direct Effect 27,444 $1,745,987,028 $1,955,328,571 $4,517,516,481
Indirect Effect 14,105 $902,273,953 $1,420,661,829 $2,526,744,946
Induced Effect 16,906 $762,679,415 $1,377,050,115 $2,198,562,198
Total Effect 58,455 $3,410,940,396 $4,753,040,515 $9,242,823,626
Note: Labor income, total value added and output are in present value (i.e., in today’s dollars).
The following table summarizes the projected 2024 operations- and construction-related impacts of the
pipeline industry for the state of Texas. The total pipeline projected impacts in 2024 will result in over
44,500 direct jobs and $16.2 billion of gross output. Overall, total impacts from pipeline operations and
construction (i.e., direct, indirect and induced) will generate and/or sustain over 177,500 jobs in Texas.
Moreover, the pipeline-related activities will generate $35.6 billion in output, and contribute more than

45
$20.2 billion in total gross state product, i.e., value added. The existence of the pipeline industry will
generate substantial economic activity and economic benefits to Texas.
Total of Operations & Construction
Impact Type Employment Labor Income Total Value Added Output
Direct Effect 44,533 12,590,359,831 8,453,766,603 16,175,750,796
Indirect Effect 38,327 2,442,754,264 4,011,166,424 7,147,632,008
Induced Effect 94,653 4,261,917,722 7,691,475,302 12,282,086,632
Total Effect 177,513 19,295,031,816 20,156,408,329 35,605,469,436
Note: Labor income, total value added and output are in present value (i.e., in today’s dollars).
The Texas pipeline industry also generates other economic benefits that are not measured in terms of
current jobs, income, value added and output. The IMPLAN economic impact model provides estimates
for taxes on production and imports, property, and various other taxes. In 2024, the operations and
construction activities of the Texas pipeline industry will account for $1,753,679,037 (in today’s dollars)
in state and local government revenues.
Low Forecast Scenario
The following table summarizes the 2024 projected operations-related impacts of the pipeline industry
for the state of Texas in the Low Forecast Scenario. The Texas pipeline industry will have over 14,400
direct jobs in 2024 and over $9.8 billion of gross output value will be generated from ongoing
operations. Total impacts from operations (i.e., direct, indirect and induced) will generate and/or
sustain over 100,000 jobs in Texas. Moreover, the operations-related activities of the industry will
generate $22.3 billion in output, and contribute $13.0 billion in total gross state product, i.e., value
added. The existence of the pipeline industry will generate substantial economic activity and economic
benefits to Texas.
Operations
Impact Type Employment Labor Income Total Value Added Output
Direct Effect 14,432 $9,158,092,344 $5,487,942,610 $9,845,399,855
Indirect Effect 20,456 $1,300,938,395 $2,187,685,792 $3,902,347,438
Induced Effect 65,657 $2,955,113,046 $5,332,543,431 $8,515,554,527
Total Effect 100,545 $13,414,143,784 $13,008,171,834 $22,263,301,820
Note: Labor income, total value added and output are in present value (i.e., in today’s dollars).
The following table summarizes the corresponding 2024 projected construction-related impacts of the
pipeline industry for the state of Texas. The expansion of construction of pipeline in 2024 will result in
over 23,000 direct construction jobs and $3.8 billion of gross output value will be generated from

46
construction. Total impacts from construction (i.e., direct, indirect and induced) will generate and/or
sustain over 49,000 jobs in Texas. Moreover, the construction-related activities of the industry will
generate over $7.8 billion in output, and contribute more than $4.0 billion in total gross state product,
i.e., value added. The existence of the pipeline industry generates substantial economic activity and
economic benefits to Texas.
Construction
Impact Type Employment Labor Income Total Value Added Output
Direct Effect 23,176 $1,474,489,186 $1,651,278,496 $3,815,050,797
Indirect Effect 11,912 $761,971,976 $1,199,751,471 $2,133,840,654
Induced Effect 14,277 $644,084,138 $1,162,921,300 $1,856,689,732
Total Effect 49,366 $2,880,545,301 $4,013,951,267 $7,805,581,183
Note: Labor income, total value added and output are in present value (i.e., in today’s dollars).
The following table summarizes the projected 2024 operations- and construction-related impacts of the
pipeline industry for the state of Texas. The total pipeline projected impacts in 2024 will result in over
37,600 direct jobs and $13.7 billion of gross output. Overall, the total impacts from pipeline operations
and construction (i.e., direct, indirect and induced) will generate and/or sustain over 206,000 jobs in
Texas. Moreover, the pipeline-related activities will generate $30.0 billion in output, and contribute
more than $17.0 billion in total gross state product, i.e., value added. The existence of the pipeline
industry will generate substantial economic activity and economic benefits to Texas.
Total of Operations & Construction
Impact Type Employment Labor Income Total Value Added Output
Direct Effect 37,608 10,632,581,530 7,139,221,107 13,660,450,651
Indirect Effect 32,367 2,062,910,371 3,387,437,263 6,036,188,091
Induced Effect 79,935 3,599,197,184 6,495,464,731 10,372,244,259
Total Effect 149,910 16,294,689,086 17,022,123,100 30,068,883,002
Note: Labor income, total value added and output are in present value (i.e., in today’s dollars).
The Texas pipeline industry also generates other economic benefits that are not measured in terms of
current jobs, income, value added and output. The IMPLAN economic impact model provides estimates
for taxes on production and imports, property, and various other taxes. In 2024, the operations and
construction activities of the Texas pipeline industry will account for $1,466,305,514 (in today’s dollars)
in state and local government revenues.

47
Summary
The oil and gas pipeline industry is an important driver of economic activities in the state of Texas and
beyond. The industry’s activities generate and sustain jobs, income, and output and contribute to state
and local government revenues. The total effects from construction and operation are estimated to
include 165,000 jobs, $33.1 billion in output, and $18.7 billion in value added in 2013. The industry also
provides substantially to the gross state product of Texas. Recent innovations and discoveries in both
plays and technologies have given rise to increased production of oil and gas and have led to additional
demands on the pipeline system. Provided that the pipeline industry maintains effective transportation
capabilities, it will continue to generate economic benefits that will likely impact Texas for years to
come. Conservative projections show that in 2024 the oil and gas pipeline industry in Texas would
generate 150,000-206,000 jobs, $30-41.4 billion in output, and $17-23.4 billion in value added based on
various economic conditions. Moreover, between the current year and 2024, the Texas pipeline
industry will generate cumulative economic impacts (in today’s dollars) of around $374 billion in
economic output, $212 billion in additional gross state product, and contribute $19.5 billion in state and
local government revenues. Additionally, the industry will sustain an average of around 171,000 jobs
per year in the state of Texas. Overall, the pipeline industry plays a vital and valuable role in both oil and
gas activities and broader economies across Texas.
The state of Texas competes to attract and retain companies engaged in the exploration, production,
processing and refining of oil and natural gas. As shown in this study, Texas has confirmed Resource
Plays and Reservoirs that can result in long term (i.e., decades of) drilling activity, thus sustaining or
increasing production. The pipeline transportation system is a key component in the realization of value
and the associated economic benefits that will come from the continued growth and expansion of the
oil and gas industry. A pipeline system capable of effectively handling increased levels of oil and gas
activity is necessary for oil and gas companies to find it economic to operate in Texas. From an
economic standpoint, the ability to retain and attract oil and gas investments requires a pipeline system
that can manage the flow of hydrocarbons in a timely and cost-effective manner. Accordingly, as shown
in this study, the economic benefits attributable to the pipeline system are substantial in the state of
Texas. Moreover, the upstream and downstream portions of the energy industry (i.e., exploration and
production, refining activities, etc.) will generate even more economic benefits to Texas in the form of
additional economic impacts provided that these companies have an efficient and effective way to
transport their product.

48
References and Sources of Information
Baker Hughes (http://gis.bakerhughesdirect.com/Reports/RigCountsReport.aspx).
DrillingInfo and DI Desktop TM (http://www.drillinginfo.com/).
IMPLAN Version 3.0 software and data sets for New Mexico and Texas.
National Bureau of Economic Research (http://www.nber.org).
Oil and Gas Journal, various issues, 2009-2013.
Railroad Commission of Texas (http://www.rrc.state.tx.us/permianbasin/).
Texas Pipeline Association
Texas State Comptroller’s Office (http://www.window.state.tx.us/).
U.S. Bureau of Economic Analysis (http://www.bea.gov/).
U.S. Bureau of Labor Statistics (http://www.bls.gov/).
U.S. Energy Information Administration (http://www.eia.gov/).
Marshal C. Watson, et al. Monograph III (December 2010) “Guidelines for the Practical Evaluation of
Undeveloped Reserves in Resource Plays”.