currency mismatch, systemic risk and growth in … · 3 with a more severe crisis. on net, we find...
TRANSCRIPT

1��
Currency Mismatch, Systemic Risk and Growth in Emerging Europe
Romain Ranciere, Aaron Tornell and Athanasios Vamvakidis *
Paris School of Economics and International Monetary Fund, University of California Los Angeles, and International Monetary
Fund
Currency mismatch is a vehicle that exposes the economy to systemic risk, but it is also an engine of growth. We analyze this
dual role at the macro and the micro levels. At the aggregate level, we construct a new measure of currency mismatch in the
banking sector that controls for bank lending to unhedged borrowers—i.e., those with no foreign currency income. Using our
measure, we find that across emerging European economies, increases in currency mismatch are associated with higher growth
in tranquil times, but also with more severe crises. On net, after taking into account the crisis period, we find a positive link
between currency mismatch and growth. These results are also confirmed for a broader sample of emerging economies. In our
firm-level analysis, we find that in emerging Europe, currency mismatch relaxes borrowing constraints and enhances growth
across sets of firms that arguably are the most credit constrained—i.e., small firms in non-tradables sectors—but not across
large firms. An advantage of our approach is that it considers both listed and non-listed firms, and so we are able to effectively
capture the effects of currency mismatch across the entire economy, not just the financially privileged stock market listed
firms.
JEL Classification Numbers: E44, F34, G15 Keywords: Currency Mismatch, Emerging Economies, Lending Booms, Systemic
Risk, Financial Crises, Eastern Europe.
*We would like to thank Enrique Alberola, Joshua Aizenman, Eric Begloff, Guillermo Calvo, Jin Han, Andrea Ichino, Jean Imbs, Maurizio Mazzocco, Joe Ostroy, Amine Ouazad and Romain Wacziarg as well as participant to the Economic Policy panel meeting for helpful comments, and the following people for sharing their data sets with us: Reza Baqir (IMF Vulnerability Exercise for Emerging Economies); Herman Kamil (foreign currency borrowing by sector in Latin America); Stephanie Prat (foreign currency foreign assets and liabilities for various emerging economies); and Christoph Rosenberg and Marcel Tirpak (direct borrowing in East Europe from abroad). The views expressed in this paper are those of the authors and do not necessarily represent those of the IMF or IMF policy.

2��
1. Introduction
Currency mismatch—the extent to which an economy’s liabilities are denominated in foreign currency while its assets are denominated in domestic currency—is widespread in emerging Europe. While currency mismatch was an important aspect of the Mexico crisis in 1994 and the East Asian crisis in 1997-98, it reached unprecedented levels in Eastern Europe before the recent crisis.
This paper analyzes the dual role of currency mismatch, focusing on the experience of emerging Europe. On the one hand, currency mismatch has been a prime vehicle for agents to take on insolvency risk and has resulted in large exposures to systemic risk for the economy as a whole. On the other hand, it has been an engine of credit growth that has allowed new and small firms to finance profitable investment projects. In particular, we investigate whether currency mismatch has been associated with faster economic growth, but also more severe crises.
A key contribution of this paper is the construction of a new currency mismatch measure. Due to the lack of readily available data, there is a dearth of currency mismatch measures that capture the underlying undertaking of systemic risk. In this paper, we construct such a measure. We then present a theoretical mechanism that links economic growth with currency mismatch. In our framewotk, currency mismatch helps relax borrowing constraints, but also generates financial fragility, leading to more severe crises. Our other contribution is to analyze, both from a macro and micro perspectives, whether these effects are present in the data. At the macroeconomic level, we analyze the links between currency mismatch, economic growth, and the severity of the crises over the period 1998-2009 in emerging Europe and in a broader sample of emerging economies. At the micro level, we use firm-level data to investigate whether the channels through which the theoretical mechanism works are operative at the firm level, by testing whether taking on currency mismatch helps firms reduce interest costs, relax borrowing constraints and improve growth performance.
Our currency mismatch measure focuses on the banking sector. If one looks exclusively into the banks' balance sheets, the notional degree of currency mismatch is often small, as the banks with foreign currency liabilities also tend to lend in foreign currency. However, there is de-facto currency mismatch if banks’ debtors cannot hedge their exchange rate risk—in the form of credit default risk. Thus, in case of a large depreciation, a large share of domestic debtors could go bust, affecting the asset portfolio of the banks that lent to them and generating a risk of a systemic crisis. An appropriate measure of currency mismatch needs to account for this source of systemic risk. To our knowledge, such a measure is not available in the literature. The reason is a lack of readily available data on the composition of banks’ assets and liabilities and the extent to which borrowers in foreign currency are hedged.
We construct such a de-facto currency mismatch measure by combining information on foreign currency assets and liabilities of banks with BEEPS firm-level data and other data sources from national authorities and the IMF confidential vulnerability exercises. We measure the fraction of foreign currency loans granted to borrowers with no foreign currency income, and exclude it from the asset side of the banks’ balance sheets. We then compute our de-facto currency mismatch measure by dividing the banks’ foreign currency denominated net unhedged liabilities by total bank assets. We construct such a measure for 10 emerging European economies for which such detailed data is available, over the period 1998-2009. We then compute a similar de-facto currency mismatch measure for a set of 19 additional emerging economies, for which somewhat less detailed data are available. Interestingly, we find that this de-facto measure is much larger than other currency mismatch measures that do not control for the banks’ borrowers’ ability to hedge.
Using our currency mismatch measure, we find that there are statistically significant links between currency mismatch and economic growth, both across the set of 10 emerging European economies, as well as across the larger group of 29 emerging economies. A greater increase in currency mismatch is associated with faster economic growth during tranquil times, but also

3��
with a more severe crisis. On net, we find a positive link between currency mismatch and growth despite the output cost of the recent crisis. Our estimates for the period 1998-2009 indicate that a country that increased its currency mismatch by 6.6 percentage points each year—equal to one standard deviation—had on net a 4 percent higher GDP at the end of the period (including the crisis year) than a country that did not experience a currency mismatch increase. These results are robust to a number of tests and alternative specifications.
To demonstrate the dual role of currency mismatch, we present a conceptual framework in which contract enforceability problems generate borrowing constraints, as lenders require collateral to ensure that borrowers will repay their debt. If a majority of agents believe that there are bailout guarantees against systemic crises and there is a—small—probability that the exchange rate might experience a severe depreciation, it is optimal to borrow in foreign currency, even if it entails a—small—probability of bankruptcy. Therefore, currency mismatch emerges as a best-response of agents to the policy environment. Borrowers find currency mismatch optimal because (i) the expected interest payments on Euro debt are lower than those on domestic currency debt, even after correcting for expected depreciation; and (ii) they can borrow more. Risk premia on Euro debt do not fully reflect the extent of insolvency risk, because the government is expected to grant a bailout in the rare event of a severe financial crisis. In other words, systemic bailout guarantees generate an implicit subsidy that can be exploited only by taking on insolvency risk. This mechanism generates a positive link between economic growth and currency mismatch, as the latter helps relax borrowing constraints. However, it also implies more severe crises in countries with higher currency mismatch.
At the firm level, the above arguments imply that firms that take on currency mismatch enjoy better borrowing conditions and grow faster outside crisis times, especially in sectors that tend to be financially constrained, such as small firms in the nontradables sector. In our empirical firm-level analysis, we investigate whether firms that take on currency mismatch enjoy such benefits, relative to similar firms with no currency mismatch. We use data for a large cross-section of European economies from the Business Environment and Enterprise Performance Survey of the European Bank for Reconstruction and Development (BEEPS). The regression analysis suggests that across financially constrained groups of firms, currency mismatch reduces the interest rate by 2 percentage points on average, and increases the average loan maturity by 10 months. Furthermore, firms with currency mismatch exhibit 2.3 percentage points faster annual growth. Interestingly, these effects are not present across groups of large firms, which are usually less financially constrained.
Much of the literature on the impact of currency mismatch on firms’ performance uses stock market listed firms, and finds that balance sheet effects associated with currency mismatch have been a minor issue. However, the sample of listed firms is a biased sample of large privileged firms, which are not representative of the majority of firms in these countries. An advantage of our approach is that it considers both listed and non-listed firms, and so we are able to effectively capture the effects of currency mismatch across the entire economy, not just the prime listed firms. Brown, Ongena and Yesin (2009) are the first to use a representative sample of firms in Eastern Europe from the BEEPS survey to study foreign currency borrowing. Our work differs from theirs in two dimensions. First, we focus specifically on currency mismatch—i.e., on foreign currency borrowing by firms with no foreign currency income--rather than on foreign currency borrowing. Second, we mainly assess the impact of currency mismatch on the terms of borrowing and on firm performance rather than its determinants.
The rest of the paper is structured as follows. Section 2 describes the boom and bust experienced by emerging Europe during the last decade. Section 3 presents the conceptual framework. Section 4 describes how we construct our de facto currency mismatch measure and analyzes the macroeconomic effects of currency mismatch. Section 5 presents the firm-level analysis and section 6 presents the conclusions. The appendix contains a simple model, a description of our empirical methodology and

4��
the data sources. Finally, an unpublished supplementary appendix contains figures and tables with additional empirical results.1
2. The Boom and Bust Cycle in Emerging Europe
Before the recent crisis, emerging Europe included some of the fastest growing emerging economies, growing at rates that in some cases were even higher than in emerging Asia, even after controlling for differences in initial per capita GDP (Table 1, first column). This growth performance was in part driven by EU-related reforms and expectations that euro adoption will follow EU membership. Indeed, most countries in the region either joined the EU or started membership negotiations, or at a minimum applied for membership during the last decade. Slovenia and the Slovak Republic have also introduced the euro as their currency.2�
As part of the EU-driven reforms and the liberalization of these economies, capital controls and credit market regulations were dismantled in most countries. The opening up of the economy combined with privatization in the financial sector led to a boom in foreign bank ownership throughout emerging Europe. The share of foreign banks in total bank assets ranges from 29 percent in Slovenia to 99 percent in Estonia, with an average of 77 percent and a median of 84 percent (Table 1, second and third columns). Financial openness, measured as foreign assets plus foreign liabilities over GDP, increased substantially (Table 1, fourth and fifth columns). Structural reforms, the opening of the capital account, financial liberalization and the domination of foreign banks with easy access to financing from their parent banks were the main ingredients of the economic boom in emerging Europe during the pre-crisis period. Borrowing costs fell sharply throughout the region during the precrisis period, particularly in foreign currency. Furthermore, private credit expanded in emerging Europe faster than in other emerging economies (Table 1, sixth and seventh columns).
The boom led to the buildup of large external imbalances before the crisis, with high current account deficits and external debt levels (Table 1, eighth and ninth columns). Associated with the lending boom, real exchange rates appreciated in most countries in the region, regardless of exchange rate regime.
Emerging Europe’s boom was driven by the private sector, not by government spending. The private sector saving-investment balances clearly dominated the current account balances. Private sector investment increased by 3.1 percentage points of GDP on average in the region between 2004 and 2007. In contrast, public sector investment increased by only 1 percentage point of GDP. Private sector savings fell by an average of 2.1 percentage points of GDP, while public savings actually increased, by an average of 1.8 percentage points of GDP during the same period. Most emerging European economies had small general government deficits and some had surpluses before the crisis. Moreover, the fiscal balances improved in almost all the economies in the region in the years leading to the crisis. General government debt levels were small throughout emerging Europe, with the exception of Hungary. Also, compared with other emerging economies, the government deficit and debt levels in emerging Europe before the recent crisis do not stand out, while the share of public sector external debt to total external debt—excluding short-term debt for which sectoral data are not available—was relatively low and declined even further before the crisis in most countries of the region (Table 1, last three columns).
External imbalances were smaller in economies that started with a more developed financial sector and were more advanced in terms of institutional reforms. For example, current account deficits and external debt levels were substantially smaller in the Czech Republic, Poland, Slovenia, and the Slovak Republic. In the last two countries, lending interest rates converged to euro
������������������������������������������������������������1 The unpublished supplementary appendix of this paper can be found at http://www,romainranciere.com/economic_policy_appendix.pdf
2 The road to the EU includes a large number of broad economic, legal, and institutional reforms to comply with the EU acquis, including the opening of the capital account.

5��
area levels as these countries introduced the euro—eliminating previous differentials between borrowing in domestic and in foreign currency. Also, these economies had relatively higher per capita GDP levels than most other economies in the region.3
Emerging Europe was hit by the crisis considerably more than other emerging economies. Real GDP growth turned sharply negative in 2009 and was substantially below what has been observed in other emerging economies (Figure 1). Borrowing costs increased sharply in all economies in the region, although from historically low levels.
Although there was no explicit systemic bailout guarantee in emerging Europe before the recent crisis, multilateral and bilateral external financing during the crisis effectively provided such guarantee through various programs including the Vienna Initiative. Eight countries in the region introduced IMF programs, which in addition to IMF financing in most cases included funds from the EU, the World Bank, and bilateral sources (mostly from advanced European economies with bank sector exposures to emerging Europe). Moreover, the IMF programs included specific assumptions on foreign bank rollover rates, which were often negotiated and agreed between the respective banks and the authorities of the host advanced economies. Although such financing does not necessarily prove that there was an implicit systemic bailout guarantee, it has been large enough to effectively bailout both lenders and borrowers in emerging Europe. In many cases the bailout was granted indirectly via the support of exchange rate pegs, as the collapse of the pegs, primarily in the Baltics, could have led to large losses due to balance sheet effects and cross-border spillovers.
3. Theoretical Mechanism
This section discusses why taking on currency mismatch and the implied insolvency risk might be optimal from the perspective of both lenders and borrowers. It then analyzes the macroeconomic implications of such decisions in terms of higher economic growth, but also systemic risk. Appendix A presents a model that formalizes the mechanism.4�
Currency mismatch arises when domestically oriented firms and households denominate their debt in foreign currency—for example Euros—while the cash flows that will service that debt are denominated in domestic currency. Consider a setup in which agents can denominate their debt in either domestic or foreign currency. To capture borrowing constrains that prevail in emerging economies, we assume that there are contract enforceability problems in credit markets. Lack of enforceability implies that borrowers cannot commit to repay their debt and might have incentives to divert funds. Lenders then impose borrowing constrains to ensure that they will be repaid.
In such an environment, domestically oriented borrowers have no incentives to take on currency mismatch, as they will have to internalize the insolvency risk via higher interest rates and lower leverage. This environment, however, is not a complete description of the real world: we also need to consider the existence of bailout guarantees against systemic crises. It is a stylized fact that if a critical mass of borrowers is on the brink of bankruptcy, governments typically implement policies to ensure that creditors get repaid—at least in part—and avoid a systemic economic meltdown. In other words, governments insure creditors against systemic crises. These bailouts may come in the form of handing out checks, an easing of monetary
������������������������������������������������������������3 There is a recent literature on external imbalances in emerging Europe. Vamvakidis (2009) discusses the vulnerabilities of emerging Europe before the recent crisis, most of which resulted from high levels of external debt. Rosenberg and Tirpak (2009) investigate the determinants of foreign currency borrowing by the private sector. They find that it is explained mainly by the extent to which domestic banks finance credit expansion from abroad, the level of deposit dollarization, and the interest rate differential. Finally, Árvai, Driessen and Ötker-Robe (2009) examine the financial interlinkages within Europe and potential contagion channels.
4 This mechanism is based on Schneider and Tornell (2004) and Ranciere and Tornell (2009). It relates to the sudden stops literature that analyzes the dynamics of different macro variables during a financial crisis (e.g. Calvo, Izquierdo and Mejia (2008)). An important difference is that we focus not only on crises, but also on the dual role of foreign currency debt, during normal times and during crisis.

6��
policy, or the maintenance of an exchange rate peg.5�However, if an isolated borrower defaults, the lender is not bailed out. It is therefore necessary that a critical mass of borrowers be at the brink of default.
In the presence of guarantees, a domestically oriented firm will find it optimal to take on currency mismatch if two conditions hold: (i) it expects that a critical mass of borrowers also take on currency mismatch; and (ii) there is a—small—probability of a severe real exchange rate depreciation, so that the government will indeed grant a bailout. From the lenders’ perspective, the bailout guarantee means that they will be repaid both under no depreciation and under depreciation. In the first case, the borrowers will repay, as their debt contract is incentive compatible. In the second case, the government will repay lenders via a bailout. The key implication is that the interest rate that the lenders charge does not include a premium for the insolvency risk that currency mismatch entails. It follows that from a borrower’s perspective, the expected interest costs are smaller for debt denominated in foreign currency than for debt denominated in domestic currency: it is actuarially cheaper to borrow in Euros than in domestic currency.
The lower expected interest payments generate an additional advantage of currency mismatch: it relaxes the borrowing constraint. This is because the reduction in the expected debt service makes it less attractive for borrowers to divert funds instead of repaying debt. That is, currency mismatch relaxes the incentive compatibility constraint imposed by lenders in order to ensure that they will be repaid. It follows that if the likelihood of a sharp depreciation is small, a borrower finds it profitable to take on debt that will be repaid in Euros rather than debt that will be repaid in domestic currency, given that a critical mass of other borrowers are doing the same.
This discussion implies that a violation of uncovered interest rate parity is a key driver of currency mismatch. Table 2 suggests that indeed this violation was present in emerging Europe before the recent crisis. Consensus exchange rate forecast data indicate that during 2004-2007, lending interest rates in foreign currency adjusted for expected depreciation were lower than interest rates in domestic currency by an average of 2½ percentage points—Hungary was the only exception.
Turning to the macroeconomic implications, there is a safe equilibrium where no agent expects a bailout and, therefore, no domestically oriented borrower denominates debt in Euros. In such equilibrium, a severe depreciation will not lead to generalized bankruptcies due to balance sheet effects. As a result, no borrower has incentives to take on currency mismatch and there will be neither a financial crisis, nor political pressures to grant a bailout in case of an isolated default.
However, if a majority of agents believe that there are systemic bailout guarantees, there is also a risky equilibrium, where a critical mass of domestically oriented borrowers have incentives to denominate their debt in foreign currency as: (i) they can borrow more funds; and (ii) the expected interest costs are lower. Lenders do not "charge" borrowers for the insolvency risk they take, as they know that the taxpayer will repay the debt in case of a systemic crisis. In other words, systemic bailout guarantees generate an implicit subsidy that can be cashed in only by taking on insolvency risk.
If many constrained agents borrow in foreign currency, borrowing constraints are relaxed. Such increase in leverage permits higher aggregate investment and consumption, which in turn leads to faster economic growth during no-crisis times, provided constrained agents have profitable investment opportunities. However, currency mismatch also leads to systemic risk. This is because a large real depreciation could lead to generalized bankruptcies, especially of domestically oriented borrowers with Euro-debt in their books. Hence, currency mismatch leads to faster growth, but also increases the likelihood of a financial crisis.
������������������������������������������������������������5 Indeed, bailouts in emerging Europe during the recent crisis often took the form of supporting the pegs.

7��
Will average economic growth in an economy with currency mismatch be higher than in a safe economy, even after taking into account occasional financial crises? The answer hinges on the frequency and severity of crises during the sample period. This is an empirical issue, which we address in the next section.
Box 1. Determinants and Effects of Currency Mismatch
Microeconomic mechanism: There exist two credit market frictions in the economy:
� Contract enforceability problems � borrowing constraints � Systemic Bailout Guarantees � incentives to take on risk
These frictions imply that borrowers face the following trade-off in their debt denomination decision:
� domestic currency debt � high interest rate & low leverage � foreign currency debt � low interest rate & high leverage
To see why consider competitive risk-neutral lenders with an opportunity cost of capital of 1+r in terms of Euros, and consider a loan of 1 Euro:
(i) if the loan is to be repaid in domestic currency, the promised repayment is
1+�dom = (1+r) / E(pt+1 ) with 1/ E(pt+1 ) the real exchange rate.
(ii) if the loan is to be repaid in Euros—there is currency mismatch—and there is a bailout guarantee in case of a severe depreciation that will bankrupt borrowers, the promised repayment is
1+�cm = (1+r)
The equality 1+�cm = (1+r) follows because lenders will be repaid for sure either by the borrower or the bailout.
If a severe depreciation occurs with probability 1-u, the expected interest costs are respectively [1 +�dom ]E(pt+1 ) =1+r and [1+r] u. Thus, from the borrower’s perspective, the expected repayment is lower under currency mismatch since [1+r] u<1+r
Because the expected repayment is lower under currency mismatch, the borrower’s incentives to repay are higher. This ameliorates contract enforceability problems and relaxes borrowing constraints.
Macroeconomic Effects
Severe borrowing constraints � bottlenecks that impede faster growth Currency mismatch �relaxes borrowing constraints
�increases investment �increases economic growth in no-crisis times
However, currency mismatch also �generates systemic risk
�increases likelihood of a financial crisis�

8��
4. Aggregate Currency Mismatch: Measurement and Macroeconomic Consequences
This section introduces a new currency mismatch measure that captures the presence of systemic risk by explicitly taking into account the extent to which borrowers hedge their foreign currency liabilities. This measure is then used to analyze the macroeconomic consequences of currency mismatch.�
4.1. Measuring Aggregate Currency Mismatch
Here, the currency mismatch measure is computed over the period 1998-2009, for 10 countries in emerging Europe for which there is detailed data. In the next subsection, the sample is extended to include non European emerging economies, increasing the sample to a total of 29 emerging economies.
There are different ways in which one can measure the degree of currency mismatch.6 A straightforward way is to compare the net national debt or debt service requirements to the net exports of a country. Another, also straightforward, way is to look at the ratio of foreign currency denominated liabilities to foreign currency denominated assets of the banking sector. These measures have the virtue of being simple and using readily available data. However, they might miss instances in which systemic risk is developing.
While the first measure captures external aggregate imbalances, it is not designed to capture sectoral imbalances that could generate systemic risk. For instance, while an economy might have a low foreign currency debt relative to its net exports, that debt might be concentrated in borrowers with no foreign currency income. Moreover, the presence of a vibrant export sector does not imply that a government would be able to tax exporters during a crisis in order to bailout debtors with foreign currency exposures.
The second measure, by looking exclusively at bank balance sheets, will often find that the notional degree of currency mismatch is small, as banks with foreign currency liabilities also tend to lend in foreign currency—often because of prudential requirements. However, if domestic bank debtors cannot effectively hedge their exchange rate risk, banks are indirectly exposed to exchange rate risk, through credit risk. Thus, there is a de-facto systemic risk, which is not reflected in a notional currency mismatch measure that considers only banks’ balance sheets.
The recent experience of the emerging European economies illustrates the deficiencies of the available currency mismatch measures. During the pre-crisis boom, banks in emerging Europe borrowed in foreign currencies to extend loans denominated in foreign currencies both to the corporate sector and to households. Indeed, the share of foreign currency lending to total lending reached well above 50 percent in most emerging European economies in 2007, which was substantially higher than in other emerging economies (see Figure 2). However, if a substantial share of this credit was extended to sectors with no foreign currency revenues and financed consumption and investment in nontradables goods, the de-facto insolvency risk taken on by banks would be substantial and would have contributed to aggregate systemic risk.
A currency mismatch measure that appropriately captures the evolution of systemic risk should therefore control for indirect channels by which foreign currency debt can generate insolvencies across different classes of bank’s debtors. In other words, such an index should control for the sources of foreign currency income for different classes of foreign currency borrowers.
������������������������������������������������������������6 For a discussion of the literature and measures of currency mismatch see Eichengreen, Hausmann and Pannizza (2007) and Goldstein and Turner (2004).

9��
This is one of the key contributions of this paper. We construct a de-facto currency mismatch index that covers the period 1998-2009. This index is computed as the ratio of foreign currency denominated net unhedged liabilities to total bank assets, where the former is determined by the share of banks’ net foreign currency liabilities that is lent to unhedged borrowers (see Box 2 and Appendix B for details).
Box 2. A new measure of currency mismatch
Currency mismatch in the banking sector is usually measured as the difference between foreign currency assets and
liabilities. However, to the extent that some of the foreign currency assets are claims towards unhedged borrowers, banks are
exposed to exchange rate risks indirectly, through credit default risk. Bank balance sheet data do not capture such an indirect
exchange rate risk, as their foreign currency assets and liabilities are often matched. Our measure of currency mismatch
captures this indirect exchange risk by excluding foreign currency loans to unhedged borrowers from foreign currency assets.
The formula of the new currency mismatch measure in the banking sector is the following:
Foreign currency denominated net unhedged liabilities / total bank assets ={[ foreign currency foreign liabilities + foreign
currency domestic liabilities] - [foreign currency foreign assets + foreign currency domestic assets] +
[foreign currency lending to unhedged households + foreign currency lending to unhedged nonfinancial firms]} / [total bank
assets]
The components of the numerator in the above formula include:
� Foreign currency foreign liabilities: foreign currency claims of nonresidents towards the domestic banking sector (i.e. loans of foreign banks, including parent foreign banks to their subsidiaries, and foreign currency deposits of nonresidents).
� Foreign currency domestic liabilities: foreign currency claims of residents towards the domestic banking sector (i.e. foreign currency deposits of residents).
� Foreign currency foreign assets: foreign currency claims of the banking sector towards nonresidents (i.e. deposits, or loans in foreign currencies).
� Foreign currency domestic assets: foreign currency claims of the banking sector towards residents (i.e. foreign currency loans).
� Foreign currency lending to unhedged households: the part of the banks’ foreign currency domestic assets that is foreign currency lending to unhedged households.
� Foreign currency lending to unhedged nonfinancial firms: the part of the banks’ foreign currency domestic assets that is
foreign currency lending to unhedged firms.
The adjustment includes foreign currency lending to unhedged households and nonfinancial firms. As such lending is subject
to exchange rate risk through balance sheet effects in households and nonfinancial firms, a sharp exchange rate depreciation
would turn a large share of such loans to nonperforming loans. Therefore, a currency mismatch of a bank’s borrower will
10��
This measure of currency mismatch assumes that foreign currency lending to nonfinancial corporates and to households that have no foreign currency income is subject to exchange rate risk. In contrast, it assumes that exporters are able to hedge all exchange rate risk. However, it should be noted that even loans to borrowers with foreign currency income may not be serviced during a crisis if their foreign income declines, for example, due to a drop in exports as foreign demand drops sharply.7
The construction of such a measure requires refined data about bank balance sheets that permits tracking the evolution of credit to different sectors, including nonfinancial firms and households, and measuring the extent to which the debtors are hedged for exchange rate risk. Such data is not readily available, which might explain the lack of such de facto currency mismatch measures in the literature.
We construct the currency mismatch measure by using data from a large number of sources, some of which are confidential IMF data (see Appendix B for details). Data on foreign currency domestic and foreign asset and liabilities by sector and data on total bank assets are from Haver Analytics and from the internal and confidential IMF Vulnerability Exercise for Emerging Economies. The share of foreign currency lending to corporates with no foreign currency income is from a number of sources, including various EBRD and World Bank firm survey data, country authority data, and various country studies.
We have data for the extent to which firms hedge their foreign currency exposure, but not for the extent to which households do. Thus, we can assume that either households hedge foreign exchange risk to the same extent as firms do, or they do not hedge at all. For emerging Europe, we compute our currency mismatch measure under both alternatives, because we have data on foreign currency loans to households and to firms separately. However, for the other 19 emerging economies we only have data on foreign currency loans to the whole private sector, without separating households and firms. Thus, for these 19 countries we can only compute our measure under the assumption that households’ hedging is the same as that of firms. As the fourth and last columns in Table 3 show, for the 10 emerging European countries the currency mismatch measures under these two assumptions are quite similar (the correlation between the two is near to one). Therefore, to be consistent throughout the paper, our regressions use the measure under which households’ and firms’ hedge to the same extent.
Figure 3 shows the de-facto currency mismatch in all emerging European economies with available data during 1998-2009, ranked based on the change in currency mismatch during this period.8 The sample includes 10 countries that account for 86 percent of East Europe’s GDP, excluding Russia. The estimates show that currency mismatches increased throughout emerging Europe during the boom years before the recent crisis, particularly in Bulgaria, Latvia, Estonia, and Lithuania. On average, currency mismatches as a share of bank assets increased by 16 percentage points during the last ten years in the region. Before the crisis, the currency mismatch measure reached the highest level in Romania, Estonia, Croatia, Latvia, and
������������������������������������������������������������7 Indeed, the IMF’s WEO estimates that emerging Europe’s exports of goods and services fell by 11 percent in volumes, or 21 percent in nominal US dollars, in 2009. 8 See below for estimates for non-European emerging economies.
lead to a currency mismatch for the bank if the borrower cannot repay the loan during a crisis. Therefore, foreign currency
loans to unhedged borrowers should be subtracted from the asset side of the banking sector in order to calculate a currency
mismatch measure that captures more accurately the extent of systemic risk.�

11��
Lithuania. The only economies without currency mismatches before the crisis (a negative measure in 2007) included the Czech Republic and, less so, Ukraine.9
To assess the importance of controlling for foreign currency lending to unhedged borrowers, Figure 4 shows an unadjusted notional currency mismatch (foreign currency denominated net liabilities without adjusting for foreign currency lending to unhedged borrowers) next to the de-facto adjusted measure. The comparison shows that while most countries do not exhibit currency mismatch according to the unadjusted measure, they exhibit very large mismatches according to the measure that adjusts for unhedged foreign currency lending. The difference is on average equal to 23 percentage points, and is particularly sharp in Estonia, Latvia, and Bulgaria.
Did unhedged lending go mostly to households or to the corporate sector? Table 3 shows the calculated currency mismatches for 2004 and 2007, without adjusting for unhedged foreign currency borrowing (first column), adjusting only for unhedged borrowing by households (second column), adjusting only for unhedged borrowing by firms (third column), and fully adjusting for unhedged borrowing (fourth column). A comparison of unadjusted and fully adjusted for unhedged foreign currency borrowing currency mismatches in 2004 and in 2007 shows that currency mismatches increased in most countries during this period, in most cases substantially. A comparison of the second and third columns, which compares the extent to which the adjustment for unhedged foreign currency borrowing is due to household vs. firms, shows that most of the unhedged borrowing during the precrisis period was done by firms. However, unhedged foreign currency borrowing by household increased substantially by 2007—which in some cases may reflect the mortgage-financed housing boom in some of the countries in the region.
In many countries, firms took on additional insolvency risk via direct foreign currency borrowing from abroad, particularly in response to central bank measures to limit currency mismatch in the domestic banking sector.10 Although we do not include such direct borrowing in our baseline currency mismatch measure, the fifth column in Table 3 contains currency mismatch estimates that include direct foreign currency borrowing from abroad.11 The estimates suggest that such borrowing increased currency mismatch in all countries in the sample before the crisis.
Table 4 compares the new currency mismatch measure with two standard measures in the literature. The first is net external debt to exports of goods and services—net debt is defined as total external debt minus foreign assets of the central bank and the banking sector. The second is external debt service to exports of goods and services. These comparisons suggest that our measure of currency mismatch provides new information. Although the share of net external debt to exports seems to be highly correlated with our measure, the correlation of the changes is very small. The share of external debt service to exports is even less correlated with our measures, both in terms of levels and changes.12
4.2. The Boom-bust Cycle and Currency Mismatch in Emerging Europe
������������������������������������������������������������9 Although Ukraine was overheating before the global financial crisis and eventually had a severe crisis and an IMF program, its external imbalances did not reach levels as high as in most of the rest of emerging Europe (see Table 1). 10 Direct borrowing from abroad by corporates was often accompanied by a repayment guarantee by the domestic foreign owned bank to the parent bank abroad. Therefore, the exchange rate risk was still assumed by the domestic banking sector, while the loan was repaid to the parent bank. 11 Based on data in Rosenberg and Tirpak (2009); see Appendix B for details. 12 Like this paper, a recent literature has looked at sector level balance sheet data (e.g., Rosenberg, et.al. (2005) and Prat (2007)). Prat (2007) computes the banks’ currency mismatch as the share of their foreign currency liabilities not covered by their foreign currency loans. From the perspective of capturing systemic risk, a shortcoming of the latter approach is that it does not adjust for foreign currency loans made to unhedged borrowers. Our contribution is to make this adjustment by subtracting from the banks foreign currency assets those loans made to agents with no foreign currency income.
12��
This section analyzes the macroeconomic effects of currency mismatch. As Figure 5 shows, during the boom years, a higher increase in currency mismatch was associated with faster real GDP growth (Figure 5.1) and faster credit growth (Figures 5.2 and 5.3). As the theoretical framework suggests, the increasing credit-to-GDP ratio can be explained by the faster growth of the nontradables sector relative to the tradable sector, with the former benefiting proportionally more from the relaxation of borrowing constraints. The sharp increase in the current account deficit and the accumulation of external debt were a by-product of the increasing nontradables-to-tradables output ratio. Indeed, Figure 5.4 shows that, during the boom years, the production of nontradables relatively to tradables in emerging Europe was highly correlated with the increase in currency mismatch. At the same time, Figure 5.5 and Figure 5.6 show that high currency mismatch was correlated with higher current account deficits and higher levels of external debt.
During the crisis, these patterns reversed. As Figure 5.7 shows, the greater the increase in currency mismatch during the boom, the sharper the current account reversal and, Figure 5.8 shows, the steeper the fall in GDP during the crisis (no data is available yet for the nontradables-to-tradables output ratio during the crisis).
Next we use panel regressions to explore the link between currency mismatch and emerging Europe’s recent boom and bust cycle. We regress annual real GDP growth on the current and lagged changes in currency mismatch, a crisis dummy variable that takes the value of 1 in 2009 (the year when growth turned negative in East Europe), interaction terms of the crisis dummy with the current and lagged changes of currency mismatch, the change in the ratio of external debt to GDP and a time trend. The regression is estimated for the 10 countries in emerging Europe in our sample, over the period 1998-2009.13
We use both a pooled OLS estimator and a fixed effects estimator. While the fixed effect estimator has the advantage of controlling for country-specific unobserved heterogeneity, it restricts the estimation to the within-country dimension. This is potentially problematic for the estimation of the growth impact of financial fragility since there is only one crisis in the sample. This is why we also present results using the pooled OLS estimator.14 Table 5 shows the results of the estimation. The first two columns present the pooled estimates, while the fifth and sixth columns present estimates with fixed effects.
Although the results should be treated with caution given the relatively small sample, they suggest that changes in currency mismatch were positively correlated with growth in the pre-crisis period, but negatively correlated with growth during the recent crisis. The change in currency mismatch enters positively and statistically significant (although at the 10 percent level in the specification with fixed effects). The lagged currency mismatch is not statistically significant in these specifications (it is significant when the current value is not included, see Appendix B). The crisis dummy variable is negative and statistically significant in all specifications. With the exception of the specification with fixed effects, the interaction term of the lagged change in currency mismatch with the crisis dummy variable is negative and statistically significant. The latter suggests that countries in emerging Europe that increased their currency mismatch before the crisis were affected by the crisis more. The insignificant estimate of the interaction term with the current value of currency mismatch could be explained by the fact that some countries were forced to reduce their currency mismatch during the crisis.
These results hold even when we control for the change in the external debt-to-GDP ratio, which does not turn out to be statistically significant. This suggests that it was not the increase in external debt that drove fast growth in emerging Europe before the crisis and the collapse of growth during the crisis, but the increase in currency mismatch. Therefore, an emerging European economy that increased its external debt without increasing its currency mismatch in relative terms did not experience the same boom-bust cycle that took place in the rest of the region during the last decade. ������������������������������������������������������������13 The results are robust if per capita real GDP, or PPP-adjusted per capita real GDP is used instead.
14 Regressions using random effects yield findings that are similar to the pooled estimation. The results are available upon request, but no reported because of the small cross-sectional size of our panel.

13��
The economic significance of the estimates is sizable. According to the second regression in Table 5, if currency mismatch increases in a country by 6.6 percentage points (equal to one standard deviation), growth increases by 0.8 percentage points per year, leading to higher GDP by 8.7 percent during the pre-crisis period (1998-2008), relative to a country where currency mismatch remains unchanged.15 In the meantime, the point estimate of the interaction term of the crisis dummy with the lagged currency mismatch indicates that a country that increased its currency mismatch by 6.6 percentage points the year before the crisis experienced a 4.7 percentage points more severe drop in GDP during the crisis, compared with a country that did not increase its currency mismatch.16 Considering the entire boom-bust episode altogether, a country that was increasing its currency mismatch by 6.6 percentage points each year would have had on net a 4 percent higher GDP at the end of the period (including the crisis year) than a country that did not experience a currency mismatch increase.17
The results of Table 5 are robust to a battery of additional tests that are presented in Table B.1. in Appendix B. The results hold when the regression includes the change in the ratio of nontradable production to GDP and, to partly address causality concerns, the lagged change of currency mismatch without including its current change. The results also hold when the measure of currency mismatch assumes that households are not able to hedge currency risk at all, or when currency mismatch is divided by GDP instead of total bank assets.
4.3. Currency mismatch and the recent boom and bust cycle in emerging economies
This section expands the country sample to include non-European emerging economies, as well as additional European emerging economies, for which data are available in less detail than in the initial 10 emerging European economies sample. Here we repeat the panel growth regression of the previous subsection for an expanded sample of 29 emerging economies, for the period 1998-2009. We also take advantage of the larger sample in order to estimate a cross-sectional growth regression, using averages over the period 2000-2009 and controlling for additional growth determinants.
It is challenging to compute the currency mismatch for non European emerging economies because of the lack of detailed data on domestic banks’ foreign currency loans to residents and foreign currency deposits of residents. In addition, data on foreign currency loans are not available separately for firms and households. The exceptional magnitude of foreign currency borrowing across sectors before the recent crisis has fostered a data collection effort in Eastern Europe that seems unparalleled in the rest of the emerging world, despite the role of currency mismatch in the financial crises of the 1990s. Nevertheless, this section uses a number of sources and simplifying assumptions to expand the de-facto currency mismatch measure to 19 additional countries (see Appendix B for more details):
� Data on foreign currency loans to residents and foreign currency deposits of residents are from the internal and confidential IMF Vulnerability Exercise for Emerging Economies, which is based on data provided by country authorities. Some gaps in the data on foreign currency deposits of residents are complemented by using data in Arteta (2003 and 2005) and Haver Analytics.
� Data on banks’ foreign assets and liabilities are from a data set constructed by Prat (2007) for: Argentina, Brazil, China, Indonesia, Mexico, Peru, Philippines, Russia, Thailand, Turkey, and Uruguay. Data from the IMF’s
������������������������������������������������������������15 This is the cumulative sum of the estimate (equal to 0.12) times one standard deviation of the change in the currency mismatch (equal to 6.6) during the period 1998-2007.
16 This is equal to: (6.6 x 0.12) – (6.6 x 0.84).
17 Taking the case of Estonia as an example, the estimates suggest that its GDP in 2009 was higher by 3.9 percentage points, compared with what it would have been if Estonia had not increased its currency mismatch during the last decade. In contrast, in Brazil and Mexico, where currency mismatch increased only marginally during this period, GDP was higher by only 0.1 and 0.3 percentage points respectively, compared with what it would have been without any currency mismatch increase.

14��
International Financial Statistics (IFS) are used for: Bosnia & Herzegovina, Costa Rica, Egypt, Guatemala, Kazakhstan, Serbia, Venezuela, and Vietnam. Unfortunately, the IFS data on bank foreign assets and liabilities do not specify currency denomination. Thus, for these 8 countries we have assumed that all the banks’ foreign assets and liabilities are denominated in foreign currency. As discussed below, this assumption does not turn out to make a big difference.
� Data for the share of unhedged foreign currency borrowing comes from various sources. For Latin America, the share is based on firm survey data in Kamil (2004 and 2010). For other regions, data come from various World Bank’s Enterprise Surveys, setting the share of unhedged foreign currency borrowing equal to the share of non-exporting firms with foreign currency loans to the total number of firms with foreign currency loans—assuming that foreign currency loans in the tradable sector are fully hedged. As the previous subsection explains, due to lack of separate data on foreign currency loans to firms and households, the share of unhedged borrowing is assumed to be the same for households and firms.
In order to assess whether the currency mismatch measure using IFS data on bank foreign assets and liabilities captures currency mismatch in a similar way as the measure based on more detailed data, we compare the currency mismatch generated by them with the baseline currency mismatch measure for the 10 emerging European economies of the previous section. The simple correlation of the changes in the two currency mismatch measures is 0.85, suggesting that using IFS data is a reasonable approximation.18
In the extended set of 29 countries, emerging Europe stands out as the region with the sharpest increase in currency mismatch. As Figure 6 shows, the six economies with the largest increase in currency mismatch are in this region: Estonia, Latvia, Bulgaria, Ukraine, Lithuania, and Serbia.19
The results in Table 5 (columns 3 and 4 for a pooled panel and 7 and 8 for a panel with fixed effects) confirm the links between currency mismatch and growth during the recent boom and bust cycle in emerging economies. The change in currency mismatch enters positively and is statistically significant at the 5 percent level in all specifications. This suggests that emerging economies that were increasing their currency mismatch during the precrisis period were growing faster. However, these economies were hit harder by the recent crisis, as suggested by the negative and statistically significant estimate of the interaction term of the lagged change in currency mismatch with the crisis dummy. The interaction term of the current value of currency mismatch with the crisis dummy is not always significant, as some countries were forced to reduce their currency mismatch during the crisis. These results hold even when we control for the change in the external debt-to-GDP ratio.
The estimates in the last regression in Table 5 suggest that a country that was increasing its currency mismatch by 5.7 percentage points each year in the sample period (equal to one standard deviation for this sample), would have higher GDP by up to 1.8 percent at the end of the period than a country that kept its currency mismatch the same, including during the crisis.
These results are confirmed by a cross-country growth regression that regresses average per capita PPP-adjusted GDP growth during 2000-2009 on standard determinants of growth as well as the change in currency mismatch.20 Table 6 shows that the
������������������������������������������������������������18 The results for emerging Europe are robust if we use the currency mismatch measure with IFS net foreign assets data instead of data from Haver Analytics. 19 This figure uses the IFS data for NFA for the additional 19 emerging economies. 20 These controls include the log of the initial per capita PPP-adjusted GDP, the age dependency ratio, the ratio of investment-to-GDP, the ratio of trade-to GDP, the inflation rate, the growth rate of the terms of trade, and a dummy variable for Europe. The period starts in 2000, because of missing values for the currency mismatch measure in earlier years. For 2009, we include projections from the IMF’s WEO database. The change in the currency mismatch is for the period 2000-2008 (the results are robust if we limit the whole sample to the period 2000-2008).

15��
change in the currency mismatch measure enters positively and statistically significant at the 5 percent level in all specifications. The first regression suggests that controlling only for initial per capita GDP, countries that increased their currency mismatch the most during this decade grew faster. The second and third regressions show that this result holds even after controlling for the standard growth determinants in the literature. The fourth regression suggests that increasing currency mismatch was positively linked to growth even outside east Europe. Finally, the last regression shows that the growth effect of currency mismatch persists even after controlling for the change in the external debt-to-GDP ratio—which does not enter significantly.
These effects of currency mismatch are economically significant. The estimates suggest that a country that increased its currency mismatch by 17.8 percentage points during this period (equal to one standard deviation) would have higher annual GDP per capita growth by about 0.4 percent (or higher by 4 percentage points by the end of the sample period) than a country with unchanged currency mismatch. This number includes the growth collapse during the recent crisis. It remains to confirm whether this result will still hold after data on the recovery period is available.
�
5. Currency Mismatch and Firm Performance
The theoretical section explains why currency mismatch should be viewed as a mechanism that relaxes credit constraints, especially those of agents with no access to international capital markets, and that such relaxation might lead to faster growth, but might also generate financial fragility. The previous section investigates whether these aggregate effects of currency mismatch are present in the data. This section investigates whether the theoretical mechanism is operative at the microeconomic level. Namely, the section investigates whether currency mismatch relaxes borrowing constraints and increase growth across sets of firms that arguably are the most credit constrained—i.e., small firms in non-tradables sectors—but not across large firms.
In our model, currency mismatch increases growth because domestically oriented firms in financially constrained sectors that take on currency mismatch: (i) face lower interest rates; and (ii) grow faster than similar firms with no currency mismatch. Here, we examine whether during tranquil times firms with a currency mismatch face lower borrowing costs and grow faster than firms with similar characteristics, but without a currency mismatch.
For the firm-level regressions to be consistent with the model, it is necessary that firms with similar characteristics chose different levels of currency mismatch. This dichotomy emerges in the risky equilibrium of our model because in such equilibrium there can exist a small subset of borrowers that choose not to take on currency mismatch. This is because while a majority of borrowers expect a bailout in case of crisis, this minority set does not expect a bailout. As long as this subset is small enough, a risky equilibrium exists because a bailout will indeed be granted during a crisis—as a critical mass of borrowers will default. It follows that in a risky equilibrium there can be two firms with the same observable characteristics, but with different bailout expectations. One firm will take on currency-mismatch and enjoy lower interest rates than the other firm that does not take on currency mismatch, and so will be able to grow faster during no-crisis times. The firm-level regressions in this section assess whether this difference in interest rates and growth is present in the data, after controlling for a large number of observable firm characteristics.21
The sample includes around 10,000 firms in Central and Eastern Europe and in former Soviet republics, surveyed by the
������������������������������������������������������������

16��
EBRD in 2005 and 2008 through the Business Environment and Enterprise Performance Survey (BEEPS).22 An advantage of this survey over existing stock-market based data sets is that it is representative of all sectors in the economy and covers stock-market listed as well as non-listed firms.23 A drawback, however, could be that the information on sales and terms of borrowing have been collected through questionnaires and interviews, rather than observed in audited balance sheets and financial statements.24
We proceed in three steps. First, we form subsets of firms with similar characteristics and identify firms for which currency mismatch is clearly observable. Second, we analyze the link between currency mismatch and the terms of borrowing. And third, we measure the effect of currency mismatch on firm growth, while controlling for a large number of factors that could also determine the decision to borrow in foreign currency and firm performance. We use two empirical approaches: a simple linear regression framework and a propensity score matching technique that explicitly accounts for the possible endogeneity of currency denomination.
Most of the results are based on the 2005 EBRD BEEPS survey. However, we also take advantage of the 2008 survey to estimate a panel regression and look at the impact of currency mismatch in 2004-2005 on the growth performance of firms during 2005-2008.25
5.1 Sets of Firms with Currency Mismatch
We classify a firm as having currency mismatch if it has debt denominated in foreign currency that is not backed by foreign revenues. In order to make meaningful inferences, we analyze the effects of currency mismatch across sets of firms with similar characteristics, and test whether the effect of currency mismatch is stronger in certain subsets of firms. To this end, we consider only firms with debt on their books, and partition this set into different subsets that capture the sector, size and access to external finance.
With respect to the sector, we consider two sets of firms with currency mismatch: firms with sales that come only from non-tradables sectors and firms that do not export.26 In the second set, the lack of foreign currency revenues is determined by the lack of exports, which could be correlated with firm-specific characteristics that are related to performance and access to financial markets.27 Because of this, we take the set of non-tradables firms to be our preferred set. Furthermore, since firms in non-tradables sectors can have some exports--e.g., tourism--we also consider a third more restricted set of non-tradables firms with zero exports. Within each of these three sets of firms, we consider two subsets. The first set includes firms with debt denominated in foreign currency, which form the “treated group”. The second set includes firms with debt denominated in domestic currency, which form the “control group”.
Regarding size, we partition the set of firms according to whether they are small—have less than 100 employees—or they are
������������������������������������������������������������22 Table 12, panel 2 presents the descriptive statistics for the variables used in the regression analysis of this section.
23 Much of the literature on the impact of currency mismatch in Latin America and East Asia (e.g. Allayanis et al. (2003), Bleakey and Cowan (2006, 2009)) uses samples of firms listed in the stock market and concludes that balance sheet effects associated with currency mismatch was a relatively minor issue. An exception is Kamil (2010) who uses a sample of listed and non-listed firms in Latin America and finds that pegged regimes are associated with a higher degree of currency mismatch. This later finding suggests that pegged regimes, by providing an implicit guarantee, encourages risk-taking, as our theoretical mechanism implies.
24�Note our dataset benefits from some recent cleaning of the 2005 sales data performed by the World Bank, when the 2002-2008 panel version of the BEEPS data was put together. �
25 We do not use the 2002 EBRD survey, because the question about foreign currency debt was different (see below).
26 The list of non-tradable sectors is presented in Table A.1 in the appendix. The largest non-tradables sectors by number of firms are wholesale retail and repair, and construction.
27This is the selection into exports effect (see Melitz, 2003).

17��
large—have more than 100 employees. The small firms are the most likely to be credit constrained and dependant on bank financing.
Regarding access to external finance, we partition the set into those firms that are either listed in the stock market or are state-owned, and those firms that are privately held.28 Listed firms have direct access to financing through equity markets. State-owned or quasi-public firms could also have access to special sources and terms of borrowing.
The 2005 survey includes 10,421 firms in 28 countries,29 3,910 of which have at least one loan on their book: 2,955 firms have their last loan denominated in domestic currency and 955 firms in foreign currency. Out of this sample, 1,772 firms are in the non-tradable sector, 2,739 are small firms, 2,545 do no export and 3,325 firms are privately held and not listed.
The 2005 EBRD survey reports only the currency denomination of the last loan for firms that have at least one loan on their books. We therefore assume that the denomination of the last loan reflects the denomination of the debt stock. Although this could be considered to be a strong assumption, the survey information on the last loan may be more reliable than information on the debt stock, with the latter possibly based on the memory of those answering the survey rather than on actual data.30 One could also consider the results as evidence from a cross-section on the determinants of the latest borrowing terms—interest rate and maturity—based on actual (last) loans, rather than “average information” on borrowing conditions during recent years. For similar reasons, for example, the Survey of Small Business Finances (SSBF) performed by the US Federal Reserve also asks only the information on the last loan. However, one potential pitfall when we analyze the link between currency mismatch and growth in sales between two periods is that the last loan might have been contracted after the initial period. For this reason, we perform a robustness test computing growth in sales between 2005 and 2008, and using the last loan reported in the 2005 survey.
5.2 Empirical Methodology
Challenges in identifying the impact of currency mismatch on the borrowing conditions and performance of firms include dealing with possible endogeneity and omitted variable biases and with the non-randomness of the choice of currency denomination. In particular, one would need to control for variables that jointly determine the choice of currency denomination and the terms of borrowing, or firm performance. Our identifying assumption is that after controlling for observable characteristics, there is an unobservable random component that affects the choice of currency mismatch and is uncorrelated with future growth performance. In our model, this unobservable component corresponds to differences in bailout expectations. By analyzing the differential effect of currency mismatch across different sets of firms, our empirical approach already imposes some identifying restrictions. First, it looks at how firm performance is affected by currency mismatch, rather than by foreign borrowing more broadly. Second, it includes only firms with debt on their books, thus controlling for access to external debt finance. Third, it analyzes the effects of currency mismatch across different subsets of firms, including small nontradables firms, a set in which, arguably, currency mismatch relaxes borrowing constraints the most.
We start our empirical exercise by running two sets of linear regressions. In the first set, we regress the interest rate and the maturity of the loan on an indicator of currency mismatch and a set of firm-specific and loan-specific variables. In the second set, we run standard firm-level growth regressions with two alternative sets of control variables. In addition, we include a large array of fixed effects. We control for country-specific fixed effects, industry-specific fixed effects and, in the most stringent
������������������������������������������������������������28 There are very few non-tradable firms with less than 100 employees that are listed. 29 Albania, Armenia, Azerbaijan ,Belarus Bosnia , Bulgaria, Croatia, Czech Rep., Estonia, Macedonia FYR, Georgia, Hungary, Kazakhstan, Kyrgyz, Latvia, Lithuania, Moldova, Montenegro, Poland, Romania, Russia, Serbia, Slovakia, Slovenia, Tajikistan, Turkey, Ukraine and Uzbekistan. 30 Indeed, the answer to this question in the 2005 survey seems more reliable than the more general question asked in the 2002 survey, which was about the share of foreign currency borrowing in the stock of debt.

18��
configuration, for country-industry fixed effects. The latter fixed effects control for the demand for goods and services in a specific industry and in a specific country. This is especially relevant for non-tradable firms whose demand is essentially domestic.
In order to address some of the shortcomings of the linear regression framework and to test for a causal relationship between currency mismatch and terms of borrowing or firms’ performance, we implement a propensity score matching procedure. This procedure is designed to explicitly match firms that are similar in their likelihood of having a currency mismatch. The basic idea of propensity score matching is based on a simulation of a randomized experiment, in which we pair "treated" firms with "control" firms with similar characteristics that could affect the likelihood of having a currency mismatch and the outcome of currency mismatch. We then compare the means, across the treated and the control group, of the outcome variables of interest: interest rate, maturity, growth in sales, and growth in employment.
One desirable feature of a matching framework is that the observations used to estimate the causal effect are selected without reference to the outcome, as in a controlled experiment. One important assumption however is that, conditional on the variables used to perform the matching, the expected value of the variable of interest, in the absence of currency mismatch, would be the same for the treated and the control firms that have been paired together. If this assumption holds, we should expect to see the control firms as identical twins of the treated firms, if the latter had not received treatment. Thus, the difference between the treated and control firms would be an appropriate estimate of the effect of currency mismatch—the treatment effect.31
The basic econometric results supporting matching through a propensity score—defined as the probability of treatment conditional on the observables—are derived in Rosenbaum and Rubin (1983) and discussed in details in the appendix of Levchenko, Ranciere and Thoenig (2009).
5.3 Linear Regression Results
5.3.1 Terms of Borrowing
Under our theoretical mechanism, currency mismatch enables firms to borrow at a lower interest rate by allowing their lenders to exploit the implicit subsidy in systemic bailout guarantees. In the 2005 survey, firms report the currency denomination of their last loan, as well as its other characteristics. We regress the interest rate on the last loan on the currency denomination of that loan and two sets of controls: first, firm-specific controls, such as sales and years of operations; and second, loan-specific characteristics related to the collateralization of the loan. As discussed above, each specification is estimated for a different array of fixed effects: (i) country-specific fixed effects; (ii) country-specific and industry-specific fixed effects; and (iii) country-industry-specific fixed effects.
Table 7 reports the results for the set of small non-tradables firms. The estimates suggest that interest rates on foreign currency loans are between 2 and 2.5 percent lower than the ones on domestic currency loans. This effect is significant at the 1 percent level and holds in all the specifications. The control variables have the expected sign, with larger and older firms paying a lower interest rate. Additional controls capturing the effect of collateral reduce the estimated difference between foreign and
������������������������������������������������������������31�The PSM methodology has two major advantages over OLS: (i) The PSM allows estimation of the average impact of currency mismatch without arbitrary assumptions about functional forms and thus can account for both non-linear and interaction effects; (ii) By imposing a matching–that is certain degree of similarity between treated and control observation–the PSM methodology is likely to produce estimates that are less biased and robust to miss-specification of the regression function than estimates based on full unmatched samples. �

19��
domestic currency interest rates by only 0.3 percentage points.32 33
A possibility is that the difference in interest rate between domestic and foreign currency loans reflects the expected rate of currency depreciation. In order to control for this effect, we use data on one-year ahead currency forecasts for 14 countries in Emerging Europe from Consensus Forecast, Inc. to compute domestic interest rates that are adjusted for expected currency depreciation. We then re-estimate firm-level regressions on the effect of foreign currency borrowing on interest rate. The results are presented in Table 8. Our baseline effect – foreign currency borrowing makes foreign borrowing cheaper – is robust to this adjustment. The effect is actually slightly larger. The reason is that in 2005, market participants were on average forecasting an appreciation of many currencies in Emerging Europe.
The BEEPS survey does not provide information on the size of the loan and therefore we cannot test whether currency mismatch is associated with larger loans, as our theoretical framework would predict. However, we can use the maturity of the last loan as a proxy for the “commitment” made by the lender. We thus test whether loans associated with currency mismatch exhibit a longer maturity. We use the same specification as for the interest rate and repeat the exercise on the same three sets of firms.
The estimates confirm the role of currency mismatch in relaxing borrowing conditions. Table 9 shows that foreign currency loans to non-tradables firms have a maturity of 7 to 10 months longer than loans in domestic currency. This difference is statistically significant at the 1 percent level.34
The results presented above indicate that currency mismatch is associated with better terms of borrowing as predicted by our theortical mechanism. The interest rate regressions are a direct test of our model. The result that risk-taking through currency mismatch is associated with lower interest rate implies that currency mismatch is associated with some form of implicit subsidy. The loan maturity regression is less of a direct test of our model and therefore alternative interpretations of the results are possible. For example, banks could be extending longer maturity loans in foreign currency because they are also funded in foreign currency at longer maturity.
5.3.2 Growth in Sales
Our theoretical framework implies that in tranquil times, firms with a currency mismatch outperform firms without a currency mismatch. The 2005 BEEP survey allows us to test this hypothesis, as it provides the cross-sectional information on the currency denomination of the last loan, as well as time series information on three-year growth performance between 2001 and 2004. We estimate the following standard firm growth regression:
, , 3 , 3 , ,ln ln lni t i t i t i i t i ty y y CM X� � � �� �� � ,
where tiy ,ln is the firm’s sales, CM is a dummy variable equal to 1 if the firm’s last loan is denominated in foreign currency,
������������������������������������������������������������32 Adding the maturity of the loan to the regression does not change the results. The effect of the maturity variable is close to zero and insignificant. Results are available upon request. 33 The results in Table A.2 in the unpublished appendix for the smaller set of small non-tradables privately held non-listed firms with zero exports are very similar. This is also the case for the set of non-exporting small firms in Table A.3 in the appendix.
34 Similar effects are shown in Table A.4 in the unpublished appendix for the set of small non-tradables privately held non-listed firms with zero exports. For the set of small non-
exporting firms, the difference in maturity is 10 to 12 months, as shown in Table A.5 in the appendix.

20��
X is a set of firm-specific control variables, � is a set of fixed effects and ti ,� is the residual error term. Three combinations of fixed-effects are introduced: country-specific fixed effects, country and industry specific fixed effects, and country-industry fixed effects. Two sets of controls are considered. The simple control set includes firm’s years of operations and initial sales. The comprehensive control set includes initial productivity, the share of foreign inputs in total production inputs and two measures of the quality of the workforce: the share of skilled workers and the share of workers with a university degree. 35
Table 10 presents the results for the sample of small non-tradable firms. The first three regressions are performed with the simple control set for the three combinations of fixed effects. The next three regressions include the comprehensive set of control variables. In all regressions, the currency mismatch indicator is positive and statistically significant at either the 1 or 5 percent level. On average, firms with a currency mismatch outperform firms without a currency mismatch by 6.6 to 8.8 percentage points, which are 2.2. to 2.9 percentage points per year. Similar estimates are obtained for the smaller set of small, non-listed and privately held nontradables firms, with no exports.36
While results for the set of small non-exporting firms broadly confirm the above findings, the growth effect of currency mismatch is reduced by around half and is only significant in 3 out of 6 regressions.37 This result could be driven by non-exporting firms in the manufacturing sector. The lack of exports in a manufacturing sector firm could be associated with a lower growth potential. Arguably such firms benefit less from investing and taking on risk through currency mismatch
5.3.3. Large Firms
Large firms are less likely than small firms to be credit constrained. Thus, under our theoretical mechanism, taking on currency mismatch should have less pronounced effects in large nontradables firms than in small nontradables firms. The estimates in Table 11 clearly show that this is the case. In the set of large nontradables firms, currency mismatch does not have a statistically significant impact on the interest rate paid by firms or their growth performance.
This finding is consistent with the literature on firm size and credit constraints. Guiso, Sapienza, and Zingales (2004) find that financial development helps small firms more than large firms in Italy. Beck, Demirgurc-Kunt, and Maksimovic (2005) using survey data find that the negative impact of reported obstacles on firm growth is stronger for small firms than large firms. Beck, Demirgurc-Kunt, Laeven and Levine (2008) using cross-industry, cross-country data, find that financial development exerts a disproportionately positive effect on small firms.
5.3.3 Robustness Tests
Uneven sampling
A potential issue is the uneven sampling of firms with respect to the population of firms across different countries. We propose here a test of robustness of our results to uneven sampling that follows Woolridge (2001, Chapter 17.)
Since we do not have information of firm demographics for many of the countries in the sample, we characterize over and under sampling in terms of the share of the labor force surveyed. First, we compute for each country the total number of employees in the firms surveyed. Second, we compute the ratio of the surveyed labor force to the total labor force in each
������������������������������������������������������������35 The share of foreign input is likely to be a determinant of foreign currency loans.36 See Table A.6 in the unpublished appendix. 37 See Table A.7 in the unpublished appendix.

21��
country using World Development Indicator data for 2005. Third, we re-estimate our baseline regressions for interest rates and sales using a weighted least square estimator (WLS), using as weights the inverse of the ratio of surveyed to total labor force. The results confirm the findings of OLS regressions.38
Reverse Causality
Because we regress past growth in sales on the maturity on the last loan, our growth results are subject to potential reverse causality running from growth performance to currency denomination of loans. To address this issue, we combine in a single panel the 2005 and the 2008 surveys, retaining only firms that have been surveyed in both surveys. An advantage of this approach is that we can assess the growth performance of firms that had a currency mismatch in 2004 over the subsequent period 2004-2007. As currency mismatch is predetermined in this case, this robustness test controls for potential reverse causality. A drawback is that by combining the two panels, the number of firms is reduced from 998 to 241 in the case of small non-tradable firms. Moreover, the inclusion of firms in both surveys may not be random. Note also that having initial currency-mismatch does not fully solve for endogeneity, as unobserved information on future growth potential can affect current borrowing choices.
We estimate specifications for: the set of small non-tradable firms (including country-specific fixed effects or country-specific fixed effects and industry-specific fixed-effects); and the set of small, non-listed, privately held non-tradable firms. In all specifications, firms with a currency mismatch at the beginning of the period experience a much stronger growth performance in the subsequent period, confirming the above results. This effect is significant at the 1 percent level and it is three times larger than the above estimates.39
5.4 Propensity Score Matching Results
The linear regression framework deals with selection issues by including control variables and fixed effects. Therefore the results might not be robust in the presence of non-linear and interaction effects. In contrast, propensity score matching by explicitly matching firms that are similar in their likelihood of having a currency mismatch does not impose any functional form. The basic idea of propensity score matching is based on a simulation of a randomized experiment in which we pair "treated" firms with "control" firms with similar characteristics that could affect the likelihood of having a currency mismatch and the outcome of currency mismatch.40
The propensity matching procedure follows three steps. In the first step, we use a logit model to estimate the probabilities of a currency mismatch, which we call the propensity scores, for the sample of small non-tradables firms. The logit is based on firms’ characteristics and fixed effects.41 Next, following Dehejia and Wahba (2002), we group observations into intervals with similar propensity scores—referred to as propensity score strata—and test whether the means of each right-hand side variable do not differ across treated and non-treated units within each stratum.42 In the third step, we construct the relevant control group for each treated firm using a proximity measure based on propensity scores and compare the mean of the
������������������������������������������������������������38 See Table A.9. in the unpublished appendix. 39 See Table A.10. in the unpublished appendix.
�41 To make the results comparable with the results from the linear regression, we use the same set of control variables in the logit specification: years of operations, past sales and country-fixed effects. The specification is consistent with the findings of Brown, Ongena and Yesin (2009), who stress the importance of country-specific factors in explaining foreign currency borrowing. Similar results are obtained with country-industry fixed effect.
42 This is a test of the balancing hypothesis, which needs to be verified for the Rosenbaum and Rubin (1983) theorem to be valid.
22��
outcome variables of interest for the treated and the control group.43 For the proximity measure, we use the kernel matching estimator proposed by Heckman, Ichimura and Todd (1998).
The results are presented in Table 12 and indicate for each outcome—growth in sales, employment, interest rate and maturity—the difference in means for the treated group and the control group. Two control groups are considered: (i) a “naïve” control group that includes all firms without currency mismatch and thus does not deal with selection issues, and (ii) the matching-based control group. When the matching-based control group is used, the difference in means of outcome between the treated and control group measures the average treatment effect on the treated group.
For the growth in sales, the mean differences are similar for both control groups. The matching estimator reports a 7.9 percentage points difference between treated and control firms, which is 2.6 percentage points per year. This estimate is strikingly similar to the estimates obtained in the linear regressions in Tables 4.1, 4.2, 4.3. For the growth in employment, accounting for selection reduces the difference between control and treated groups from 14 to 10 percentage points. However, the difference remains statistically significant at the 10 percent level. For the interest rate, matching similar leads to a higher difference in interest rates between treated and control firms (2.7 vs. 1.8 percent). For the maturity, the average treatment of treated firms is 10 months and is statistically significant at the 1 percent level.
In order to understand the role played by the matching procedure and the correction for the selection effect, we can compare the PSM results to the results obtained by using an unmatched control group. In this case, the effect on sales is slightly lower (+6.6. percentage points vs. +7.0 percentage point) as well as the effect on interest rate (-1.99 percentage points versus -2.81 percentage points).
In sum, the results obtained with the Propensity Score Matching method point in the same direction as the regression results. Under both methods, taking on currency mismatch reduces the interest costs of firms and improves their growth performance.
6. Conclusions and Policy Implications
This paper has explored the dual role of currency mismatch. On the one hand, taking on currency risk relaxes borrowing constraints and could have a positive impact on growth. On the other hand, it could be a source of systemic risk, as it makes large parts of the economy prone to a crisis in case of a real depreciation. At the aggregate level, we found that increases in currency mismatch are associated with faster economic growth, even after we control for the recent crisis and its growth costs. At the firm level, we found that currency mismatch helps constrained firms that otherwise would not have been able to fund profitable projects—small firms and the nontradables sector.
This evidence, however, does not justify excessive risk taking. Large increases in currency mismatch in relatively financially developed countries—such as Poland or the Czech Republic—will not necessarily lead to faster growth. Furthermore, lending booms that simply finance consumption or overinvestment are not desirable. Indeed, we find groups of firms for which undertaking currency mismatch is not associated with faster growth—large firms in the nontradables sector—or for which the growth effect is considerably smaller and in some cases insignificant—non-exporting firms in the manufacturing sector. Therefore, currency mismatch should be considered as a second-best, allowing financially constrained sectors to borrow and finance potentially profitable projects. The first-best is better enforceability of contracts that help deepen financial markets.
Systemic bailout guarantees, which is a key assumption of the theoretical framework in the paper, are often implicit. In the face of generalized defaults, governments face enormous pressure for a bailout regardless of whether a too-big-to-fail firm
������������������������������������������������������������43 The resulting effect is called the average treatment on treated.

23��
goes bust or a critical mass of small borrowers does so. This endogeneity has been revealed by the fact that all crisis-hit countries in emerging Europe granted bailouts despite differences in their policy regimes. Bailouts took several forms and were financed with the help of IMF and EU loans, foreign governments’ support as well as private sector involvement through the “Vienna initiative.” Very much like in the spirit of our model, this initiative was launched when it appeared that the depth of the crisis would depend on coordination--or lack of thereof--between lenders. The Vienna initiative avoided the halt of new lending and the fire-sale of assets that would have followed had banks pulled out of a country in panic (Bergloff, 2009). Foreign mother banks agreed to roll-over the exposure of their subsidiaries in emerging Europe, as the IMF made loans and the EBRD made bank equity injections de facto contingent on agreements to rollover bank debt. In addition, the countries of the mother banks’ allowed them to use some of the national bailout money to recapitalize their subsidiaries in Eastern Europe. In some countries, such as Latvia, the bailout took the form of supporting an otherwise unsustainable currency peg. The use of international reserves to defend the currency is analogous to a bailout, as it allows creditors to exit the country without suffering the effect of currency depreciation.
The bailout, however, has not prevented a credit crunch. While domestic firms' balance sheets were not directly hit by a large nominal depreciation and generalized bankruptcies did not take place, the expectation of future real appreciation ceased to exist. As the theoretical section of this paper explains, a lending boom equilibrium with an appreciating real exchange rate is supported by–implicit or explicit—systemic bailout guarantees. After the crisis, the likelihood of a new bailout in case of a future crisis fell considerably, and so borrowing constraints became tighter. A downward feedback-loop mechanism started: less credit leads to less demand for nontradables, like real estate, which in turn puts downward pressure on nontradables prices, which reduces collateral values, which further reduces credit, and so on. The Vienna Initiative has successfully avoided a sharp real depreciation and generalized bankruptcies. However, one should not expect that it will stop the credit crunch, the associated real depreciation and the decline of the nontradables sector relative to the tradables sector that typically occurs during a crisis.
Although the experience of emerging Europe has some parallels with the dollarization of Argentina in 1990s, there are fundamental differences. Dollarization regimes were introduced in Latin America to impose fiscal discipline by limiting the ability governments to influence the monetary base. As we now know, these policies generally failed to generate fiscal discipline in those countries. Although some emerging European economies did have currency boards or fixed regimes, some others had floating regimes. Moreover, in both cases, fiscal deficits remained under control before the crisis, while some economies even had surpluses.
A lesson from emerging Europe is that to avoid excessive crisis costs, governments should have enough reserves—or have lined up external lines of credit—to cover the potential rollover requirements of the financial system that would realize if a crisis were to materialize. These lines of credit permit fiscally sound governments to smooth the effects of rare financial crises by allowing them to access financing and repaying by taxing during good times.
Using our de-facto measure we have found that currency mismatches tend to be much larger than other measures that do not control for indirect mismatches in the banks’ balance sheets. It follows that in assessing systemic risk, policymakers should monitor not only mismatches in banks’ balance sheets, but should also look for indirect imbalances via the ability of banks’ borrowers to repay debts.
Even if some degree of macro-prudential regulation to limit foreign currency borrowing might appear desirable to avoid excessive risk-taking, its implementation is far from straightforward. In the presence of incentives to take on excessive risk, agents will eventually find ways around regulations. Indeed, prudential regulations in emerging Europe before the crisis required banks to match their foreign currency assets and liabilities and were formally satisfied by banks, as they were borrowing and lending in foreign currency. However, many of the recipients of such bank loans were not hedged. When

24��
regulators in some countries identified this indirect exposure of banks to exchange rate risks, they imposed stricter prudential regulations, reserve requirements, and direct restrictions on foreign currency borrowing by banks—for example in Croatia and in Romania—and, in some cases, on the amount of foreign currency loans or total credit that banks could extend—for example, in Bulgaria and in Croatia. Interestingly, banks often responded to such restrictions by helping their customers receive direct loans abroad—often with a letter of guarantee. From a systemic perspective, it made no difference whether the foreign currency loan came directly from abroad or was intermediated through domestic banks. As this paper has argued, the driving force was the underlying incentives for such currency mismatch, such as bailout guarantees.
Finally, an inconvenient paradox of financial regulation is that it could reach the wrong target, harming the more financially constrained agents in the economy—those benefiting the most from risk-taking—without disciplining the agents that are the source of excessive risk-taking.44 Following the recent crisis, governments around the world are considering new financial regulations to address systemic risks. At the same time, credit for new firms with investment opportunities that could help spur economic growth remains limited. Therefore, a key challenge for new regulations is to prevent the buildup of vulnerabilities that could lead to a financial crisis, without strangling healthy risk-taking by bank-dependent firms.
References
Allayannis, Georges, Brown, Gregory and Leora F. Klapper, (2003), "Capital Structure and Financial Risk: Evidence from Foreign Debt Use in East Asia," Journal of Finance, 58(6):2667-2710.
Arteta, Carlos O. (2003), “Are Financial Dollarized Countries More Prone to Costly Crises?” International Finance Discussion Paper 763, Board of Governors of the Federal Reserve System.
Arteta, Carlos O. (2005), “Exchange Rate Regimes and Financial Dollarization: Does Flexibility Reduce Currency Mismatches in Bank intermediation?” B.E. Journal of Macroeconomics: Topics in Macroeconomics, vol. 5(1), pp. 1-28.
Árvai, Zsófia, Driessen, Karl and Ötker, Inci (2009), “Regional Financial Interlinkages and Financial Contagion Within Europe,” IMF Working Paper 09/6 (Washington: International Monetary Fund).
Barro, Robert, and Xavier Sala-í-Martin (2004), Economic Growth, second edition. New York: McGraw Hill. We don’t cite this
Beck, Thorsten, Asli Demirguc-Kunt, and Vojislav Maksimovic (2005), “Financial and Legal Constraints to Firm Growth: Does Firm Size Matter?” Journal of Finance, 60, 137–77.
Beck, Thorsten, Asli Demirgurc-Kunt, Laeven, Luc and Ross Levine (2008), “Finance, Firm Size, and Growth.” Journal of Money, Credit and Banking, 40(7), 1371-1405
Berglof, Eric (2009), “Declare Victory and Fight On”, VOX-EU.
Bleakley, Hoyt and Kevin Cowan,(2006), “Corporate Dollar Debt and Depreciations: Much Ado About Nothing”, Review of Economics and Statistics, 90(4): 612-626
Bleakley, Hoyt and Kevin Cowan, (2009), “Mishmash on Mismatch? Balance-Sheet Effects and Emerging-Markets Crises.” , mimeo University of Chicago
������������������������������������������������������������44 See Forbes (2007) for a demonstration of this point in the case of Chile.

25��
Brown, Martin & Ongena, Steven & Yesin, Pinar (2009), "Foreign Currency Borrowing by Small Firms," mimeo, Swiss National Bank
Calvo Guillermo, Alejandro Izquierdo and Luis-Fernando Mejía (2008), "Systemic Sudden Stops: The Relevance Of Balance-Sheet Effects And Financial Integration," NBER Working Papers 14026.
Dehejia, Rajeev, Sadek, Wahba, (2002), “Propensity score matching methods for nonexperimental causal studies”, Review of Economics and Statistics 84, 151–161.
Eichengreen, Barry, Ricardo Hausmann and Ugo Panizza (2007), “Currency Mismatches, Debt Intolerance, and the Original Sin: Why They Are Not the Same and Why It Matters,” in Capital Controls and Capital Flows in Emerging Economies: Policies, Practices and Consequences, edited by Sebastian Edwards, NBER, University of Chicago Press.
Forbes, Kristin, 2007, One Cost of the Chilean Capital Controls: Increased Financial Constraints for Smaller Traded Firms. Journal of International Economics, 71:294-323.
Goldstein, Morris and Philip Turner (2004), Controlling Currency Mismatches In Emerging Markets, Institute of International Economics, Washington.
Guiso, Luigi, Paola Sapienza, and Luigi Zingales (2004), “Does Local Financial Development Matter?” Quarterly Journal of Economics, 119, 929–69.
Heckman, James, Hidehiko Ichimura, Jeffrey Smith and Petra Todd (1998), "Characterizing Selection Bias Using Experimental Data," Econometrica, 66(5): 1017-1098.
Hilaire, Alvin and Anna Ilyina (2007), “External Debt and Balance-Sheet Vulnerabilities in Croatia,” in Republic of Croatia: Selected Issues, (Washington: International Monetary Fund).
Hilbers, Paul Louis Ceriel, Inci Ötker, Ceyla Pazarbasioglu, and Gudrun Johnsen (2005), “Assessing and Managing Rapid Credit Growth and the Role of Supervisory and Prudential Policies,” IMF Working Paper 05/151 (Washington: International Monetary Fund).
Kamil, Herman (2004), “A new Database on the Currency Composition and Maturity Structure of Firms’ Balance Sheets in Latin America, 1990-2002: Definition of Variables, Methodology of Construction and Data Sources,’ Inter-American Development Bank Database, http://www.iadb.org/res/pub_desc.cfm?pub_id=DBA-001.
Kamil, Herman (2010), “How do exchange rate regimes affect firms’ incentives to hedge currency risk in emerging markets?”, Washington, D.C., International Monetary Fund, unpublished.
Levchenko, Andrei, Romain Ranciere, and Mathias Thoenig (2009), “Growth and Risk at the Industry Level: The Real Effects of Financial Liberalization,” Journal of Development Economics, Volume 89, Issue 2, pp 210-222.
Marc J. Melitz, 2003. "The Impact of Trade on Intra-Industry Reallocations and Aggregate Industry Productivity," Econometrica, 71(6): 1695-1725
Prat, Stephanie (2007), “The relevance of currency mismatch indicators: an analysis through determinants of emerging market spreads,” Economie Internationale, No 111(3).
Ranciere, Romain and Aaron Tornell (2009), “Systemic risk and the US Financial Crisis,” mimeo.
Rosenbaum, P. R., and Rubin, D. B. (1983), "The Central Role of the Propensity Score in Observational Studies for Causal Effects," Biometrika 70, 41–55.

26��
Rosenberg, Christoph, Ioannis Halikias, Brett House, Christian Keller, Jens Nystedt, Alexander Pitt and Brad Setser (2005), “Debt-Related Vulnerabilities and Financial Crises: An Application of the Balance Sheet Approach to Emerging Market Countries,” IMF Occasional Paper 240 (Washington: International Monetary Fund).
Rosenberg, Christoph and Marcel Tirpak (2009), “Determinants of Foreign Currency Borrowing in the New Member States of the EU,” Journal of Economics and Finance, vol. 59 (3), pp 216-228.
Schneider, Martin and Aaron Tornell (2004), “Balance Sheet Effects, Bailout Guarantees and Financial Crises,” The Review of Economic Studies.
Sorsa, Piritta, Bas Berend Bakker, Christoph Duenwald, Andrea M. Maechler, and Andrew Tiffin (2007), “Vulnerabilities in Emerging Southeastern Europe—How Much Cause for Concern?” IMF Working Paper 07/236 (Washington: International Monetary Fund).
Vamvakidis, Athanasios (2009), “Convergence in Emerging Europe: Sustainability and Vulnerabilities,” Eastern European Economics, vol. 47(3), pp. 5-27.

2,0
4,0
6,0
8,0
10,0
Figu
re 1
. Rea
l per
cap
ita G
DP
grow
th in
em
ergi
ng e
cono
mie
s, 20
04-2
009
2004
-07
2008
2009
-6,0
-4,0
-2,00,0
Emer
ging
Asi
aEm
ergi
ng E
urop
eSu
b-Sa
hara
n A
fric
aLa
tin A
mer
ica
Mid
dle
East
And
Nor
th
Afr
ica
Sour
ce: I
MF
WEO
dat
abas
e

300
40,0
50,0
60,0
70,0
80,0
90,0
100,
0
Figu
re 2
. Ban
k lo
ans i
n fo
reig
n cu
rren
cy in
per
cent
of t
otal
ban
k lo
ans,
emer
ging
Eur
ope,
200
7
0,0
10,0
20,0
30,0
Sour
ce: I
MF,
Dat
abas
e of
Vul
nera
bilit
y Ex
erci
se fo
r Em
ergi
ng E
cono
mie
s

60Fi
gure
3. C
urre
ncy
mis
mat
ch in
em
ergi
ng E
urop
e, 1
998-
2008
1998
(ore
arliestaailable)
Rom
ania
Cro
atia
40
1998
�(or�e
arliest�available)
2008
Est
onia
Lith
uani
a
Hun
gary
Pol
and
20
Latv
ia
Lith
uani
a
Pol
and
0
Latv
ia
Ukr
aine
Cze
ch R
ep.
�20
�40
Bul
garia
�60
Source:Authors'Calculations

0,0
10,0
20,0
30,0
40,0
Figu
re 4
. Cur
renc
y m
ism
atch
es in
em
ergi
ng E
urop
e, w
ith a
nd w
ithou
t adj
ustm
ent
for u
nhed
ged
lend
ing,
200
7
Adj
uste
d fo
r unh
edge
d le
ndin
g
Not
adj
uste
d fo
r un
hedg
ed le
ndin
g
-40,
0
-30,
0
-20,
0
-10,
0
Sour
ce: A
utho
rs' c
alcu
latio
ns

Figure 5. Currency mismatch and the recent boom and bust cycle in emerging Europe
Bulgaria
Croatia
Czech Rep.
Estonia
Hungary
Latvia
Lithuania
Poland
Romania
Ukraine
0
2
4
6
8
10
12
-20 -10 0 10 20 30 40 50
Ave
rage
real
GD
P gr
owth
Change in currency mismatch/assets in banking sector
FIgure 5.1. Currency mismatch and real GDP growth, emerging Europe, 2004-07
Bulgaria
Croatia Czech Rep.
Estonia
Hungary
Latvia
Lithuania
Poland
Romania
Ukraine
0
10
20
30
40
50
60
-20 -10 0 10 20 30 40 5
Cha
nge i
n pr
ivat
e sec
tor c
redi
t/GD
P
Change in currency mismatch/assets in banking sector
Figure 5.2. Currency mismatch and private sector credit, emerging Europe, 2004-07
0
Argentina
Bosnia & Herz.
Brazil
Bulgaria
ChinaCosta Rica
Croatia
Czech Rep.
Egypt
Estonia
Guatemala
HungaryIndonesia
Kazakhstan
Latvia
Lithuania
Mexico
Peru
Philippines
Poland
Romania
Russia
Serbia
Thailand
Turkey
Ukraine
Uruguay
Venezuela
Vietnam
�40
�30
�20
�10
0
10
20
30
40
50
�30 �20 �10 0 10 20 30 40 50 60
Cha
nge i
n cu
rren
cy m
ism
atch
Change�in�private�sector�credit/GDP
Figure 5.3. Private sector credit and currency mismatch, emerging economies, 2004-2007
Bulgaria
Croatia
Czech Rep.
Estonia
Hungary
Latvia
Lithuania
Poland
Romania
Ukraine
-10
-5
0
5
10
15
20
-20 -10 0 10 20 30 40 5
Incr
ease
in th
e pro
duct
ion
of n
ontra
dabl
es
rela
tivel
y to
trad
able
s
Increase in currency mismatch
Figure 5.4. Relative production of nontradable goods and currency mismatch, emerging Europe, 2003-2007
Note: Nontradable production includes services, construction, and other nonmanufacturing industry; tradable production includes manufacturing. Source: World Bank, World Development Indicators.
0
Bulgaria
Croatia
Czech Rep.
Estonia
Hungary
Latvia
Lithuania
Poland
Romania
Ukraine
-25
-20
-15
-10
-5
0
5
-20 -10 0 10 20 30 40 50
Cha
nge i
n cu
rren
t acc
ount
bal
ance
/GD
P
Change in currency mismatch/assets in banking sector
Figure 5.5. Currency mismatch and current account balance, emerging Europe, 2004-07
Bulgaria
Croatia
Czech Rep.
Estonia
HungaryLatvia
Lithuania
Poland
RomaniaUkraine
0
10
20
30
40
50
60
-20 -10 0 10 20 30 40 5
Cha
nge i
n ex
tern
al d
ebt/G
DP
Change in currency mismatch/assets in banking sector
Figure 5.6. Currency mismatch and external debt, emerging Europe, 2004-07
0
Bulgaria
Croatia
Czech Rep.
Estonia
Hungary
Latvia
Lithuania
Poland
Romania
Ukraine
0
5
10
15
20
25
-20 -10 0 10 20 30 40 50
7
Cha
nge i
n cu
rren
t acc
ount
bal
ance
/GD
P,
2007
-201
0
Change in currency mismatch/assets in banking sector, 2004-0
Figure 5.7. Currency mismatch and current account reversal in emerging Europe
Bulgaria
Croatia Czech Rep.
Estonia
Hungary
Latvia
Lithuania
Poland
Romania
Ukraine
-14
-12
-10
-8
-6
-4
-2
0-20 -10 0 10 20 30 40 5
Rea
l GD
P gr
owth
, 200
9
Change in currency mismatch/assets in banking sector, 2004-07
Figure 5.8. Currency mismatch and growth during the crisis in emerging Europe
0

Rea
l per
cap
ita
GD
P gr
owth
/1
Cur
rent
acc
ount
ba
lanc
e/G
DP
Exte
rnal
de
bt/G
DP
Gen
eral
de
ficit/
GD
P
Gen
eral
go
vern
men
t de
bt/G
DP
Shar
e of
pub
lic
sect
or lo
ng-te
rm
exte
rnal
deb
t in
2000
-200
720
0020
0620
0020
0719
9720
0720
0720
0720
0720
0720
07E
mer
ging
Eur
ope
Alb
ania
2,1
35,2
90,5
……
4,1
30,3
-9,1
17,6
-3,8
52,7
96,2
Bel
arus
4,9
……
42,7
56,1
8,3
25,1
-6,8
27,7
0,4
11,5
67,5
Bos
nia
& H
erz.
1,5
21,6
94…
…57
,054
,7-1
2,7
48,4
-0,1
30,1
62,8
Bul
garia
3,2
75,3
80,1
174,
424
3,2
9,3
66,8
-25,
199
,83,
519
,827
,5C
roat
ia1,
684
,190
,811
9,4
235,
037
,372
,1-7
,683
,4-1
,233
,232
,1C
zech
Rep
.1,
165
,484
,714
4,0
171,
370
,349
,5-3
,242
,9-0
,628
,9…
Esto
nia
5,1
97,4
99,1
142,
229
8,9
24,7
94,4
-18,
111
2,6
2,9
3,4
…H
unga
ry1,
067
,482
,915
1,5
340,
024
,361
,6-6
,410
3,5
-4,9
65,8
…La
tvia
6,2
74,4
62,9
127,
726
4,1
11,0
93,9
-22,
612
6,9
0,7
7,8
7,9
Lith
uani
a4,
854
,791
,882
,115
9,1
11,1
61,2
-14,
677
,4-1
,017
,0…
Mac
edon
ia, F
YR
-0,8
53,4
53,2
123,
614
0,9
27,3
38,4
-7,2
49,8
0,6
23,4
59,3
Mol
dova
3,9
……
214,
415
1,7
7,0
36,9
-17,
054
,6-0
,227
,740
,0Po
land
1,0
72,6
74,3
84,6
130,
620
,839
,9-4
,754
,9-2
,044
,832
,3R
oman
ia2,
846
,787
,974
,611
2,2
8,4
35,8
-13,
947
,1-3
,119
,827
,1Se
rbia
2,4
0,5
78,7
……
24,9
33,0
-15,
364
,9-1
,933
,334
,6Sl
ovak
Rep
.2,
442
,797
120,
514
9,2
55,1
42,4
-5,4
52,0
-1,9
29,4
…Sl
oven
ia1,
015
,329
,582
,424
4,2
26,4
79,0
-4,2
…0,
323
,4…
Turk
ey0,
6…
…77
,398
,819
,529
,0-5
,838
,4-2
,139
,436
,9U
krai
ne5,
011
,135
104,
414
9,5
2,5
59,1
-3,7
57,2
-2,0
12,8
21,0
Eur
o ar
ea-2
,4…
……
…86
,012
1,4
0,4
…-0
,765
,7…
Oth
er e
mer
ging
eco
nom
ies
Emer
ging
Asi
a4,
0…
……
…10
2,4
98,9
6,8
13,6
-0,2
48,2
…La
tin A
mer
ica
-1,7
……
……
34,7
36,3
0,4
22,8
-1,2
48,6
…M
iddl
e Ea
st a
nd N
orth
Afr
ica
……
……
……
…16
,527
,67,
132
,7…
Sub-
Saha
ran
Afr
ica
-1,7
……
……
58,1
70,7
-3,0
25,4
0,7
33,5
…
1/ R
esid
uals
from
a g
row
th re
gres
sion
that
con
trols
for i
nitia
l GD
P pe
r cap
ita
Dom
estic
cre
dit t
o pr
ivat
e se
ctor
(%
of G
DP)
Tab
le 1
. Em
ergi
ng E
urop
e an
d ot
her
emer
ging
eco
nom
ies b
efor
e th
e cr
isis
(200
7, e
xcep
t whe
n in
dica
ted
othe
rwis
e)
Ass
et sh
are
of fo
reig
n B
anks
(F
orei
gn a
sset
s+fo
reig
n lia
bilit
ies)
/GD
P
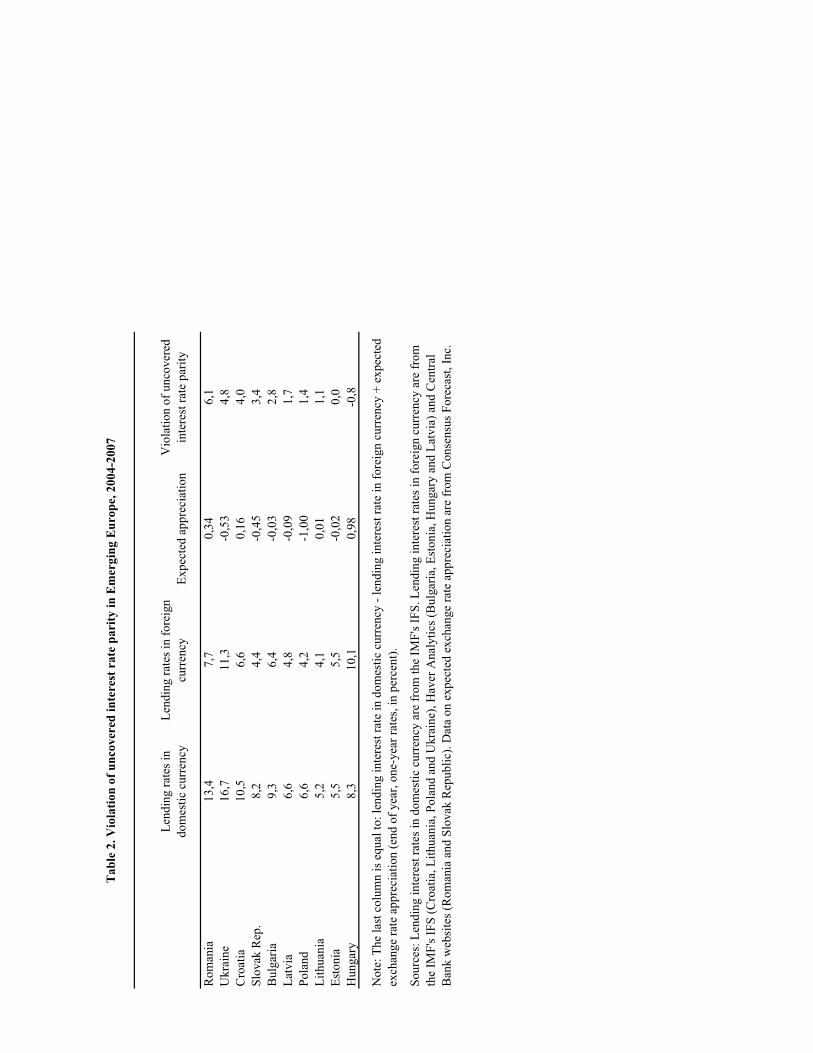
Lend
ing
rate
s in
dom
estic
cur
renc
yLe
ndin
g ra
tes i
n fo
reig
n cu
rren
cyEx
pect
ed a
ppre
ciat
ion
Vio
latio
n of
unc
over
ed
inte
rest
rate
par
ity
Rom
ania
13,4
7,7
0,34
6,1
Ukr
aine
16,7
11,3
-0,5
34,
8C
roat
ia10
,56,
60,
164,
0Sl
ovak
Rep
.8,
24,
4-0
,45
3,4
Bul
garia
9,3
6,4
-0,0
32,
8La
tvia
6,6
4,8
-0,0
91,
7Po
land
6,6
4,2
-1,0
01,
4Li
thua
nia
5,2
4,1
0,01
1,1
Esto
nia
5,5
5,5
-0,0
20,
0H
unga
ry8,
310
,10,
98-0
,8
Tab
le 2
. Vio
latio
n of
unc
over
ed in
tere
st r
ate
pari
ty in
Em
ergi
ng E
urop
e, 2
004-
2007
Not
e: T
he la
st c
olum
n is
equ
al to
: len
ding
inte
rest
rate
in d
omes
tic c
urre
ncy
- len
ding
inte
rest
rate
in fo
reig
n cu
rren
cy +
exp
ecte
d ex
chan
ge ra
te a
ppre
ciat
ion
(end
of y
ear,
one-
year
rate
s, in
per
cent
).
Sour
ces:
Len
ding
inte
rest
rate
s in
dom
estic
cur
renc
y ar
e fr
om th
e IM
F's I
FS. L
endi
ng in
tere
st ra
tes i
n fo
reig
n cu
rren
cy a
re fr
om
the
IMF'
s IFS
(Cro
atia
, Lith
uani
a, P
olan
d an
d U
krai
ne),
Hav
er A
naly
tics (
Bul
garia
, Est
onia
, Hun
gary
and
Lat
via)
and
Cen
tral
Ban
k w
ebsi
tes (
Rom
ania
and
Slo
vak
Rep
ublic
). D
ata
on e
xpec
ted
exch
ange
rate
app
reci
atio
n ar
e fr
om C
onse
nsus
For
ecas
t, In
c.

Una
djus
ted
Incl
udin
g un
hedg
ed fo
reig
n cu
rren
cy lo
ans f
rom
ab
road
Ass
umin
g to
tally
un
hedg
ed h
ouse
hold
sB
y ho
useh
olds
By
firm
sFu
lly a
djus
ted
Bul
garia
-28,
7-2
6,7
-3,9
-1,9
2,0
-1,2
Cro
atia
28,5
28,6
32,2
32,3
35,8
32,4
Cze
ch R
ep.
-30,
7-3
0,7
-28,
8-2
8,8
-26,
8-2
8,7
Esto
nia
-33,
1-1
8,4
-13,
11,
54,
911
,5H
unga
ry-2
,1-0
,94,
96,
18,
47,
1La
tvia
-3
1,0
-21,
6-1
9,1
-9,6
-9,0
-8,0
Lith
uani
a
-1
3,4
-9,7
-0,8
3,0
4,6
6,5
Pola
nd
-7,3
-2,3
-4,3
0,7
2,3
3,2
Rom
ania
12,1
18,0
24,9
30,8
35,0
32,1
Ukr
aine
-43,
2-3
8,0
-26,
3-2
1,1
.-1
9,5
Una
djus
ted
Incl
udin
g un
hedg
ed fo
reig
n cu
rren
cy lo
ans f
rom
ab
road
Ass
umin
g to
tally
un
hedg
ed h
ouse
hold
sB
y ho
useh
olds
By
firm
sFu
lly a
djus
ted
Bul
garia
-31,
9-2
7,0
-4,0
0,9
6,9
2,6
Cro
atia
21,7
21,8
24,6
24,7
31,6
24,7
Cze
ch R
ep.
-24,
5-2
4,4
-22,
4-2
2,4
-20,
0-2
2,4
Esto
nia
-25,
93,
54,
333
,739
,353
,6H
unga
ry-5
,80,
61,
68,
011
,213
,5La
tvia
-2
6,3
-5,7
-5,4
15,1
17,4
18,5
Lith
uani
a
-5
,12,
76,
314
,117
,021
,4Po
land
-9
,1-4
,9-3
,80,
42,
62,
5R
oman
ia10
,922
,823
,535
,439
,538
,1U
krai
ne-3
4,2
-20,
9-1
9,7
-6,3
.-2
,0
Sour
ce: a
utho
rs' c
alcu
latio
ns (s
ee A
ppen
dix
B).
Not
e: th
e nu
mer
ator
is e
xpre
ssed
as l
iabi
litie
s min
us a
sset
s, an
d th
eref
ore,
an
incr
ease
in th
e ab
ove
perc
enta
ges r
efle
cts a
n in
crea
se in
cur
renc
y m
ism
atch
.
Tab
le 3
. Cur
renc
y M
ism
atch
es in
Em
ergi
ng E
urop
e in
Per
cent
of B
ank
Sect
or A
sset
s: A
djus
ting
for
Unh
edge
d B
orro
win
g, 2
004-
2007
2004
Adj
uste
d fo
r unh
edge
d fo
reig
n cu
rren
cy b
orro
win
g fr
om
dom
estic
ban
ks
2007
Adj
uste
d fo
r unh
edge
d fo
reig
n cu
rren
cy b
orro
win
g fr
om
dom
estic
ban
ks

2004
2007
Cha
nge
2004
2007
Cha
nge
2004
2007
Cha
nge
Bul
garia
2,8
4,5
1,7
0,3
0,6
0,2
-1,9
0,9
2,8
Cro
atia
3,5
5,0
1,5
0,4
0,6
0,3
32,3
24,7
-7,6
Cze
ch R
ep.
1,2
1,0
-0,2
..
.-2
8,8
-22,
46,
4Es
toni
a4,
15,
00,
90,
40,
60,
21,
533
,732
,2H
unga
ry5,
44,
4-1
,00,
30,
20,
06,
18,
01,
9La
tvia
3,
410
,06,
60,
20,
40,
1-9
,615
,124
,7Li
thua
nia
3,7
4,0
0,3
0,4
0,8
0,3
3,0
14,1
11,1
Pola
nd
3,2
4,5
1,3
0,4
0,3
-0,1
0,7
0,4
-0,3
Rom
ania
4,7
9,0
4,3
0,1
0,5
0,4
30,8
35,4
4,6
Ukr
aine
2,0
3,8
1,7
0,3
0,3
0,0
-21,
1-6
,314
,8
Cor
rela
tion
with
new
mea
sure
0,7
0,7
0,3
-0,2
0,5
0,0
……
…R
ank
Cor
rela
tion
with
new
mea
s u0,
80,
80,
20,
00,
40,
1…
……
Not
e. S
tand
ard
curr
ency
mis
mat
ch m
easu
res i
n th
e lit
erat
ure
divi
de n
et e
xter
nal d
ebt o
r ext
erna
l deb
t ser
vice
with
exp
orts
or n
et e
xpor
ts.
As m
ost e
mer
ging
Eur
opea
n ec
onom
ies h
ad n
egat
ive
next
exp
orts
bef
ore
the
cris
is, t
he d
enom
inat
or in
the
tabl
e is
tota
l exp
orts
. A
n in
crea
se in
all
mea
sure
s ref
lect
s hig
her c
urre
ncy
mis
mat
ch.
Tab
le 4
. Cur
renc
y M
ism
atch
Mea
sure
s in
Em
ergi
ng E
urop
e, 2
004-
2007
Net
ext
erna
l deb
t/exp
orts
Exte
rnal
deb
t ser
vice
/exp
orts
Fore
ign
curr
ency
den
omin
ated
ne
t unh
edge
d lia
bilit
ies/
tota
l

Cha
nge
in c
urre
ncy
mis
mat
ch0.
11**
0.12
**0.
07**
0.07
**0.
12*
0.11
*0.
09**
0.09
**(0
.05)
(0.0
5)(0
.03)
(0.0
3)(0
.06)
(0.0
6)(0
.04)
(0.0
4)
Lagg
ed c
hang
e in
cur
renc
y m
ism
atch
0,06
0,06
0,04
0,04
0,05
0,04
0,05
0,04
(0.0
5)(0
.04)
(0.0
4)(0
.04)
(0.0
7)(0
.06)
(0.0
4)(0
.04)
Cris
is d
umm
y-1
2.93
***
-13.
42**
*-1
3.42
***
-14.
09**
*-1
2.97
***
-14.
01**
*-1
3.02
***
-13.
80**
*(0
.60)
(1.6
4)(0
.56)
(1.6
9)(2
.42)
(2.6
3)(0
.78)
(1.7
1)
Inte
ract
ion
term
: (ch
ange
in c
urre
ncy
mis
mat
ch) x
(c
risis
dum
my)
-0.1
0**
-0.2
2-0
.06*
*-0
.02
0,01
-0.1
40.
040.
09(0
.05)
(0.1
8)(0
.03)
(0.0
9)(0
.39)
(0.4
0)(0
.06)
(0.2
1)
Inte
ract
ion
term
: (la
gged
cha
nge
in c
urre
ncy
mis
mat
ch) x
(cris
is d
umm
y)-0
.84*
**-0
.84*
**-0
.83*
**-0
.92*
**-0
,69
-0.6
8-0
.71*
**-0
.77*
**(0
.05)
(0.1
3)(0
.04)
(0.0
7)(0
.87)
(0.9
6)(0
.11)
(0.1
0)
Tim
e tre
nd-0
.16
0,23
-0.0
90,
19(0
.27)
(0.3
0)(0
.23)
(0.3
3)
Cha
nge
in e
xter
nal d
ebt/G
DP
0,05
-0.0
50,
07-0
.05
(0.1
1)(0
.06)
(0.0
8)(0
.10)
Adj
uste
d R2
0,68
0,68
0,53
0,53
0,65
0,65
0,5
0,50
Num
ber o
f cou
ntrie
s10
1029
2910
1029
29
Tab
le 5
. Cur
renc
y m
ism
atch
and
gro
wth
in e
mer
ging
eco
nom
ies,
1998
-200
9
Pool
ed p
anel
Fixe
d ef
fect
sEm
ergi
ng E
urop
eEm
ergi
ng e
cono
mie
sEm
ergi
ng E
urop
eEm
ergi
ng e
cono
mie
s
Not
e: T
he d
epen
dent
var
iabl
e is
real
GD
P gr
owth
(fro
m th
e IM
F W
orld
Eco
nom
ic O
utlo
ok d
atab
ase)
. Cur
renc
y m
ism
atch
is m
easu
red
as e
xpla
ined
in th
e te
xt a
nd A
ppen
dix
1. T
he c
risis
dum
my
take
s the
val
ue o
f 1 in
200
9, w
hich
is th
e ye
ar
whe
n gr
owth
turn
ed n
egat
ive
thro
ugho
ut e
mer
ging
Eur
ope.
The
sam
ple
for e
mer
ging
Eur
ope
incl
udes
10
econ
omie
s: B
ulga
ria, C
roat
ia, C
zech
Rep
., Es
toni
a, H
unga
ry, L
atvi
a, L
ithua
nia,
Pol
and,
Rom
ania
, and
Ukr
aine
. The
bro
ader
sam
ple
for e
mer
ging
mar
kets
incl
udes
in a
dditi
on: A
rgen
tina,
Bra
zil,
Bos
nia
and
Her
zego
vina
, Chi
na, C
osta
Ric
a, E
gypt
, Gua
tem
ala,
Indo
nesi
a, K
azak
hsta
n, M
exic
o, P
eru,
Phi
lippi
nes,
Rus
sia,
Ser
bia,
Tha
iland
, Tur
key,
Uru
guay
, Ven
ezue
la, a
nd
Vie
tnam
. The
per
iod
is 1
998-
2009
. Het
eros
ceda
stic
ity-c
onsi
sten
t sta
ndar
d er
rors
in p
aren
thes
es. *
, **,
and
***
indi
cate
stat
istic
al si
gnifi
canc
e at
the
10, 5
and
1 p
erce
nt le
vel,
resp
ectiv
ely.

Cha
nge
in c
urre
ncy
mis
mat
ch0.
03**
0.02
**0.
02**
0.02
**0.
02**
(0.0
1)(0
.01)
(0.0
1)(0
.01)
(0.0
1)
Initi
al p
er c
apita
GD
P-1
.10
-1.0
4***
-1.1
1**
-1.2
1**
-1.6
8***
(0.6
8)(0
.37)
(0.3
8)(0
.47)
(0.4
1)
Age
dep
ende
ncy
ratio
-0.1
0***
-0.0
9***
-0.0
9***
-0.1
2***
(0.0
2)(0
.02)
(0.0
3)(0
.03)
Inve
stm
ent/G
DP
0.18
***
0.19
***
0.19
***
0.13
**(0
.04)
(0.0
4)(0
.05)
(0.0
5)
Trad
e/G
DP
-0,0
1-0
,01
-0,0
1-0
,01
(0.0
06)
(0.0
06)
(0.0
07)
(0.0
07)
Infla
tion
rate
0,03
0.00
-0.0
10,
02(0
.03)
(0.0
3)(0
.05)
(0.0
5)
Gro
wth
of t
erm
s of t
rade
0,10
0,12
0,08
(0.0
9)(0
.09)
(0.0
9)
Euro
pe d
umm
y0,
32-0
,23
(0.8
5)(0
.95)
Cha
nge
in e
xter
nal d
ebt/G
DP
0,02
(0.0
1)
Adj
uste
d R
20,
10,
680,
680,
670,
71
Obs
erva
tions
2929
2929
29
Tab
le 6
. Cur
renc
y m
ism
atch
and
long
-run
gro
wth
in e
mer
ging
eco
nom
ies,
2000
-200
9
Not
e: C
ross
-cou
ntry
regr
essi
ons,
for t
he p
erio
d 20
00-2
009
(pro
ject
ions
from
the
IMF’
s WEO
dat
abas
e fo
r 200
9). T
he d
epen
dent
var
iabl
e is
ave
rage
real
GD
Ppe
r cap
ita P
PP-a
djus
ted
grow
th. C
urre
ncy
mis
mat
ch is
mea
sure
d as
exp
lain
ed in
the
text
and
the
appe
ndix
. All
othe
r dat
a ar
e fr
om th
e IM
F W
orld
Eco
nom
ic
Out
look
dat
abas
e (O
ctob
er 2
009)
, exc
ept o
f the
trad
e sh
are,
ext
erna
l deb
t and
the
age
depe
nden
cy ra
te, w
hich
are
from
the
Wor
ld B
ank’
s Wor
ld D
evel
opm
enIn
dica
tors
. The
sam
ple
incl
udes
29
emer
ging
eco
nom
ies:
Arg
entin
a, B
razi
l, B
ulga
ria, B
osni
a an
d H
erze
govi
na, C
hina
, Cos
ta R
ica,
Cro
atia
, Cze
ch R
ep.,
Egyp
t, Es
toni
a, G
uate
mal
a, H
unga
ry, I
ndon
esia
, Kaz
akhs
tan,
Lat
via,
Lith
uani
a, M
exic
o, P
eru,
Phi
lippi
nes,
Pola
nd, R
oman
ia, R
ussi
a, S
erbi
a, T
haila
nd,
Turk
ey, U
krai
ne, U
rugu
ay a
nd V
enez
uela
, and
Vie
tnam
(Arg
entin
a, d
rops
from
the
sam
ple
beca
use
we
do n
ot h
ave
data
for r
ecen
t yea
rs).
Het
eros
ceda
stic
ity-
cons
iste
nt st
anda
rd e
rror
s in
pare
nthe
ses.
*, *
*, a
nd *
** in
dica
te st
atis
tical
sign
ifica
nce
at th
e 10
, 5 a
nd 1
per
cent
leve
l, re
spec
tivel
y.

Tab
le 7
. L
oan
Inte
rest
Rat
e an
d C
urre
ncy
Mis
mat
chD
epen
dant
Var
iabl
eSa
mpl
eEs
timat
ion
Cur
renc
y M
ism
atch
Dum
my
-2.5
0***
-2.4
6***
-2.3
1***
-2.2
8***
-2.2
3***
-2.0
4***
-0,3
7-0
,37
-0,4
1-0
,4-0
,4-0
,44
Log
of S
ales
(20
04)
-0.2
9***
-0.3
3***
-0.3
7***
-0.2
4*-0
.27*
*-0
.29*
*-0
,11
-0,1
1-0
,12
-0,1
3-0
,13
-0,1
4Lo
g of
Yea
rs in
Ope
ratio
n-0
.76*
**-0
.76*
**-0
.63*
*-0
.68*
*-0
.69*
*-0
,47
-0,2
7-0
,28
-0,3
-0,2
9-0
,3-0
,34
Col
late
ral D
umm
y fo
r:
Land
or B
uild
ing
0,46
0,48
0,56
-0,3
6-0
,37
-0,4
1
Equ
ipm
ent
0,01
1-0
,02
0,16
-0,4
9-0
,5-0
,52
Acc
ount
s Rec
eiva
ble
1.17
*1.
22*
1.55
*-0
,69
-0,7
1-0
,86
Per
sona
l Ass
ets
-0,5
1-0
,5-0
,5-0
,65
-0,6
6-0
,59
Oth
er C
olla
tera
l0,
420,
460,
16
-0,6
-0,6
1-0
,62
Num
ber o
f Firm
s98
698
698
682
182
182
1A
djus
ted
R-s
quar
ed0,
614
0,61
30,
624
0,60
90,
608
0,62
8C
ount
ry F
ixed
Eff
ects
Yes
Yes
No
Yes
Yes
No
Indu
stry
Fix
ed E
ffec
tsN
oY
esN
oN
oY
esN
oC
ount
ry-I
ndus
try F
ixed
Eff
ects
No
No
Yes
No
No
Yes
* si
gnifi
cant
at 1
0%; *
* si
gnifi
cant
at 5
%; *
** si
gnifi
cant
at 1
%
Inte
rest
Rat
e on
Las
t Loa
n R
epor
ted
in 2
005
BEE
PS S
urve
ySm
all F
irms i
n N
on-T
rada
bles
Sec
tors
Not
es:
the
curr
ency
mis
mat
ch d
umm
y is
equ
al to
1 if
last
loan
is d
enom
inat
ed in
fore
ign
curr
ency
and
0 if
last
loan
is d
enom
inat
ed in
dom
estic
cur
renc
y.
Smal
l Firm
s are
firm
s with
less
than
100
em
ploy
ees.
The
list o
f non
-trad
able
s sec
tor i
s pre
sent
ed in
Tab
le A
.1 in
the
appe
ndix
. Het
eros
keda
stic
ity ro
bust
st
anda
rd e
rror
s are
repo
rted.
OLS

Tab
le 8
. L
oan
Inte
rest
Rat
e an
d C
urre
ncy
Mis
mat
ch; R
obus
tnes
s: T
he R
ole
of E
xcha
nge
Rat
e D
epre
ciat
ion
Dep
enda
nt V
aria
ble
Sam
ple
Estim
atio
nC
urre
ncy
Mis
mat
ch D
umm
y-3
.49*
**-3
.47*
**-3
.40*
**-3
.12*
**-3
.09*
**-2
.76*
**-0
,49
-0,5
-0,5
4-0
,55
-0,5
5-0
,57
Log
of S
ales
(20
04)
-0.2
4*-0
.29*
*-0
.30*
*-0
,22
-0.2
7*-0
,23
-0,1
2-0
,12
-0,1
3-0
,16
-0,1
5-0
,16
Log
of Y
ears
in O
pera
tion
-0.9
4***
-0.9
2***
-0.9
1**
-0.7
5**
-0.7
2*-0
.70*
-0,3
4-0
,34
-0,3
6-0
,38
-0,3
8-0
,4C
olla
tera
l Dum
my
for:
La
nd o
r Bui
ldin
g0,
028
0,01
2-0
,074
-0,4
3-0
,43
-0,4
6
Equ
ipm
ent
-0,2
9-0
,33
-0,3
9-0
,58
-0,5
9-0
,6 A
ccou
nts R
ecei
vabl
e0,
570,
61,
06-0
,7-0
,73
-1,0
2 P
erso
nal A
sset
s-0
,63
-0,6
7-0
,69
-0,9
-0,9
1-0
,78
Oth
er C
olla
tera
l0,
330,
420,
13
-0,7
-0,7
2-0
,7N
umbe
r of F
irms
661
660
660
539
538
538
Adj
uste
d R
-squ
ared
0,63
60,
636
0,64
60,
629
0,63
0,65
4C
ount
ry F
ixed
Eff
ects
Yes
Yes
No
Yes
Yes
No
Indu
stry
Fix
ed E
ffec
tsN
oY
esN
oN
oY
esN
oC
ount
ry-I
ndus
try F
ixed
Eff
ects
No
No
Yes
No
No
Yes
* si
gnifi
cant
at 1
0%; *
* si
gnifi
cant
at 5
%; *
** si
gnifi
cant
at 1
%
Adj
uste
d In
tere
st R
ate
on L
ast L
oan
Rep
orte
d in
200
5 B
EEPS
Sur
vey
Smal
l Firm
s in
Non
-Tra
dabl
es S
ecto
rs
Not
es:
the
curr
ency
mis
mat
ch d
umm
y is
equ
al to
1 if
last
loan
is d
enom
inat
ed in
fore
ign
curr
ency
and
0 if
last
loan
is d
enom
inat
ed in
dom
estic
cur
renc
y. S
mal
l Fi
rms a
re fi
rms w
ith le
ss th
an 1
00 e
mpl
oyee
s. Th
e lis
t of n
on-tr
adab
les s
ecto
r is p
rese
nted
in T
able
A.1
in th
e ap
pend
ix. H
eter
oske
dast
icity
robu
st st
anda
rd e
rror
s ar
e re
porte
d. T
he d
omes
tic c
urre
ncy
inte
rest
rate
hav
e be
en a
djus
ted
for e
xcha
nge
rate
dep
ecia
tion
usin
g on
e-ye
ar a
head
fore
cast
s fro
m C
onse
nsus
For
ecas
t Inc
.
OLS

Tab
le 9
. Loa
n M
atur
ity a
nd C
urre
ncy
Mis
mat
chD
epen
dant
Var
iabl
eSa
mpl
eEs
timat
ion
Cur
renc
y M
ism
atch
Dum
my
10.2
***
10.4
***
8.84
***
8.28
***
8.41
***
6.88
*-2
,9-2
,89
-3,1
7-3
,1-3
,06
-3,5
2Lo
g of
Sal
es (
2004
)-0
,038
0,42
0,3
0,00
087
0,44
0,65
-0,9
-0,9
-1,0
3-1
,05
-1,0
6-1
,28
Log
of Y
ears
in O
pera
tion
-2,7
6-2
,68
-2,5
6-3
,25
-2,9
7-3
,06
-1,9
-1,9
3-2
,07
-2,3
4-2
,36
-2,7
1C
olla
tera
l Dum
my
for:
La
nd o
r Bui
ldin
g1,
212,
110,
32-3
,25
-3,3
3-3
,62
E
quip
men
t7.
55**
7.69
**5,
09-3
,62
-3,6
7-4
,21
Acc
ount
s Rec
eiva
ble
10.7
**10
.7**
9.10
*-4
,59
-4,6
8-5
,28
Per
sona
l Ass
ets
5.68
*5.
70*
4,21
-3,1
3-3
,09
-3,3
3 O
ther
Col
late
ral
9.07
**7.
87**
6,53
-3,9
5-3
,89
-4,5
337
.2**
*40
.6**
31.8
**-2
6,4
-23,
1-1
9,6
Num
ber o
f Firm
s10
0099
899
883
182
982
9A
djus
ted
R-s
quar
ed0,
109
0,12
30,
124
0,10
80,
124
0,10
9C
ount
ry F
ixed
Eff
ects
Yes
Yes
No
Yes
Yes
No
Indu
stry
Fix
ed E
ffec
tsN
oY
esN
oN
oY
esN
oC
ount
ry-I
ndus
try F
ixed
Eff
ects
No
No
Yes
No
No
Yes
* si
gnifi
cant
at 1
0%; *
* si
gnifi
cant
at 5
%; *
** si
gnifi
cant
at 1
%
Mat
urity
in M
onth
s on
Last
Loa
n R
epor
ted
in 2
005
BEE
PS S
urve
ySm
all F
irms i
n N
on-T
rada
bles
Sec
tors
Not
es: t
he c
urre
ncy
mis
mat
ch d
umm
y is
equ
al to
1 if
last
loan
is d
enom
inat
ed in
fore
ign
curr
ency
and
0 if
last
loan
is d
enom
inat
ed in
dom
estic
cu
rren
cy.
Smal
l Firm
s are
firm
s with
less
than
100
em
ploy
ees.
The
list o
f non
-trad
able
s sec
tor i
s pre
sent
ed in
Tab
le A
.1 in
the
appe
ndix
. H
eter
oske
dast
icity
robu
st st
anda
rd e
rror
s are
repo
rted.
OLS

Tab
le 1
0. G
row
th in
Sal
es a
nd C
urre
ncy
Mis
mat
chD
epen
dant
Var
iabl
eSa
mpl
eEs
timat
ion
Cur
renc
y M
ism
atch
Dum
my
0.08
7***
0.08
1**
0.08
8**
0.07
0**
0.06
6**
0.07
0**
-0,0
32-0
,032
-0,0
35-0
,033
-0,0
33-0
,035
Initi
al L
og o
f Sal
es (2
001)
-0.0
41**
*-0
.041
***
-0.0
45**
*-0
.019
*-0
.021
*-0
.025
**-0
,009
9-0
,01
-0,0
11-0
,011
-0,0
12-0
,012
Log
of Y
ears
in O
pera
tion
-0,0
26-0
,025
-0,0
18-0
.047
*-0
.045
*-0
,031
-0,0
25-0
,025
-0,0
27-0
,026
-0,0
26-0
,028
Initi
al L
abor
Pro
duct
ivity
-0
.062
***
-0.0
57**
*-0
.056
***
Log
(Sal
es/E
mpl
oyem
ent)
in 2
001
-0,0
17-0
,018
-0,0
2
Shar
e of
For
eign
Inpu
t in
Prod
uctio
n0.
0011
***
0.00
11**
*0.
0012
***
-0
,000
38-0
,000
41-0
,000
43Sh
are
of E
mpl
oyee
s with
a U
nive
rsity
Deg
ree
0.00
13**
*0.
0013
**0.
0012
**-0
,000
47-0
,000
5-0
,000
54Sh
are
of S
kille
d W
orke
rs0,
024
0,01
9-0
,008
3-0
,047
-0,0
48-0
,051
Num
ber o
f Firm
s10
1010
0810
0895
595
395
3A
djus
ted
R-s
quar
ed0,
049
0,05
10,
060,
073
0,07
20,
081
Cou
ntry
Fix
ed E
ffec
tsY
esY
esN
oY
esY
esN
oIn
dust
ry F
ixed
Eff
ectd
No
Yes
No
No
Yes
No
Cou
ntry
-Ind
ustry
Fix
ed E
ffec
tsN
oN
oY
esN
oN
oY
es*
sign
ifica
nt a
t 10%
; **
sign
ifica
nt a
t 5%
; ***
sign
ifica
nt a
t 1%
Gro
wth
in S
ales
bet
wee
n 20
01 a
nd 2
004
Smal
l Firm
s in
Non
-Tra
dabl
es S
ecto
rs
Not
es:
grow
th in
sale
s is d
efin
ed a
s log
diff
eren
ce in
sale
s bet
wee
n 20
04 a
nd 2
001.
the
cur
renc
y m
ism
atch
dum
my
is e
qual
to 1
if la
st lo
an is
den
omin
ated
in
fore
ign
curr
ency
and
0 if
last
loan
is d
enom
inat
ed in
dom
estic
cur
renc
y. S
mal
l Firm
s are
firm
s with
less
than
100
em
ploy
ees.
The
list o
f non
-trad
able
s sec
tors
\ is
pre
sent
ed in
Tab
le A
.1 in
the
appe
ndix
. Het
eros
keda
stic
ity ro
bust
stan
dard
err
ors a
re re
porte
d.
OLS
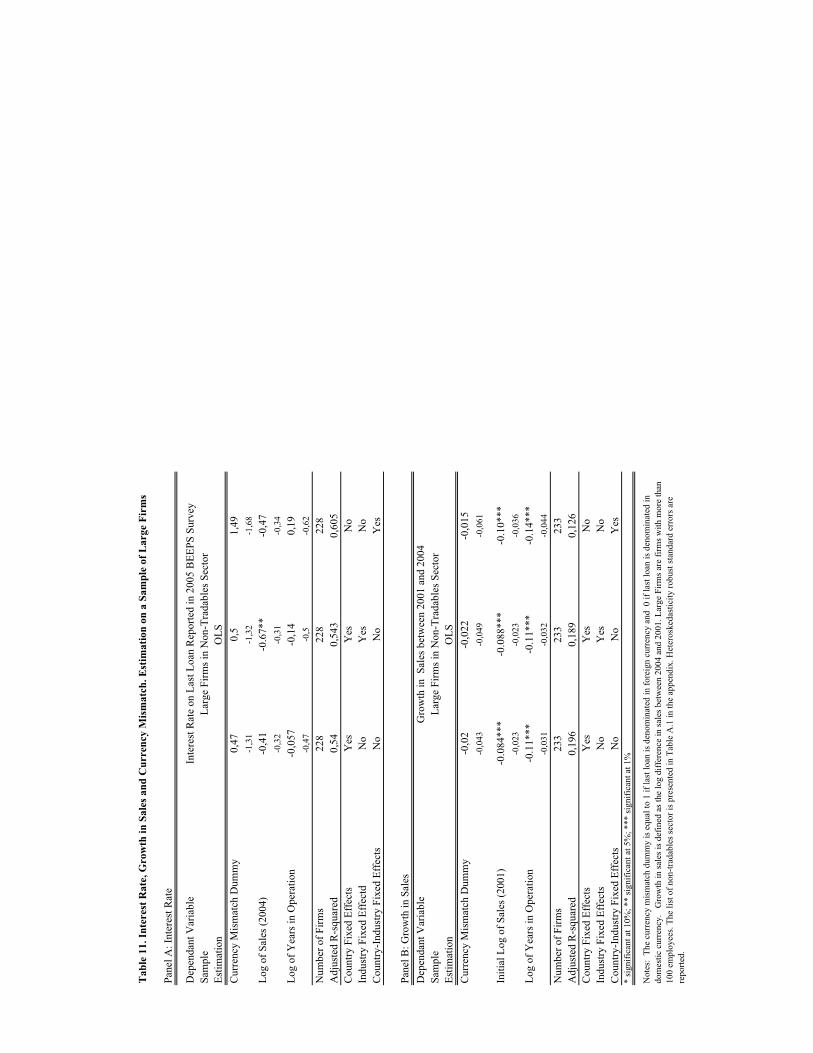
Tab
le 1
1. In
tere
st R
ate,
Gro
wth
in S
ales
and
Cur
renc
y M
ism
atch
. Est
imat
ion
on a
Sam
ple
of L
arge
Fir
ms
Pane
l A: I
nter
est R
ate
Dep
enda
nt V
aria
ble
Sam
ple
Estim
atio
nC
urre
ncy
Mis
mat
ch D
umm
y0,
470,
51,
49-1
,31
-1,3
2-1
,68
Log
of S
ales
(200
4)-0
,41
-0.6
7**
-0,4
7-0
,32
-0,3
1-0
,34
Log
of Y
ears
in O
pera
tion
-0,0
57-0
,14
0,19
-0,4
7-0
,5-0
,62
Num
ber o
f Firm
s22
822
822
8A
djus
ted
R-s
quar
ed0,
540,
543
0,60
5C
ount
ry F
ixed
Eff
ects
Yes
Yes
No
Indu
stry
Fix
ed E
ffec
tdN
oY
esN
oC
ount
ry-I
ndus
try F
ixed
Eff
ects
No
No
Yes
Pane
l B: G
row
th in
Sal
esD
epen
dant
Var
iabl
eSa
mpl
eEs
timat
ion
Cur
renc
y M
ism
atch
Dum
my
-0,0
2-0
,022
-0,0
15-0
,043
-0,0
49-0
,061
Initi
al L
og o
f Sal
es (2
001)
-0.0
84**
*-0
.088
***
-0.1
0***
-0,0
23-0
,023
-0,0
36Lo
g of
Yea
rs in
Ope
ratio
n-0
.11*
**-0
.11*
**-0
.14*
**-0
,031
-0,0
32-0
,044
Num
ber o
f Firm
s23
323
323
3A
djus
ted
R-s
quar
ed0,
196
0,18
90,
126
Cou
ntry
Fix
ed E
ffec
tsY
esY
esN
oIn
dust
ry F
ixed
Eff
ects
No
Yes
No
Cou
ntry
-Ind
ustry
Fix
ed E
ffec
tsN
oN
oY
es*
sign
ifica
nt a
t 10%
; **
sign
ifica
nt a
t 5%
; ***
sign
ifica
nt a
t 1%
Not
es:
The
curr
ency
mis
mat
ch d
umm
y is
equ
al to
1 if
last
loan
is d
enom
inat
ed in
fore
ign
curr
ency
and
0 if
last
loan
is d
enom
inat
ed in
do
mes
tic c
urre
ncy.
G
row
th in
sale
s is d
efin
ed a
s the
log
diff
eren
ce in
sale
s bet
wee
n 20
04 a
nd 2
001.
Lar
ge F
irms a
re fi
rms w
ith m
ore
than
10
0 em
ploy
ees.
The
list o
f non
-trad
able
s sec
tor i
s pre
sent
ed in
Tab
le A
.1 in
the
appe
ndix
. Het
eros
keda
stic
ity ro
bust
stan
dard
err
ors a
re
repo
rted.
Inte
rest
Rat
e on
Las
t Loa
n R
epor
ted
in 2
005
BEE
PS S
urve
yLa
rge
Firm
s in
Non
-Tra
dabl
es S
ecto
r
Gro
wth
in S
ales
bet
wee
n 20
01 a
nd 2
004
Larg
e Fi
rms i
n N
on-T
rada
bles
Sec
tor
OLS
OLS
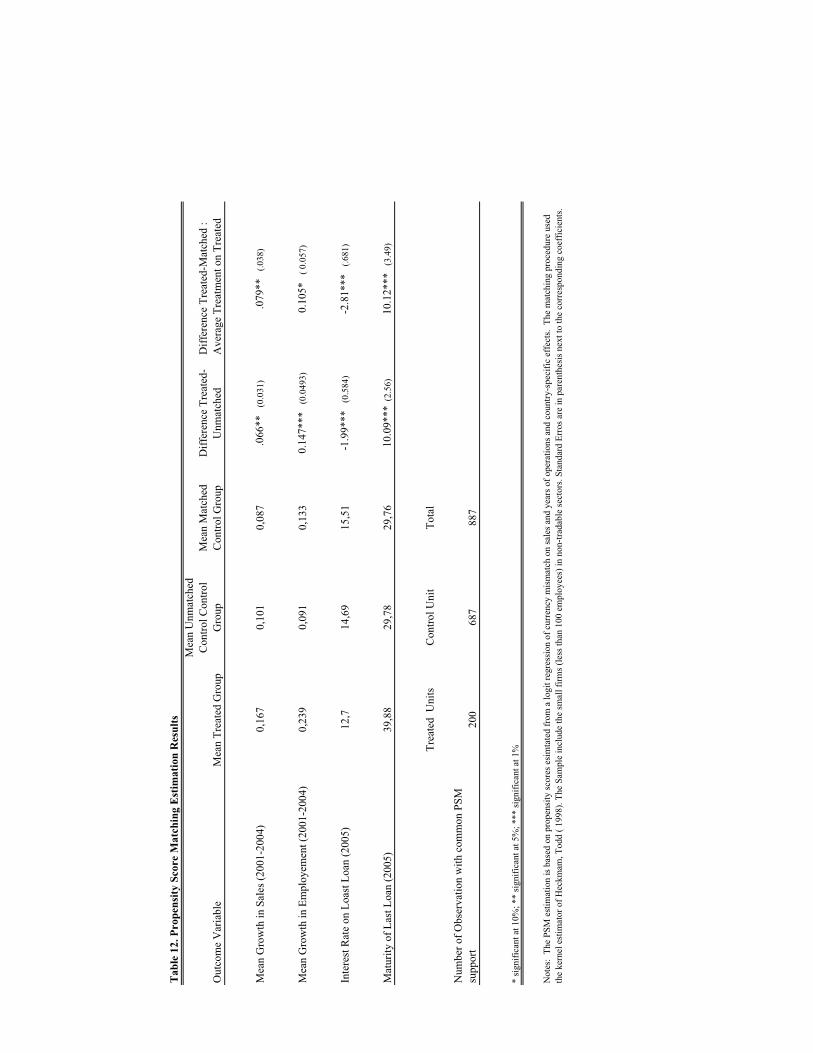
Tab
le 1
2. P
rope
nsity
Sco
re M
atch
ing
Est
imat
ion
Res
ults
Out
com
e V
aria
ble
Mea
n Tr
eate
d G
roup
Mea
n U
nmat
ched
C
ontro
l Con
trol
Gro
upM
ean
Mat
ched
C
ontro
l Gro
upD
iffer
ence
Tre
ated
- U
nmat
ched
Diff
eren
ce T
reat
ed-M
atch
ed :
Ave
rage
Tre
atm
ent o
n Tr
eate
d
Mea
n G
row
th in
Sal
es (2
001-
2004
)0,
167
0,10
10,
087
.066
**
(0.0
31)
.079
**
(.038
)
Mea
n G
row
th in
Em
ploy
emen
t (20
01-2
004)
0,23
90,
091
0,13
30.
147*
**
(0.0
493)
0.
105*
( 0
.057
)
Inte
rest
Rat
e on
Loa
st L
oan
(200
5)12
,714
,69
15,5
1-1
.99*
**
(0.5
84)
-2.8
1***
(.6
81)
Mat
urity
of L
ast L
oan
(200
5)39
,88
29,7
829
,76
10.0
9***
(2.
56)
10.1
2***
(3.
49)
Trea
ted
Uni
tsC
ontro
l Uni
tTo
tal
Num
ber o
f Obs
erva
tion
with
com
mon
PSM
su
ppor
t20
068
788
7
* si
gnifi
cant
at 1
0%; *
* si
gnifi
cant
at 5
%; *
** si
gnifi
cant
at 1
%
Not
es:
The
PSM
est
imat
ion
is b
ased
on
prop
ensi
ty sc
ores
esi
mta
ted
from
a lo
git r
egre
ssio
n of
cur
renc
y m
ism
atch
on
sale
s and
yea
rs o
f ope
ratio
ns a
nd c
ount
ry-s
peci
fic e
ffec
ts.
The
mat
chin
g pr
oced
ure
used
th
e ke
rnel
est
imat
or o
f Hec
kmam
, Tod
d ( 1
998)
. The
Sam
ple
incl
ude
the
smal
l firm
s (le
ss th
an 1
00 e
mpl
oyee
s) in
non
-trad
able
sect
ors.
Stan
dard
Err
os a
re in
par
enth
esis
nex
t to
the
corr
espo
ndin
g co
effic
ient
s.

Cou
ntry
Cur
renc
y m
ism
atch
Ann
ual c
hang
e in
cu
rren
cy
mis
mat
ch
Exte
rnal
de
bt/G
DP
Cha
nge
in
exte
rnal
de
bt/G
DP
PPP
per c
apita
$
GD
P
Rea
l GD
P gr
owth
Arg
entin
a27
,24,
178
,8-5
,910
678
2,7
Bos
nia&
Her
zego
vina
15,9
-1,0
43,8
33,8
5584
4,8
Bra
zil
-1,4
0,4
27,3
-15,
483
582,
7B
ulga
ria-2
7,2
5,6
80,5
2,3
8564
4,2
Chi
na5,
3-0
,712
,2-5
,537
919,
5C
osta
Ric
a13
,9-1
,130
,34,
984
134,
7C
roat
ia30
,7-0
,866
,946
,014
009
2,8
Cze
ch R
epub
lic-2
4,4
-0,5
39,4
0,8
1896
42,
9Eg
ypt
-3,7
-2,9
29,1
-16,
346
365,
3Es
toni
a11
,32,
280
,387
,014
453
4,6
Gua
tem
ala
-16,
51,
131
,911
,941
993,
5H
unga
ry9,
10,
778
,175
,215
255
2,9
Indo
nesi
a8,
8-0
,165
,2-1
24,6
3039
3,2
Kaz
akhs
tan
-13,
4-0
,376
,655
,076
596,
9La
tvia
6,7
4,2
90,2
94,0
1152
54,
6Li
thua
nia
10,2
1,5
52,4
41,7
1253
04,
2M
exic
o-2
,20,
824
,1-1
3,1
1188
62,
3Pe
ru-8
,9-0
,842
,6-2
1,8
6299
4,4
Phili
ppin
es19
,40,
965
,1-3
8,7
2778
4,0
Pola
nd0,
7-0
,546
,431
,512
966
4,0
Rom
ania
33,9
0,8
38,2
38,2
8661
3,2
Rus
sia
9,5
2,9
46,4
-33,
610
753
4,6
Serb
ia-2
,84,
176
,88,
077
303,
0Th
aila
nd-4
,21,
345
,4-6
5,6
6284
2,8
Turk
ey11
,1-2
,243
,49,
910
012
3,0
Ukr
aine
-12,
84,
553
,268
,049
733,
8U
rugu
ay53
,0-1
,271
,9-1
,495
312,
0V
enez
uela
-5,8
0,3
32,5
-26,
298
062,
9V
ietn
am13
,82,
237
,8-1
5,4
1980
6,9
Sour
ce: s
ee D
ata
App
endi
x
Pane
l 2. D
escr
ipiv
e St
atis
tics F
irm
-Lev
el D
ata.
Sam
ple:
Firm
s with
a L
oan
in 2
005
Surv
eyV
aria
ble
Mea
nSt
d. D
ev.
Inte
rnes
t Rat
e on
Las
t Loa
n0,
140,
07M
atur
ity o
f Las
t Loa
n (M
onth
s)31
,09
29,9
2G
row
th in
Sal
es (a
nnua
lized
)0,
040,
12G
row
th in
Em
ploy
emen
t (an
nual
ized
)0,
050,
19Y
ears
of O
pera
tion
17,0
719
,37
Col
late
ral D
umm
y : B
uild
ing/
Land
0,74
0,44
Col
late
ral D
umm
y: E
quip
men
t0,
900,
29C
olla
tera
l Dum
my:
Acc
ount
s Rec
eiva
ble
0,97
0,18
Col
late
ral D
umm
y: A
sset
s0,
930,
26C
olla
tera
l Dum
my:
Oth
er0,
950,
22Sh
are
Fore
ign
Inpu
t in
Prod
uctio
n0,
350,
38Sh
are
Empl
oyee
s with
Uni
vers
ity D
egre
e0,
250,
26Sh
are
Skill
ed E
mpl
oyee
s 0,
510,
29D
umm
y La
st L
oan
in F
orei
gn C
urre
ncy
0,25
0,43
Sour
ce: B
EEPS
Sur
vey
2005
, EB
RD
/Wor
ld B
ank
Pane
l 1 D
escr
iptiv
e st
atis
tics f
or c
ount
ry p
anel
gro
wth
reg
ress
ions
, ave
rage
s 199
8-20
09T
able
13.
Des
crip
tive
Stat
istic
s
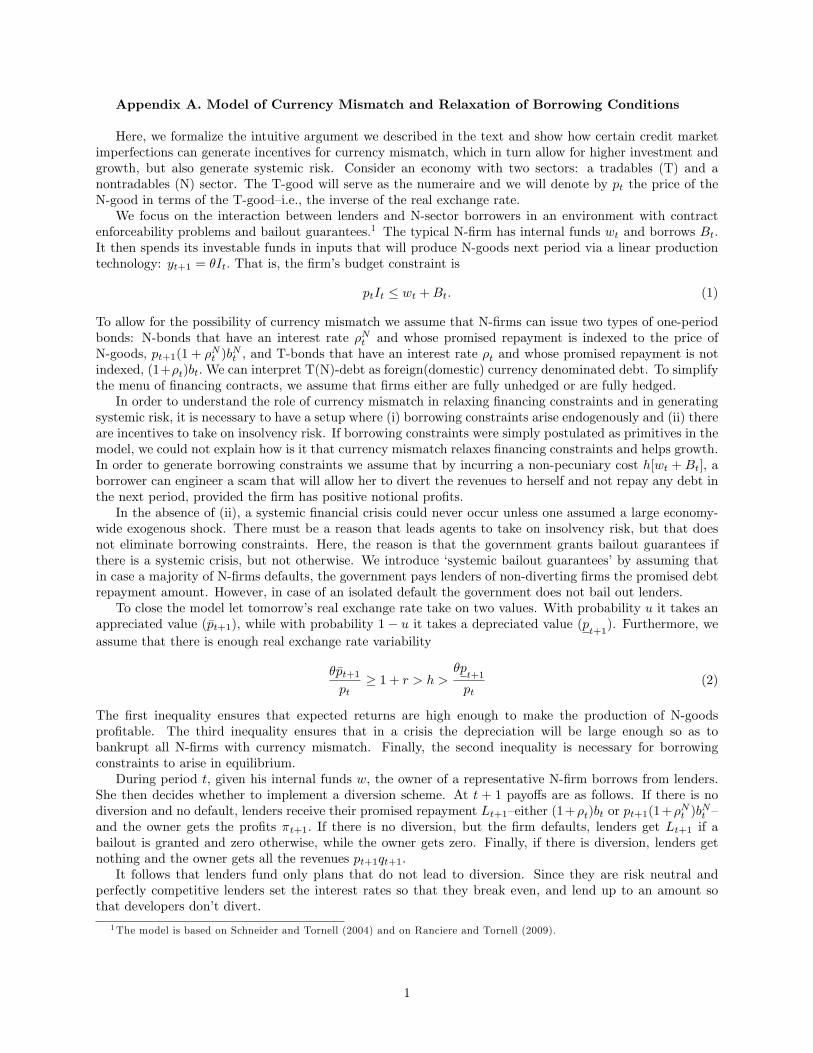
Appendix A. Model of Currency Mismatch and Relaxation of Borrowing Conditions
Here, we formalize the intuitive argument we described in the text and show how certain credit marketimperfections can generate incentives for currency mismatch, which in turn allow for higher investment andgrowth, but also generate systemic risk. Consider an economy with two sectors: a tradables (T) and anontradables (N) sector. The T-good will serve as the numeraire and we will denote by pt the price of theN-good in terms of the T-good—i.e., the inverse of the real exchange rate.We focus on the interaction between lenders and N-sector borrowers in an environment with contract
enforceability problems and bailout guarantees.1 The typical N-firm has internal funds wt and borrows Bt.It then spends its investable funds in inputs that will produce N-goods next period via a linear productiontechnology: yt+1 = θIt. That is, the firm’s budget constraint is
ptIt ≤ wt +Bt. (1)
To allow for the possibility of currency mismatch we assume that N-firms can issue two types of one-periodbonds: N-bonds that have an interest rate ρNt and whose promised repayment is indexed to the price ofN-goods, pt+1(1 + ρNt )b
Nt , and T-bonds that have an interest rate ρt and whose promised repayment is not
indexed, (1+ρt)bt.We can interpret T(N)-debt as foreign(domestic) currency denominated debt. To simplifythe menu of financing contracts, we assume that firms either are fully unhedged or are fully hedged.In order to understand the role of currency mismatch in relaxing financing constraints and in generating
systemic risk, it is necessary to have a setup where (i) borrowing constraints arise endogenously and (ii) thereare incentives to take on insolvency risk. If borrowing constraints were simply postulated as primitives in themodel, we could not explain how is it that currency mismatch relaxes financing constraints and helps growth.In order to generate borrowing constraints we assume that by incurring a non-pecuniary cost h[wt + Bt], aborrower can engineer a scam that will allow her to divert the revenues to herself and not repay any debt inthe next period, provided the firm has positive notional profits.In the absence of (ii), a systemic financial crisis could never occur unless one assumed a large economy-
wide exogenous shock. There must be a reason that leads agents to take on insolvency risk, but that doesnot eliminate borrowing constraints. Here, the reason is that the government grants bailout guarantees ifthere is a systemic crisis, but not otherwise. We introduce ‘systemic bailout guarantees’ by assuming thatin case a majority of N-firms defaults, the government pays lenders of non-diverting firms the promised debtrepayment amount. However, in case of an isolated default the government does not bail out lenders.To close the model let tomorrow’s real exchange rate take on two values. With probability u it takes an
appreciated value (p̄t+1), while with probability 1− u it takes a depreciated value (pt+1). Furthermore, weassume that there is enough real exchange rate variability
θp̄t+1pt
≥ 1 + r > h >θpt+1
pt(2)
The first inequality ensures that expected returns are high enough to make the production of N-goodsprofitable. The third inequality ensures that in a crisis the depreciation will be large enough so as tobankrupt all N-firms with currency mismatch. Finally, the second inequality is necessary for borrowingconstraints to arise in equilibrium.During period t, given his internal funds w, the owner of a representative N-firm borrows from lenders.
She then decides whether to implement a diversion scheme. At t + 1 payoffs are as follows. If there is nodiversion and no default, lenders receive their promised repayment Lt+1—either (1+ρt)bt or pt+1(1+ρ
Nt )b
Nt —
and the owner gets the profits πt+1. If there is no diversion, but the firm defaults, lenders get Lt+1 if abailout is granted and zero otherwise, while the owner gets zero. Finally, if there is diversion, lenders getnothing and the owner gets all the revenues pt+1qt+1.It follows that lenders fund only plans that do not lead to diversion. Since they are risk neutral and
perfectly competitive lenders set the interest rates so that they break even, and lend up to an amount sothat developers don’t divert.
1The model is based on Schneider and Tornell (2004) and on Ranciere and Tornell (2009).
1
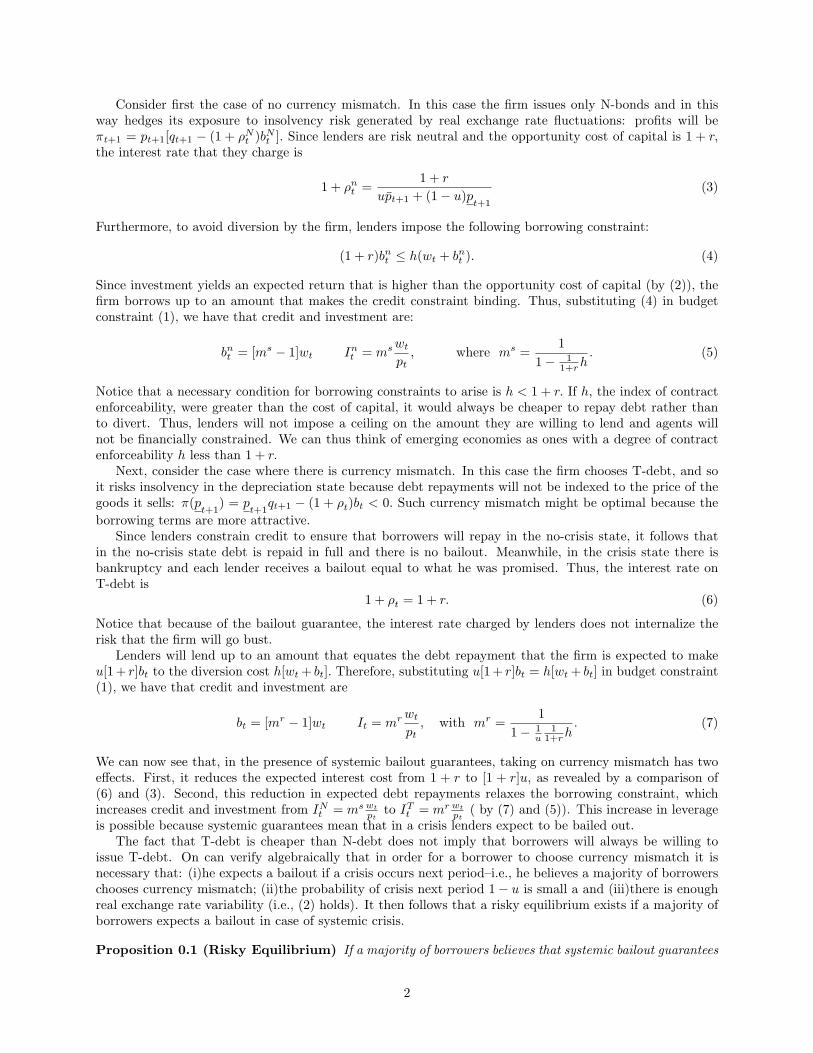
Consider first the case of no currency mismatch. In this case the firm issues only N-bonds and in thisway hedges its exposure to insolvency risk generated by real exchange rate fluctuations: profits will beπt+1 = pt+1[qt+1 − (1 + ρNt )bNt ]. Since lenders are risk neutral and the opportunity cost of capital is 1 + r,the interest rate that they charge is
1 + ρnt =1 + r
up̄t+1 + (1− u)pt+1(3)
Furthermore, to avoid diversion by the firm, lenders impose the following borrowing constraint:
(1 + r)bnt ≤ h(wt + bnt ). (4)
Since investment yields an expected return that is higher than the opportunity cost of capital (by (2)), thefirm borrows up to an amount that makes the credit constraint binding. Thus, substituting (4) in budgetconstraint (1), we have that credit and investment are:
bnt = [ms − 1]wt Int = m
swtpt, where ms =
1
1− 11+rh
. (5)
Notice that a necessary condition for borrowing constraints to arise is h < 1 + r. If h, the index of contractenforceability, were greater than the cost of capital, it would always be cheaper to repay debt rather thanto divert. Thus, lenders will not impose a ceiling on the amount they are willing to lend and agents willnot be financially constrained. We can thus think of emerging economies as ones with a degree of contractenforceability h less than 1 + r.Next, consider the case where there is currency mismatch. In this case the firm chooses T-debt, and so
it risks insolvency in the depreciation state because debt repayments will not be indexed to the price of thegoods it sells: π(p
t+1) = p
t+1qt+1 − (1 + ρt)bt < 0. Such currency mismatch might be optimal because the
borrowing terms are more attractive.Since lenders constrain credit to ensure that borrowers will repay in the no-crisis state, it follows that
in the no-crisis state debt is repaid in full and there is no bailout. Meanwhile, in the crisis state there isbankruptcy and each lender receives a bailout equal to what he was promised. Thus, the interest rate onT-debt is
1 + ρt = 1 + r. (6)
Notice that because of the bailout guarantee, the interest rate charged by lenders does not internalize therisk that the firm will go bust.Lenders will lend up to an amount that equates the debt repayment that the firm is expected to make
u[1+ r]bt to the diversion cost h[wt+ bt]. Therefore, substituting u[1+ r]bt = h[wt+ bt] in budget constraint(1), we have that credit and investment are
bt = [mr − 1]wt It = m
rwtpt, with mr =
1
1− 1u
11+rh
. (7)
We can now see that, in the presence of systemic bailout guarantees, taking on currency mismatch has twoeffects. First, it reduces the expected interest cost from 1 + r to [1 + r]u, as revealed by a comparison of(6) and (3). Second, this reduction in expected debt repayments relaxes the borrowing constraint, whichincreases credit and investment from INt = ms wt
ptto ITt = m
r wtpt( by (7) and (5)). This increase in leverage
is possible because systemic guarantees mean that in a crisis lenders expect to be bailed out.The fact that T-debt is cheaper than N-debt does not imply that borrowers will always be willing to
issue T-debt. On can verify algebraically that in order for a borrower to choose currency mismatch it isnecessary that: (i)he expects a bailout if a crisis occurs next period—i.e., he believes a majority of borrowerschooses currency mismatch; (ii)the probability of crisis next period 1− u is small a and (iii)there is enoughreal exchange rate variability (i.e., (2) holds). It then follows that a risky equilibrium exists if a majority ofborrowers expects a bailout in case of systemic crisis.
Proposition 0.1 (Risky Equilibrium) If a majority of borrowers believes that systemic bailout guarantees
2

are present and there is a small likelihood of a severe real exchange rate depreciation—i.e., condition (2) holdsand probability 1 − u is small—then there is a risky equilibrium in which a majority of borrowers take oncurrency mismatch. In this equilibrium:
1. Borrowers that take on currency mismatch have lower interest rate costs, as the government implicitlycovers the depreciation premium.
2. Currency mismatch relaxes borrowing constraints as lower expected debt repayments reduce the agencyproblems.
3. Currency mismatch leads to more investment and growth in no-crisis times.
4. However, firms that take on currency mismatch are vulnerable to bankruptcy in case of a severe depre-ciation.
In our micro-level empirical analysis we test the implications of this proposition. In a risky equilibriumthere can be two firms with identical observable characteristics, but with different bailout expectations. Asa result a firm that expects a bailout will take on currency mismatch while a firm that does not expecta bailout will not. Since both firms have the same observable characteristics, we can thus attribute thedifferences in interest rate costs and growth rates to the adoption of currency mismatch.For the macroeconomic analysis of currency mismatch consider a risky economy—with currency mismatch—
and a safe economy. The proposition above implies that the risky economy will have a higher average growthrate than the safe economy. However, the risky economy will experience—rare—crises. We use this implicationof the model.We have taken the price path as exogenous. The next step is to embed the borrowing and lending
equations in a dynamic general equilibrium framework and confirm that equilibrium prices satisfy (2). Suchanalysis is carried out by Schneider and Tornell (2004) and on Ranciere and Tornell (2009).
3

�
Appendix�B.�Calculation�of�Currency�Mismatch�and�Data�Sources
Definition
The measure of currency mismatch in the paper is the gap between foreign currency assets and liabilities, both with respect to residents and non residents (domestic and foreign net assets in foreign currencies), adjusted for an estimate of foreign currency lending that is not hedged, and divided by total bank assets. The formula of the calculation is the following:
foreign currency denominated net liabilities = {foreign currency foreign liabilities + foreign currency domestic liabilities � foreign currency foreign assets � foreign currency domestic assets + foreign currency lending to unhedged households + foreign currency lending to unhedged nonfinancial firms} / {total bank assets}
In more detail:
� Foreign currency foreign liabilities include all foreign currency claims of nonresidents towards the domestic banking sector, such as loans of foreign banks, including parent foreign banks to their domestic subsidiaries, and foreign currency deposits of nonresidents. Bank loans from abroad reached high levels during the recent boom in emerging Europe. Foreign currency deposits of nonresidents were also substantial in some countries.
� Foreign currency domestic liabilities include all foreign currency claims of residents towards the domestic banking sector, such as foreign currency deposits of residents. The latter have been historically very large in emerging Europe.45
� Foreign currency foreign assets include all foreign currency claims of the banking sector towards nonresidents, such as deposits, or loans in foreign currencies.
� Foreign currency domestic assets include all foreign currency claims of the banking sector towards residents, such as foreign currency loans, which grew very rapidly during the recent boom in emerging Europe.
� Foreign currency lending to households is part of the banks’ foreign currency domestic assets. However, many households have no foreign currency income, and therefore, are not hedged when they borrow in foreign currency. Therefore, the calculation of the banks’ currency mismatch subtracts foreign currency lending to such households from the banks’ foreign currency assets, because such lending is assumed to be subject to exchange rate risk, directly for the households, and indirectly, through credit risk, for the banks. Private sector foreign currency deposits, including of households, are large in emerging Europe and do provide a hedge. However, it is reasonable to expect that households with large foreign currency deposits don’t need to also borrow in foreign currency. As data on the share of households that are not hedged are not available, we have assumed that this share is equal to the share of firms without foreign currency income (where the households are employed). As a robustness test, we also consider the case in which households cannot hedge at all.
� Foreign currency lending to nonfinancial firms is also part of the banks’ foreign currency domestic assets. However, some of this lending goes to firms that do not have foreign currency income and are, therefore, not hedged, resulting in credit risk for the banks and, indirectly, exchange rate risk. To adjust for the latter, we subtract foreign currency loans to nonfinancial firms that have no foreign currency income from the banks’ foreign currency domestic assets (we assume that financial firms have foreign currency income).
� Finally, we divide by total bank assets, to adjust for the size of the banking sector in each country. We also test the robustness of the results when we divide our measure by GDP.
Data sources
������������������������������������������������������������45 According to anecdotal evidence, during east Europe’s liberalization in the early 1990s, large amounts of foreign currency that were “held in mattresses,” primarily Deutsche Marks, were deposited in banks. They were later converted into euros. Initially, they served as a hedge against inflation, given memories of price instability during liberalization. Even though inflation stabilized at low levels in the current decade, most of these deposits remained, in some cases in anticipation of euro adoption.

�
Data on foreign currency domestic and foreign asset and liabilities by sector and data on total bank assets are from Haver Analytics. Data are available for 10 countries: Bulgaria, Croatia, Czech Republic, Estonia, Hungary, Latvia, Lithuania, Poland, Romania, and Ukraine. These economies produce 86 percent of East Europe’s GDP, excluding Russia. Based on data availability, we measure currency mismatches for the period 1998-2009, although in most cases we focus on the boom and bust period during 2004-2007. Data on direct foreign currency from abroad, which are also discussed in the text and are added in the measure of currency mismatch as a robustness test, are from Rosenberg and Tirpak (2009).
We use a number of sources for the share of foreign currency lending to firms with no foreign currency income. Up to 2003, this share is based on EBRD survey data for 2002 and equals the share of nonexporting companies with foreign currency loans to total companies with foreign currency loans. For the subsequent years, we use EBRD survey data for 2005 for the Czech Republic, Estonia, Hungary, Lithuania, and Poland.46 For Bulgaria and Romania, the share of unhedged foreign currency lending is given by the share of corporate foreign currency lending to tradable sectors, as estimated in Sorsa, Bakker, Duenwald, Maechler, and Tiffin (2007). For Croatia, it is based on Central Bank survey data for the share of foreign currencies loans to unhedged clients (this includes both households and corporates; see Hilaire and Ilyina (2007)). And for Latvia, it is estimated based on data provided by the central bank for the share of tradables in corporate foreign currency loans. The results remain robust if we use only EBRD data, or if we use only data from the sources described above for Bulgaria, Romania, Croatia, and Latvia, and assume that the other countries have similar shares of unhedged foreign currency lending (taking the average, or the minimum).
A number of alternative sources were combined to expand the currency mismatch data set to additional emerging economies. Data on foreign currency loans to residents and foreign currency deposits of residents are from the confidential IMF Vulnerability Exercise for Emerging Economies, based on data provided by country authorities. Some gaps in the data on foreign currency deposits of residents are complemented by using data in Haver Analytics and in Arteta (2003 and 2005).
We use various sources for the share of unhedged foreign currency borrowing in the corporate sector. The share of unhedged foreign currency borrowing for Latin America is based on firm survey data in Kamil (2004 and 2010) and is assumed to be equal to the share of nonexporting companies with foreign currency loans to total companies with foreign currency loans. The share for other economies is from the World Bank’s Enterprise Survey (https://www.enterprisesurveys.org/Portal/Login.aspx?ReturnUrl=%2fPortal%2felibrary.aspx%3flibid%3d14&libid=14) and is also assumed to be equal to the share of nonexporting companies with foreign currency loans to total companies with foreign currency loans. We have assumed that a company with a share of foreign currency loans in total loans higher than 30 percent could be subject to exchange rate risk. If a company sells more than 70 percent of its products domestically then it is labeled as a nonexporter (the results are robust to alternative thresholds). The estimates using the World Bank data are for various years during the period that we are considering, for most cases during 2002-2004, but we use the earliest or the latest observation for the years before, or after respectively.
For bank foreign assets and liabilities in foreign currency, we use data constructed by Prat (2007) for Argentina, Brazil, China, Indonesia, Mexico, Peru, Philippines, Russia, Thailand, Turkey, and Uruguay. And we use IMF IFS data for Bosnia&Herzegovina, Costa Rica, Egypt, Guatemala, Kazakhstan, Serbia, Venezuela, and Vietnam. The latter, however, does not specify the currency denomination of the banks’ foreign assets and liabilities. We have therefore assumed that all the banks’ foreign assets and liabilities for these countries are denominated in foreign currency. The data for the long-run growth regressions are from the IMF World Economic Outlook database, except of the trade share and the age dependency ratio, which are form the World Bank’s World Development Indicators.
������������������������������������������������������������46 The EBRD survey data (BEEPS Firm Level Data) for 2002 refer to the stock of debt. However, the data for 2005 refer to the last loan only. We have assumed that the latter applies to the stock of debt as well, which is an approximation. The results are robust if we do not make this assumption and use other proxies instead, as the appendix discusses.

Cha
nge
in c
urre
ncy
mis
mat
ch0.
11**
0.11
*0.
23**
*0.
23*
0.08
**0.
08*
(0.0
4)(0
.07)
(0.0
7)(0
.14)
(0.0
4)(0
.05)
Lagg
ed c
hang
e in
cur
renc
y m
ism
atch
0.05
0.09
0.05
0,07
0.13
0.20
***
0.15
0.17
**0,
040.
07**
*0,
040.
05**
(0.0
4)(0
.04)
(0.0
5)(0
.05)
(0.0
8)(0
.05)
(0.1
0)(0
.09)
(0.0
4)(0
.02)
(0.0
3)(0
.02)
Cris
is d
umm
y-1
2.01
***
-12.
48**
*-1
2.09
***
-12.
32**
*-1
1.76
***
-12.
92**
*-1
1.39
***
-12.
68**
*(0
.58)
(0.6
2)(0
.73)
(0.7
6)(0
.59)
(0.6
5)(0
.71)
(0.7
9)
Inte
ract
ion
term
: (ch
ange
in c
urre
ncy
mis
mat
ch) x
(c
risis
dum
my)
-0.2
7***
-0.1
7**
-0.7
7***
-0.8
9***
(0.0
4)(0
.07)
(0.0
7)(0
.16)
Inte
ract
ion
term
: (la
gged
cha
nge
in c
urre
ncy
mis
mat
ch) x
(cris
is d
umm
y)-0
.99*
**-0
.90*
**-0
.88*
**-0
.94*
**-1
.97*
**-1
.50*
**-2
.07*
**-1
.65*
**(0
.04)
(0.0
4)(0
.10)
(0.0
7)(0
.08)
(0.0
5)(0
.26)
(0.1
5)
Cha
nge
in n
ontra
dabl
es/G
DP
1.43
***
1.47
***
0.97
***
1.00
***
(0.4
1)(0
.46)
(0.2
7)(0
.22)
Inte
ract
ion
term
: (ch
ange
in c
urre
ncy
mis
mat
ch) x
(c
hang
e in
non
trada
bles
/GD
P)-0
.02
0.00
(0.0
5)(0
.02)
Inte
ract
ion
term
: (la
gged
cha
nge
in c
urre
ncy
mis
mat
ch) x
(cha
nge
in n
ontra
dabl
es/G
DP)
0.13
***
0.12
***
-0.0
1-0
.00
(0.0
4)(0
.02)
(0.0
3)(0
.02)
Adj
uste
d R2
0,70
0,69
0,66
0,66
0,74
0,71
0,73
0,69
0,32
0,29
0,67
0,67
Num
ber o
f cou
ntrie
s10
1010
1010
1010
1010
1010
10
Fixe
d ef
fect
s
Not
e: T
he d
epen
dent
var
iabl
e is
real
GD
P gr
owth
(fro
m th
e IM
F W
orld
Eco
nom
ic O
utlo
ok d
atab
ase)
. Cur
renc
y m
ism
atch
in th
e la
st fo
ur re
gres
sion
s is m
easu
red
as e
xpla
ined
in th
e te
xt a
nd th
e ap
pend
ix. I
n th
e fir
st fo
ur re
gres
sion
s, th
e cu
rren
cy
mis
mat
ch m
easu
re a
ssum
es th
at h
ouse
hold
s don
't he
dged
exc
hang
e ra
te ri
sk a
t all.
In th
e ne
xt fo
ur re
gres
sion
s, cu
rren
cy m
ism
atch
is d
ivid
ed b
y G
DP
inst
ead
of to
tal b
ank
asse
ts. T
he c
risis
dum
my
take
s the
val
ue o
f 1 in
200
9, w
hich
is th
e ye
ar
whe
n gr
owth
turn
ed n
egat
ive
thro
ugho
ut e
mer
ging
Eur
ope.
The
sam
ple
incl
udes
10
emer
ging
Eur
opea
n ec
onom
ies:
Bul
garia
, Cro
atia
, Cze
ch R
ep.,
Esto
nia,
Hun
gary
, Lat
via,
Lith
uani
a, P
olan
d, R
oman
ia, a
nd U
krai
ne. T
he p
erio
d is
199
8-20
09,
exce
pt fo
r the
last
four
regr
essi
ons,
in w
hich
the
perio
d is
199
8-20
07, b
ecau
se d
ata
for t
he p
rodu
ctio
n of
non
trada
bles
is n
ot a
vaila
ble
for m
ore
rece
nt y
ears
--th
eref
ore,
thes
e sp
ecifi
catio
ns d
o no
t inc
lude
the
cris
is d
umm
y. S
tatis
tical
sign
ifica
nce
is
som
ewha
t low
er in
som
e sp
ecifi
catio
ns w
ith fi
xed
effe
cts,
beca
use
of th
e sm
all s
ampl
e. H
eter
osce
dast
icity
-con
sist
ent s
tand
ard
erro
rs in
par
enth
eses
. *, *
*, a
nd *
** in
dica
te st
atis
tical
sign
ifica
nce
at th
e 10
, 5 a
nd 1
per
cent
leve
l, re
spec
tivel
y.
Tabl
e B
.1. C
urre
ncy
mis
mat
ch a
nd g
row
th in
em
ergi
ng E
urop
e, 1
998-
2009
, rob
ustn
ess t
ests
Ass
umin
g ho
useh
olds
don
't he
dge
Pool
ed p
anel
Fixe
d ef
fect
s
Cur
renc
y m
ism
atch
div
ided
by
GD
P
Pool
ed p
anel
Fixe
d ef
fect
s
Con
trolli
ng fo
r the
incr
ease
in n
ontra
dabl
es (1
998-
2007
)
Pool
ed p
anel