curj | summer 2005
TRANSCRIPT

���������������������
��������������������������������������
���������������������������������������������������������������������������
�����������


COVER FEATURE
28 IT’S ALIVE! by James Jeanne and Jiajing XuIntegration of locomotion and vision capabilities into the HOAP-2
Humanoid Robot.
Cs4
COMPUTER SCIENCE LETTERS
4 MARTIAN MISSIONS an interview with Rob Manning
6 HARNESSING TECHNOLOGY AND INNOVATIONFOR A SUSTAINABLE WORLD by Regina Clewlow
REVIEWS
8 3… 2… 1… BLASTOFF! by Jesse ParkerAn overview of the components necessary in the design of a cansat.
12 ENABLING SILICON OPTOELECTRONICSby Issac Garcia-MunozEnhanced silicon nanocrystal photoluminescence is achieved via
gold-silicon coupling.
RESEARCH
20 CREATING GRADIENTS WITHIMMOBILIZED PROTEINS by Maryam AliA microfl uidic device is used to distribute proteins in a
concentration gradient.
34 INSPIRED BY NATURE by Gus ZhangThe structures of writing and symbols throughout history can
be traced to natural scenes.
40 LOW TEMPERATURE, HIGH FREQUENCYPERMEABILITY OF METGLAS 2714A by Nicholas R. HutzlerThe low temperature, high frequency permeability of Metglas 2714A
improves its potential for use as a core material for EMI fi lters.
FINIS
44 ORCHID by Andrea Offermann
A1
AEROSPACE
ELECTRICAL ENGINEERING
2
Ee
CHEMICAL ENGINEERING
3
Ce
N5
NEUROSCIENCE
Ap6
APPLIED PHYSICS

for more information:
www.curj.caltech.edu
THE CALTECH UNDERGRADUATE RESEARCH JOURNAL INVITES REVIEW & RESEARCH SUBMISSIONS FROM UNDERGRADUATES AT ANY INSTITUTION.Caltech’s Summer Undergraduate
Research Fellowships program
introduces students to research under
the guidance of seasoned mentors.
Students experience the process of
research as a creative intellectual
activity and gain a more realistic view
of the opportunities and demands of
a professional research career.
Fellowships are also available to
non-Caltech students.
SURF
For more information go tohttp://surf.caltech.eduor phone 626.395.2885
PROGRAM

How many of us have looked skyward and had thoughts of cosmic proportions? How long has man been fascinated by the sky and its manifold treasures? The knowledge of the universe available to us from mere observation of the sky is staggering. How much more could we learn about a piece of this universe by actually going there? Humans have yet to feel the crunch of Martian rocks beneath their feet, but there are those who spend their lives doing the next best thing. In this issue Dr. Robert Manning, Mars Directorate Chief Engineer at NASA’s Jet Propulsions Laboratory, discusses his work investigating the “red planet” with the Mars Exploration Rover project as well as man’s obsession with learning about that vast portion of the universe which exists beyond our own world.
Dr. Manning has worked at the Jet Propulsion Laboratory for almost 25 years. Before his work with the Mars Exploration Rover, Dr. Manning was the Chief Engineer for the highly successful 1997 Mars Pathfi nder mission which included responsibility for entry,descent and landing. Prior to his Pathfi nder work he developed computers and fault tolerant electronic systems for JPL’s deep space missions, including the Cassini mission to Saturn and the Galileo mission to Jupiter.
We all have our own curiosities, and as scientists and engineers, our curiosities often provide the impetus for us to produce amazing achievements. The research you fi nd documented within this journal is the product of the curiosity of undergraduates — the kind of curi-osity which can grow into an obsession that may ultimately result in changing the way we live our lives. From creating new robots with revolutionary locomotion and vision systems to coming to a deeper understanding of the forces that shaped the development of the characters we use in language today, undergraduates have taken that initial step in the exploration of their own private universes.It is this pursuit of these curiosities that facilitates their growth into obsessions which lead to fulfi lling careers such as Dr. Manning’s. Can there be a more rewarding vocation than one in which yourprimary responsibility is to transform obsession into discovery?Inside these pages you will encounter the nascent obsessions that drive the leaders of tomorrow’s scientifi c world.
Tim Tirrell Editor-in-Chief
EXECUTIVE EDITORS
Editor-in-ChiefTim Tirrell
Executive Content EditorsEwen ChaoMithun DiwakarKevin Peng
Art Director/DesignerSean Starkweather
Executive Online EditorZhizhang Xia
Executive Operations ManagerSanjeeb Bose
ASSOCIATE EDITORS
Associate Content EditorsNeha DasJack Lee
Associate Online EditorJoseph Johnson
Associate Operations ManagersWarner LeedyAkshay Singal
STAFF COLLABORATORS
Ramone MuñozGraphics Advisor, Art Center College of Design
Carolyn AshDirector, Student Faculty Programs
Preston McAfeeProfessor of Business Economics & Management
COVER IMAGE
Hope for HOAP-2 Sean Starkweather
CURJ DONORS
Caltech AdministrationTypecraft Wood & Jones
CALTECH UNDERGRADUATERESEARCH JOURNAL vol. v no. i
Original CURJ Design by Aniko Hullner Grau©2005 curj. all rights reserved.this issue not for resale
F R O M T H E E D I TO R
www.curj.caltech.edu

4
MARTIAN MISSIONS
AN INTERVIEW WITH ROB MANNING
Rob Manning grew up in a small town where the person with the most technical and scientific knowl-edge was the town doctor. He began his work at NASA’s Jet Propulsions Laboratory (JPL) as a drafts-man during his college years, and his fascination with his work drove him to become one of the best in his field; he is now the Mars Directorate Chief Engineer at JPL. He was gracious enough to donate some of his time to discuss with us science, his job, and the exploration of our planetary neighbor, Mars.
CURJ: What responsibilities do scientists and engineers have with regards to the rest of society?
Robert Manning: We have a huge responsibility to the public. In my case, I’m directly funded through the good graces of the taxpayer. So we have a huge re-sponsibility to not waste the money that we’re given and to do our work in as open and careful a way we can. We’re putting things into space, but sometimes they fall down. And so it’s not enough to do the right things to lower risks. We have a responsibility to always do the best we can.
The work we do is really not much different from a giant art project. A group of people gather and ac-complish something in an open manner, while staying receptive to criticism. As soon as we start to believe that we are smarter or better than average person, we’re doomed. We have to communicate what we do, and why we do what we do.
CURJ: What is the best part of your job?
RM: To begin with, my job has requires incredible diversity and technical breadth; I have to understand concepts from how control software works to how parachutes inflate to how rover wheels drive in dirt.
The diversity of things that I get to learn about is be-yond what I believed I would experience in my career. A close second is being able to work with people who are really interesting and some of the best at what they do. It’s a thrill to be around them and to experi-ence the diversity of their education, knowledge and approach to problems.
CURJ: Why are some of us so attracted to the explora-tion of Mars?
RM: I was drawn to Mars because I have long been surrounded by Mars aficionados; they rub off — it just does something to you. It was a real privilege for me to help them get the science they wanted, and in the act of doing so, I became a Mars buff myself. While there are practical reasons why Mars is an attractive candidate for exploration (it is much easier to access and explore than Jupiter or Saturn), I think science fiction lore behind Mars helps drives public interest.
But in addition, people outside of the scientific community are fascinated with Mars. This might be an American predilection, because our culture has long been one of exploration and pioneering — it’s part of American mythology. We’re also exploring one of the many “final frontiers,” and this “final frontier” is an easy one for people to wrap their imaginations around. Easier than say, imagining compact extra spatial dimensions. To see a panorama or a movie of a dust devil coursing through the plains of a Martian crater, one can’t help feel that it’s close. But there’s something very chilling about the realization that it’s not taking place on Earth. By sending rovers we are “transporting” ourselves to Mars, and I believe that resonates well with the American psyche.
CURJ: What have we learned recently about Mars and do we think we will find evidence of life?
RM: Not only is there striking evidence that there was once water on Mars, but we think that there may still be some water there. Spectrometers have indicated significant amounts of Hydrogen atoms lurking not too deep below surface, which may quite likely be some form of water.
�������

www.curj.caltech.edu 5 S U M M E R 2 0 0 5
In addition, we have found meteorites (on earth) that have a unique signature of isotopic abundances that identify them from being from Mars. And so it is quite possible we have been exchanging biological systems with Mars for many years. And if Mars once had somewhat habitable environment, possibly more habitable at that point in time than Earth’s, it’s some-what possible that organisms may have evolved there and been transported to Earth aboard meteorites. Our view of where life can evolve has changed much over time. While there is not yet evidence concluding that there was ever life on Mars, all the excuses why it can’t happen have fallen away as we discover the liquidity of life on this planet.
CURJ: Do we need to bring samples of Mars backto Earth?
RM: Remote study of mineralogy has been good so far, but investigation of biology will be very diffi cult with-out returning samples to Earth. We have postulated a way to return samples back to Earth, but we are limited in the amount that we can bring back. Cur-rently, we estimate that we might be able to return as much as one kilogram of core samples, but what are the odds of a rover being able to reach places where life exists? The surface is constantly being sterilized by UV rays, so any existing life will be diffi cult to ac-cess. The trick is how to fi nd life, which is an issue we are still working on. Our current goal is to launch a sample from the surface of Mars by 2016 and return it to Earth a year or so later.
CURJ: Will humans ever land on Mars? What is so hard about sending people there?
RM: NASA would like to send humans to Mars, but many are concerned that this is easier said than done. It’s not out of the question, but it will be much harder than going to the Moon — a mission will take a year or two, as compared to a week for the Moon. It’s a case where the public will have to weigh in and ask where we want to go as a people and what the legacy of our culture we want to leave. NASA can offer the means and the will, but public has to be on board.
Prior to his role as Mars Directorate Chief Engineer, Rob Manning was the Systems Engineering Manager as well as the Entry Descent and Landing Manager for the Mars Exploration Rover (MER) project that landed twin rovers on the surface of Mars in early 2004. He has held many positions and worked on many projects in his 25 years at JPL, including Chief Engineer of the Mars Pathfi nder mission and designer on the Cassini and Galileo missions to Saturn and Jupiter. As a result of his adventures at JPL, Rob has received two NASA medals and is in the Aviation Week Magazine Space Laureate Hall of Fame in the Smithsonian Air and Space Museum. In 2004, SpaceNews named Rob as one of 100 people who made a difference in civil, commercial and military space since 1989.
Rob is a graduate of Caltech (BS ‘82) and Whitman College (BA ’80), where he studied math, physics, computer science and control systems. He makes his home in Pasadena with his wife Dominique and their seven year old daughter, Caline.
CURJ: How do robotics compare with human Marsexploration?
RM: As we have seen, robotic systems can deliver great science, but over much longer timescales with multiple missions each carrying a small set of equip-ment. For example, a single small rover might only carry a handful of instruments that could fi t on your desktop with very limited lab capabilities. In com-parison, the best scientifi c instruments on Earth are still size of a room. A human-scale mission would of-fer much better and faster sample collection, sample analysis, and real-time visual observation than our miniaturized robotic mission could ever achieve.Eventually robotic systems will be invented that will do much better than we have done today, but bringing the laboratories and the best scientists to Mars will inevitably result in superior science. It all depends on how patient we want to be.
CURJ: What should an undergraduate do to getinvolved? Are there jobs in this business?
RM: Learn the basics and use what you know to take advantage of opportunities at NASA and institutions like JPL. There are co-ops, academic part time posi-tions and other programs that allow young people to get exposed to this sort of work. I was lucky and found an academic part time position as a draftsman at JPL. While drafting may not seem like the most in-teresting way to spend my time, it excited me to draw schematics of things that would go to another planet. There’s really nothing like “on-the-job” training.
�������

6
Engineers for a Sustainable World (ESW), a rap-idly-growing network of students and professionals, is committed to improving the quality of life for people around the world. The organization addresses two critical challenges: 1) reducing poverty; and 2) ensur-ing that the world’s resources can provide for future generations.
Since 2002, ESW has mobilized thousands of en-gineers who want to make a difference. At university campuses across the nation, ESW chapters are edu-cating their peers and their communities about critical global issues. And, being the fantastic problem- solvers that they are, these engineers are seeking in-novative solutions to address these issues through research and design projects.
ESW chapters have formed senior-level design projects, graduate level research, as well as entirely new undergraduate courses to involve their universi-ties in the fight against global poverty. For example, through an undergraduate “Engineers for a Sustain-able World” course at Cornell University, project teams have designed water distribution systems for communities in rural Honduras, increasing access to water for hundreds of families. They have also de-veloped methods for filtering vegetable oil so it can be used as a fuel for vehicles. These project courses, started by ESW members at Caltech, University of Michigan, Stanford University and other institutions are leveraging the skills of technical problem-solvers to address real-world issues. In doing so, we believe they are fostering a generation of engineering students who are committed to tackling global challenges.
HARNESSING TECHNOLOGY AND INNOVATION FOR A SUSTAINABLE WORLD
BY REGINA CLEWLOW Executive Director of Engineers for a Sustainable World
Engineers are fantastic problem-solvers. Thanks to engineers, we can access the internet through a mobile phone, travel over 300 kilometers per hour by “bullet train,” and purchase ripe tropical fruits at our local grocery stores in the dead of winter. Every day, those of us who live in rich countries benefit from the ingenuity of engineers. However, nearly half of the world’s population does not see the fruits of the engineer’s labor.
Consider the living conditions in Sub-Saharan Africa. The region of the world with the largest share of people living on less than $1 a day, nearly 20% of its children die before the age of five. For approximately 70% of deaths before age five in developing countries, the cause is a disease or combination of diseases that would be preventable in a high-income country. Increasing access to basic resources, such as water, food, and sanitation play a large role in ensuring that more children in impoverished nations have a chance to live.
What can we do to make a difference? Practitio-ners and researchers from many fields — economics, medicine, policy — are joining forces to address the pressing challenges of poverty and global sustain-ability. Now, a new organization is harnessing the in-novation and technical know-how of the engineering community.
�������

www.curj.caltech.edu 7 S U M M E R 2 0 0 5
What can you do to help? Whether you are a stu-dent or professional, here are a few recommendations for how you can be part of the solution:
LEARN ABOUT THE PROBLEMS; THE TECHNICAL
CHALLENGES ARE JUST ONE PIECE OF THE PUZZLE.
We technical problem-solvers sometimes have a hard time seeing the big picture. For students, this is un-derstandable; in most engineering programs, you have few opportunities to take courses outside of the core science/math/engineering curriculum. However, in order to fully appreciate how technical innovation can be harnessed to benefit humanity, it is essential to educate oneself about the various economic, cultural, and political factors that are embedded in the prob-lems you seek to solve.
How can you learn more about the problems? Attend lectures and seminars on global development, both within and outside of the engineering commu-nity. Learn about another culture by studying abroad (if you are serious about international work, consider learning French and/or Spanish). Stay informed about current international, poverty and energy issues. In fact, one of the major functions of an ESW campus or professional chapters is to impart knowledge of global issues to their members and community at large.
BUILD PARTNERSHIPS — ACROSS DISCIPLINES
AND ACROSS NATIONAL BOUNDARIES.
The challenges are enormous, and solutions bound to be quite complex. Engineers, great problem-solvers though we are, cannot provide sustainable access to
clean water, sanitation facilities, or even information technology, alone. It is essential to develop multi-dis-ciplinary approaches to tackle these great challenges, and building partnerships across disciplines is one step in this direction.
It is through solving problems that we create, learn, and innovate. If we solve the problems of the developing world without involving local organiza-tions and people in the problem-solving process, how can we create lasting solutions? One of ESW’s core values is to build partnerships with local non-govern-mental organizations, entrepreneurs and academic institutions, working with them to creating lasting solutions to poverty.
At a time when a significant portion of the world’s population lives in poverty and there are opportunities for science and technology to be part of the solution, it is critical that engineers become a part of the discussion and action. At heart, we are all problem-solvers, and there are a great number of challenges to address.
For further information about Engineers for a Sustainable World, please visit our website at: http://www.esustainableworld.org
Regina Clewlow is a leader in the field of engineering for sustainable development. She is co-founder and Executive Director of Engineers for a Sustainable World (ESW), a non-profit organization that seeks to reduce poverty and improve global sustainability. Within its first three years, ESW has mobilized 3,000 engineering students and professionals committed to developing innovative solutions to build a more sustainable world. Regina was recognized by the Society of Women Engineers as a “New Face in Engineering” for National Engineers Week 2005. She received her B.S. in Computer Science and M.E. in Civil & Environmental Engineering from Cornell University.
�������

���������������
ONE OF THE MAIN PROBLEMS INHERENT WITH STUDENT SPACECRAFT projects is the length of time from concept to launch operations of a typi-cal spacecraft. With an average project length of five years or more, a typical student does not get very broad exposure to all of the phases present in the creation and operation of a spacecraft. Cansat projects give students the oppor-tunity to participate in the creation of a spacecraft-like system at an affordable cost and in a reasonable time frame.
WHAT IS A CANSAT?
A cansat is a small, telemetry-gathering payload launched to an altitude of around 12,000 feet using a high powered rocket. It is then released from the rocket and allowed to parachute down while recording data and either sending it to a ground station or storing it for later retrieval.
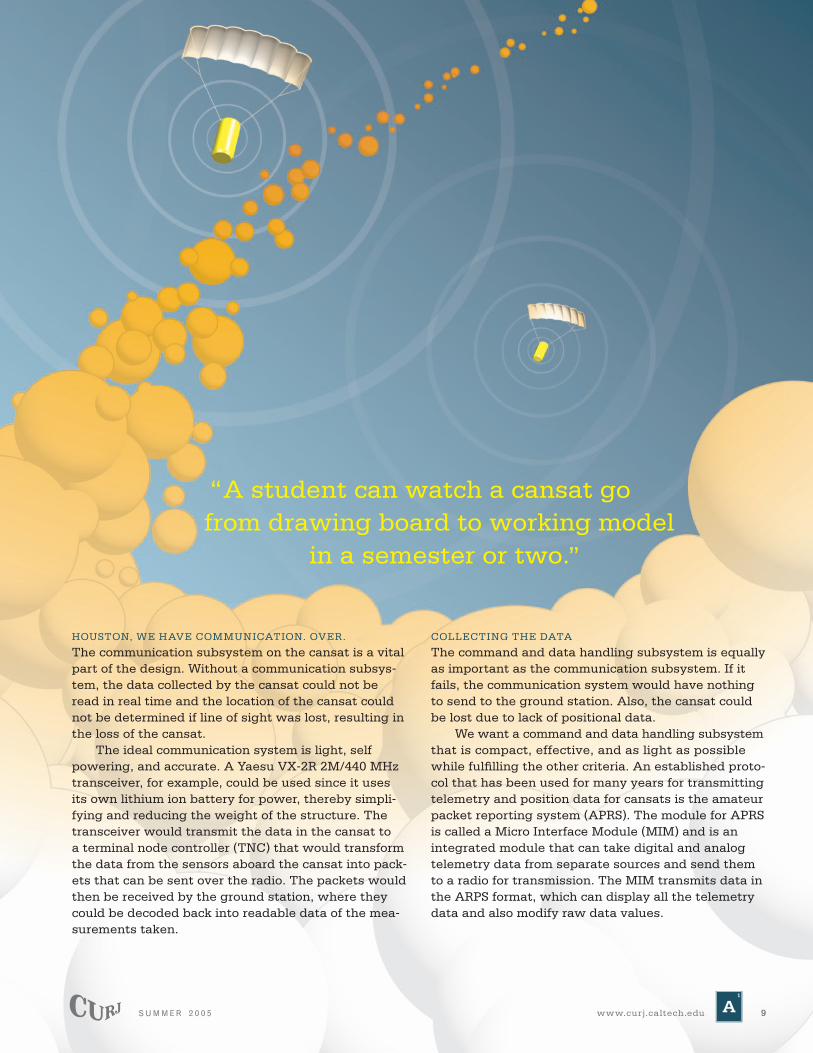
The design of a cansat has many variables that need to be explored to maximize accuracy of the received data as well as meeting mass and size requirements. This provides students with an experience very similar to what they would go through while working on a real spacecraft, but in a much shorter time frame and with a small budget. A student can watch a cansat go from drawing board to working model in a semester or two. This article focuses upon the following elements of a cansat design: communication, command and data handling, pressure, temperature, GPS, power, and structural design.
8
A1
HOUSTON, WE HAVE COMMUNICATION. OVER.
The communication subsystem on the cansat is a vital part of the design. Without a communication subsys-tem, the data collected by the cansat could not be read in real time and the location of the cansat could not be determined if line of sight was lost, resulting in the loss of the cansat.
The ideal communication system is light, self powering, and accurate. A Yaesu VX-2R 2M/440 MHz transceiver, for example, could be used since it uses its own lithium ion battery for power, thereby simpli-fying and reducing the weight of the structure. The transceiver would transmit the data in the cansat to a terminal node controller (TNC) that would transform the data from the sensors aboard the cansat into pack-ets that can be sent over the radio. The packets would then be received by the ground station, where they could be decoded back into readable data of the mea-surements taken.
COLLECTING THE DATA
The command and data handling subsystem is equally as important as the communication subsystem. If it fails, the communication system would have nothing to send to the ground station. Also, the cansat could be lost due to lack of positional data.
We want a command and data handling subsystem that is compact, effective, and as light as possible while fulfilling the other criteria. An established proto-col that has been used for many years for transmitting telemetry and position data for cansats is the amateur packet reporting system (APRS). The module for APRS is called a Micro Interface Module (MIM) and is an integrated module that can take digital and analog telemetry data from separate sources and send them to a radio for transmission. The MIM transmits data in the ARPS format, which can display all the telemetry data and also modify raw data values.
www.curj.caltech.edu 9 S U M M E R 2 0 0 5

���
���
�����
������������������
�������
KEEPING TRACK OF THE CANSAT
The GPS is a very important subsystem of the cansat. Without the GPS system, the position of the cansat could not be determined if the line of sight was lost. The GPS outputs its data in a National Marine Electronics Association (NMEA) standard format which outputs position, velocity, and time to the MIM once every second. The MIM then sends this data out to the radio for transmission.
One GPS sensor board that is available is the GPS 15L. It can track up to 12 satellites at once with one-second updates and fast time to first fix. Its low power consumption also makes it a good contender for use in a cansat; however, it re-quires the use of a good antenna, such as the Hercules antenna. It is compact and could be mounted on the top of the cansat, where it would be unobstructed. Using the GPS sensor and the antenna, one can have a fairly accurate idea about where the cansat is.
OH THE PRESSURE!
Although the GPS system measures altitude as well as horizontal position, GPS altitude measurements can be off by 30 meters or more. A pressure transducer would provide a much more accurate measure of cansat altitude. While not an absolutely critical component for the cansat, a pressure sensor is quite useful nonetheless.
Pressure sensors should be accurate and small, and they should also have the capacity to operate in a wide range of temperatures. The Motorola MPX4115A, for instance, is an analog pressure sensor that is capable of measuring pressure in the range of 15 to 115 kPa. It can also operate in the temperature range of -40 to 125 degrees Celsius. The accuracy of this device, as well as its large range of outputs and capacity to withstand extreme temperatures, make it a good pressure sensor candidate for a cansat.
FIGURE 1 Parts fit model
10

Jesse Parker is a first-year graduate student in the masters program at the University of Connecticut, studying Mechanical Engineering. He received his Bachelors in Mechanical Engineering at the University of Montana. He would like to thank Montana Space Grant Consortium, Dave Klumpar, Brian Larsen, and Joel Rademacher.
FURTHER READING
1 N. Sako, et al. “CanSat suborbital launch experiment — University educational space program using can sized pico-satellite.” ACTA Astronautica 767-776 (2001).
2 S. Matunaga, et al. “Lessons learned from small space systems development using magnesium alloys.” Magnesium Alloys 219-224 (2003).
IT’S GETTING HOT IN HERE
The temperature measurement subsystem is not criti-cal for the mission in any sense; it is only present for scientific observations. Since it is not essential for the mission, it would be best if the temperature sensor were compact and accurate and also were to require little power. A good example of a temperature sensor well suited for a cansat is the LM335Z. It has an error of less than one degree Celsius over a range of one hundred degrees Celsius. It is also very compact and has a very low current draw, which makes it ideal for this application.
POWER UP
Despite having gone through many of the important components of a cansat, everything discussed pre-viously would be useless if it were not for one very important subsystem: the power supply. Without power, the other systems would all fail and the cansat mission would have been for naught. Power supplies should be as lightweight as possible and provide a steady flow of power — spikes in the voltage decrease the accuracy of the collected data.
An example of a good power system employs the use of a LM7805 power regulator, which can take the input of a 9V battery and convert it into 5V for use by the systems. Bypass capacitors in the system “short out” power spikes thereby reducing noise in the out-put of the results. It would also be a good idea to use two different power supplies: one for the GPS and the MIM and another for the temperature and pressure sensors. This is because small fluctuations in the volt-age would have greater effects in the temperature and pressure sensors. So it is better to just use a sepa-rate power supply for them.
PUTTING IT ALL TOGETHER
The structure of the satellite is also very important. If all the other subsystems fail except the structural parachute mount, then the cansat could lose contact with the ground station which might result in the loss of the cansat. If the structural parachute mount failed, the cansat wouldn’t just be lost; it would be destroyed when it hits the ground. The internal structure could also fail and damage the electronics, which would re-sult in loss of contact with the satellite.
If the components suggested in this article were used to build a cansat, the cansat would be very lightweight. A simple structure consisting of a round machined fiberglass disc on one end and simple fiber-glass “backbone” that goes through the can could be used. [FIGURE 1]
Once the structural design is completed, the initial phase of the design of a cansat is completed. Despite having done all that work, this is just a small part of what it actually takes to build a working cansat. After parts selection, there is a lot of testing that needs to be done to ensure that the parts can work together and that the system will function. Once this is com-pleted, the cansat can be launched and students can see all of their work come to fruition. C
www.curj.caltech.edu 11 S U M M E R 2 0 0 5

�������� ����������������������
12

�������� ����������������������
2
Ee
BY ISSAC GARCIA-MUNOZ
IT SEEMS THAT ALTHOUGH MOST PEOPLE KNOW ABOUT TRADITIONAL electronic circuits, which use electrons to transmit signals, only a few are acquainted with the ground-breaking technology that utilizes light for the same purpose: optoelectronics. This technology can utilize many different wavelengths of light, including ultraviolet and infrared, and promises to be faster than its elec-tronic counterpart. As an added benefit of optoelectronics, several optical func-tions such as optical amplifiers and switches can be combined on a single chip.
IT’S SO EXCITING!
When electrons are excited with enough energy, either by applying a voltage or by using light from a laser, valence electrons can be released, leaving a hole of opposite charge. An electron can then be attracted to a hole, forming an electron- hole pair called an exciton. When the exciton recombines, energy may be released in the form of photons.
In materials with a direct band gap, the electron-hole pair only has to absorb energy to form. Silicon, however, has not traditionally been used in creating opti-cal devices because it has an indirect band gap. In indirect band gap materials, there need to be changes in both momentum and energy. Consequently, for sili-con, the rate of photoluminescence (photon emission from light excitation) is too slow for use in optoelectronics.
Julie Biteen, from the Atwater group at Caltech, has focused her research on attempting to make it possible to use silicon in these circuits instead of more expensive materials. The primary problem with silicon is that its radiative rate, the rate at which nanocrystals emit light, is too slow. One method for increasing the radiative rate has been to create silicon nanocrystals, which are a few nano-meters in diameter and are commonly embedded in SiO2. The nanocrystals do not change the band gap into a completely direct one, but rather take advantage of quantum confinement to increase the rate of indirect excitonic recombination. The radiative rate of silicon nanocrystals is on the order of tens of microseconds.
ENHANCED SILICON NANOCRYSTAL PHOTOLUMINESCENCEVIA GOLD-SILICON COUPLING
www.curj.caltech.edu 1 3 S U M M E R 2 0 0 5

MAKING SILICON NANOCRYSTALS
The formation of silicon nanocrystals begins with ion implantation, during which silicon ions are implanted in quartz. To prevent the crystals from becoming oxidized by water, the sample is placed in a furnace filled with argon (Ar) gas. Then, for silicon nanocrys-tal nucleation and growth, the sample is placed in the furnace in Ar at 1000ºC. Dangling bonds occur at the perimeter of the nanocrystal when a silicon atom has electrons that are neither shared by other silicon atoms nor bonded to the quartz lattice. In order to passivate these dangling bonds with hydrogen, the sample was placed in the furnace with forming gas (10% H2 in N2) instead of Ar.
In order to further increase the radiating rate, one could couple gold to the nanocrystals for energy transfer from the silicon nanocrystal exciton to a surface plasmon at the gold/SiO2 interface. Surface plasmons are localized transverse electromagnetic fields, or charge-density oscillations, which propagate between the two media. Luke Sweatlock and Jennifer Dionne, other members of the Atwater group, are currently investigating the phenomenon of surface plasmons by running computer simulations to visualize the fields and charge densities. The energy transfer between silicon nanocrystals and a nearby gold layer is believed to occur via a Förster dipole-dipole inter-action that takes place in picoseconds. The gold film
needs to have a roughness with nanometer-sized features in order to scatter the light after the energy transfer. Nanoporous gold can be used for this pur-pose. Making a nanoporous gold (npg) film is surpris-ingly simple. The starting material is a 1:1 gold/silver alloy which is dipped in nitric acid to dissolve the silver. The result is a thin gold film that we scanned with a scanning electron microscope (SEM). [FIGURE 1]
The layer of npg can be applied to the samples of silicon nanocrystals embedded in SiO2 to increase photoluminescence and, in this manner, increase ra-diative rate. In experiments, we used an argon laser to excite the nanocrystals. As shown in FIGURE 2, there are three events that occur. First, the nanocrystal is excited by the incident light and emits red radiation when the exciton recombines. Second, the excited nanocrystal transmits its energy (by a Förster trans-fer) to the npg where the energy travels as a surface plasmon and is then scattered. Third, the npg absorbs the incident light and transmits it to the nanocrystals where light is emitted.
FIGURE 1 Scanning Electron Microscope image of nanoporous gold at 300K
14

��������������������
������
����������������������������
�����������������������������������������������������������������
�������
���������������
�������������������������������������������������������������������������������������������
���������������������������������������������������������������������������������������������������
FIGURE 2 Excitation of nanocrystalsby an argon laser
1 5

FIGURE 3 PL intensity vs. emitted light (in eV)
�����������
�������������������
�����
�����
�����
�����
�
��� ��� ��� ��� ��� ��� ��� ��� ��� ��� ���
����������������������
����������������
“Biteen found a fourfold increase in photoluminescence between the reference sample and the npg sample.”
16

LET’S SEE WHAT YOU’VE GOT
A charge-coupled device (CCD) was used to measure photoluminescence. CCDs, like those used in digital cameras, store data for an image such that each pixel converts light energy into an electrical charge. One can obtain a spectrum by sending the light through a monochromator, which separates the light by wave-length, and by calibrating the CCD with a known source. Biteen found a fourfold increase in photolumi-nescence between the reference sample and the npg sample. [FIGURE 3] She used an acousto-optic modulator (AOM) to split the beam of incident light at frequen-cies that would allow the decay rate to be measured with the photomultiplier. As soon as the excitation is turned off, the luminescence energy starts drop-ping off exponentially, and the time of the drop-off gives the lifetime (or its inverse, the radiative rate). [FIGURE 4] To help measure the radiative rate we used a photomultiplier tube (PMT), which is an extremely
FIGURE 5 Experimental setup (excluding some optics and fibers)
�����������������
�������������������
���
���
���
���
���
���
� � � � �
������
��������
FIGURE 4 PL intensity vs. time
sensitive detector of light. Photomultiplier tubes consist of vacuum tubes in which photons excite electrons, amplifying their signal by as much as eight orders of magnitude so that pulses may be measured even from single photons.
In our experiment, the emitted light traveled through a monochromator and then to the CCD to pro-duce spectra from which the intensity and peak wave-length were determined. [FIGURE 5] The emitted light could also be directed to the PMT and, with the use of the AOM, we achieved a graph of the photolumi-nescence with respect to time from which the lifetime could be calculated. Using a formula first published by Guillos et al. in 1995, we could then find the average decay rates.
���
�������������
���������������������
������
www.curj.caltech.edu 17 S U M M E R 2 0 0 5

Another objective of the experiment was to find the absorption cross section of the nanocrystal-npg system. We were able to achieve this by varying the photon flux and then measuring the decay rate. The photon flux is varied by increasing the power of the Ar laser. [FIGURE 6] There is a twofold increase in absorp-tion cross section between the reference sample and the npg-enhanced sample. The increase is attributed to the the absorption by the gold of some incident light from the laser that is missed by the nanocrys-tals and then the transfer of this energy back to the nanocrystals. It appears that the fourfold increase in photoluminescence can be explained by the twofold increase in radiative rate and the twofold increase in absorption cross section.
MAKING UNIFORM LAYERS
After working with Biteen for some time, I thought of ways to improve the nanocrystal-gold coupling system. Nanoporous gold is simple to produce, but is difficult to characterize because the roughness cannot be controlled, and the pores are irregular. It is known that evaporating a thin film of gold onto quartz creates metal islands instead of a continuous
layer because the gold atoms clump together due to surface tension effects. This enables the control of the roughness and feature size. I used an evaporator to evaporate gold onto quartz to produce layers of vary-ing heights. The quartz was cleaned, and then the samples were imaged. [FIGURE 7] The imaging revealed that after evaporation, the gold layer became a solid film instead of metal islands. I confirmed the AFM re-sults of the height of the samples by examining them with a profilometer. The profilometer scanned from the quartz to the edge of the gold layer, whereas the AFM was scanned in the center of the layer.
In addition to single island layers, T. Ferrel, et al. had earlier demonstrated that it is possible to create multilayer metal island films. Using methods similar to those he outlined, I made three samples with single evaporated gold layers of varying thickness. One of the samples had two layers of evaporated gold and another sample had three layers. When spectrum im-ages were taken with the CCD, none of the samples exhibited signs of photoluminescence. The furnace may have been contaminated with different gases that may have quenched the nanocrystals.
FIGURE 6 Graph of the absorption cross section
���������������������
�����������
����
��������� ��������� ��������� ��������� ���������
����
����
����
����
����
����
��������
����������
18

Issac Garcia-Munoz is a second year student at the California Institute of Technology. He would like to thank Professor Harry Atwater, Julie Biteen, other members of the Atwater group, and the SURF program for this research opportunity.
FURTHER READING
1 Guillois et al., JAP 95, 3677 (2004).
2 T. Ferrel, F. Meriaudeau, A. Wig, J. P. Lauret, Optical Engineering 40(5) 658 – 660 (may 2001).
3 Y. Ding, Y. J. Kim, J. Erlebacher, “Nanoporous Gold Leaf: “Ancient Technology”/Advanced Material,” accepted to Advanced Material (2004).
FIGURE 7 Two layer gold evaporation and anneal
SILICON NANOCRYSTALS WILL RULE THE WORLD!
A future application of silicon nanocrystals is the use of optical amplifiers in fiber optics systems. Cur-rently there are erbium-doped fiber amplifiers. The amplification results from the erbium ions being in an excited state and then retransmitting the signal with greater amplitude. This method is inefficient because the erbium ions require a high-power pump laser for excitation. A solution to this problem is to include sili-con nanocrystals. If the erbium ions are close enough (within nanometers) to the nanocrystals, the energy of the excited nanocrystal is easily transferred to the erbium ion. This method tremendously improves the optical amplifier because the silicon nanocrystals absorb light 10,000 times more efficiently than the erbium ions, allowing less expensive pump sources to be used. Increasing the radiative rate of silicon nanocrystals to reach optical frequencies is critical for improving optical amplifiers. C
���
���
���
�
����
� ��� �����
www.curj.caltech.edu 1 9 S U M M E R 2 0 0 5

�������������

�������������
3
Ce
CELLS ARE EXTREMELY SENSITIVE TO THE concentration levels of proteins and other chemicals. This is seen especially in chemotaxis, the response of bacterial cells to varying amounts of nutrients or toxic chemicals. If researchers could immobilize a chemical in a concentration gradient pattern along a surface, they could place bacteria cells on the surface and watch whether the cell moved in the direction of increasing or decreasing chemical concentration. The direction and speed of the cell’s motion would give researchers insight into how much the cells “liked” or “disliked” the chemical. Such a patterned surface could also be used to grow cells and tissue in specific shapes and directions. When neurons are exposed to a gradient of growth factors, axons form toward higher concentrations of growth factor. By designing a surface that directs neurons to grow in specific ways, bioengineers may one day be able to develop replace-ment nerves.
Several laboratories have studied how cells re-spond to gradients produced by the injection of a chemical into a solution. However, these gradients are time-dependent and tend to dissipate. Substrate-bound concentration gradients produce more reliable results. The Tirrell group at the California Institute of
Technology is developing thin films patterned with chemical gradients to help biologists study and direct the behavior of cells exposed to chemicals in varying concentrations. Working with fellow undergraduate Sunny Wicks, I fabricated a device that produces these gradient-patterned films, modeled the output using current theory, and produced a gradient- patterned film that resembled our expected model.
BUILDING GRADIENTS FROM SCRATCH
Our goal was to engineer a protein-based film and have control over the spatial distribution of target proteins immobilized on the film’s surface. We used a microfluidic device to form a gradient using one of two target proteins: GST-ZR or Kinesin-ZE. We first evenly distributed one of two elastin-based matrix proteins, ZE-ELF or ZR-ELF, on the surface of the slide. This formed a scaffold to which the target protein could attach. This technique provides researchers with an extra dimension in which to study cell behavior — using a method called photopatterning, the matrix protein scaffold can be prepared as a concentration gradient of anchoring motifs. The resulting surface bears a two-dimensional chemical gradient, enabling researchers to pinpoint the best growth conditions for cells.
www.curj.caltech.edu 21 S U M M E R 2 0 0 5

Our project was comprised of design and prepara-tion phases as well as a phase to integrate our two designed components to create the final product. Initially, the two types of protein — the matrix protein and the target protein — were designed to possess specific properties, detailed below. We then synthe-sized these proteins in vivo and prepared a thin film of the matrix protein on a glass surface. Concurrently, we designed our microfluidic device based on a de-sign by the Whitesides group of Harvard University. Finally, we bound the device to the matrix protein film surface, creating the structure that would pattern the matrix film with a gradient of the target protein. [FIGURE 1]
ZIPPING TARGET PROTEINS TO A SURFACE The Tirrell group designed the novel artificial proteins used to create the gradient-patterned film. The matrix protein bears three essential features: an elastin-like surface-anchoring domain (ELF), a protein-capture domain (ZE or ZR), and a flexible peptide sequence serving as a linkage between the two. The ELF se-quence [FIGURE 2], contains the unnatural amino acid p-azidophenylalanine, which provides an effective crosslinking mechanism for preparing the scaffold us-ing ultraviolet light. ZE and ZR are complementary protein structures that bind together with strong elec-trostatic forces to form the leucine zipper. [FIGURE 1] If ZE is attached to one protein and ZR to another, the proteins can be firmly anchored to each other. Of the
two target proteins considered for this experiment, the first was a form of the protein kinesin tagged with the leucine zipper component ZE and was intended to adsorb onto the matrix protein ZR-ELF. Kinesin-ZE was synthesized in vivo but because of difficulties in purification, we were unable to use it in our experi-ment. Instead, we used GST-ZR as our target protein and we paired it with the matrix protein ZE-ELF.
The proteins were synthesized in vivo in Esche-richia coli bacterial cells. The cells were harvested and the proteins extracted, purified, and dried. A portion of the GST-ZR protein was labeled with a fluorescent protein, to enable measurement of the protein gradi-ent with a fluorescence scanner.
FIGURE 1 Experimental process, image by Kechun Zhang
FIGURE 2 Three-dimensional conformation of a matrix protein and the amino acid sequences for each domain, image by Kechun Zhang
�������� ������ ���
������������������������������������������������������
������������������������������������������������������
���������������� �������������
�������������
�������
�����������
��������������
��������������
�����������������������������������������
��������������
�
���
������
��
�
���
������
��
�
�
���
������
��
�
�����
��
��
���������������� �������������������������������������
�������������������
22

PLUMBING ON THE MICROSCALE
We now had the materials needed for creating the gradient-patterned film. It was important that the generated gradient be fine enough for a cell with a diameter of one micron to respond to the variations in concentration, so we decided to use a microfluidic device to fabricate our films. A microfluidic device is essentially a plumbing system composed of pipes about the width of a human hair. The entire system is built on a chip about a square inch in size. The Whitesides group has designed a microfluidic device that accepts two or more streams of fluid and pro-duces a stream consisting of a gradient of the input streams. The gradient stream deposits chemicals on a surface to create a gradient-patterned film of very small size. The Whitesides group has used this device to study the response of neurons to a gradient of the protein laminin.
We fabricated the components needed to make the experimental device and formed thin films of the matrix protein ZE-ELF on hydrophobic glass surfaces. The slides were exposed to ultraviolet radiation and the matrix protein was pho-tocrosslinked via the p-azidophenylalanine. Meanwhile, the microfluidic device we used was designed by SURF student Sunny Wicks, who modified the gradi-ent generator designed by the Whitesides group, mentioned above. The device [FIGURE 3] is composed of three distinct portions — inlet streams, a mixing tree consisting of four levels with increasing numbers of vertical serpentine channels, and a deposition chamber that ends in an outlet stream. If the fluids entering the inlet streams are of differing concentrations, they split and recombine through the tree, forming a concentration gradient across the deposition chamber. To fab-ricate the actual device, a mask based on the design was generated with CAD software. Photolithography was used to prepare a mold, and a silicone rubber called polydimethylsiloxane (PDMS) was molded into the required device.
FIGURE 3 Modified gradient-generating microfluidic deviceA branching point occurs when a vertical channel meets a horizontal level. Fluids entering the inlet streams divide at the branching points, combine with fluid from other inlet streams and flow down vertical channels. The fluid in each channel splits at the next branching point, and so on. The outlet streams from the last row combine and form the deposition chamber, and the waste outlet stream removes the fluid from the chamber.
�������������
����������������
����������������
��������������
������������������
������������
S U M M E R 2 0 0 5 www.curj.caltech.edu 2 3

MICROFLUIDICS AND GRADIENT INTEGRATION
We tried to bind the PDMS device to the spin-coated slide by thermally crosslink-ing the device to the slide, but the protein film prevented the device from adher-ing. When we tried to flow liquid through the chip, the liquid leaked at the joint between the device and the glass slide. We also tried to press the device to the slide with a clamp, but had leaks again. Despite a number of attempts to form a watertight bond between the device and slide, we did not succeed and deferred this part of the project. In the meantime, we bound the device to a clean un-coated glass slide. This enabled us to form a target protein gradient on the slide, although the target protein bonded non-specifically to plain glass, and did not uti-lize the leucine zipper to adhere to a ELF-based protein scaffold.
An off-chip infrastructure was built to pump protein solution through the mi-crofluidic chip and produce a protein gradient. Three tanks contained solutions of the target protein in the same concentration, but with different ratios of labeled to unlabeled protein. The solutions entered the microfluidic chip, then split and recombined down the mixing tree and finally formed seven outlet streams that joined and formed a gradient in the deposition chamber. As the solution flowed through the deposition chamber, the target protein was deposited on the surface of the slide.
Now that we had built our experimental device, we needed to verify math-ematically that it could produce a gradient. We were concerned that as protein solutions of varying concentrations flowed through the deposition chamber, lat-eral diffusion could cause the gradient to dissipate. This could happen if the rate of lateral diffusion was fast in comparison to the rate of flow through the cham-ber. We applied the “semi-infinite” model of fluid flow and diffusion to describe two adjacent streams of protein solution flowing in the same direction. (The two streams were assumed to share a vertical boundary and extended to infinity at the other vertical boundaries.) The distance of lateral diffusion was three orders of magnitude smaller than the flow length through the chamber in the same time interval, confirming that our system could be used to produce a gradient.
24

TESTING THE WATERS
After we confirmed the viability of our system, we successfully tested the gradient-forming chip with colored water [FIGURE 4]; however, we had problems controlling the flow rate. When we applied air pres-sure at 3 psi to the setup, the tanks of fluid emptied in 2 minutes, an insufficient length of time to obtain satisfactory results in the final experiments. When we lowered the air pressure to around 1 psi, the flow rate was much more manageable, but sensitive to external factors such as irregularities in tubing joints. We tried to maintain a constant flow rate as well as possible and planned to correct the irregularity in later designs of the microfluidic device.
Knowing that the device could produce a fluid gradient, we proceeded to make a protein solution gradient. We intended for the gradient to vary in protein concentration in a direction perpendicular to protein flow. The gradient on the film would have a high concentration of labeled protein on one boundary and a high concentration of unlabeled protein on the
FIGURE 4 Gradient generated with colored water
other boundary. The protein concentrations needed to be chosen so that a measurement device could distinguish the gradations in the film. To determine optimum input concentrations, we prepared several solutions of the target protein, each with a differ-ent proportion of labeled and unlabeled protein, and spotted them on glass slides coated with the matrix protein. After examining several arrays of protein so-lutions using a fluorescence scanner, we determined that the optimum target protein concentration would be 0.6 mg/mL with different ratios of labeled to unla-beled protein. [FIGURE 5] Ratios of labeled to unlabeled protein higher than 1:1 were unsuitable for generat-ing a measurable gradient as the high fluorescence saturated the scanner. We tentatively concluded that the protein solutions in the appropriate inlet streams would contain 0.3 mg/mL, 0.15 mg/mL, and 0 mg/mL of fluorescent protein.
�������������
���������������������������������������������������
� �� � �� ����� ��� ����� ��� ����� � �� � ��
FIGURE 5 Fluorescence scanner images of varying protein ratios. Ratios higher than 1:1 were too fluorescent and saturated the detectable intensity levels of the scanner.
S U M M E R 2 0 0 5 www.curj.caltech.edu 2 5

FIGURE 6 Splitting ratios in mixing treeReprinted in part with permission from Analytical Chemistry, 2001, 73, 1240-1246, Copyright 2001 American Chemical Society
After obtaining a range of useful fluorescence ratios for the gradient, we attempted to verify math-ematically that our chosen inlet concentrations would produce a measurable gradient. The Whitesides paper details a series of formulae, that calculate the ratios in which fluid from each vertical channel splits and re-combines in another vertical channel. [FIGURE 6] These formulae helped us predict the ratios of labeled to un-labeled proteins in the outlet streams. FIGURE 7 shows labeled concentration plotted against distance across the gradient. By comparing the calculated output concentrations with the results of the spotting experi-ments, we were able to verify that a protein gradient generated using the inlet streams mentioned above would be measurable.
We introduced the chosen protein solutions into the channels of the PDMS device bound to a clean glass slide and deposited the target protein in a gra-dient pattern. [FIGURE 8] As mentioned earlier, we couldn’t bind the PDMS device to the ELF coated slides. The protein adhesion to clean glass was non-specific so we weren’t able to test the efficacy of the anchoring motif; however, we were able to test the ability of the device to deposit a gradient of the target protein. We found that a microfluidic device, specifi-cally our modification of the Whitesides design, can be used to successfully deposit proteins in a gradient pattern on a surface.
�� �� ��
�
������
�
�� ����
�
������
�
�� ����
���
������
�
�� ����� �� ��
�
������
�
�� ������� � �� �
26
Maryam Ali is a fourth-year undergraduate in Chemical Engineering at the California Institute of Technology. She would like to thank Sunny Wicks for her joint work on the project. She would also like to thank her mentors, Michael Diehl, Kechun Zhang, and Principal Investigator David A. Tirrell, Chair, Division of Chemistry and Chemical Engineering at Caltech. Also, she would like to thank Mr. and Mrs. Warren G. Schlinger who sponsored this work through the Warren and Katharine Schlinger SURF Fellowship and the 2004 Caltech Summer Undergraduate Research Fellowship.
FURTHER READING
1 H. C. Berg. Chemotaxis in Bacteria. Annual Review of Biophysics and Bioengineering. 4, 119 – 136 (1975).
2 S. K. W. Dertinger, et al. Gradients of Substrate-Bound Laminin Orient Axonal Specifications of Neurons Proceedings of the National Academy of Sciences. 99, 12542 – 12547 (2002).
3 K. Zhang, M. R. Diehl, D. A. Tirrell, Artificial Peptide Scaffold for Protein Immobilization, manuscript in preparation.
4 L. J. Jeon, et al. Generation of Solution and Surface Gradients Using Microfluidic Systems. Langmuir. 16, 8311 – 8316 (2000).
5 S. K. W. Dertinger, et al. Generation of Gradients Having Complex Shapes Using Microfluidic Networks. Analytical Chemistry. 73, 1240 – 1246 (2001).
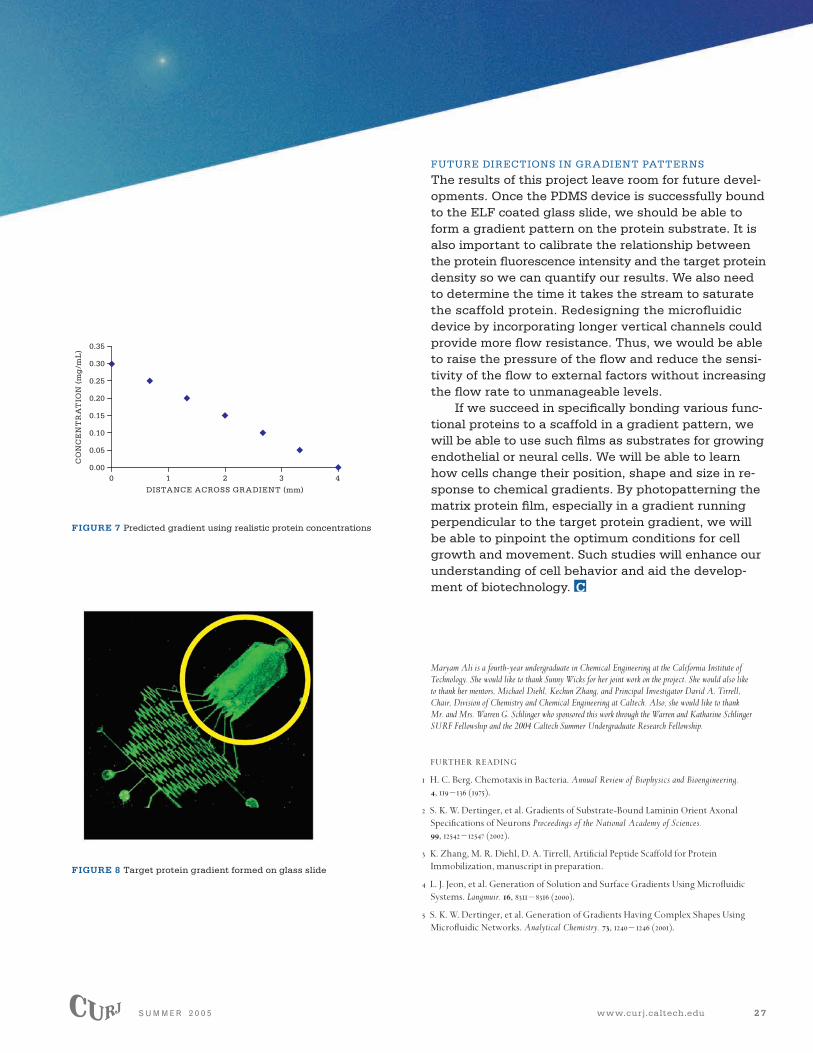
FIGURE 7 Predicted gradient using realistic protein concentrations
FIGURE 8 Target protein gradient formed on glass slide
FUTURE DIRECTIONS IN GRADIENT PATTERNS
The results of this project leave room for future devel-opments. Once the PDMS device is successfully bound to the ELF coated glass slide, we should be able to form a gradient pattern on the protein substrate. It is also important to calibrate the relationship between the protein fluorescence intensity and the target protein density so we can quantify our results. We also need to determine the time it takes the stream to saturate the scaffold protein. Redesigning the microfluidic device by incorporating longer vertical channels could provide more flow resistance. Thus, we would be able to raise the pressure of the flow and reduce the sensi-tivity of the flow to external factors without increasing the flow rate to unmanageable levels.
If we succeed in specifically bonding various func-tional proteins to a scaffold in a gradient pattern, we will be able to use such films as substrates for growing endothelial or neural cells. We will be able to learn how cells change their position, shape and size in re-sponse to chemical gradients. By photopatterning the matrix protein film, especially in a gradient running perpendicular to the target protein gradient, we will be able to pinpoint the optimum conditions for cell growth and movement. Such studies will enhance our understanding of cell behavior and aid the develop-ment of biotechnology. C
����
���������������������
�����������������������������
����
����
����
����
����
����
����� � � � �
www.curj.caltech.edu 2 7 S U M M E R 2 0 0 5

INTEGRATING LOCOMOTION AND VISION CAPABILITIES INTO THE HOAP-2 HUMANOID ROBOT
IT’SALIVE!
28

Cs4
BY JAMES JEANNE AND JIAJING XU
ALTHOUGH WE HAVE ROBOTS TODAY THAT WELD PARTS ON ASSEMBLY lines, inspect nuclear plants, and explore other planets, we are still a long way away from the humanoid androids ubiquitous throughout science fiction. The pri-mary reason is that industrial robots operate in a fixed environment and deal with a small range of stimuli, while humanoid robots must operate flexibly under a wide range of environmental conditions and tasks. In particular, two obstacles that must be overcome are vision and locomotion, the two areas which we investigated.
HOAP–2
The system with which we worked was the second generation of Fujitsu’s Humanoid for Open Architecture Platform (HOAP-2). The robot is equipped with 25 servo actuators—six for each leg, four for each arm, one for each hand, two for the head, and one for its waist. Each actuator gives the robot a degree of freedom. If we look at the leg [FIGURE 1], we can see how the knee joint has only one degree of freedom (bending back and forth) while the hip joint has three degrees of freedom.
������������
����������
�������������
������������
������������
������������
����������
������������
FIGURE 1 Schematic diagram of the HOAP–2 robot. Each degree of freedom is shown as a black line through a sphere.
S U M M E R 2 0 0 5 www.curj.caltech.edu 2 9

Additionally, there are four pressure sensors on the bottom of each foot and both an accelerometer and gyroscope inside the torso. The vision system consists of two charge-coupled-device (CCD) cameras capable of capturing frames of 640 by 480 pixels at fairly low speed. The images are sent to the command PC, an Intel Pentium 4, 2.4 GHz computer, via USB communication. Following image processing, the main program generates a series of motion sequences, which are sent back in real-time to the HOAP-2 robot. This presents a challenge in programming the robot: we have to send commands at specific times in order to maintain stability.
LOCOMOTION
Before humanoid robots can perform human tasks, they must have a robust means of locomotion. First, we should deal with walking. There have been several walking-pattern generation methods developed thus far: Zero Moment Point (ZMP) walking, in which the center of gravity is constantly maintained over the ro-bot’s support structure; rhythmic walking, where the walking frequency is continuously adjusted to main-tain the robot’s balance; and ballistic walking, where the motors do not power the legs when they swing forward. These methods are all determined by equa-tions that depend on specific parameters. To improve the robustness of walking patterns, we can adjust these parameters in several different ways, including
unsupervised learning, where a careful search of pa-rameter values is performed to find the best value for current conditions, and reinforcement learning, where parameter values are determined through feedback from a human trainer or a predefined learning function.
We chose to use the ZMP walking method for the HOAP-2 humanoid robot. To do this, we first devel-oped a mathematical model of the robot’s kinemat-ics. We mapped the six degrees of freedom found in the leg to the position and orientation of the boot. [FIGURE 2A] This model was extremely useful for early experimentation with motion, but we actually found that the inverse-kinematics model, in which the posi-tion and orientation of the feet are mapped to each degree of freedom of the leg, was more useful. This, however, was much more difficult to calculate — each calculation took the computer roughly 18 millisec-onds (ms) to solve. We wanted the sampling time to be 1 ms. Therefore, we simplified the inverse-kinemat-ics model by requiring the foot to maintain a constant
30

orientation. [FIGURE 2B] Since the simplified model in-volved solving for fewer parameters, each calculation could easily be computed in much less than 1 ms and was thus suitable for implementation on the real- time platform.
Now that we had a model, it was time to develop a walking pattern. We wanted the robot to move smoothly, since sudden jerking motions decreased the stability of the robot. To implement the ZMP walking method, we separated the walking pattern into two stages. In the first stage, the robot’s center of gravity
shifts over the support leg, and in the second stage the robot’s other leg shifts forward. [FIGURE 3] We defined the motion of shifting the other leg forward by defining critical points for the feet. To swing the right leg, for example, we had three points: the first was the right foot behind the left foot, the second was the right foot side-by-side with the left foot but raised into the air, and the third was the right foot ahead of the left foot. This method let us modify the walking characteristics by adjusting the stride length and step clearance. With the critical points established, we de-fined a smooth motion between them by using a cubic spline interpolation algorithm (that fit a cubic curve onto the critical points) for each degree of freedom involved in the walking motion.
We also applied this method to the arms and were able to develop motions for grasping an object, lifting the object, lowering the object, and releasing the object.
��
��
��
��
FIGURE 3 The coordinate system used to define foot positions. The origin is exactly halfway between the two hips. The positive x-direction points in the direction of walking, the positive y-direction points to the robot’s left, and the positive z-direction points up.
FIGURE 2 Relationship of angle definitions in the kinematics model to the actual joints of the HOAP–2. The left diagram represents the angles that produce motion in the sagittal plane (front – back) and the right diagram represents the angles that produce motion in the lateral plane (left – right). θHIP,z, the rotational motion of the hip, is not shown.
��������������
��������� ���������
��������
A B
www.curj.caltech.edu 3 1 S U M M E R 2 0 0 5

James Jeanne is a fourth-year undergraduate at Princeton University and Jiajing Xu is a third-year undergraduate at the California Institute of Technology. They would like to thank their mentor Dr. Adrian Stoica, their co-mentor Dr. Didier Keymeulen, and their teammate Tim Hidalgo for their contributions to this project.
FURTHER READING
1 R.A. Brooks et al., Alternative Essences of Intelligence, Proc. 15th Natl Conf. Artificial Intelligence (AAAI 98) and 10th Conf. Innovative Applications of Artificial Intelligence (IAAI 98), AAAI Press, Menlo Park, Calif., 961–968 (1998).
2 A. Stoica, Humanoids for Urban Operations, Jet Propulsion Laboratory White Paper, Pasadena, Calif., (2004).
3 R.A. Brooks et al., Humanoid Robots: A New Kind of Tool, C. Nehaniv, ed., Springer Lecture Notes in Artificial Intelligence, 1562, (Springer-Verlag, Berlin, 1998).
THE FUTURE
Though we have only taken the first few steps toward developing humanoid robots, visual and locomotive capabilities are crucial to the development of more advanced skills. We can build upon what we’ve done so far to develop more complicated algorithms that better reflect the real world, such as walking on inclined surfaces and more accurately analyzing the environment for objects and color. An even more com-plicated experiment would be to have the robot walk toward an object, pick it up, and then walk back to where it started. This is difficult not only because of all the geometry involved, but also because holding an object greatly affects the robot’s center of gravity. Though we are far from humanoid robots that are indistinguishable from actual humans, we will continue to make advances toward realizing that dream. C
SIGHT
While working on locomotion, we also developed the vision system for the HOAP-2 humanoid robot. We chose to have the robot search out red-colored targets. To process the image taken in by the robot’s camera, we applied a color filter then a noise- cancellation filter to the raw image. [FIGURE 4] From this processed data, we obtained the position of the two-dimensional centroid (the point representing the center of mass) of each frame.
Since the two cameras viewed the object from different angles, we were able to develop a trigono-metric model which evaluated the distance from the object to the robot. We could also use this model to determine where the object was relative to the robot, such as in front of, to the right of, or to the left of the robot. It was, however, difficult to calibrate the distance estimation part of our model because the trigonometric formula required two parameters not provided by the camera. We were able to increase the accuracy of the model such that distance estima-tion was precise (within 2% error) when the object was 2 cm to 200 cm away, but beyond that range, the error increased rapidly.
In the end, we were able to combine the locomo-tion and vision systems of the robot and see the two systems work together. We had the robot identify an object and then we used the locomotive capabilities to have the robot walk toward it. This was successful as long as the robot was moving slower than the sample rate of the vision system.
ORIGINALLY CAPTURED APPLY COLOR FILTERS NOISE CANCELLATION
LE
FT
EY
ER
IGH
T E
YE
FIGURE 4 Image processing screenshots
32


��������������������������������������������������������������������������������������
���
���
���
��
��
��
�
HOW HAVE THE STRUCTURES OF LETTERS AND VISUAL SYMBOLS evolved over history? Why are letters and other visual symbols structured the way they are? The motivation for current research is the desire to un-derstand why letters in writing systems have their current shapes. Despite a great deal of variation in character and letter shapes in different writing systems and languages, there may be underlying similarities that have not been previously noticed. How did these languages evolve to look like the way they do now? What kind of selective pressures dominated this evolution? In addition, what kinds of similarities exist between all writing systems? The ecological hypothesis put forth by Dr. Mark Changizi is that letters have been selected to resemble the conglomerations of contours, or outlines of shapes, found in natural scenes — in particular, the intersection of outlines, known as junctions — thereby tapping into the brain’s already-existing object recogni-tion mechanisms. In other words, we believe that contours and junctions in characters of writing systems resemble the kinds of contours and junctions that one sees in a natural environment.
BY GUS ZHANG
34
��������������������������������������������������������������������������������������
���
���
���
��
��
��
�
N5
CREATION OF CONFIGURATION SPECTRA
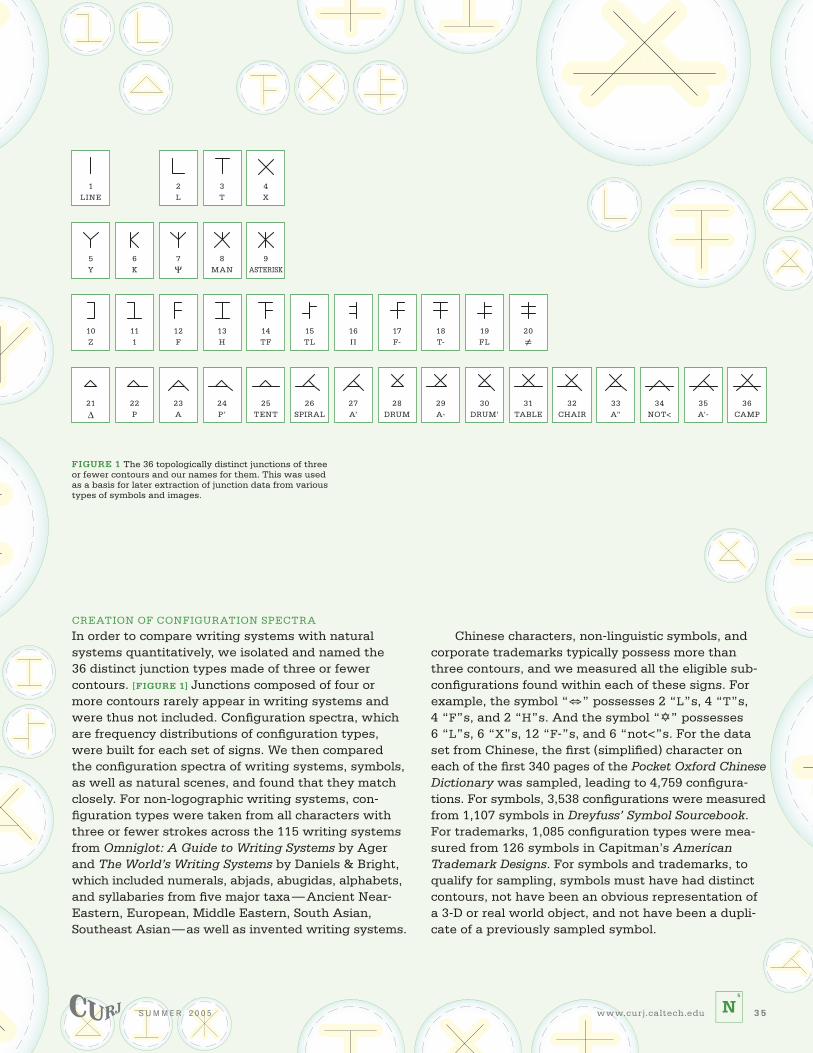
In order to compare writing systems with natural systems quantitatively, we isolated and named the 36 distinct junction types made of three or fewer contours. [FIGURE 1] Junctions composed of four or more contours rarely appear in writing systems and were thus not included. Configuration spectra, which are frequency distributions of configuration types, were built for each set of signs. We then compared the configuration spectra of writing systems, symbols, as well as natural scenes, and found that they match closely. For non-logographic writing systems, con-figuration types were taken from all characters with three or fewer strokes across the 115 writing systems from Omniglot: A Guide to Writing Systems by Ager and The World’s Writing Systems by Daniels & Bright, which included numerals, abjads, abugidas, alphabets, and syllabaries from five major taxa — Ancient Near-Eastern, European, Middle Eastern, South Asian, Southeast Asian — as well as invented writing systems.
Chinese characters, non-linguistic symbols, and corporate trademarks typically possess more than three contours, and we measured all the eligible sub-configurations found within each of these signs. For example, the symbol “⇔” possesses 2 “L”s, 4 “T”s, 4 “F”s, and 2 “H”s. And the symbol “Y” possesses 6 “L”s, 6 “X”s, 12 “F-”s, and 6 “not<”s. For the data set from Chinese, the first (simplified) character on each of the first 340 pages of the Pocket Oxford Chinese Dictionary was sampled, leading to 4,759 configura-tions. For symbols, 3,538 configurations were measured from 1,107 symbols in Dreyfuss’ Symbol Sourcebook. For trademarks, 1,085 configuration types were mea-sured from 126 symbols in Capitman’s American Trademark Designs. For symbols and trademarks, to qualify for sampling, symbols must have had distinct contours, not have been an obvious representation of a 3-D or real world object, and not have been a dupli-cate of a previously sampled symbol.
FIGURE 1 The 36 topologically distinct junctions of three or fewer contours and our names for them. This was used as a basis for later extraction of junction data from various types of symbols and images.
�
�
����
�
�
�
�
�
�
�
�
�
��
���
�
��������
�
���
�
��
�
��
��
��
����
��
������
��
��
��
����
��
��
��
�����
��
�����
��
�����
��
��
��
����
��
���
��
����
��
�
��
�
��
�
��
�
��
��
��
��
��
���
��
��
��
��
��
��
���
www.curj.caltech.edu 3 5 S U M M E R 2 0 0 5

To get configuration data for natural scenes, two sets of natural images were used: urban and rural. The urban set consisted of 40 highly realistic, computer generated images of exterior and interior views of commercial properties. We were able to sample 4,246 configurations. The rural set of images consisted of 40 images taken from the National Geographic website. This set led to 1,345 configurations. A regular grid (10 by 10 for urban, and 5 by 10 for rural) of “sampling-circles” was placed over each image and configurations proximal to the circles were measured. The configura-tion spectrum was determined separately for each set [FIGURE 3C, LEFT] and these two spectra averaged to-gether for the rank-rank correlation between ecology and visual signs. [FIGURE 3C, RIGHT] Children’s scribbles were found in Rhoda Kellogg’s book, Analyzing Chil-dren’s Art. On pages 27 through 30 of the book, she collected 17 examples of scribbles made by children from 26 months to 33 months of age. From these patterns, a total of 161 junction configurations were collected.
Data for shorthand writing systems, handsweeps, and complexity measurements based upon number of angles in a junction were collected by Dr. Changizi and used with his permission.
COMPARING CONFIGURATION SPECTRA
From the collected configuration data, configuration spectra were constructed. The following graphs show the relative frequencies of each junction configuration in non-logographic writing systems, Chinese, and symbols. The striking similarities in the configuration spectra are immediately evident, indicating that de-spite outward differences, these three different types of visual signs share similar underlying junction fre-quencies. [FIGURE 2A]
In order to show that the observed configuration spectrum similarity is indeed unique and not just a property of any random series of connected contours, children’s scribbles were analyzed and the spectrum was found to be unlike that of the visual signs. [FIGURE 2B] It is also trivial to show that regularly oc-curring patterns such as square grids would be com-posed of only “X” and “≠” junctions and would not resemble the spectrum of visual signs.
Before testing the ecological hypothesis, it should be noted that other theories, such as motor complex-ity, also seek to explain the evolution of letters in writing systems. Motor complexity’s explanation for the distinctive configuration spectrum of visual signs is that visual signs are optimized for fastest and easi-est writing. Shorthand and trademarks were analyzed to investigate this possibility. Shorthand represents a system designed specifically for speed and ease of writing, but its configuration spectrum does not re-semble that of visual signs. [FIGURE 2C] Trademarks and corporate logos, on the other hand, represent a set of symbols which are almost never written but are instead mass-produced for viewing. The configuration spectrum of trademarks closely correlates with that of visual signs, further suggesting that this phenomenon is driven by visual considerations. [FIGURE 2C]
36

FIGURE 2
(a) The configuration spectra for non-logographic writing systems, Chinese, and symbols. The average of the three configuration spectra forms the configuration spectrum of visual signs.
(b) The configuration spectrum for children’s scribbles. There is an insignificant correlation between scribbles and visual signs.
(c) The configuration spectra for shorthand and trademarks
���������
����
���
����
����
����
�
���� � � � � �
���
�������� � � � ��
����
������ ��
���� ��
�����
�����
����� ��
���� ���
����� � � � ��
�� � ��
��
�� �
�� � � � � � � � �� �� �� �� �� �� �� �� �� �� �� �� �� �� �� ���� �� �� �� �� �� �� �� �� �� ��
���������
����
���
����
����
����
�
�
�
���������
����
���
����
����
����
���������
������������
�����������������������
�������
�������
����������
���������
������������
www.curj.caltech.edu 3 7 S U M M E R 2 0 0 5

FIGURE 3
(a) The minimum number of hand sweeps (number of pen strokes plus number of pen lifts) required to draw each configuration type. The graph to the right shows the ranks of each configuration type in visual signs against the number of hand sweeps required for the configuration type. The correlation is weak, further suggesting that visual signs are not motor-selected.
(b) The number of angles in each configuration type, a common measure of stimulus complexity. A fairly strong correlation emerges from the plot of the number of angles against ranks of each configuration type in visual signs, which further supports the role that vision plays in the selective pressure for visual signs.
(c) The configuration spectra for both urban and visual images matches very closely with that of visual images. The rank versus rank comparison (average of urban and rural) yields a very strong correlation, suggesting that writing systems, Chinese characters, and symbols are heavily influenced by and selected to match the configuration spectrum of natural environments.
���������
����
���
����
����
����
�
�
����
�
�
�
�
�
�
�
�
�
�
�
���
�
��������
�
�
��
�
��
�
��
��
��
����
��
������
��
��
��
����
��
��
��
�����
��
�����
��
�����
��
��
��
����
��
���
��
����
��
�
��
�
��
�
��
�
��
��
��
��
��
�
��
��
��
��
��
��
��
�
��
��
��
��
�� ��
������������������������������������������������
��
�������
��
������������
������������
������������
����������������
�
�
�
�
��
��
��
��
�� �
����������������
���������������������
�
�������
��
����������������
������������
���������������������
�
�
�
�
�
��
��
��
�� �
���������������������
���������������������
� �
�������
� �
�
�
�
���������������������
������������
38

The number of hand sweeps required to draw each configuration type is another measure of motor complexity. The correlation between hand sweeps and the configuration spectrum for visual signs is weak. [FIGURE 3A] Finally, stimulus complexity of each configuration type was measured. Human judgments of visual stimulus complexity have been found to cor-relate highly with the number of angles in the stimu-lus, and there is significant correlation between the number of angles and the configuration spectrum for visual signs. [FIGURE 3B] Each of these tests show that motor complexity only correlates weakly with the con-figuration spectrum of visual signs, but visually-based symbols and stimulus complexity correlate strongly. This indicates that motor complexity has a weak role at best in the configuration spectrum of visual signs, whereas the selective pressure for vision plays a stronger role.
Finally, to test the ecological hypothesis, which states that the configuration spectrum for visual signs is selected to match the configuration spectrum found in images of natural scenes, the configuration spectra of both urban and rural environments were measured. The spectra are very similar to each other, and there is also a strong correlation between these ecologi-cal spectra and the configuration spectrum of visual signs. [FIGURE 3C] The high degree of correlation here strongly argues in favor of the ecological hypothesis.
FURTHER INVESTIGATION OF THE ECOLOGICAL HYPOTHESIS
The underlying similarities between writing systems, symbols, and object junctions found in natural scenes are a testament to the power of the visual system and its far reaching influence on our development of some-thing as fundamental as a language. Future research would cement the ecological hypothesis through ex-haustive analysis of all known languages, symbols, and a much larger library of natural images. This undertaking is too vast to do manually, but software could be written that can quickly scan images and an-alyze all contours and junctions. This is dependent on the development of reliable image recognition hard-ware and software in the future. Another option is to look for other effects of the power of contour junctions in natural images. For example, certain configurations of contours may be suitable for camouflage or may explain why certain mechanisms of camouflage work. Indeed, the scales of fish, the patterns on shells, and the stripes on animal coats may all have certain simi-larities in underlying contour junction configurations which help them blend in with the natural environ-ment. It is our belief that the ecological hypothesis may apply not only to writing systems, but shed light on other, perhaps unexpected, areas as well. C
Qiong (Gus) Zhang is a second-year undergraduate at the California Institute of Technology. The author would like to thank his mentors Dr. Mark A. Changizi and Professor Shinsuke Shimojo for their support and guidance. He would also like to thank the members of the Shimojo psychophysics laboratory for their support and feedback and the Caltech SURF program for making this research possible.
FURTHER READING
1 A. Fairbank. A Book of Scripts (Penguin, Baltimore, 1968).
2 G. Sampson. Writing Systems (Stanford University Press, Stanford, 1985).
3 F. Coulmas. The Writing Systems of the World (Blackwell, Oxford, 1991).
4 H. Dreyfuss. Symbol Sourcebook (John Wiley, New York, 1972).
5 B.B. Capitman. American Trademark Designs (Dover, New York, 1976).
“Certain configurations of contours may be suitable for camouflage or may explain why certain
mechanisms of camouflage work.”
www.curj.caltech.edu 3 9 S U M M E R 2 0 0 5

MANY PROPOSED EXPERIMENTS IN PHYSICS require a device to detect low-frequency signals. Such detectors are often cooled to cryogenic temperatures to reduce thermal noise, noise induced by the random thermal movements of electrons in a circuit. Also, quantum phenomena that are critical to the detector’s operation only occur at cryogenic temperatures. Un-fortunately, such detectors are very susceptible to high-frequency electromagnetic interference (EMI), the most common form of which is radio waves. To perform experiments successfully with such detectors, scientists need a filter capable of removing high- frequency EMI.
REMOVING UNWANTED SIGNALS
Electrical engineers have long since shown that a simple lowpass filter [FIGURE 1] comprising of one inductor and one capacitor are often capable of elimi-nating virtually all high-frequency EMI. Capacitors are electrical components that store charge; they are char-acterized by a capacitance C measured in farads (F). Inductors are characterized by their electromagnetic inductance, expressed in henries (H) and often
BY NICHOLAS R. HUTZLER
FIGURE 1 A simple lowpass filter
��������
���������
40

Ap6
abbreviated by L. When passing a time-varying cur-rent through an inductor, the inductor’s composition and geometry causes a time-varying magnetic field around the inductor. This magnetic field in turn induces an electric potential, or voltage, across the inductor; we characterize an inductor’s inductance as the ratio of the induced voltage to the rate of change of current. Problems arise in finding an inductor with appropriate characteristics.
Good inductors are made by winding a coil of wire around a central piece of material, called a core, of high magnetic permeability. Magnetic permeability is a measure of how easily a magnetic field can be stored in a material. For example, iron has a permea-bility several thousand times that of air; consequently, it is much easier to store a magnetic field in a piece of iron than in a box full of air. The problem that arises is that most standard core materials suffer a decrease in permeability at low temperatures and high frequen-cies. Therefore, an ideal core material for use in EMI filtration inductors is a material that maintains a high permeability at low temperatures and high frequen-cies. Metglas 2714A, a metallic alloy manufactured by
FIGURE 2 The SQUID measurement circuit������
����������
����������
� �
��
� � �
�
����
�����
�����
����
��������
������
Honeywell, has high permeability at high frequencies at room temperature. Recently, a paper by Quach and Chui reported that the permeability remains higher than 10,000 at frequencies up to 100 kHz at 4.2 K; however, no data exists for higher frequencies. In our research, we measured the relative permeability of Metglas 2714A up to frequencies of 2 MHz at 4.2 K.
SWEEPING ACROSS FREQUENCIES
For measurements at frequencies less than 100 kHz, we used the setup shown in FIGURE 2, based around a Superconducting Quantum Interference Device (SQUID). Two coils of wire are wrapped around a Metglas 2714A core. A sinusoidal current is applied to Coil 1; Coil 2 is connected to the SQUID. The SQUID is a device that helps us to measure the self-inductance of the two coils of wire wrapped around the Metglas 2714A core. By using equations relating the self- inductance of the wire coils, the specifications of the SQUID apparatus, and the voltage of the sinusoidal input, we can solve for the self-inductance of the two coils. This self-inductance is further related through a simple linear equation to the permeability of the Metglas 2714A core.
www.curj.caltech.edu 41 S U M M E R 2 0 0 5

Because of limitations of the SQUID’s internal components, the SQUID ap-paratus does not report accurate results at frequencies higher than 100 kHz. Hence, for measurements above 100 kHz, we used the circuit shown in FIGURE 3. This circuit consists of a Mylar capacitor, C, connected in series with an induc-tor L created by wrapping N turns of wire around a Metglas core. This circuit is placed at 4.2 K and is connected to a voltage-measuring device (a voltmeter) by a long coaxial cable. The additional electrical components seen in the circuit are parasitic capacitances, inductances, and resistances resulting from the co-axial cable; these values are modeled by discrete components, as seen in the circuit diagram.
The series combination of an inductor and a capacitor, called an LC circuit, exhibits a remarkable phenomenon called resonance. For a fixed inductance and capacitance, there exists some frequency at which the energy in an LC circuit sloshes back and forth equally between the inductor and capacitor. Physically speaking, the energy in the circuit is first stored as magnetic energy in the inductor’s magnetic field; after a while, it is transferred to the capacitor, where it is stored as electrical energy in the capacitor’s electric field. Another way of expressing this idea is that the current and voltage of the circuit are exactly 180 degrees out of phase: as the current flowing through the circuit reaches a peak, there exists no voltage across the circuit. Then, as the voltage across the circuit
FIGURE 3 The resonance measurement circuit
����������������
�����
�� ���
��
������
������������������
“There exists some frequency at which the energy
in an LC circuit sloshes back and forth equally
between the inductor and capacitor.”
42

reaches a peak, there is no current flowing through the circuit. In yet other words, at resonance, we can-not detect the presence of the capacitor or the induc-tor — to an observer, a series inductor and capacitor at resonance is no different from a wire.
In using the resonant circuit to measure the permeability of the Metglas 2714A at different fre-quencies, we had to pick values of the inductor and capacitor to resonate at the frequency of interest. There are three degrees of freedom in the circuit: the value of the capacitor, the value of the inductor, and the desired ballpark test frequency. By changing N, the number of turns around the Metglas 2714A toroid, we varied the inductance of the inductor L. By swap-ping different capacitors, we could vary C between 4.7 nF and 4.7 µF. Since the test frequency is related to the inductance and capacitance through a simple equation, picking appropriate values for the number of turns on the inductor as well as for the capacitance at the Mylar capacitor allowed us to obtain a resonant frequency relatively close to the frequency of interest.
Nick Hutzler is a second-year undergraduate in Mathematics at the California Institute of Technology. He would like to acknowledge Talso Chui, Hung Quach, and Konstantin Penaren for their guidance and assistance.
FURTHER READING
1 H. Quach, T. Chui. “Low Temperature Magnetic Properties of Metglas 2714A and its Potential Use as Core Material for EMI Filters.” Cryogenics 44, 445–449 (2004).
2 E. Purcell. Electricity and Magnetism (McGraw-Hill Companies, 197).
After tuning the input frequency to resonate with the components, we were able to use a voltmeter to detect the signal at the end of the coaxial cable away from the test inductor and capacitor. By calculating the ratio of the input voltage to the output voltage, or the loss of the circuit, as well as the resonant frequency of the circuit, we could calculate a value for L, the inductance of the inductor obtained by winding a coil around the Metglas 2714A toroid. Using this induc-tance and the same simple linear equation mentioned in the SQUID scheme we extracted the permeability of the Metglas 2714A toroid. This resonant circuit testing setup allowed us to find the permeability of Metglas 2714A at frequencies up to 2 MHz.
At close to 300 kHz, we found that the relative permeability approached unity, making Metglas 2714A no more useful as a core than a vacuum. Using this data, a circuit for EMI filtration can be designed that incorporates Metglas 2714A as an inductor core. C
www.curj.caltech.edu 4 3 S U M M E R 2 0 0 5

44
�����
ORCHIDBY ANDREA OFFERMANN
It’s amazing to see how the human mind always searches for resemblances to under-stand something. The outline of a hilltop becomes the basis for a letter; the sound a bird makes becomes the basis for its name; the shape of the roots of a flower make you believe it has certain powers.
More than 2000 years ago, the Greeks believed that the roots of a flower looked like testicles and thus would help heal sexual diseases. They called this flower ochrys, the Greek word for testicle, and the basis for the word orchid, which is what we call this flower today.
Andrea OffermannArt Center College of Design
Orchid mixed media, (detail) 62" × 29"Artist’s Private Collection

NEXT ISSUE: WINTER 2 0 0 5
�����

CALTECH UNDERGRADUATE RESEARCH JOURNAL