culture trumps ethnicity! – intra-generational cultural
TRANSCRIPT

Culture trumps ethnicity! – Intra-generational cultural evolution and ethnocentrism in an artificial society
David Hales, University of Szeged, Hungary. ([email protected]) Bruce Edmonds, Manchester Metropolitan University, UK. ([email protected])
September 2015, v1.8 (Draft)
Abstract: Ethnocentrism denotes behaviour and beliefs that are positive towards those who share the same ethnicity and negative towards others. Recent artificial society models have been interpreted as demonstrating how ethnocentrism might evolve under minimal assumptions. In these, evolution is modelled over generations of agents where new agents are born inheriting the ethnicity, behaviours and location of their parents. Behaviour does not change within generations but over many generations and agents only interact with their neighbours. We present a model that considers short-term cultural adaptation, where agents may interact with any in a population and do not die or give birth but imitate and innovate their behaviours. While agents have a fixed ethnicity, they have the ability to form and join cultural groups and to change how they define their in-group based on both ethnic and cultural markers (or tags). We find that over a range of parameters cultural identity, rather than ethnocentrism, becomes the dominant way that agents identify their in-group producing high levels of positive interaction both within and between ethnicities. However, in some circumstances, cultural markers of group preference are supplemented by ethnic markers. In other words, whilst pure ethnocentrism (based on ethnic identity only) is not sustained, groups that discriminate in terms of a combination of cultural and ethnic identities do occur. In these less common cases, high levels of ethnocentric behaviours evolve and persist – even though the ethnic markers are arbitrary and fixed – but they only emerge when combined with culture centric behaviour. Furthermore, cooperative ethnocentric groups do not emerge in the absence of cultural processes. The latter suggests the hypothesis that observed ethnocentrism in observed societies need not be the result of long-term historical processes based upon ethnic markers but could be more dependent upon short run cultural ones. We discuss these results as well as the dangers of over interpretation of models like this.
Keywords: Tag-based cooperation, altruism, cultural evolution, imitation, cultural evolution, cultural group selection, in-group bias, ethnocentrism
1 Introduction Ethnocentrism, and more generally in-group bias, is a widely observed empirical phenomena in human societies having many different aspects and occurring in many different ‘flavours’ (LeVine & Campbell 1972). In many contexts people seem to divide the population into those who are considered as part of their group or their ‘type’ (what we will call the in-group) and the rest who are seen as outsiders (the out-group). Where such distinctions are made there is often a propensity for more positive behaviour towards the in-group than towards the out-group. For example, it has been found that, under experimental conditions, even arbitrary group assignments produce in-group positive and out-group negative behaviour (Tajfel et al 1971, Brewer 1979).
In order to explore possible mechanisms that might produce such phenomena recent artificial society models have been presented in which evolutionary processes lead

to ethnocentrism emerging over time (Axelrod and Hammond 2003; Hammond & Axelrod 2006; Jansson 2013; Roitto 2015)1.
In those models, agents are located on a spatial grid and evolve inter-generationally with new agents being born and old agents dying. Both interaction and reproduction are localised to neighbourhoods on the grid and agents cannot change their behaviour or location during their lifetimes. Results from these models show that eventually agents come to favour their in-group defined by an observable ethnic marker (or tag). The ethnic marker evolves in the same way as behaviours such that it may change over generations. Hence, these models focus on long-rang inter-generation dynamics in which all behaviour is fixed during the lifetime of an agent – no intra-generational learning can occur.
We present a model with a different emphasis by considering short-run intra-generational cultural dynamics related to a fixed ethnic marker and culturally evolving group identities (a cultural ‘tag’). We call this the ethno-cultural tag model (ECT). This model produces results that contrast with the above models, showing how cultural adaptation can dominate the formation of in-groups. It turns out that, in this model, ethnocentrism is only sustainable when supported by culture-based group formation – here ethnocentrism is the result of the formation of a particular subculture that discriminates in terms of ethnicity as well as cultural tags.
This article is structured as follows. We describe an existing artificial society model of ethnocentrism and other relevant work in section 2. Then we present the motivation for our model in section 3. We describe our model in detail in section 4 and present results obtained from a number simulation runs of the model in section 5. We discuss the results, and the purpose and interpretation of the model in light of them, in section 6. We conclude with the implications of the model results in the context of wider research questions in section 7.
2 Previous models 2.1 Axelrod and Hammond model of ethnocentrism
Axelrod and Hammond presented a seminal artificial society model of ethnocentrism (Axelrod & Hammond 2003, Hammond & Axelrod 2006). In their model, agents are represented with three traits: 1) a colour; 2) an in-group strategy and 3) an out-group strategy. There are four different colours and each strategy takes a binary value of either to cooperate or defect in a Prisoner’s Dilemma game2. Hence, there are 4x2x2 = 16 different possible agent types.
Agents are situated on a 50x50 grid3. Each grid location may contain a maximum of one agent or be empty. Initially the grid is empty but in each time period a new
1 Although it should be noted that Jansson questions the interpretation of the model as evidencing ethnocentrism at all by presenting a number of additional experiments indicating the role of space and kin selection as the dominant aspects of the Axelrod and Hammond model. 2 A Prisoner’s Dilemma game is a canonical abstract game, generally played between two agents, that captures the notion of costly cooperation such that it is in an individual egotist’s interest to not cooperate (that is defect) but it is in the collective interests of agents to cooperate. To play the game agents select one of two strategies: cooperate or defect and then receive a payoff based on the strategies chosen. One way to think of this is that cooperation involves unconditionally giving help to the other agent were as defection involves not giving help. 3 The grid is wrapped to form a torus. In this way, all locations on the grid have a full set of neighbours because a torus has no edges. We do this because we like donuts.

“immigrant” agent is placed in a random empty location on the grid. New agent traits are generated randomly from the 16 different types possible.
In each time, period agents also play the pairwise single round Prisoner’s Dilemma game with all their neighbours (north, south, east and west) on the grid4. When a game is played each agent compares it’s colour to its partner. If they match, it plays the strategy specified by its in-group trait. If they do not match then the out-group strategy is used. When an agent cooperates it incurs a cost, but it receives a benefit when its partner cooperates. The benefit is three times greater than the cost. Over the time period, each agent accumulates the costs and benefits of the game interactions producing a final payoff value.
At the end of a time period, agents may reproduce and/or die. Reproduction involves making a copy of the reproducing agent into an empty neighbouring grid location if one exists. Each trait of a reproduced agent may mutate with low probability5. The probability that an agent will reproduce is a function of its payoff. High payoffs mean an agent is more likely to reproduce6. Agents die with a fixed probability of 10%, this creates space on the grid allowing new agents to enter.
An agent is defined as ethnocentric if it has a cooperative in-group strategy and an out-group defect strategy. Results from simulation runs show high levels of ethnocentrism of the order of 80%. This result holds over a range of parameter settings such as grid size, number of colours and mutation rate. However, it was found that spatial localisation of reproduction and game interaction were necessary conditions for ethnocentrism to emerge7.
2.2. Previous tag models
Previous tag models, which focus on cultural processes, generally have a single tag8 and a single strategy. The in-group definition is defined by those that have matching tags (Geisel 1961; Holland 1993; Riolo 1997, 2001; Hales 2001, 2010; Shutters 2013). Because the set of agents sharing a tag defines in-group, agents do not have the ability to exclude such matching agents from their in-group. However, agents often do have the ability to defect on their in-group.
Riolo et al (2001) present a tag model that allows agents to redefine there in-group over contagious ranges of tag values but agents do not store a strategy but rather are assumed (forced) to cooperate with their in-group and defect on their out-group. Hence they have no possibility to evolve different strategies for their in-group (Roberts & Sheratt 2002). Variants of this latter model have incorporated a single
4 If a neighbour location is empty (does not contain another agent) then of course no game can be played for that neighbour location. 5 The mutation rate is 0.005 (0.5%). Mutation involves replacing a trait with a randomly selected value from the range. 6 The payoff is interpreted as a “probability to reproduce” (PTR) which is initially set to 12% before agents play any games. The cost is a 1% reduction in PTR the benefit is a 3% increase in PTR. 7 A reference implementation of the model is included within the NetLogo programming language (Wilensky 2003). Also experiences gained in replicating the model are discussed by Wilensky (2007). Jansson (2013) provides additional replications and analysis of modified forms of the model in order to question the validity of interpreting the model as capturing ethnocentrism. 8 Although such models may contain multiple individual tag traits they are recognised as a unit or composite tag. That is, agents must share all the same tags to be considered part of an in-group. This effectively reduces to the functionally to a single tag. Such models introduce the side-effect of increasing the effective mutation rate on the tag since mutation is applied to each individual tag that compose the composite tag.

evolving strategy such that agents can defect on their in-group (Edmonds 2006, Shutters 2013).
Axelrod, in his book on the evolution of cooperation, briefly discussed the effect that fixed labels (similar to our ethnic markers) could have on interactions between agents playing the Iterated Prisoner’s Dilemma (Axelrod 1980). He discussed how these could lead to poor cooperation between those not sharing the marker. However, the scheme discussed there is not directly comparable to the work presented here9.
3 Motivation for the ethno-cultural tag (ECT) model The interpretation given by Axelrod and Hammond of their model is of generational long-run change in which mutation of traits is seen as representing “culture, genetics or some combination of both” (Axelrod & Hammond 2003). Agents cannot change their traits during their lifetime. However, when an agent is born it may mutate it’s colour to one completely different from its parent. Hence, ethnicities (in the form of colours) and behaviours (in the form of strategies) change at the specified rate during reproduction but are then fixed for the life of the agent. In addition, agents are immobile and localised, only reproducing to neighbouring empty locations and only interacting with their local neighbours during their lifetime.
We present a model with a different emphasis. We explore within-generation cultural evolutionary processes in non-spatial environments. That is, where agents do not reproduce or die but rather imitate and innovate their beliefs and behaviours based the results of interactions with other agents that are potentially society wide rather than localised to neighbours on a grid. In fact, in the models presented here there is no geographical space at all10. Our model is a purely cultural model involving change within a generation.
We assign each agent a fixed ethnic marker (or colour) that cannot change11 but also we endow agents with a cultural marker (or tag) that can change. This allows agents to dynamically form cultural groups (or identities) based on a shared cultural tag. Agents may define their in-group as either those sharing the same ethnic marker, cultural tag, both or none. This latter in-group definition (or selector) is itself culturally evolved. This means that agents may come to define their in-group in different ways and imitate these definitions from others.
We allow for interactions between agents over the entire population inspired by the notion of a densely populated town, city or internet community where physical constraints do not stop individuals from interacting if they so wish. We also allow agents to bias their interactions towards their in-group for both game interaction and
9 His discussion was related to the Iterated Prisoner’s Dilemma (we consider a donation game) and did not consider the evolution of in-group definitions as we do here. 10 One of us has explored spatial variations of the model presented but these variations show much the same behaviour as the one presented. Spatially localised interaction, imitation and reproduction just seem to make the emergence of culturally-defined cooperative groups even easier. 11 Our interpretation of the ethnic marker is of a relatively stable classification that is shared within the population such that all agents agree can observe and agree on the classification. This might be based upon a genetically determined characteristic but they might be based on any characteristic that is relatively immutable (e.g. accent). We view the categories themselves as socially (culturally) constructed yet relatively stable over the short-term.

learning12. This captures the notion that individuals may seek members of their in-group from the population rather than interactions being purely determined by external environmental constraints (such as spatial proximity).
Hence, in this paper, we are exploring the short-run cultural evolutionary interplay between fixed ethnic markers and dynamic cultural groups within a large-scale non-spatially localised population.
4 A description of the ethno-cultural tag (ECT) model Here we describe the ECT agent-based model in detail. Essentially agents interact by playing donation games and through selective imitation. Agents store traits that determine their behaviour. Imitation involves agents copying the traits of others. Agents may also spontaneously innovate by changing their traits randomly. This supports a minimal form of cultural evolution where some traits spread and others disappear. Hence the behaviour of agents changes over time.
4.1 Agent traits
The model consists of a set of N agents. Each agent stores five traits: an ethnic marker, a cultural tag, an in-group selector, an in-group strategy and an out-group strategy. Table 1 summarises the agent traits.
Table 1. Summary of agent traits.
trait type range ethnic marker +ve integer [1..NE]
cultural tag +ve integer [1..NC] in-group selector member of {none, cultural, ethnic, both} in-group strategy member of {donate, shirk}
out-group strategy member of {donate, shirk}
4.1.1 The ethnic marker and cultural tag
The ethnic marker is a fixed observable marker assigned to each agent. Agents assigned the same ethnic marker are said to share the same ethnicity. The cultural tag is an observable marker indicating cultural group membership. Those who share the same cultural tag are said to share the same cultural group. Agents may change their cultural tag based on cultural evolutionary processes (see later) but their ethnic marker is pre-assigned and immutable.
4.1.2 The in-group selector Agents can only distinguish between other agents by observing their ethnic marker and cultural tag. The in-group selector determines how an agent defines its in-group based on these two observable traits.
The in-group selector can take one of four possible types; thus an agent defines its in-group as one of:
1) those with the same ethnic marker as itself (ethnic);
12 We do not model the mechanisms by which agents perform this searching. Such mechanisms could include social networks, institutional and social gathering places, clubs, meeting places and online forums etc.

2) those with the same cultural tag as itself (cultural); 3) those with the same ethnic maker and the same cultural tag (both); or 4) any other agent without restriction (none)13.
4.1.3 The agents’ strategy options
Agents store two strategies, one for the in-group and one for the out-group. These are independent as to their in-group selector. They can be either donators (co-operators) or ‘shirkers’ (defectors) with respect to the in-group and separately with respect to the out-group (however that is defined).
This means an agent can hold one of four possible strategy combinations:
1) shirk against both the in-group and out-group (ss); 2) donate to both the in-group and out-group (dd); 3) donate to in-group, shirk on out-group (ds); or 4) shirk on in-group, donate to out-group (sd).
4.1.4 Initialisation
At the start of the simulation all agents are initialised with random traits taken from their possible values, as described above. The possible ethnicities and cultural tags being limited by the values of the NE and NC parameters, respectively.
4.2 Key model processes
4.2.1 Interaction - a donation game Periodically pairs of agents interact by playing a “donation game” in which one initiating agent must decide if to provide help (a donation) to the other partner agent. If the initiator decides to donate it incurs a cost (C) to itself while the receiving partner agent gains a benefit (B) where B > C. Over time agents accumulate a payoff based on net benefits received minus costs incurred. During a donation game the initiating agent uses it’s in-group selector to decide if it’s partner is an in-group or an out-group member. It then enacts the behaviour (or strategy) indicated by it’s in-group strategy or out-group strategy respectively. Each strategy takes one of two types, either “donate” or “shirk” (meaning don’t make a donation). Only the initiating agent selects a strategy and plays the game. The partner agent is passive either receiving a donation or not.14.
4.2.2 Imitation Agents may change their traits, except the ethnic marker which is fixed, using a cultural evolutionary process based on imitation (reproduction) and innovation (mutation). Periodically an initiating agent compares its payoff to another partner agent in the population. If the other agent has a higher payoff then all of their traits, other than the ethnic marker, are copied by the initiating agent. This scheme implements a heuristic in which agents copy those who are doing better than themselves in terms of payoff. 13 One of us checked if adding a fifth possible selector which has the effect that nobody is considered as being in the agent’s in-group, but this seemed to make no significant difference to simulation outcomes. 14 Such donation games are a generalised variant of the one shot Prisoner’s Dilemma because it would always be in the strict self-interest of an agent (in terms of maximising payoff) to shirk rather than donate. Yet it would be in the populations interest (or in-group interest) to donate. The one-sided nature of the game indicates an asynchronous game interaction structure rather than the traditional synchronous Prisoner’s Dilemma version.

4.2.3 Innovation Each simulation tick, each agent changes its cultural tag randomly with low probability (the parameter, CM). It also changes its selector, in-group strategy and out-group strategy (independently) with another low probability (the parameter, SM). In all of these cases it changes randomly to one of the possibilities (a random cultural tag for the culture, one of the four selectors in the case of selector, or flips to the other possible strategy for in-group and out-group strategies).
4.2.4 Selecting partners
For both game interaction and imitation events agents need a method to select a partner agent from the population. For game interaction this involves an initiating agent randomly selecting another agent. It selects this from it’s in-group (as defined by it’s in-group selector) with a given probability (the parameter, GB, for in-group bias) and otherwise randomly from the entire population (except itself). The same mechanism is used for imitation events but a different parameter is used – the learning in-group bias (LB).
Hence if the GB parameter is set to 1, then this indicates that all game interactions will occur with randomly selected agents from within the initiating agent’s in-group (if other agents exist within the in-group). If GB = 0 then all game interactions will be with randomly selected agents from the entire population. If GB = 0.5 then (on average) half the game interactions will be with agents from the agent’s in-group and half from the entire population.
The LB parameter performs the same function but is applied to the imitation partner selection process. Hence with LB = 1 all imitation takes place from randomly selected members of the agents’ in-group, whereas LB = 0 indicates imitation is population wide etc.
In all cases of partner selection, for both game interaction and imitation, if an in-group member is required but does not exist (i.e. if the agent is the only member of it’s in-group as defined by its’ in-group selector) then a partner is selected randomly from the entire population.
4.3 Model Parameters
Table 2 summarises the parameters of the model. These have all been described in the above.
Table 2. Summary of model parameters and their types.
Parameter description type N number of agents in population +ve integer NE number of different unique ethnic markers +ve integer NC number of different unique cultural tags +ve integer GB game in-group bias probability LB learning in-group bias probability CM cultural tag mutation rate probability SM strategy and in-group selector mutation rate probability C cost of making a donation real [0..1] B benefit obtained from receiving a donation real [0..1]

4.4 Sequencing of processes
The simulation sequences events into cycles which represents some notional unit of time. Each cycle involves three phases: 1) game interaction; 2) imitation; 3) innovation (in that order).
In phase 1 (game interaction) each agent in the population is selected in random order and initiates a game interaction. This involves it selecting a partner, based on the mechanism described above, and then playing a donation game with the selected partner (also described above). After a game interaction the initiating agent and the partner’s payoffs are updated accordingly.
Phase 2 (imitation) follows the same process but the initiating agent selects a partner for imitation and then applies the imitation process whereby if the partner has a higher payoff then it’s traits are copied (other than the ethnic marker). It is important to note that only the initiating agent decides if to copy or not based on payoffs. The partner agent is passive and does not perform any imitation action even if it has a lower payoff than the initiating agent15.
Phase 3 (innovation) involves each agent randomly changing it’s traits (other than the ethnic marker) based on a two mutation parameters: tag mutation probability (CM) and strategy mutation probability (SM). With probability CM, the cultural tag is replaced by a randomly selected tag. Independently the in-group, out-group strategies are flipped with probability SM. Finally, also with probability SM, the in-group selector is replaced by a random variant16.
A simulation run involves repeatedly executing phases 1, 2 and 3 for some number of cycles after which the run terminates. Figure 1 shows a pseudocode description of the simulation model.
15 It is also important to note that during this phase copied traits are only updated at the end of the phase. This means that during the phase an agent that has previously imitated from another agent can still be imitated by another agent but that the traits that will be passed on will be those that the agent started the phase with not the new copied traits. Hence imitation updates are synchronous. This enforces the situation in which a payoff is associated with the traits that actually produced that payoff in a previous game interaction. An asynchronous version of this process could be implemented but it significantly complicates the implementation of the simulation. 16 Note that the innovation (mutation) phase is entirely decoupled from the imitation (reproduction) phase. Traditional evolutionary models often combine these two processes by only applying mutation to newly reproduced traits. This carries over from biological notions that innovation only occurs due to errors in copying. We purposefully avoid this assumption for our cultural model capturing the notion that agents may spontaneously innovate irrespective of imitation events. It is an empirical issue as to if more traditional evolutionary algorithms would converge to the same results – which may be the subject of future work.

For some number of cycles: Set all agent payoffs to zero // game interaction phase For each agent (a) in random order from the population: With probability GB: select an agent (b) from population matching (a)’s in-group selector If no match found then select (b) randomly from population Otherwise: Select an agent (b) randomly from the population Agent (a) applies appropriate strategy to (b) If (a) donated to (b) then increment (b)’s payoff total // imitation phase For each agent (a) in random order from the population: With probability LB: Select an agent (b) from population matching (a)’s in-group selector If no match found then select (b) randomly from population Otherwise: Select an agent (b) randomly from the population If agent (b)’s payoff > agent (a)’s payoff then: Agent (a) copies agent (b)’s strategies and cultural tag // innovation phase For each agent (a) in the population: With probability CM replace cultural tag with a randomly selected one With probability SM flip in-group strategy (donate becomes shirk and vice versa) With probability SM flip out-group strategy With probability SM replace in-group selector with a randomly selected one
Figure 1. Pseudocode algorithm for the ECT simulation model.
5 Simulation results 5.1 Method
A number of simulation runs (experiments) were performed with different parameter settings. The following statistics were collected: the donation rate (dr) which indicates the proportion of all game interactions that led to a donation occurring; the inter-ethnic donation rate (ie) which indicates the proportion of donations actually made that involved agents with different ethnic markers; the proportion of each of the four in-group / out-group strategy types in the population: ss, sd, ds, dd, where sd (as described above in section 4.1.2); and the proportions of the four different in-group selector types in the population: none (sn), cultural (sc), ethnic (se), both (sb) (as described above in section 4.1.1). These measures are summarised in Table 3.
Unless otherwise stated all experiments comprised a fixed population of N = 1000 with agents equally divided between the number of ethnic markers (NE). Hence when NE = 2, this means that 50% of the population share one marker and 50% share the other. Each simulation run is executed for 3,000 cycles. For each run statistics were based on averages of the values over the last 1000 cycles of the run. Each run was replicated 10 times with different initial pseudo-random number seeds. Averages and standard deviations of the ‘1000-cycle averages’ were then calculated over these 10 runs. Hence the standard deviations are over these 10 data points not the within run variation.

Table 3. Summary of measures collected from simulation runs.
Measure description Range dr overall donation rate as proportion of all games played [0..1] ie inter-ethnic donation rate as proportion of donations made [0..1] ss proportion of agents with in-group and out-group shirk [0..1] sd proportion of agents with in-group shirk and out-group donate [0..1] ds proportion of agents with in-group donate and out-group shirk [0..1] dd proportion of agents with in-group donate and out-group donate [0..1] sn proportion of agents with the in-group selector type “none” [0..1] sc proportion of agents with the in-group selector type “cultural” [0..1] se proportion of agents with the in-group selector type “ethnic” [0..1] sb proportion of agents with the in-group selector type “both” [0..1]
Simulation runs were performed for each of the range values of the parameters shown in Table 4 below. Hence we explored the effect of varying the game (GB) and learning in-group bias (LB) and the number of ethnic markers (NE). This comprises 27 different parameter setting combinations17.
Table 4. Summary of range of parameter values explored.
Parameter description range N number of agents in population 1000 NE number of different unique ethnic markers {1, 2, 4} NC number of different unique cultural tags 1000 GB game in-group bias {0, 0.5, 1} LB learning in-group bias {0, 0.5, 1} CM cultural tag mutation rate 0.01 SM strategy and in-group selector mutation rate 0.001 C cost of making a donation 0.1 B benefit obtained from receiving a donation 0.2
At the start of each simulation run all the changeable agent traits (the in-group selector, the cultural tag and the in-group and out-group strategies) were initialised to random values from their range (shown in Table 1)18.
5.2 General Results
Here we present a series of result focusing on high overall donation rates (dr) and associated inter-ethnic donation rates (ie). The Appendix presents more extensive results, including various combinations of GB and LB parameters, summary values of all measurements (as listed in Table 3 above) and for the parameter combinations listed in Table 4.
17 Results from more fine grained sweeps over the GB and LB parameters were performed and are summarised in the Appendix. 18 The same experiments were also performed in which agents were initialised to be purely ethnocentric (in-group selector = ethnic, in-group strategy = donate, out-group strategy = shirk). The results obtained were not significantly different from the random initialisation case. The only difference was that it took a few hundred initial cycles of a run for these traits to be selected out by cultural evolution.

5.2.1 Populations with a single ethnic marker Firstly we ran simulations for populations with a single ethnicity (NE=1). This means that agents cannot, in practice, discriminate based on ethnic markers since all agents share the same marker. Hence, these results serve as a baseline indicating the donation rates obtained based on purely cultural tag processes. Table 5 summarises the average donation rate (dr) results obtained for different values of game in-group bias (GB) and learning in-group bias (LB). It was found that almost identical results were obtained for donation rates when NE=2 and NE=4.
Notice that the highest donation rates are obtained when GB=1 and LB=0. In this condition game interaction is exclusively constrained to the in-group whereas learning (imitation) is population wide. Low values are obtained when GB=0 and / or LB=1. Hence population wide game interaction and / or exclusively in-group learning impair the emergence of high levels of donation.
Table 5. Average donation rate (dr) for different game (GB) and learning (LB) bias for populations with a single ethnic marker (NE=1). Standard deviations (not shown) were
negligible. Almost identical results were obtained for NE=2 and NE=4.
GB
LB
0 0.5 1 0 0.001 0.429 0.926
0.5 0.001 0.324 0.816 1 0.002 0.033 0.063
These results are consistent with similar results obtained in previous evolutionary tag models (Riolo 1997, 2001; Hales 2001). In those models high levels of cooperation were obtained with population wide evolution (essentially equating to LB = 0) and game interaction based on tag similarity (equating to GB = 1). This donation sustaining process results from a dynamic process of cultural group formation (based on shared tag values) and dissolution. This has been equated with a form of “group selection”19. An explanation of this process with a comparison of a number of models that evidence it is given in Hales (2010) hence we will not discuss this in detail here. However, Figure 2 shows a visualisation of the cultural group dynamics as a time series from an individual run. In this, a pixel is black if there is an agent with that tag at that time (there is no indication of the numbers involved).
Notice that cultural groups (agents sharing a tag) form and dissolve over time. Groups undergo a ‘life-cycle’ of stages that might be called: seeding, growth, decay and death. Typically, what seems to happen is the following. A new tiny cooperative group happens to form with a tag that is otherwise unused (due to innovation). This is usually two agents where they both have strategies and selectors that mean they donate to each other. This tiny group does well and so others quickly imitate them and the group grows explosively. When the group is large, shirkers start to appear by innovation of strategy – these decrease the advantage of the whole group. These shirkers temporarily do even better than the co-operators in that group, so that others imitate them, leading to a decline in the advantage of being in that group. Eventually by imitation agents move to other groups and the cultural tag disappears 19 It is important to note that groups themselves are not selected but rather individuals are selected that create cooperative groups. It can be argued that such models do not evidence strict group selection but rather a form of kin selection. However, this is a controversial distinction which we will not rehearse here. However, see for example: Wilson & Sober (1994), Nowak et al (2010) and Smaldino (2014).
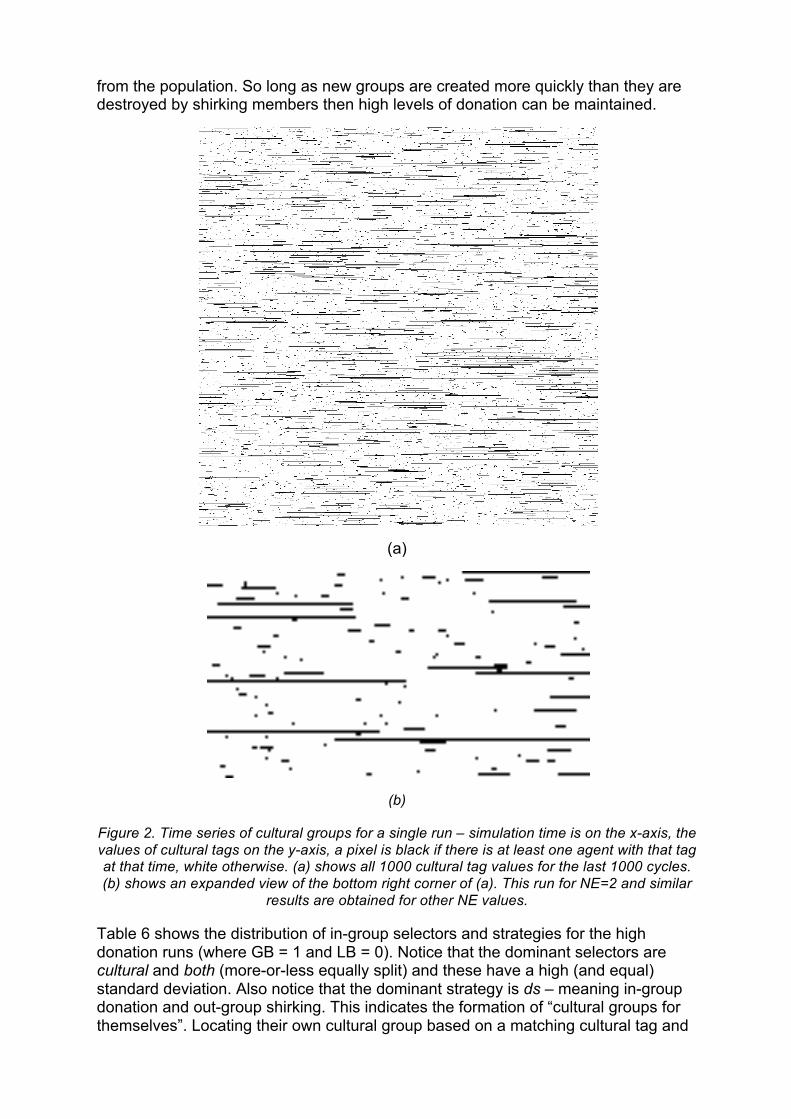
from the population. So long as new groups are created more quickly than they are destroyed by shirking members then high levels of donation can be maintained.
(a)
(b)
Figure 2. Time series of cultural groups for a single run – simulation time is on the x-axis, the values of cultural tags on the y-axis, a pixel is black if there is at least one agent with that tag at that time, white otherwise. (a) shows all 1000 cultural tag values for the last 1000 cycles. (b) shows an expanded view of the bottom right corner of (a). This run for NE=2 and similar
results are obtained for other NE values.
Table 6 shows the distribution of in-group selectors and strategies for the high donation runs (where GB = 1 and LB = 0). Notice that the dominant selectors are cultural and both (more-or-less equally split) and these have a high (and equal) standard deviation. Also notice that the dominant strategy is ds – meaning in-group donation and out-group shirking. This indicates the formation of “cultural groups for themselves”. Locating their own cultural group based on a matching cultural tag and

donating to them yet not donating to those not part of the in-group if they encounter them in a game interaction.
The split between cultural and both selectors is not surprising because in this case (a single ethnicity for the entire population, NE=1), these two selectors have exactly the same function. Hence, there is no selective pressure between them and this results in a passive ‘drift’ between the two. The high standard deviations indicate that each individual simulation run can produce variant results. Inspection of individual runs showed that the two selectors compete for dominance producing oscillations over time (see time series results presented below)20.
Table 6. Average in-group selectors (a) and strategies (b) for high donation runs for a population with a single ethnicity (NE=1, GB=1 and LB=0).
in-group selector none cultural ethnic both
ave. 0.003 0.443 0.002 0.552 stdev. (0.000) (0.264) (0.000) (0.264)
(a)
In-group / out-group strategies ss ds sd dd
ave. 0.053 0.875 0.006 0.067 stdev. (0.003) (0.016) (0.002) (0.015)
(b)
5.2.2 Populations with two ethnic markers For populations with two ethnic markers (NE=2), the donation rates produced were almost identical to those shown in Table 5, and the distribution of strategies was almost identical to those shown in Table 6(b). However, the distribution of in-group selectors was different. The cultural selector was more dominant yet there are still a significant number of both selectors. Table 7 shows the distribution of in-group selectors for the high donation condition (GB=1, LB=0) and can be compared to Table 6(a). Notice again, the high standard deviations for the cultural and both selectors indicating significant differences between individual simulation runs.
Table 7. Average in-group selectors for high donation runs for populations with two ethnicities (NE=2, GB=1 and LB=0).
in-group selector none cultural ethnic both
ave. 0.002 0.778 0.003 0.218 stdev. (0.000) (0.236) (0.000) (0.236)
It is important to note that with two ethnicities (NE=2) the cultural and both selectors have different functionalities. Specifically, the both selector defines the in-group based on ethnic marker and cultural tag. Hence an agent using such a selector excludes those who do not share its ethnic marker (half the population) from its in-group. This reduces the amount of inter-ethnic donation when combined with the ds strategy (i.e. donate to in-group, shirk on out-group).
20 This oscillation was not observed when the number of agents was increased, so it seems that there is more chance of a ‘regime change’ with smaller numbers.

Table 8 shows the average inter-ethnic donation rates as proportions of all donations made (ie). Since there is an equal split between the two ethnic markers in the population we would expect ie = 0.5 if no discrimination based on ethnic marker was occurring. Notice that in all cases ie < 0.5. When donation rates are high (GB=1, LB=0) ie ≈ 0.4, which means that inter-ethnic donations are 20% less than would be expected if no discrimination on ethnic marker was occurring. Also notice that where ie is lower, standard deviation is relatively high, indicating significant variation in results of independent simulation runs. This is to be expected given the results shown in Table 7, where standard deviations are high for cultural and both selectors. It is interesting to note that the lowest ie occurs when GB=0.5 and LB=1 – approximately 40% less than would be expected if no discrimination were occurring. However, in this case overall donation rates (dr) are very low, less than 5%, as can be seen in Table 5.
Table 8. Average inter-ethnic donation rate as proportion of all donations made (ie) for populations with two ethnicities (NE=2) for different game and learning in-group biases (GB
and LB). Standard deviations are shown in brackets below each average.
GB
LB
0 0.5 1
0 0.470 (0.015)
0.345 (0.129)
0.392 (0.117)
0.5 0.462 (0.013)
0.426 (0.101)
0.482 (0.011)
1 0.445 (0.012)
0.284 (0.227)
0.346 (0.195)
5.2.3 Dynamics So far we have only considered averages at the level of entire simulation runs (calculated over the last 1000 cycles). Figure 3 shows four example time series from within individual simulation runs for high donation rate runs (GB=1, LB=0) and two ethnicities (NE=2). Notice that the cultural and both selectors do not persist in some fixed proportion over time but rather compete for dominance, one dominating the population for some period before the other potentially takes over. Notice also that when the both selector entirely dominates then, as would be expected, inter-ethnic donation completely collapses. In general ie is inversely proportion to sb and proportional to sc.
(a)
(b)
0
0.2
0.4
0.6
0.8
1
0 500 1000 1500 2000 2500 3000 cycle
dr ie sc sb
0
0.2
0.4
0.6
0.8
1
0 500 1000 1500 2000 2500 3000 cycle
dr ie sc sb

(c)
(d)
Figure 3. Time series of donation rate (dr), inter-ethnic donation rate (ie), cultural (sc) and both (sb) selectors for four independent simulation runs. (a) shows domination of the
population by the cultural selector after initial domination by the both selector. (b) shows an oscillation between the two. Notice that when sb is high ie is low. (c) shows a more typical
run in which sc dominates. (d) shows a run where sb comes to dominate. Strategies are not shown but are characterised by persistently very high levels of the ds strategy (that is donate
to in-group, shirk to out-group). Results are for two ethnicities (NE =2) and GB=1, LB=0.
5.3 Further experiments
We performed a number of different runs exploring various parameters beyond the ranges given in Table 4. We do not discuss these in detail but give a brief summary bellow. Some of the results from these further experiments are given in the Appendix.
5.3.1 Parameter sweep over game and learning biases
We performed a more fine grained parameter sweep of the game (GB) and learning (LB) biases using increments of 0.1. The results produced values that broadly interpolate between those presented above for the 0, 0.5 and 1 cases. These results are given in the Appendix.
5.3.2 Populations with four ethnic markers
We found that populations equally split between four ethnic markers did not significantly evidence the emergence of the both selector when donation rates were high. Hence in the NE=4 case inter-ethnic donation rates (ie) were not much lower than would be expected if ethnic markers were ignored by agents (0.75). We got the same results when increasing the population size to N=2000. Hence these different results from the NE=2 case were not a result of the smaller ethnic group sizes. One possible explanation for this could be the increase in possibility of “ethnic singletons” that would occur in small cultural groups with larger numbers of ethnicities. Specifically, cultural groups that contained an individual with a unique ethnicity (within the group) would lead to the both selector being selected against since it would lead to a random partner from the population – because no partner could be found within the group that matched their ethnicity and in that case a random partner from the entire population is selected. A simpler explanation could be that more ethnic diversity leads to lower levels of the both selector because there is less chance of the formation of ethnically homogenous seed groups. However, further investigation is needed to understand the results. Results for the runs with NE=4 can be found in the Appendix.
0
0.2
0.4
0.6
0.8
1
0 500 1000 1500 2000 2500 3000 cycle
dr ie sc sb
0
0.2
0.4
0.6
0.8
1
0 500 1000 1500 2000 2500 3000 cycle
dr ie sc sb

5.3.3 Higher numbers of ethnic marker Higher numbers of ethnic markers lowers the number of agents with both selectors and generally ensures the dominance of cultural in-group cooperation. This reduces the dynamics to essentially a slight competition between DS and SS strategies within the context of almost all agents having the both selector.
5.3.4 Evolving game and learning biases
We experimented with evolving the GB and LB parameters by making them traits within each agent that can be imitated and innovated in the same way as the other traits. We found that this produced a number of interesting results. In general LB tends to rapidly evolve towards 1, whereas GB takes on a several values < 1 but does not change rapidly and does not appear to converge to low values but rather higher values. High LB reduces donation rates to very low values (as we have seen in the above results) hence evolving these parameters as agent traits leads to low donation rates. High LB seems to produce a lock-in effect which appears to emerge from the fact that an in-group of high LB agents will only learn from their in-group who come to also be high LB. However, these experiments require further investigation and we do not present them here.
5.3.5 Minority ethnic groups We explored populations with two ethnicities in which one ethnicity only comprised 10% of the population, giving a 90:10 rather than an equal 50:50 split. In that condition we found results broadly similar to those observed in the equal split case. Overall, and inter-ethnic, donation rates were consistent with those shown in tables 4 and 7. This is interesting because we might expect to see lower inter-ethnic donation rates because intuitively it would appear that “cultural drift” between the both and cultural selectors should be more operant in this case over the equal split case. One hunch is that even a small subpopulation with a different ethnic marker is sufficient to influence the majority through cultural learning to increase selective pressure against the both selector. This would be an interesting finding in itself. Further investigation is necessary to determine if this is the case however.
5.3.6 Fixed positive predispositions towards those with the same ethnic markers
We performed some simulation runs in which we hardwired agents to be predisposed to their own ethnic type. This was mediated by a parameter (PR) which indicated the probability that an agent, when game interacting, unconditionally donates to a partner that matches its ethnic marker. Hence if PR = 1 then no matter what the agent traits are a game interaction between agents with the same ethnic markers would produce a donation. If PR = 0.5 then with probability 0.5 agents donate but with probability 0.5 they follow the normal donating decision based on their traits. Interestingly we found that even with high PR this did not promote the formation of the ethnic or the both selector. In fact, it promoted the cultural selector.
This counterintuitive result happens because agents learn to free ride on their ethnic group by avoiding game interacting with them while taking the benefits gained from others in the group who game interact with them. Hence, a kind of ethnic Prisoner’s Dilemma emerges. This seems to be a result of the game interaction following an asymmetric donation game rather than say, a one shot PD where both agents would symmetrically choose to donate or shirk during a game interaction. However, we have not explored this hypothesis.

The motivation for examining ethnic cooperative predispositions was to explore the possibility that a very small predisposition (PR) could lead to high levels of ethnic or both selectors emerging and consequently low inter-ethnic donation. Yet we found that in the current model the reverse is true.
It would be interesting to find minimal models that would evidence this property rather than the reverse. We could then consider under what condition cultural evolution either amplifies or attenuates hardcoded ethnic predispositions. This is interesting because it could link to models in which such predispositions are produced through generational processes (for example in Hammond and Axelrod 2003).
5.3.7 Runs with 10,000 agents
To check the above results scaled, we tried runs with 10,000 agents, at N=2, GB=1, LB=0.5. Measurements were collected and processed as before (Section 5.1) for 20 runs with independent random seeds. The results are summarised in Table 9 (results for both sn and se were both av=0.003 and sd=0.000 and are omitted from this).
Table 9. Results for runs with 10,000 agents, at N=2, GB=1, LB=0.5.
dr ie sc sb ss ds sd dd 0.919 0.408 0.882 0.112 0.058 0.875 0.005 0.061
(0.001) (0.013) (0.030) (0.029) (0.001) (0.004) (0.000) (0.004)
These bigger runs display more stable results than those with fewer agents (thus much lower standard deviations). The cultural tag dominated in all runs allied with ds strategy, resulting in high donation rates, with just under half of these being inter-ethnic. However the both selector still occurs at a lower rate, meaning that ethnocentrism does still occur allied with a preference for the same cultural tag.
5.3.8 Different initial conditions
In the current model agents are initialised with random traits. One can start it in some particular configuration. For example, one can start the model off with all agents with the both selector and the SS strategy. In trials we found that, whilst this might cause an initial phase that lasts for a while, the patterns reported above assert themselves after a while (assuming that there is some level of innovation).
6 Observations and interpretations Here we make some general observations based on the results. We then make some points concerning the purpose and interpretation of the model.
6.1.1 General observations
High donation rates occur when game interaction is biased towards the in-group (GB=1) and learning is population wide (LB=0).
This is consistent with previous evolutionary tag models of cooperation (Hales 2001). High donation rates occur due to the dynamic formation and dissolution of cultural groups based on matching cultural tags and associated strategies that donate to the in-group but shirk on the out-group – this may be considered as a form of cultural group selection (Hales 2010).

In general, cultural groups trump ethnic groups and no ethnocentrism emerges. The majority of agents come to ignore the ethnic marker in defining their in-groups.
In all cases considered the ethnic only in-group selector is not promoted via the cultural evolutionary process whereas the cultural selector is. Intuitively this is to be expected since the ethnic markers carry no information in themselves because they are fixed whereas cultural tags can evolve in the same way as strategies.
In a minority of circumstances a form of ethnocentrism does emerge based on in-groups defined by both cultural tag and ethnic marker.
In a significant minority of circumstances the both selector which considers both the ethnic marker and the cultural tag does dominate the population leading to periods of low inter-ethnic donation rates, yet high overall donation rates. This is because high donation occurs between agents sharing the same ethnic marker and cultural tag.
Such breakdowns in inter-ethnic donation are contingent, unpredictable, path dependent, yet revisable (as shown in figure 3 above). Thus, for significant periods of time a population will evidence hardly any inter-ethnic donation activity. An observer in such a (relatively small) artificial society would occasionally see hard-to-explain transitions from high inter-ethnic donation to low and vice-versa.
Ironically it is the success of cultural group based cooperation processes that allows for the promotion of in-group selectors that discriminate based on ethnic markers and cultural tags. A cultural group can become associated with an ethnic marker arbitrarily when the cultural group is successful in promoting high donation rates. This can support a mechanism that crowds out donation based purely on cultural tags.
When there is only one ethnicity (NE=1) then there is no selective pressure between the two and hence we get more-or-less an equal division between them (see Table 6a). This “cultural drift” effectively follows a random walk due to sampling error and the noise inherent in the payoffs – since in our model we do not calculated expected or average payoffs but rather accumulated actual payoffs from a limited and nondeterministic set of game interactions per cycle.
However, there is an overall significant selective pressure for the cultural rather than both selector when NE > 1. This can be seen by comparing the results of Table 6a and Table 7. This may be due to the a combination of two factors (a) it is relatively unlikely that a new both group will be ‘seeded’ by a pair of agents innovating their tags, since in this case they have also to have the same ethnicity and (b) the more successful culture-based groups there are the more new seed groups will be formed by those with a culture selector. An agent using the both selector limits its choice of cooperative partners within a cultural group to only those that share the same ethnic marker limiting their ability to initiate a new group. As the model is currently structured the more ethnicities there are the less likely a new both group will emerge, but when it does it grows as quickly by imitation as culture groups.
6.1.2 Model Limitations The model has a number of limitations/assumptions, that might be relaxed. These are now briefly discussed.

1. There is no genetic or generational process. This is deliberate because we wanted to concentrate upon what possibilities there are due to short-term processes. Any genetic process would necessarily be much slower, and thus require longer runs that we explore here. The relationship between any genetic and cultural processes might be complex.
2. When agent imitate, they take on a whole set of traits (culture, selector, in-group strategy and out-group strategy) as a complete bundle. They do not selectively imitate some of the traits. Thus, for example, the introduction of “strong cheaters” – those that may imitate the tag but not the strategy etc. (Shutters and Hales, 2013) would destroy the cooperation that emerges in this model.
3. Agents innovate independently. There are no pioneering groups or families that change their cultural tags together. If they did this, it might make the prevalence of the both selector higher, since it would be more probable that such groups could seed.
4. There is no space. Again this is deliberate, since for us space is just another kind of tag (with Euclidean properties that can have unanticipated effects21). Again the interactions between ethnic, cultural and spatial tags might be complex but are unnecessary to the points being made here. Space was necessary to the emergence of ethnocentrism in models following (Axelrod and Hammond 2003), no cooperation would have arisen there without it. We hypothesise that space would only strengthen the results in this paper22.
5. Tags here are discrete – no similarity of ethnic or cultural tags have a role here, one is either identical in terms of the appropriate tag (or tags) or different. This is unlike tag models that use a distance and where there is some tolerance for difference (Riolo et al 2001, Edmonds 2006). This requires agents to have some kind of tolerance trait as well as those that identify them, and thus complicates the model, however it might allow for dynamics that cannot be exhibited by the ECT model, for example members of a group gradually restricting their definition of an in-group in response to incomers or defectors.
6.2 The purpose and interpretation of the model
The purpose of this model is that of theoretical exploration. It does not attempt to model the observed world in any direct sense but rather should be viewed as a thought experiment. It enables us to explore the complicated possibilities inherent in a particular set of mechanisms. The traces that result from the simulation gives some logical support to narratives which are consistent with them, concerning how people might behave and interact, but it remains an artificial society.
There is a danger that artificial society models can be over interpreted in their relationship to observed phenomena. Over interpretation can occur because such models are not empirically informed or refutable (since they do not provide predictions of unknown events). They are not related to any particular set of data, and thus cannot be said to provide evidence for an explanation for anything observed.
Consequently where we have used terms such as “ethnic marker”, “ethnocentrism”, “donation” or “cultural group” etc. these only relate to the model. Interpretations of those terms are fluid. For example, the “ethnic marker” could just as easily be interpreted as gender, social class, nationality or any other generally recognisable, 21 For example it takes 7 colours to colour a map on a torus – the topology that many abstract models are simulated within – but only 4 on a 2D grid with edges. 22 Preliminary experiments we have done suggest this.

fixed and stable characteristic in a population. Donation and payoffs could be interpreted as some economic benefit or some social benefit – such as status, influence or goal achievement.
What the model presented here assumes is an artificial world in which cultural evolutionary processes, based on imitation and innovation towards improving individual benefit, are the only processes that determine agent behaviour23. All traits apart from the ethnic markers of agents are blank slates on which the cultural evolutionary process may write any characteristic. We ignore social networks, other relationships between agents, wider historical or cultural phenomena etc. Agents have no memory of past encounters and can not recognise individuals. They can only recognise the ethnic marker and the cultural tag – nothing else.
We have excluded space from the model24 but included parameters that define how exclusive both interaction and learning are toward the in-group. This allows for an understanding of the effect of these as independent parameters25.
Real people in real societies do not change their beliefs and behaviours based on simple imitation or random changes. People are attached to particular beliefs and practices for many reasons other than individual benefit. In fact they may be the basis of identity itself and may be held even when they are of no benefit to the individual at all – maybe even because they are of no benefit. Social behaviours and beliefs result from a complex interplay of upbringing, personal experience, social expectations and norms and are not only the result of adaptation of strategy and the basis of judging who is “in-group”.
However an artificial society, such as the one presented, can further our knowledge. It can provide specific and formal counter-examples to commonly held assumptions. It can suggest hypotheses which might be fruitful to test and explore further (e.g. with empirical research). It might also provide ideas and analogies with which to think about the corresponding real world phenomena, however this is risky since it might be misleading – ideas and analogies so gained are all right as long as they are accompanied by a continuing scepticism.
Our motivation for this thought experiment is to ask: even in an artificial society in which such cultural processes were the only determinant of behaviour could fixed markers attached to agents effect outcomes? Or more precisely, would such a system lead to forms of donation discrimination based upon the ethnic marker, and if so under what circumstances? These question are interesting because if some form of artificial “ethnocentrism” still emerged in such a society we can use the model as evidence to refute the intuition that in a situation where cultural learning and self-interest predominated then ethnocentrism could not emerge. Similarly, the conclusion that in our model there was not pure ethnocentrism, suggests that when
23 More formally, we concern ourselves only with so-called “horizontal transmission” of cultural traits (Boyd and Richerson 1985). 24 Strict spatial relationships – such as on a 2-dimensional grid – import many assumptions and properties into a model. In our case we were interesting in pure group interactions rather that a combination of groups and spatial interactions. 2D spatial structures are known to support high levels of cooperation between agents following a wind range of, even very simple, behaviours (Perc et al 2013). We did some explorations adding in space to the ECT model, and these suggested that space simply makes culture-based cooperation stronger. 25 Of course it can be argued that game and learning interactions might more properly be correlated i.e. that agents tend to learn form the same agents they game interact with and vice versa. This could be interesting future work.

ethnocentrism is observed in a real society that it might be based on other social, political or historical forces such as ingrained prejudice, false consciousness, or competition for power between classes or elites.
As an aside it is interesting to speculate on deeper, perhaps subconscious, motivations for models used for theoretical exploration. For example, both the Schelling model and the Hammond and Axelrod model could be interpreted as attempting to show how an entirely free and equal society of individuals can still exhibit segregation and ethnocentrism, and thus the fact that we see these around is not evidence that society is fundamentally unequal. Thus, it could reflect a wish to justify observed inequality. However, such models, being only abstract explorations, are open to many interpretations. One could equally argue that the kind of freedom embodied in the models (limited, calculating, and individualised choice based on individual costs and benefits) is not sufficient to achieve commonly held socially disable goals, and so state intervention is needed.
7 Future work The model, although comparatively simple, evidences rich behaviour that we have only explored one aspect of. In addition to the expanding the further experiments discussed in section 5, other future work could include:
• Understanding the preconditions that lead to rapid transitions that can occur in inter-ethnic donation rates over time;
• Introducing migration into the model such that new agents arrive at some fixed or variable rate - it would be of interest to examine the results of migration by agents holding the same and a different ethnic markers from that which is in the majority of a host population;
• Introducing network based group formation processes; • Combining long-run generational evolution with short-run cultural evolution.
Another interesting area of future work could be giving agents the ability for a more generalised form of recognition over multiple tags and associated strategies. In such a model, agents would be able store a set of both fixed markers and changeable cultural tags with agent strategies representing mappings from tag patterns to particular strategies. In this case cultural evolution can come to select the salient markers and tags from a large set26.
8 Conclusions In the ECT model there was no sustainable cooperative groups based on the ethnic marker alone. Also, the amount of inter-cultural donation was insignificant. Anything that might be interpreted as pure ethnocentrism did not arise. Ethnocentrism, when it did arise occurred in conjunction with cultural discrimination. Unlike the models following (Axelrod and Hammond 2003), the ECT model showed how short-term cultural processes might explain the appearance of ethnocentrism, without a tendency for preferring one’s own ethnicity being ‘hardwired’ by biological evolution (within the social setting of cooperating humans).
The hypothesis suggested by this work, namely that group-based cooperation/discrimination is a result of cultural adaptation and that ethnic-based
26 Previous models explored aspects of this (Hales 1998). However in that work there were no fixed markers or learnable in-group selectors.

cooperation occurs only as a special kind of culture-based cooperation, has a number of interesting implications. It would mean that ethnocentrism, when it occurs, may be the result of a primarily cultural process that just happens to use ethnic markers as part of its definition of the in-group27.
This does not mean that genetic evolution has played no role, but that we might have evolved to flexibly co-determine what our in-group is. In our model, cultural evolution spreads in-group selectors and strategies that favour the in-group over the out-group. Empirical experiments have shown that people given arbitrary group assignments come to act favourably to the in-group and less so to the out-group (Brewer 1979). It is clear that in this empirical work no imitation or innovation phase is required. Simply telling individuals they are part of a group produces the in-group behaviour. This implies that humans appear to be predisposed to favour any in-group so long as they know how it is defined. It is sufficient for an experimenter to give them their group assignments. Hence, it does appear that people are not a priori fixated on a particular in-group definition but that this is fluid. Cultural dynamics without any predisposed in-group favouritism produce a similar result (as our model shows). It appears then that an agent entering such a process would do well to follow this rule. Perhaps, slower forms of evolution (including genetic evolution) could select for in-group favouritism irrespective of the group definition (as might be suggested by the “Social Intelligence Hypothesis” of Kummer et al. (1997)). In other words, genetic evolution might have adapted to the selective advantage of group cooperation by giving us this ability. To put this another way, our general “groupishness” may have evolved in the past but not our specific groups in the present (Ridley 1979) since actual groups are culturally constructed and may change rapidly.
References Axelrod, R. (1980). The Evolution of Cooperation. Basic Books, New York.
Axelrod, Robert, & R. A. Hammond. (2003) The Evolution of Ethnocentric Behavior. Midwest Political Science Convention, April 16, 2003.
Boyd, R., and P.J. Richerson. (1985). Culture and the Evolutionary Process. Chicago: University of Chicago Press.
Brewer, M. B. (1979). In-group bias in the minimal intergroup situation. A cognitive-motivational analysis. Psychological Bulletin 86(2):307-324.
Edmonds, B. (2006) The Emergence of Symbiotic Groups Resulting From Skill-Differentiation and Tags. Journal of Artificial Societies and Social Simulation, 9(1), 10. http://jasss.soc.surrey.ac.uk/9/1/10.html
Geisel, T. (aka: Dr. Seuss) (1961) The Sneetches and other stories. London, Collins.28
Hales, D. (1998) Stereotyping, Groups and Cultural Evolution: A Case of "Second Order Emergence"? In Sichman, J., Conte, R., & Gilbert, N. (Eds.) Multi-Agent
27 In empirical laboratory experiments it was shown that conventionally assumed categorisations based “race” were quickly discarded when other salient cultural group cues were presented to subjects (Kurzban 2001). 28 “The Sneetches” is a short children’s story satirising discrimination based on arbitrary and changeable symbols attached to agents.

Systems and Agent-Based Simulation. Lecture Notes in Artificial Intelligence 1534. Berlin: Springer-Verlag
Hales, D. (2001) Cooperation without memory or space: Tags, groups and the prisoner's dilemma. In S. Moss & P. Davidsson (Eds.), Multi-Agent-Based Simulation, 1979, 157-166.
Hales, D., (2010) Rationality meets the Tribe: Recent Models of Cultural Group Selection. In Mollona, E., (ed) Computational Analysis of Firms’ Organization and Strategic Behaviour. Routledge.
Hales, D. and Edmonds, B. (2015, October 16). "EthnoCultural Tag model (ECT)" (Version 1). CoMSES Computational Model Library. Retrieved from: https://www.openabm.org/model/4744/version/1
Hales, D. and Shutters, S. (2012). Cooperation through the endogenous evolution of social structure. Proceedings of the Complex 2012 conference in Santa Fe, NM. Dec. 5-7th 2012
Hammond, R. & Axelrod, R. (2006). The Evolution of Ethnocentrism. Journal of Conflict Resolution, December 2006, 50: 926-936, doi:10.1177/0022002706293470
Holland, J., (1993). The Effect of Labels (Tags) on Social Interactions. Santa Fe Institute Working Paper 93-10-064. Santa Fe, NM.
Jansson, F. (2013) Pitfalls in Spatial Modelling of Ethnocentrism: A Simulation Analysis of the Model of Hammond and Axelrod. Journal of Artificial Societies and Social Simulation 16 (3) 2 http://jasss.soc.surrey.ac.uk/16/3/2.html
Kummer, H., Daston, L., Gigerenzer, G., & Silk, J. (1997). The social intelligence hypothesis. In Weingart et. al (eds.), Human by Nature: between biology and the social sciences. Hillsdale, NJ: Lawrence Erlbaum Associates, 157, pp179.
Kurzban, R., Tooby, J., and Cosmides, L. (2001). Can race be erased? Coalitional computation and social categorization. Proceedings of the National Academy of Sciences (PNAS) 98(26), 15387–15392. http://www.pnas.org/cgi/reprint/98/26/15387.pdf
LeVine, R. A., and D.T. Campbell. (1972). Ethnocentrism: Theories of Conflict, Ethnic Attitudes and Group Behavior. New York: Wiley.
Nowak, M. A., & May, R. M. (1992). Evolutionary games and spatial chaos. Nature, 359(6398), 826-829.
Nowak, M.A., Tarnita, C.E., & Wilson, E.O. (2010). The evolution of eusociality. Nature, 466, 1057–1062. doi:10.1038/nature09205
Perc, M., Gómez-Gardeñes, J., Szolnoki, A., Floría, L., Moreno, Y. (2013). Evolutionary dynamics of group interactions on structured populations: a review. J. R. Soc. Interface 2013 10 20120997; DOI: 10.1098/rsif.2012.0997.
Ridley, M. (1997). The Origins of Virtue. Penguin.
Riolo, R. (1997). The Effects of Tag-Mediated Selection of Partners in Evolving Populations Playing the Iterated Prisoner's Dilemma. Santa Fe Institute Working Paper 97-02-016. Santa Fe, NM.

Riolo, R. L., Cohen, M. D., & Axelrod, R. (2001). Evolution of cooperation without reciprocity. Nature, 414(6862), 441-443.
Roberts, G., & Sherratt, T. N. (2002). Does similarity breed cooperation? Nature, 418(6897), 499-500.
Roitto, R. (2015). Dangerous but contagious altruism: recruitment of group members and reform of cooperation style through altruism in two modified versions of Hammond and Axelrod's simulation of ethnocentric cooperation. Religion, Brain & Behavior, DOI: 10.1080/2153599X.2015.1022795.
Schelling, Thomas C. (1971). Dynamic Models of Segregation. Journal of Mathematical Sociology 1:143-186.
Shutters, S. T. & Hales, D. (2013) Tag-Mediated Altruism is Contingent on How Cheaters Are Defined. Journal of Artificial Societies and Social Simulation, 16(1), 4 http://jasss.soc.surrey.ac.uk/16/1/4.html.
Smaldino, P. (2014). The cultural evolution of emergent group-level traits. Behavioral and Brain Sciences, 37, pp 243-254 doi:10.1017/S0140525X13001544.
Tajfel, H., Billig, M., Bundy, R., & Flament, C. (1971). Social categorization in intergroup behavior, European Journal of Social Psychology, 1, 149-178.
Wilensky, U. (2003). NetLogo Models Library: Ethnocentrism. http://ccl.northwestern.edu/netlogo/models/Ethnocentrism. Center for Connected Learning and Computer-Based Modeling, Northwestern University, Evanston, IL.
Wilensky, U., & Rand, W. (2007). Making Models Match: Replicating an Agent-Based Model, Journal of Artificial Societies and Social Simulation, 10(4), 2 http://jasss.soc.surrey.ac.uk/10/4/2.html
Wilson, D. S. and Sober, E. (1994). Reintroducing group selection to the human behavioral sciences. Behavioral and Brain Sciences, 17, pp 585-608 doi:10.1017/S0140525X00036104.

Appendix The results obtained for one ethnicity (NE=1) are given in Table 10, two ethnicities (NE=2) in and for four ethnicities (NE=4) in Table 12. Figure A1 shows surface plots of more fine grained parameter sweeps over GB and LB. Each individual data point represents 10 individual simulation runs (as described in Section 5.1). Where parameter values are not shown they can be found in Table 4.
Table 10. Results obtain from simulation runs for one ethnicity. Bold values show averages with standard deviations shown below each value.
parameters donations in-group selector in / out-group strategies NE GB LB dr ie sn sc se sb ss ds sd dd 1 0 0 0.001 0.000 0.283 0.189 0.340 0.189 0.591 0.124 0.285 0.000
0.000 0.000 0.013 0.021 0.022 0.026 0.022 0.014 0.028 0.000
1 0 0.5 0.001 0.000 0.271 0.241 0.243 0.246 0.608 0.170 0.223 0.000 0.000 0.000 0.035 0.023 0.028 0.033 0.021 0.017 0.026 0.000
1 0 1 0.002 0.000 0.169 0.338 0.152 0.341 0.621 0.263 0.117 0.000 0.000 0.000 0.019 0.023 0.019 0.028 0.025 0.031 0.014 0.000
1 0.5 0 0.429 0.000 0.002 0.488 0.002 0.509 0.153 0.844 0.001 0.004 0.005 0.000 0.000 0.303 0.001 0.303 0.010 0.010 0.000 0.000
1 0.5 0.5 0.324 0.000 0.002 0.619 0.002 0.379 0.366 0.630 0.001 0.003 0.018 0.000 0.001 0.290 0.000 0.290 0.037 0.037 0.000 0.000
1 0.5 1 0.033 0.000 0.029 0.519 0.026 0.427 0.928 0.065 0.007 0.000 0.009 0.000 0.008 0.319 0.007 0.311 0.015 0.015 0.002 0.000
1 1 0 0.926 0.000 0.003 0.443 0.002 0.552 0.053 0.875 0.006 0.067 0.003 0.000 0.000 0.264 0.000 0.264 0.003 0.016 0.002 0.015
1 1 0.5 0.816 0.000 0.003 0.605 0.003 0.390 0.150 0.759 0.020 0.071 0.011 0.000 0.001 0.340 0.000 0.340 0.010 0.028 0.007 0.021
1 1 1 0.063 0.000 0.020 0.539 0.019 0.423 0.808 0.067 0.122 0.004 0.017 0.000 0.014 0.338 0.007 0.334 0.059 0.014 0.050 0.004
Table 11. Results obtain from simulation runs for two ethnicities. Bold values show averages with standard deviations shown below each value.
parameters donations in-group selector in / out-group strategies NE GB LB dr ie sn sc se sb ss ds sd dd 2 0 0 0.001 0.470 0.351 0.237 0.100 0.313 0.643 0.206 0.151 0.000
0.000 0.015 0.032 0.025 0.011 0.026 0.015 0.018 0.019 0.000
2 0 0.5 0.002 0.462 0.274 0.321 0.102 0.304 0.648 0.236 0.117 0.000 0.000 0.013 0.056 0.047 0.012 0.045 0.018 0.026 0.027 0.000
2 0 1 0.002 0.445 0.159 0.365 0.083 0.394 0.641 0.304 0.056 0.000 0.000 0.012 0.026 0.023 0.013 0.037 0.016 0.018 0.015 0.000
2 0.5 0 0.425 0.345 0.002 0.682 0.002 0.315 0.153 0.844 0.001 0.004 0.009 0.129 0.001 0.260 0.001 0.260 0.014 0.014 0.000 0.000
2 0.5 0.5 0.312 0.426 0.002 0.840 0.002 0.157 0.387 0.610 0.001 0.003 0.021 0.101 0.001 0.210 0.001 0.210 0.042 0.042 0.000 0.000
2 0.5 1 0.046 0.284 0.027 0.501 0.023 0.451 0.906 0.089 0.005 0.001 0.007 0.227 0.018 0.405 0.009 0.398 0.015 0.015 0.003 0.001
2 1 0 0.917 0.392 0.002 0.778 0.003 0.218 0.061 0.872 0.005 0.063 0.008 0.117 0.000 0.236 0.000 0.236 0.007 0.012 0.001 0.013
2 1 0.5 0.818 0.482 0.003 0.960 0.003 0.035 0.149 0.765 0.020 0.067 0.009 0.011 0.001 0.021 0.000 0.021 0.009 0.014 0.004 0.016
2 1 1 0.063 0.346 0.021 0.622 0.026 0.331 0.826 0.070 0.101 0.004 0.011 0.195 0.006 0.363 0.017 0.364 0.033 0.010 0.036 0.002

Table 12. Results obtain from simulation runs for four ethnicities. Bold values show averages with standard deviations shown below each value.
parameters donations in-group selector in / out-group strategies NE GB LB dr ie sn sc se sb ss ds sd dd 4 0 0 0.001 0.669 0.350 0.226 0.114 0.311 0.640 0.209 0.152 0.000
0.000 0.019 0.058 0.025 0.012 0.052 0.019 0.033 0.029 0.000
4 0 0.5 0.002 0.666 0.261 0.302 0.104 0.334 0.637 0.258 0.106 0.000 0.000 0.011 0.027 0.029 0.014 0.051 0.028 0.027 0.013 0.000
4 0 1 0.002 0.655 0.161 0.403 0.080 0.357 0.619 0.326 0.056 0.000 0.000 0.017 0.025 0.036 0.007 0.040 0.018 0.022 0.011 0.000
4 0.5 0 0.419 0.628 0.002 0.823 0.003 0.173 0.162 0.835 0.001 0.003 0.008 0.119 0.001 0.165 0.001 0.165 0.011 0.011 0.000 0.000
4 0.5 0.5 0.316 0.725 0.002 0.960 0.003 0.037 0.381 0.616 0.001 0.003 0.013 0.009 0.001 0.014 0.000 0.014 0.027 0.027 0.000 0.000
4 0.5 1 0.043 0.338 0.021 0.494 0.025 0.461 0.902 0.094 0.004 0.001 0.011 0.259 0.009 0.294 0.013 0.298 0.023 0.024 0.005 0.001
4 1 0 0.921 0.725 0.002 0.963 0.003 0.033 0.057 0.880 0.005 0.058 0.007 0.014 0.000 0.019 0.000 0.019 0.006 0.013 0.001 0.009
4 1 0.5 0.812 0.736 0.003 0.976 0.003 0.019 0.155 0.755 0.020 0.071 0.015 0.007 0.000 0.010 0.001 0.010 0.015 0.024 0.004 0.014
4 1 1 0.072 0.369 0.015 0.462 0.016 0.509 0.816 0.082 0.100 0.003 0.018 0.297 0.004 0.372 0.003 0.377 0.040 0.017 0.031 0.004
(a)
(b)
(c) (d)
Figure 4. Surface plots over fine-grained parameter space of GB and LB. (a) shows donation rate (dr) for NE=1 (almost identical results are produced for NE=2 and NE=4). (b) shows
inter-ethnic donation (ie) for NE=2. (c) shows both selectors (sb) for NE=2. (d) shows inter-ethnic donation for N=4.
dr
GB
LB
0.0
0.2
0.4
0.6
0.8
1.0
0.0 0.2 0.4 0.6 0.8 1.0
0.1
0.2
0.30.4
0.5
0.6
0.7
0.8
0.0
0.2
0.4
0.6
0.8
1.0
ie
GB
LB
0.0
0.2
0.4
0.6
0.8
1.0
0.0 0.2 0.4 0.6 0.8 1.00.0
0.1
0.2
0.3
0.4
0.5
sb
GB
LB
0.0
0.2
0.4
0.6
0.8
1.0
0.0 0.2 0.4 0.6 0.8 1.00.0
0.2
0.4
0.6
0.8
1.0
ie
GB
LB
0.0
0.2
0.4
0.6
0.8
1.0
0.0 0.2 0.4 0.6 0.8 1.00.00.10.20.30.40.50.60.70.8
