cu system wide utilization report
TRANSCRIPT

Presentation TitleSubtitleCampus Classroom and
Instruction Laboratory
UtilizationFall 2019
Regent Finance Committee
August 28, 2019

1
University of Colorado / Fall 2019
Campus Classroom and Instructional Laboratory Utilization
Purpose and Context
Campus reporting on classroom and instructional laboratory utilization is a tool used to determine space
needs by the Board of Regents, the Department of Higher Education (CDHE), and the Office of State
Planning and Budgeting. The data are used to aid the university in strategic planning, cost effective
management of its facilities and in the development of master planning for each campus. Effective
building utilization is important to delivering high quality education programs. The facilities of the
University of Colorado’s four campuses encompass over 20 million gross square feet of building space.
Approximately 10.8 million square feet was at least partially funded with state General Funds. Within
these buildings the university serves more than 67,000 degree seeking students and an additional 8,000
taking courses for credit. Sponsored research space is not examined in this report. However, CU
researchers received more than $1.053 Billion in sponsored research funding in fiscal year 2018-19.i
Background The CDHE former guidelines for classroom and laboratory utilization were based upon
hours used per week and student occupancy. These guidelines have been rescinded. In recent facilities
master plan updates, the campuses have measured utilization against peer data or other national
averages. The Boulder, Colorado Springs, and Anschutz Medical Campuses are currently working on
master plan updates in the coming year. The Denver campus master plan update was approved by the
Board of Regents in 2017 and updated and approved by the Board of Regents in 2019.
Data limitations The Fall 2019 report provides an examination of classroom and instructional
laboratories hours of use and student occupancy (number of student seats filled). The background
material for this report is more detailed than previous reports as campuses have refined their individual
reporting capabilities. Fall 2016 data cannot be directly compared to Fall 2013, or Fall 2007 data due to
changes in methodology. Data from the Fall 2019 analysis are not directly comparable to those reported
in prior space analyses due to:
Changes in rooms included in analysis ̶ Current reporting includes rooms with at least one hour of scheduled instruction per week, rather than rooms with 20 or more hours of scheduled instruction per week.
A change in source data systems ̶ the current reporting uses the new student information system (ISIS) whereas prior reports may have relied on a student database that has since been retired (SIS).
Changes in methodology ̶ Earlier reporting used indicators based on DHE/CCHE classroom space utilization guidelines. DHE/CCHE has since repealed the utilization standard. All credit-bearing instruction is now included, whereas only state funded instruction was included previously.
2
Additionally, these data by themselves do not encompass the complete classroom and laboratory utilization of each campus. The Fall 2019 data have the following limitations:
Academic uses of these rooms other than scheduled classes are not captured here (e.g., research group meetings, conferences, mid-term exams, student presentations, and informal study sessions). In some rooms, particularly those scheduled directly by the schools and colleges, these other activities may account for most of total room usage. Additionally, non-credit instruction is not included.
Second, the data cannot be compared between CU campuses. Different data sets were included and reflect the respective campus scheduling policies.
Third, these data contain information on scheduled classroom and instructional laboratory use only. They do not include information on faculty offices, or research laboratories.
Campus Data Classroom and laboratory utilization data based upon hours used per week and student occupancy are provided. As with previous years’ data, it is important to know that room capacity and course capacity are often different. A course section restricted to 30 students for teaching reasons may be housed in a room with 50 seats because a smaller room was not available. Therefore the campuses have reported the maximum scheduled enrollment as percentage of seats and the actual enrollment as percentage of maximum scheduled enrollment.
The data submitted by each campus include a list of individual rooms, by type and utilization. Relevant information regarding campus course scheduling, operations, and limitations of campus data is also included. Each campus had distinct factors that impacted classroom and instructional laboratory usage during this time period. For example, the Denver campus shares space on the Auraria campus with two other institutions. Policies relating to room scheduling are unique to each campus mission and existing infrastructure.
i University of Colorado System, Essential Facts 2018-19: University of Colorado Office of the Vice President for Budget and Finance; Square footage data from the Office of the State Architect.

University of Colorado Boulder
REGENT FINANCE COMMITTEE
AUGUST 28, 20191

2
At A Glance
374 Occupied Buildings• 108 General Fund Buildings
• 48 Classroom/Admin
• 29 Research/Laboratory
• 31 Other
• 237 Auxiliary Buildings
• 176 Residential
• 27 Special/General Use
• 4 Research/Laboratory
• 30 Other
• 29 Research Property
Service/Leased/Other
• 12 Classroom/Admin
• 6 Residential
• 5 Research/Laboratory
• 6 Other
575 Scheduled Instructional
Spaces• 343 Classrooms
• 139 Classroom Laboratories
• 93 Other
*note: “other” includes library, museum, archive,
hospital, clinic, parking garage, special use, general
use and other types of facilities
Space Utilization: Classroom Data
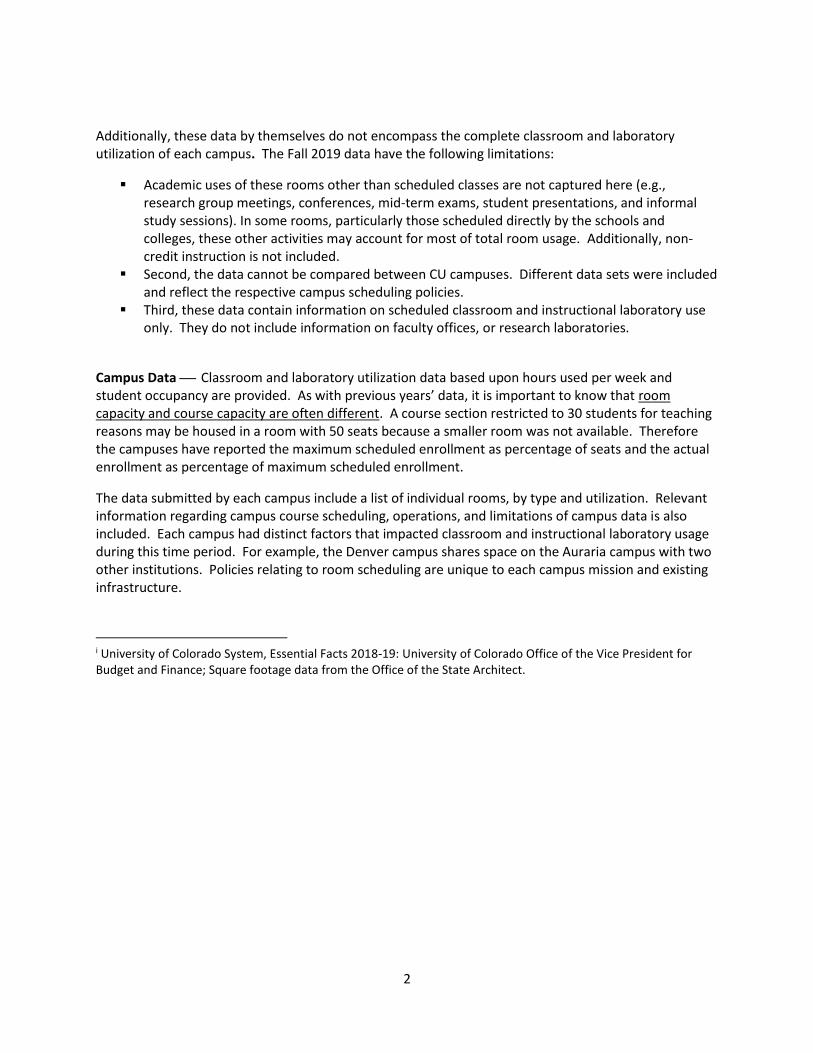
Fall 2018 Data:
545 rooms with instructional activity
38 rooms in auxiliary fund buildings
507 rooms in general fund buildings
• 183 rooms were centrally scheduled
• 324 rooms were scheduled by departments
Summary of Utilization by Room Group and Scheduling Control
Room Group Number Sections Credit
Hours
Seats/
100 SF
Scheduled
Hours/week
Percent
Occupancy
Classrooms 461 4,857 370,320 5.6 30 62%
Laboratories 84 782 12,380 3.3 24 67%
Grand Total 545 5,639 382,701 5.3 28 63%
3

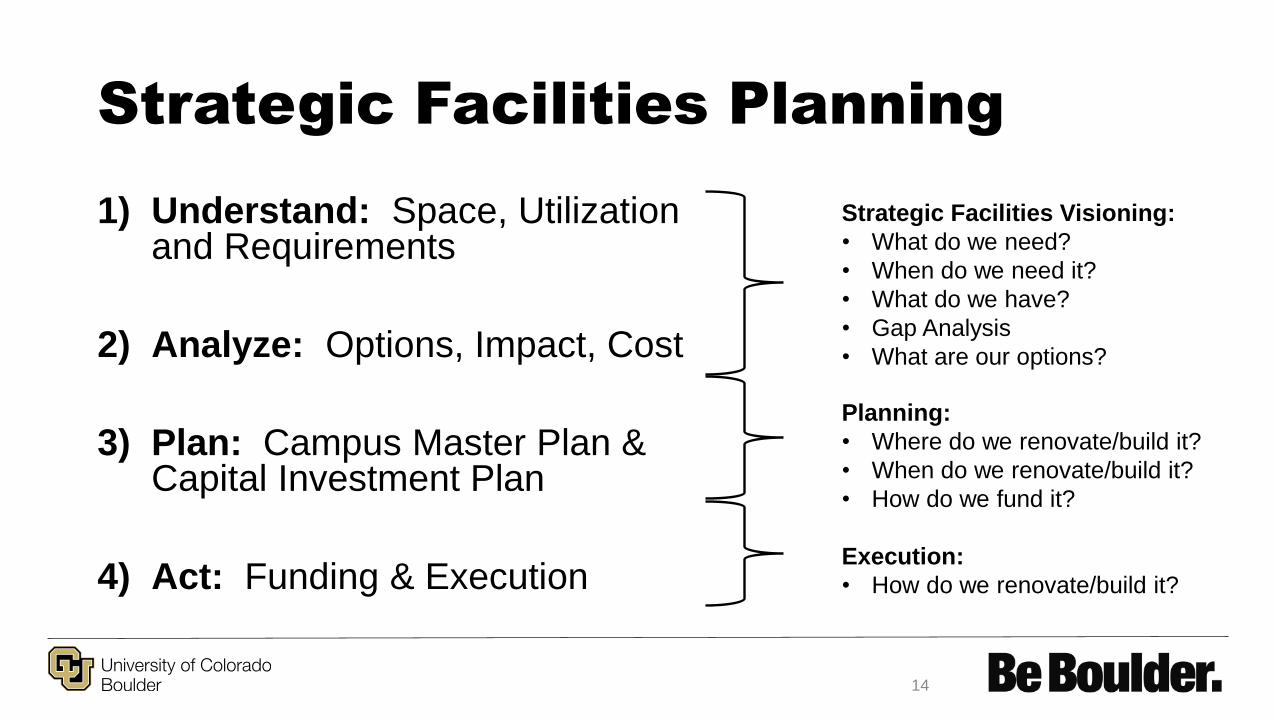
Strategic Facilities Planning
1) Understand: Space, Utilization and Requirements
2) Analyze: Options, Impact, Cost
3) Plan: Campus Master Plan & Capital Investment Plan
4) Act: Funding & Execution
Strategic Facilities Visioning:
• What do we need?
• When do we need it?
• What do we have?
• Gap Analysis
• What are our options?
Planning:
• Where do we renovate/build it?
• When do we renovate/build it?
• How do we fund it?
Execution:
• How do we renovate/build it?
4

Space OptimizationChanging the way we
use our space presentsopportunities to significantly
improve the student
experience.
Redirect ResourcesBy managing our space to
maximize utilization, we can create
efficiencies that allow us to save
money and direct more resources
toward areas of transformation for
the campus.
Campus PrioritiesRather than building new
facilities, resources can be applied
to fundamental campus priorities
that improve teaching, research,and learning.
Space Utilization Fundamental Principles
5
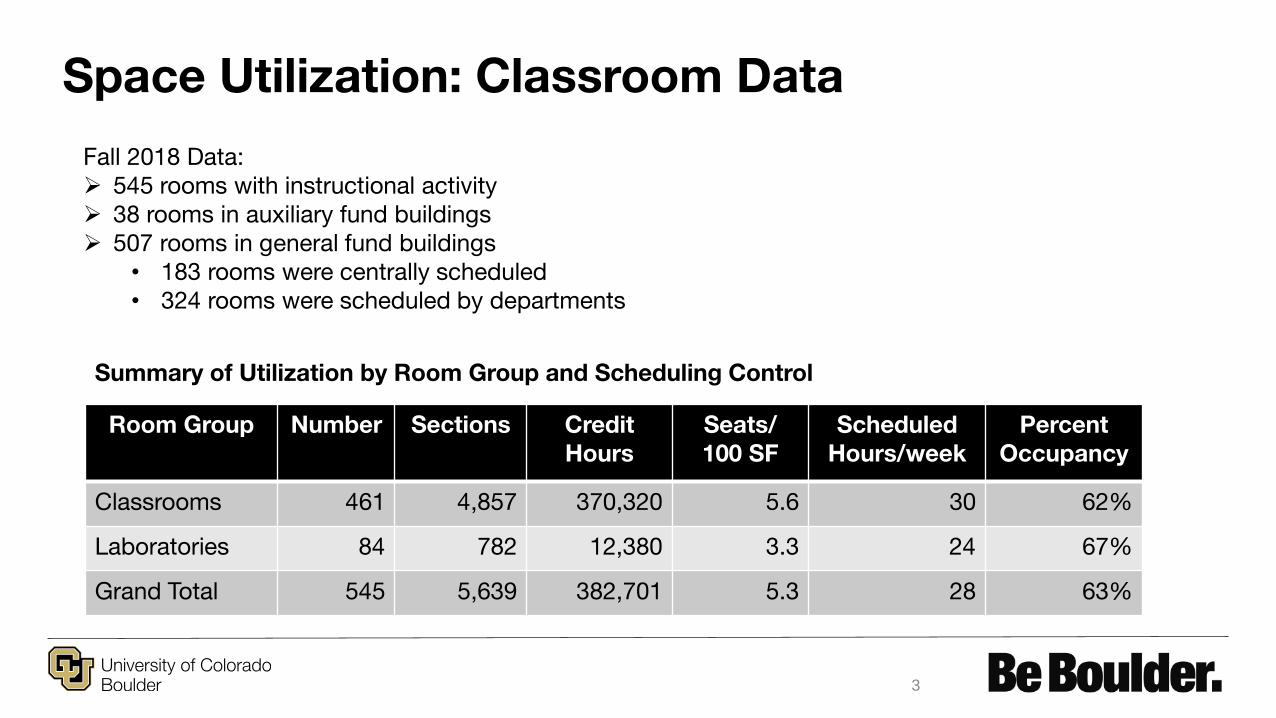
Space Allocation Guidelines
1) Qualitative guidance
6

Space Allocation Guidelines
2) Quantitative guideline
7
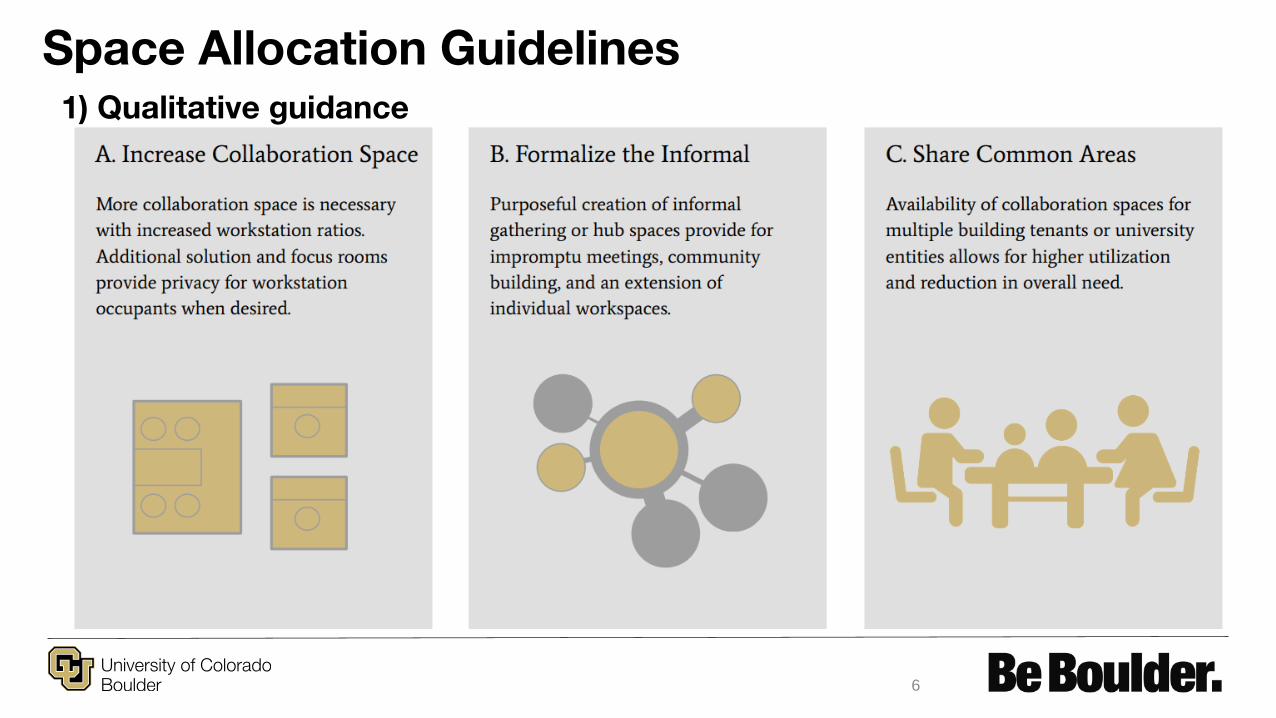
Space Allocation Guidelines
3) Graphical representations
8
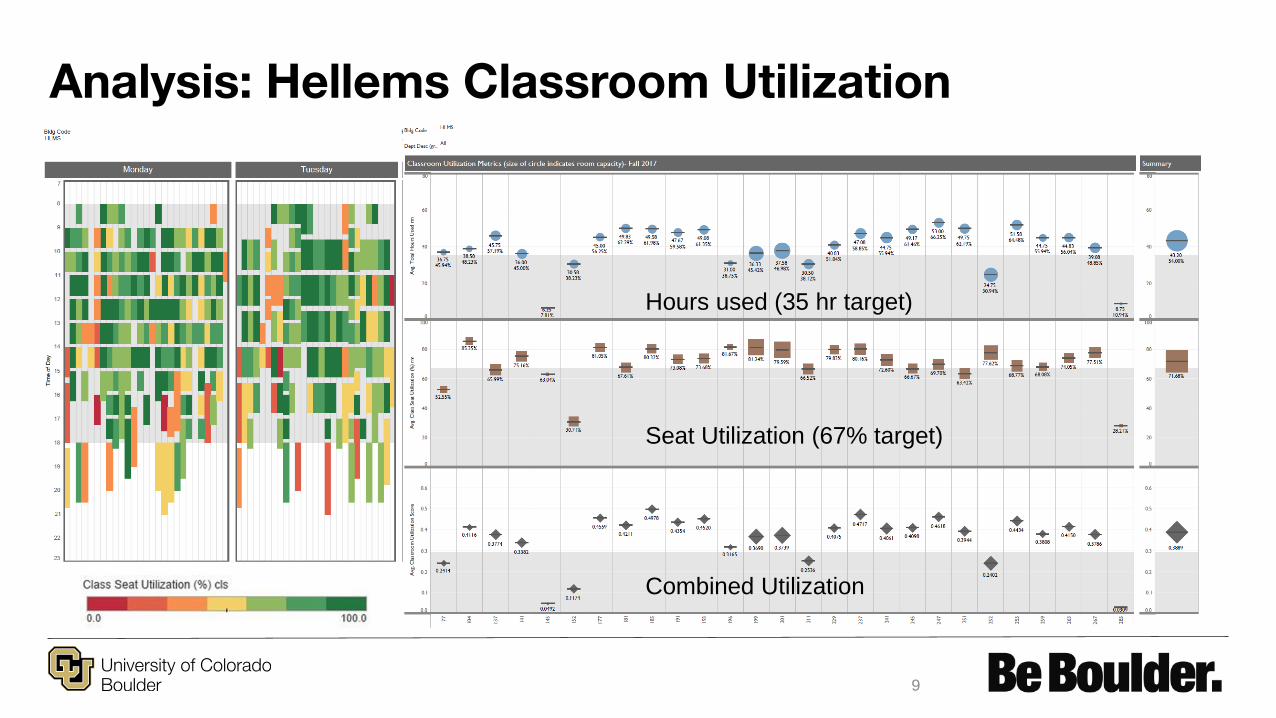
Analysis: Hellems Classroom Utilization
Seat Utilization (67% target)
Hours used (35 hr target)
Combined Utilization
9
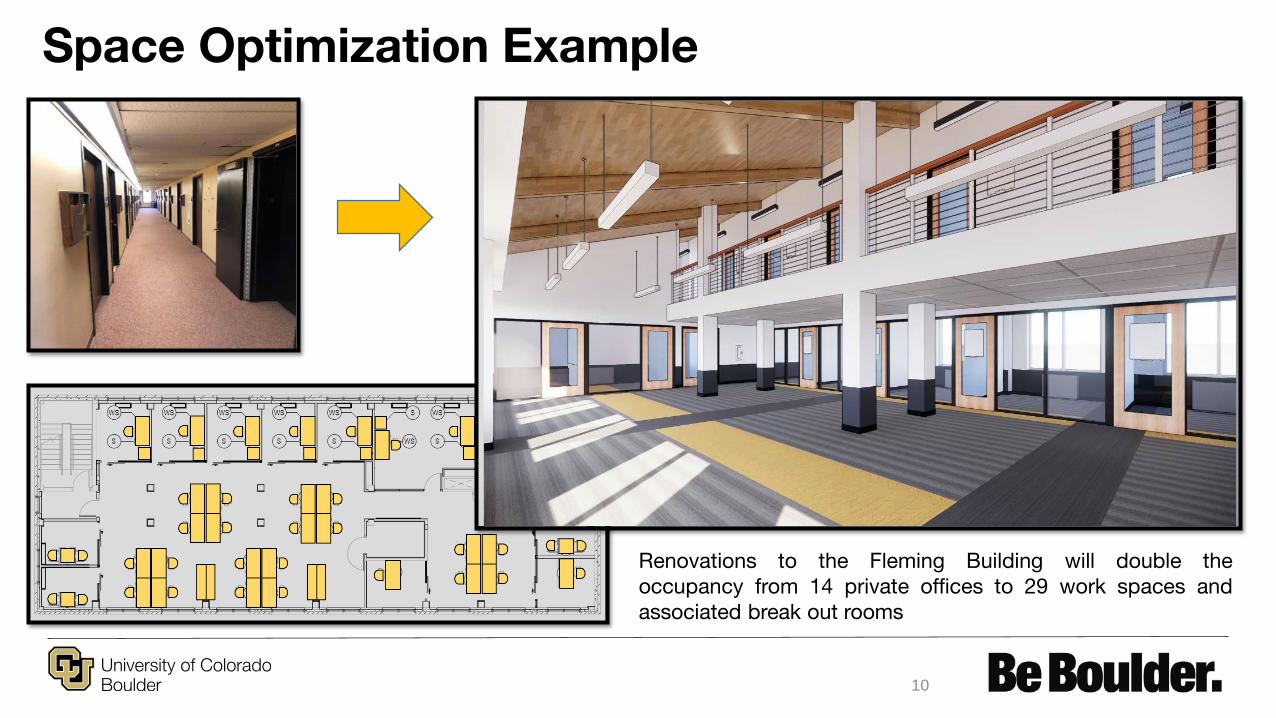
Space Optimization Example
Renovations to the Fleming Building will double the
occupancy from 14 private offices to 29 work spaces and
associated break out rooms
10

Design / Life Cycle Cost Example
Original
Building
Design
Optimized
Building
Design
(changed
layout)
11
12
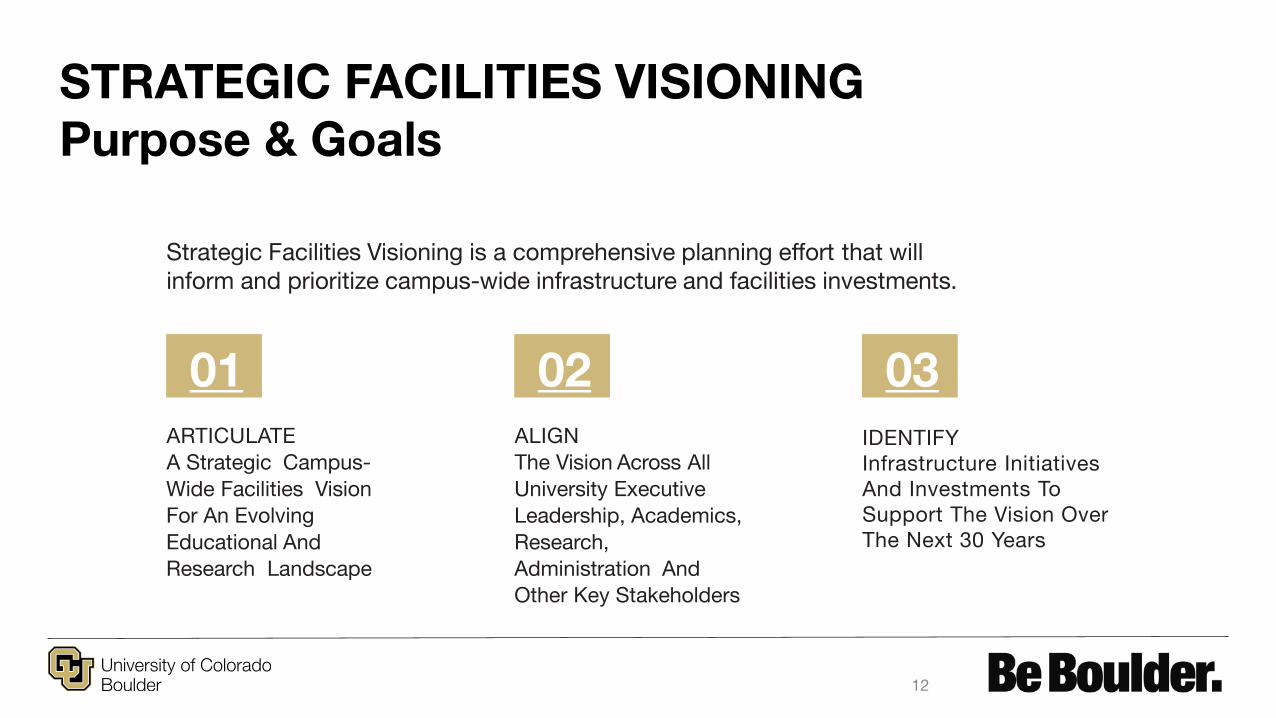
02
ALIGN
The Vision Across All
University Executive
Leadership, Academics,
Research,
Administration And
Other Key Stakeholders
03
IDENTIFY
Infrastructure Initiatives
And Investments To
Support The Vision Over
The Next 30 Years
01
ARTICULATE
A Strategic Campus-
Wide Facilities Vision
For An Evolving
Educational And
Research Landscape
Strategic Facilities Visioning is a comprehensive planning effort that will
inform and prioritize campus-wide infrastructure and facilities investments.
STRATEGIC FACILITIES VISIONING
Purpose & Goals

030201 04
PHASE DEEP DIVE PHASE SCENARIO PLANNING TOOL DEVELOPMENT TOOL IMPLEMENTATION
MISSION Understanding the goals and mission of the university and departments
Defining spaces that realize the future vision of CU Boulder
Creating the methodology and framework of an interactive tool
Producing a dynamic tool
PROCESS The Deep Dive phase consisted of three on site exploratory workshops with 120 representatives in 22 units to better understand the strategic direction of each department
Visionaries were divided into six multi-disciplinary teams that met over threeworkshops to address six key themesderived from the Deep Dive process
Work with CU Boulder experts to centralize data and create a digital framework which visualizes facility investment options based off recommendations from Scenario Planningteams
Apply the tool framework to a visual GIS database and refine calculations based on visionary feedback
WE ARE HERE!
STRATEGIC FACILITIES VISIONING
Process Overview
13
Strategic Facilities Planning
1) Understand: Space, Utilization and Requirements
2) Analyze: Options, Impact, Cost
3) Plan: Campus Master Plan & Capital Investment Plan
4) Act: Funding & Execution
Strategic Facilities Visioning:
• What do we need?
• When do we need it?
• What do we have?
• Gap Analysis
• What are our options?
Planning:
• Where do we renovate/build it?
• When do we renovate/build it?
• How do we fund it?
Execution:
• How do we renovate/build it?
14
1
2019 Board of Regents
Classroom Utilization Report
2019 Classroom
Utilization Report
CU Board of Regents
Finance Committee
University of Colorado
Anschutz Medical Campus
August 28th, 2019
2
2019 Board of Regents
Classroom Utilization Report
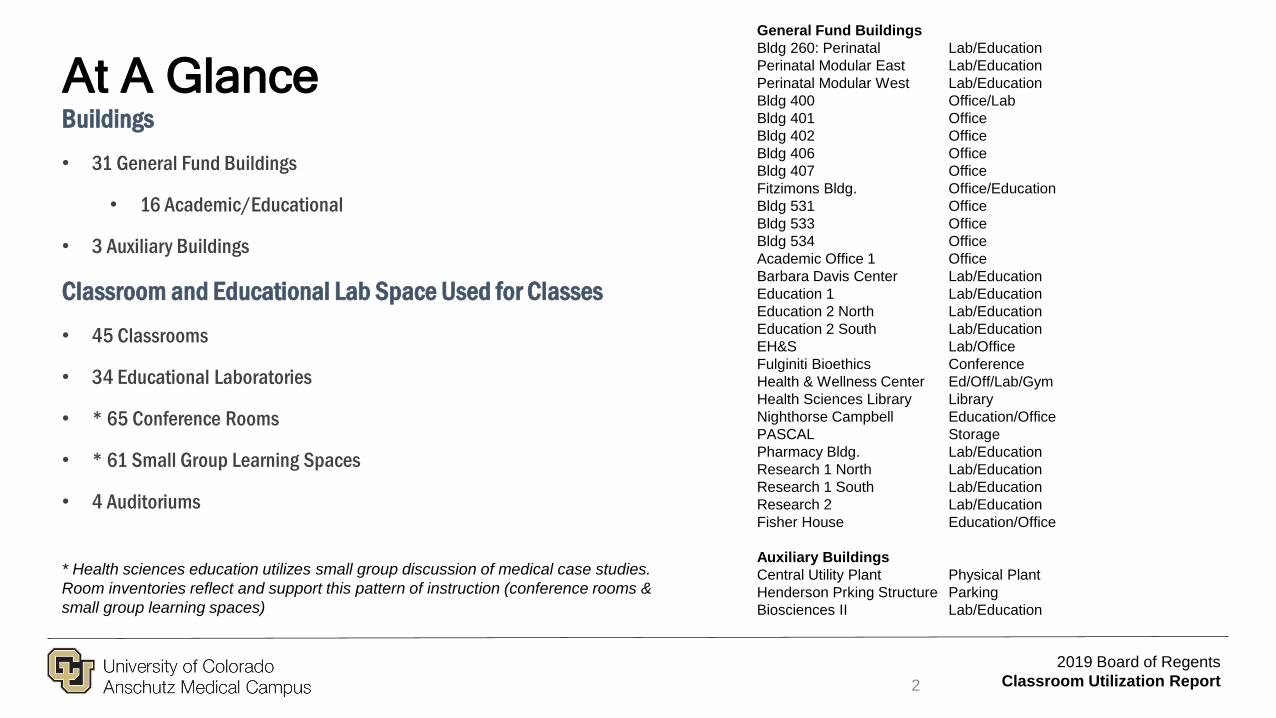
At A GlanceBuildings
• 31 General Fund Buildings
• 16 Academic/Educational
• 3 Auxiliary Buildings
Classroom and Educational Lab Space Used for Classes
• 45 Classrooms
• 34 Educational Laboratories
• * 65 Conference Rooms
• * 61 Small Group Learning Spaces
• 4 Auditoriums
* Health sciences education utilizes small group discussion of medical case studies.
Room inventories reflect and support this pattern of instruction (conference rooms &
small group learning spaces)
General Fund Buildings
Bldg 260: Perinatal Lab/Education
Perinatal Modular East Lab/Education
Perinatal Modular West Lab/Education
Bldg 400 Office/Lab
Bldg 401 Office
Bldg 402 Office
Bldg 406 Office
Bldg 407 Office
Fitzimons Bldg. Office/Education
Bldg 531 Office
Bldg 533 Office
Bldg 534 Office
Academic Office 1 Office
Barbara Davis Center Lab/Education
Education 1 Lab/Education
Education 2 North Lab/Education
Education 2 South Lab/Education
EH&S Lab/Office
Fulginiti Bioethics Conference
Health & Wellness Center Ed/Off/Lab/Gym
Health Sciences Library Library
Nighthorse Campbell Education/Office
PASCAL Storage
Pharmacy Bldg. Lab/Education
Research 1 North Lab/Education
Research 1 South Lab/Education
Research 2 Lab/Education
Fisher House Education/Office
Auxiliary Buildings
Central Utility Plant Physical Plant
Henderson Prking Structure Parking
Biosciences II Lab/Education

Space Utilization: Classroom DataFall 2018 Data:
211 rooms with instructional activity
7 rooms in auxiliary fund buildings
204 rooms in general fund buildings
• All rooms scheduled by departments
Summary of Utilization by Room Group and Scheduling Control *
Room Group Number Avg.
Seats
Seats/
100 SF
Scheduled
Hours/week
Scheduled
Hours/Term
Class
Hours/Term
Classrooms 45 60 4.3 41 19,256 14,232
Educational
Laboratories34 20 3.2 24 4,719 3,145
Other 132 10 4.3 25 29,360 7,713
Grand Total 211 16 4.0 27 53,334 25,090
3
2019 Board of Regents
Classroom Utilization Report
* Due to unique health sciences usage pattern and scheduling process, measures shown may vary from general education campuses.

4
2019 Board of Regents
Classroom Utilization Report
• Our 2012 Facilities Master Plan concluded there to be no
immediate need to add shared general-use classroom space.
• Our 2022 Facilities Master Plan will investigate ways in which
new pedagogies may be implemented
Master Planning Strategy

5
2019 Board of Regents
Classroom Utilization Report
General SummaryGraduate Level Health Sciences Education
is Unique
• Growth in class size is capped by accreditation
organization
• First year curriculum offers opportunities for large
classes prior to area specialization
• Student often transition in and out of large and
small spaces as part of the same class period
• Instruction includes off-site clinical rotations
• Overall use of teaching spaces on campus are
three times that of formal classwork (i.e. grand
rounds, seminars, thesis presentations, etc.)
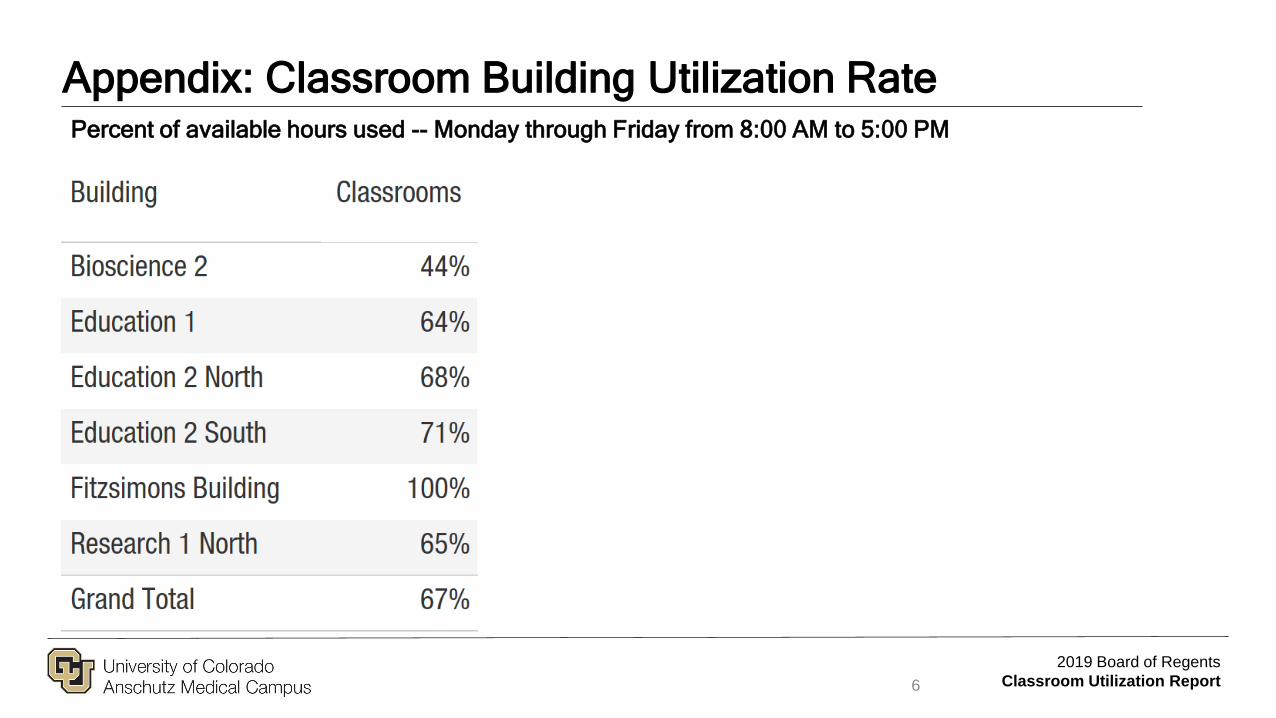
Appendix: Classroom Building Utilization RatePercent of available hours used -- Monday through Friday from 8:00 AM to 5:00 PM
6
2019 Board of Regents
Classroom Utilization Report

1
2019 Board of Regents
Classroom Utilization Report
University of
Colorado Denver
CU Board of Regents
Finance Committee
August 28th, 2019
2
2019 Board of Regents
Classroom Utilization Report
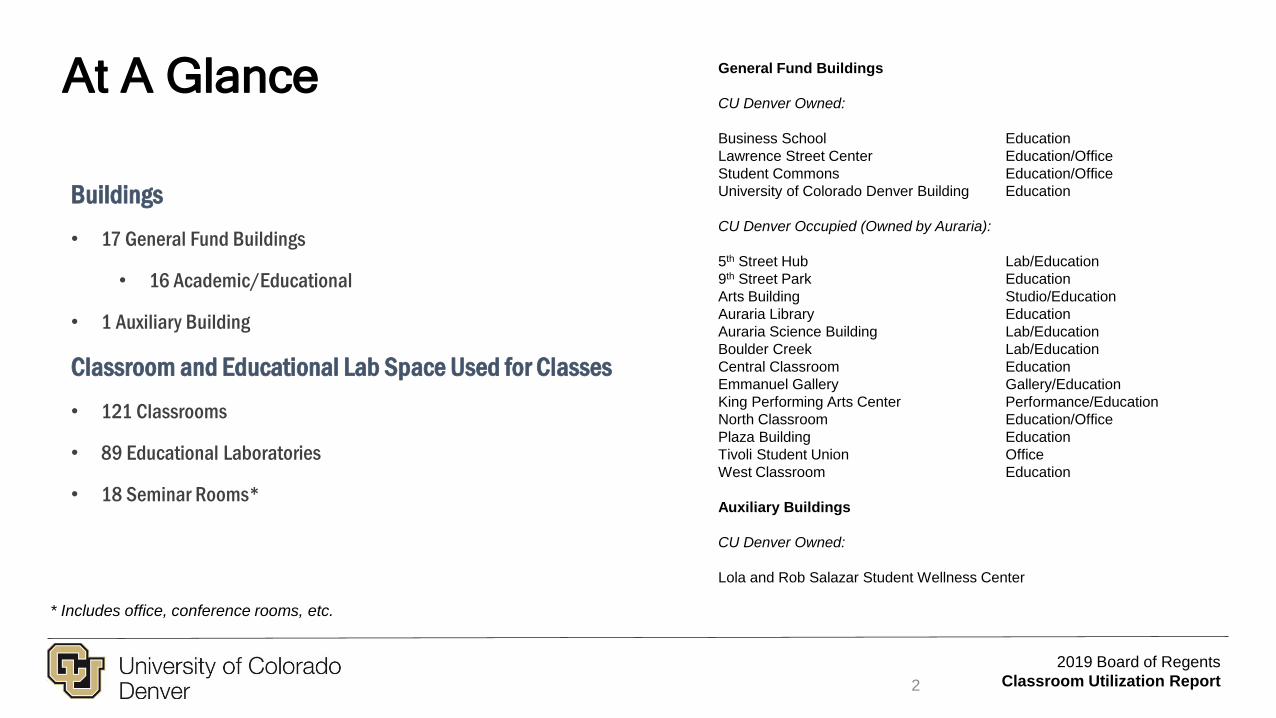
At A Glance
Buildings
• 17 General Fund Buildings
• 16 Academic/Educational
• 1 Auxiliary Building
Classroom and Educational Lab Space Used for Classes
• 121 Classrooms
• 89 Educational Laboratories
• 18 Seminar Rooms*
* Includes office, conference rooms, etc.
General Fund Buildings
CU Denver Owned:
Business School Education
Lawrence Street Center Education/Office
Student Commons Education/Office
University of Colorado Denver Building Education
CU Denver Occupied (Owned by Auraria):
5th Street Hub Lab/Education
9th Street Park Education
Arts Building Studio/Education
Auraria Library Education
Auraria Science Building Lab/Education
Boulder Creek Lab/Education
Central Classroom Education
Emmanuel Gallery Gallery/Education
King Performing Arts Center Performance/Education
North Classroom Education/Office
Plaza Building Education
Tivoli Student Union Office
West Classroom Education
Auxiliary Buildings
CU Denver Owned:
Lola and Rob Salazar Student Wellness Center
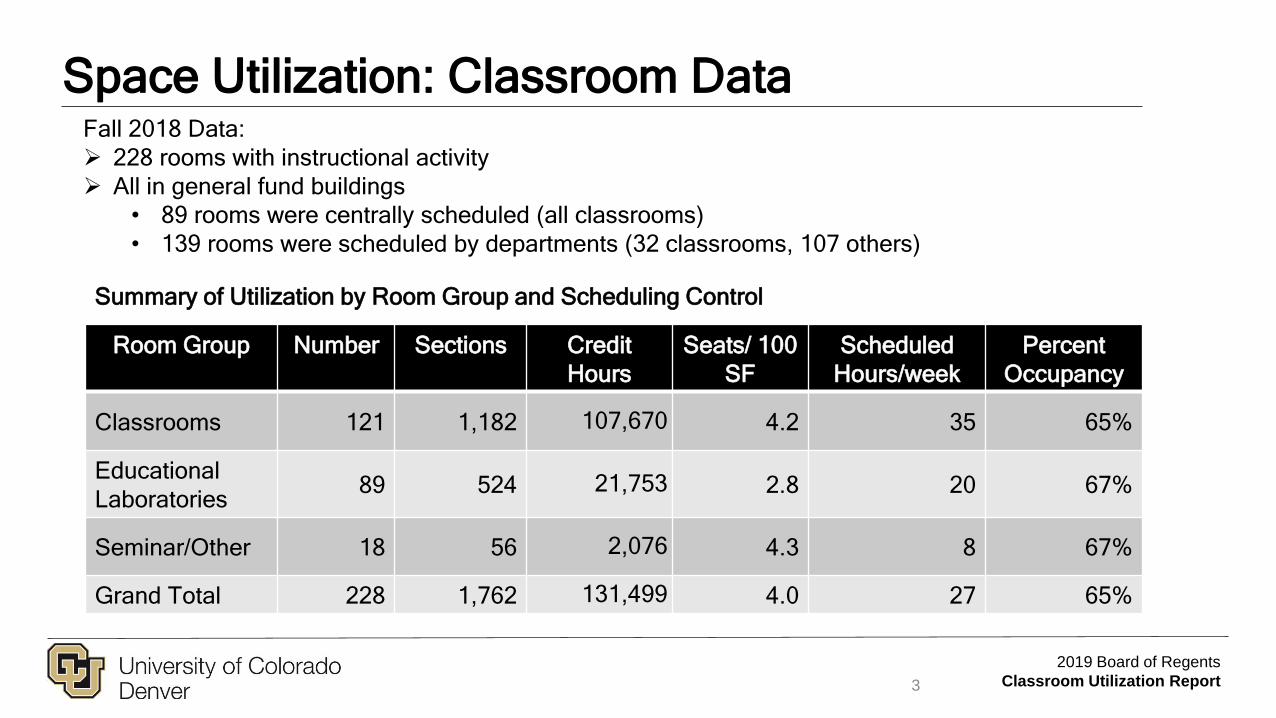
Space Utilization: Classroom DataFall 2018 Data:
228 rooms with instructional activity
All in general fund buildings
• 89 rooms were centrally scheduled (all classrooms)
• 139 rooms were scheduled by departments (32 classrooms, 107 others)
Summary of Utilization by Room Group and Scheduling Control
Room Group Number Sections Credit
Hours
Seats/ 100
SF
Scheduled
Hours/week
Percent
Occupancy
Classrooms 121 1,182 107,670 4.2 35 65%
Educational
Laboratories89 524 21,753 2.8 20 67%
Seminar/Other 18 56 2,076 4.3 8 67%
Grand Total 228 1,762 131,499 4.0 27 65%
3
2019 Board of Regents
Classroom Utilization Report
4
2019 Board of Regents
Classroom Utilization Report
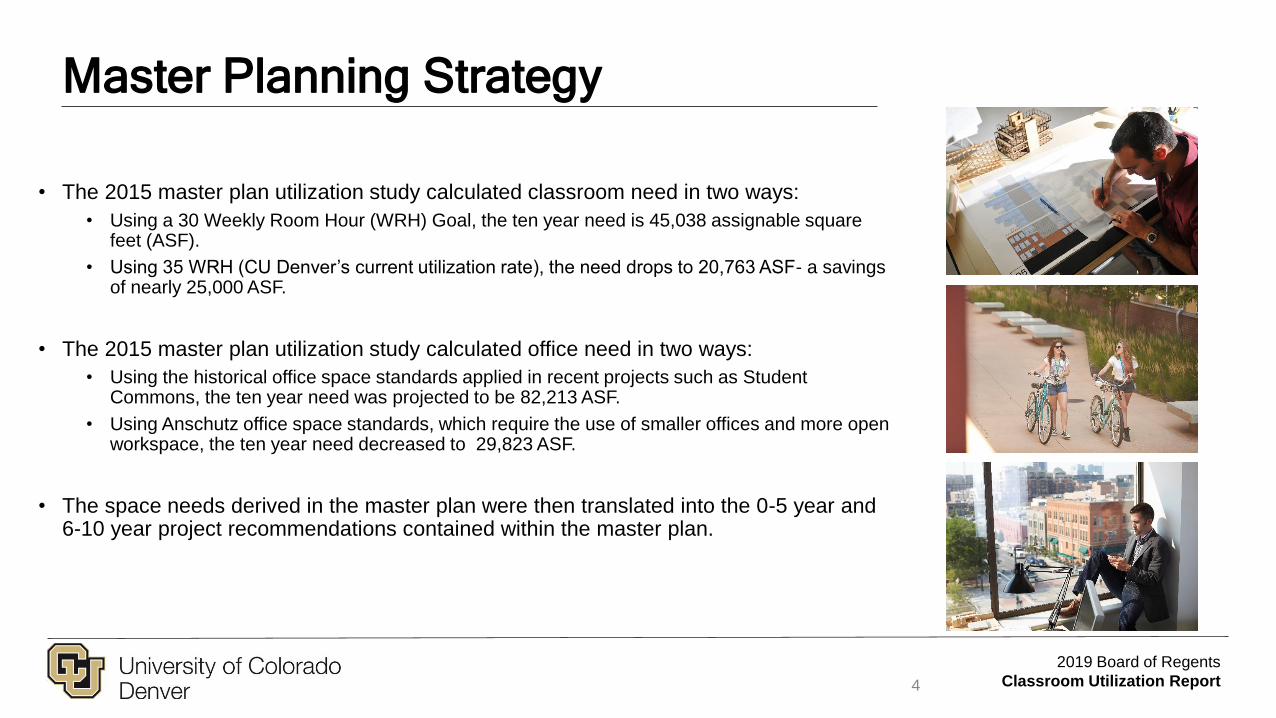
Master Planning Strategy
• The 2015 master plan utilization study calculated classroom need in two ways:
• Using a 30 Weekly Room Hour (WRH) Goal, the ten year need is 45,038 assignable square feet (ASF).
• Using 35 WRH (CU Denver’s current utilization rate), the need drops to 20,763 ASF- a savings of nearly 25,000 ASF.
• The 2015 master plan utilization study calculated office need in two ways:
• Using the historical office space standards applied in recent projects such as Student Commons, the ten year need was projected to be 82,213 ASF.
• Using Anschutz office space standards, which require the use of smaller offices and more open workspace, the ten year need decreased to 29,823 ASF.
• The space needs derived in the master plan were then translated into the 0-5 year and 6-10 year project recommendations contained within the master plan.

5
2019 Board of Regents
Classroom Utilization Report
General Summary
• Seat utilization has increased from 2016 to 2018, from 56% to 65%. Weekly room hours have stayed more or less the same, showing a slight decrease from 36 to 35.
• The ASF per student station also rose from 2016 to 2018 from 20 to 24. This reflects CU Denver’s goal to design classrooms that allow for more flexibility and active learning pedagogies.
• CU Denver continues to seek opportunities to improve Friday classroom activity. Adding on-campus housing may allow for more Monday-Wednesday-Friday class cohorts.
• CU Denver is studying the different classroom scheduling models (general assignment, general assignment priority and proprietary) to see which is the most efficient.
• CU Denver will be creating official campus space guidelines and a space policy in FY 19-20
• Quality of instructional/research space and the geographic misalignment of school and college instructional/research spaces are still a concern
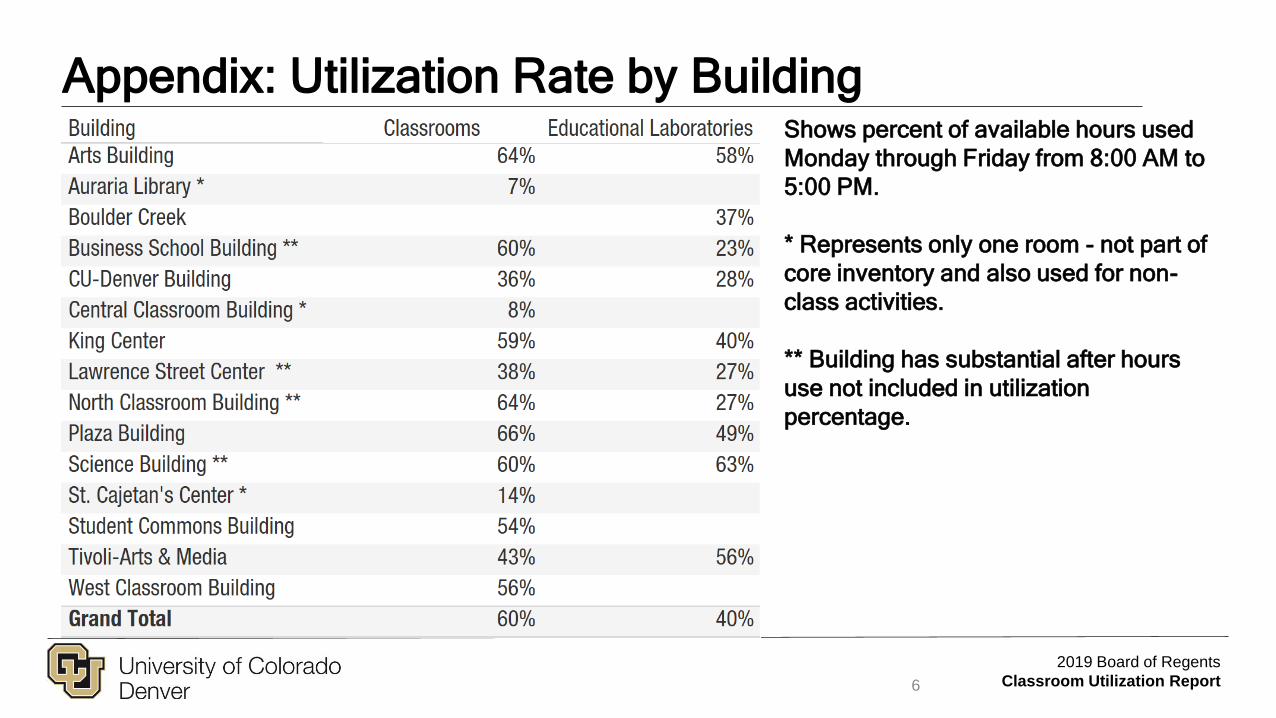
Appendix: Utilization Rate by Building
6
2019 Board of Regents
Classroom Utilization Report
Shows percent of available hours used
Monday through Friday from 8:00 AM to
5:00 PM.
* Represents only one room - not part of
core inventory and also used for non-
class activities.
** Building has substantial after hours
use not included in utilization
percentage.
1
2019 Board of Regents
Classroom Utilization Report
University of Colorado
Colorado Springs
CU Board of Regents
Finance Committee
August 28th, 2019

2
2019 Board of Regents
Classroom Utilization Report
At A Glance
Buildings
• 9 General Fund Buildings
• 4 Auxiliary Building
Classroom and Educational Lab Space Used for Classes
• 75 Classrooms
• 37 Educational Laboratories
• 22 Other*
* Includes studio and seminar rooms
General Fund Buildings
Centennial Education
Columbine Education
Dwire Education
EAS Education
Osborne Center Education
University Hall Education
Lane Education
Fine Arts Education
Academic Office Building Education/Office
Auxiliary Buildings
Breckenridge Residence Hall
Cucharas Residence Hall
Ent Center Education/Performance
EL Pomar Center Recreation Center
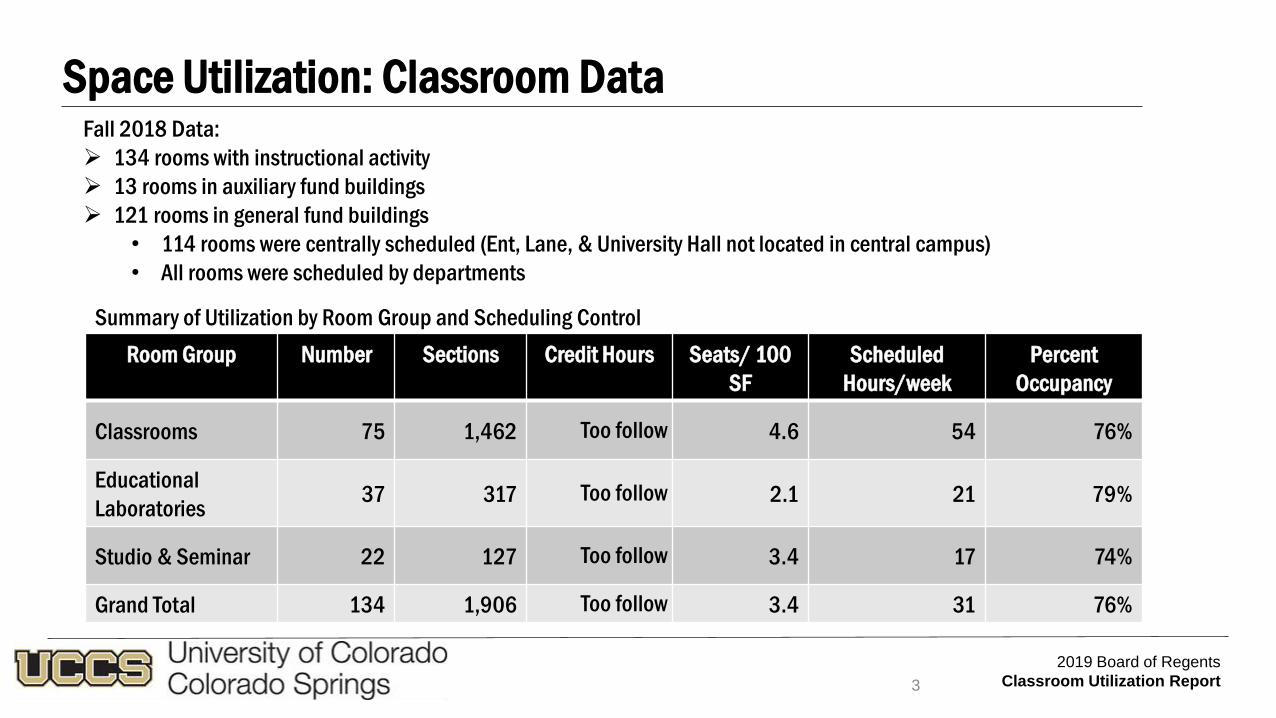
Space Utilization: Classroom DataFall 2018 Data:
134 rooms with instructional activity
13 rooms in auxiliary fund buildings
121 rooms in general fund buildings
• 114 rooms were centrally scheduled (Ent, Lane, & University Hall not located in central campus)
• All rooms were scheduled by departments
Summary of Utilization by Room Group and Scheduling Control
Room Group Number Sections Credit Hours Seats/ 100
SF
Scheduled
Hours/week
Percent
Occupancy
Classrooms 75 1,462 Too follow 4.6 54 76%
Educational
Laboratories37 317 Too follow 2.1 21 79%
Studio & Seminar 22 127 Too follow 3.4 17 74%
Grand Total 134 1,906 Too follow 3.4 31 76%
3
2019 Board of Regents
Classroom Utilization Report

4
2019 Board of Regents
Classroom Utilization Report
Master Planning Strategy
• Improve Utilization Through Better Space Management
• Confirm size, occupancy, available seating & “ownership” of classrooms & labs across campus
• Analyze existing space against current and future space needs, considering recent advances in technology and changing pedagogy
• Update 2012 Master Plan to incorporate knowledge gained in prior 2 steps to ensure conformance with the 7 strategic themes, and to maximize the use of existing funds
5
2019 Board of Regents
Classroom Utilization Report
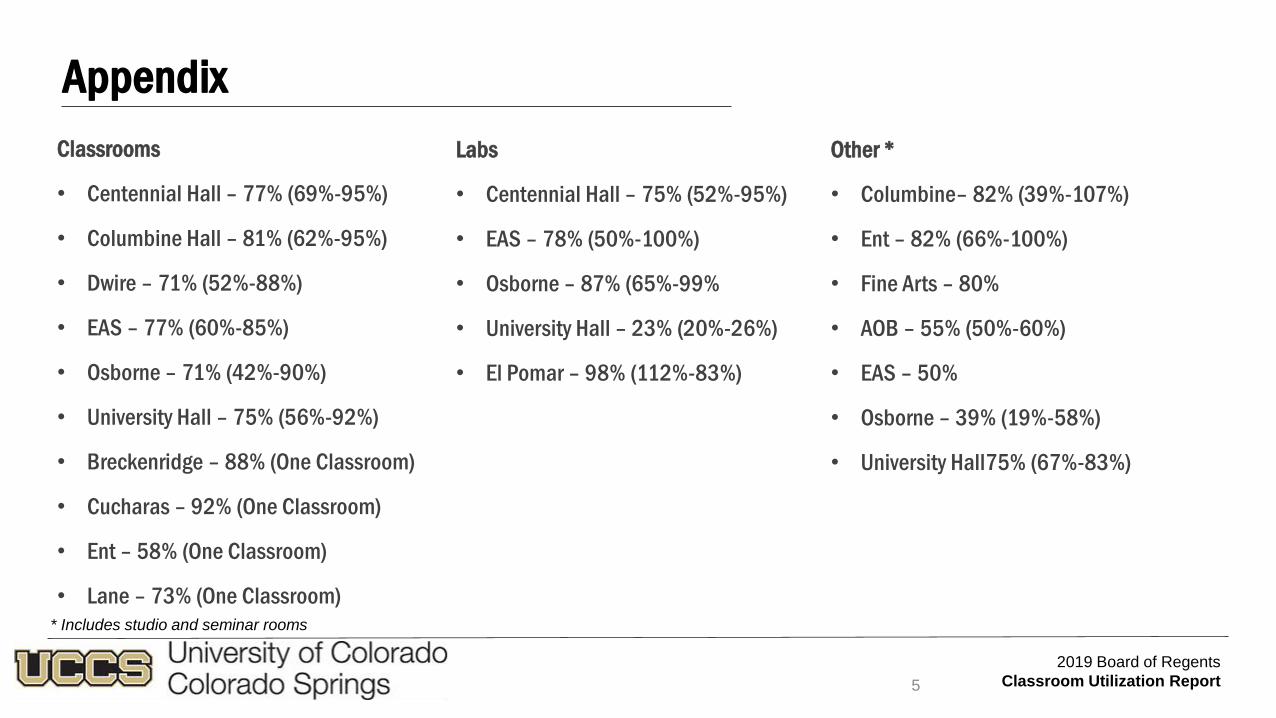
Appendix
Classrooms
• Centennial Hall – 77% (69%-95%)
• Columbine Hall – 81% (62%-95%)
• Dwire – 71% (52%-88%)
• EAS – 77% (60%-85%)
• Osborne – 71% (42%-90%)
• University Hall – 75% (56%-92%)
• Breckenridge – 88% (One Classroom)
• Cucharas – 92% (One Classroom)
• Ent – 58% (One Classroom)
• Lane – 73% (One Classroom)
Labs
• Centennial Hall – 75% (52%-95%)
• EAS – 78% (50%-100%)
• Osborne – 87% (65%-99%
• University Hall – 23% (20%-26%)
• El Pomar – 98% (112%-83%)
Other *
• Columbine– 82% (39%-107%)
• Ent – 82% (66%-100%)
• Fine Arts – 80%
• AOB – 55% (50%-60%)
• EAS – 50%
• Osborne – 39% (19%-58%)
• University Hall75% (67%-83%)
* Includes studio and seminar rooms