csi flight experiment projects of the naval … · csi flight experiment projects of the naval...
TRANSCRIPT

CSI FLIGHT EXPERIMENT PROJECTS OF THE NAVAL RESEARCH LABORATORY
Shalom Fisher
Naval Research Laboratory
Washington, D. C.
ABSTRACT
The Naval Research Laboratory (NRL) is involved in an active program of CSI flight experiments.
The first CSI flight experiment of the Naval Research Laboratory, the Low Power Atmospheric
Compensation Experiment (LACE) dynamics experiment, has successfully measured vibrations of an
orbiting satellite with a ground-based laser radar. The observations, made on January 7, 8 and 10, 1991,
represent the first ever measurements of this type. In the tests, a narrowband heterodyne CO2 laser radar,
operating at a wavelength of 10.6 microns, detected vibration induced differential-Doppler signatures of
the LACE satellite. Power spectral densities of forced oscillations and modal frequencies and damping
rates of free-damped vibrations were obtained and compared with finite element structural models of the
LACE system. Another manifested flight experiment is the Advanced Controls Technology Experiment
(ACTEX) designed to demonstrate active and passive damping with piezo-electric (PZT) sensors and
actuators. This experiment was developed under the management of the Air Force Phillips Laboratory
with integration of the experiment at NRL. It is to ride as a secondary, or "piggyback," experiment on a
future Navy satellite.
https://ntrs.nasa.gov/search.jsp?R=19930009755 2018-06-21T22:26:02+00:00Z

LACESATELLITE:DESIGNAND FLIGHTHARDWAREOFDYNAMICSEXPERIMENT
Thefirst of the CSI flight experiments of the Naval Research Laboratory (NRL) is the Low Power
Atmospheric Compensation Experiment (LACE) dynamics experiment. The experiment was a low-cost
"piggyback" opportunity, secondary to the primary LACE mission. Its design was initiated at meetings
held at NRL in May and June of 1988. Costs were kept low, and rapid integration of the experiment into
the satellite design was made possible because the LACE satellite was built and launched by NRL, i.e.,
design and integration of the experiment took place at the same facility. The LACE satellite was launched
on February 14, 1990 into a 540 km altitude circular orbit of 430 inclination. The structural configuration
of the LACE spacecraft is illustrated in Figure 1. Three deployable/retractable booms of maximum length
45.72 m (150 ft) are mounted on a rectangular pamUelepiped bus of mass 1,200 kg. The zenith directed
gravity gradient boom has a magnetic damper at its tip; the forward or retro-boom is deployed along the
velocity vector; the balance boom is mounted and deployed counter to the velocity. The tip end of the
retro-boom carries a reflector plate on which an array of glass corner cubes is mounted. The glass comer
cubes are intended to reflect visible light for the primary LACE mission. Attitude stabilization to within
about 10 libration amplitude is accomplished by the gravity gradient torques and by a constant speed
momentum wheel. Constant rate boom deployment/retraction maneuvers are remotely controlled through
a ground based telemetry link.
The dynamics experiment flight hardware consists of three germanium comer reflectors, as shown
in Figure 1. One of the reflectors is included in the array of comer cubes mounted on the end of the retro-
reflector boom; one is on the bottom of the bus, and the third one is on the end of the balance boom. The
germanium has an index of refraction of 4.0 for light of wavelengths between 1.8 microns and 15
microns. With this very high index of refraction, light striking the reflector surface at angles of 200 or
greater will be reflected. Therefore, a ground-based light source will see a return signal even for the
satellite at a low elevation angle.
LACE Spacecralt
•Balance booth
- 45 72 m (150 ll)- Deployable/r err aclable
lip In,q._ -e" "_ I i.
". iS.! _g 135_)_;;1__
" So.rigor mrny _;tll)syslem J
- ('_effll,"llliUlU corner cube
el| eallll poi;}lilEj free
+Z • Gravity gradienl boom
j_ - 45.72 m (150 It)/. - Oeploynble/relraclablep/- 90.7 kg (200 Ib) lip mass
: : wilh magrmlic damper
• Relro-¢eflector boom
- 45.72 m (150 II)
- Oeptoyable/relr aclable
-.. • Leadillg retro-refleclor"+y - 15 9 kg (35 ro) llp mass
- Germanium corner cube
FIGURE 1" Design of the LACE satellite showing placement of germanium comer reflectors.764

LASERTARGETINGFOR THE LACE DYNAMICSEXPERIMENT
Thelaserilluminationsaremadewith theMIT Lincoln Laboratory'sFirepondlaserradarlocatedin
Westford,MA asshownin Figure2. TheFirepondradarusedfor theilluminationsis a narrowband,CO2
laserradaroperatingat 10.6microns.Theapertureof thelasertelescopeis 1.2192m (48 in), givinga
nominaldiffraction limitedfootprintof about5 m atarangeof 550km (minimumtargetrange).A 0.6096
m (24 in) telescope,boresightedwith theCO2telescope,cantrackin visible light either passively by
reflected sunlight or actively with a 25 watt, 514.5 nm Argon-ion laser. Acquisition and tracking are
assisted by the Millstone L-band radar located nearby. The Millstone radar also supplies target frequency
information for range-rate (Doppler) acquisition. Observations are made with the sun 100 to 300 below
the horizon, either before sunrise or after sunset. In this "terminator mode," the site is in darkness but the
satellite is still in sunlight. The CO2 illuminations are limited by NORAD to windows unique to each
pass, and by a safety requirement that the elevation angle must be 300 or more.
With the Firepond apparatus, vibration measurements were made on January 7, 8 and 10, 1991
(denoted hereafter in this report as days 91007, 91008 and 91010). The targeting of LACE was
accomplished with active tracking by means of the Argon-ion laser targeted on the retroreflector array of
glass comer cubes at the tip of the lead boom.
Before and during the targeting, vibrations of the LACE satellite structure were excited by retraction
of the lead boom from 24.38 m (80 ft) to 4.572 m (15 ft). The reflector on the lead boom tip and the
reflector on the bus were simultaneously illuminated, after the boom length decreased to 9.144 m (30 ft),
to provide differential Doppler measurements of the relative motion between the end of the boom and the
spacecraft body. Simultaneous observations could only be made for a boom length of 9.144 m (30 ft) or
less because of the narrow width of the laser beam. The relative motion includes boom vibration as well
as the rigid-body satellite motion and the boom retraction motion.
Dynamics Experimen!• Eslimale salellile vibration modes
from doppler resolved laser radar measuremenfs
IVelocily ,.- I
..... _--/_-----_'_*_-_.- R_fer ence LACE orbit
_.- - 525 km allilude _ --._ - Circular
___-- _,ion 43 °
FIGURE 2: On-orbit targeting of LACE with the Firepond narrowband laser radar. 765

OBJECqlVESOFTHE DYNAMICSEXPERIMENT
With thedynamicsexperiment,theprimarydesigngoalwasto performon-orbitsystemidentification,i.e.to measuremodalfrequenciesanddampingratiosof thesatellitestructureasstatedin
Figure3. Thelargesizeof theLACEstructureprecludedgroundtestsof thedynamicsof thedeployed
structureor testsof boomdeploymentdynamicsprior to launch.Thedampingratios, measuredby the
experiment,provideausefulassessmentof theamountof vibrationdampingintrinsic to thetypeof
deployable/retractabletrussstructuresusedinLACE. Suchstructuresareusedin anumberof space
applications,i.e.,theVoyagermagnetometerboomsandin theGalileospacecraft.Theon-orbitsystem
identificationprovidesa mechanismto validatefiniteelementstructuralmodelsof thesatellitesystem;to
refineandimprovethem,andto measurethelevelof vibrationinducedbyboomdeployments/retractions.
Unique opportunity to measure effects of disturbances onspacecraft flexure; give boom vibration knowledge duringLACE spacecraft operations.
Goal is to perform on-orbit system identification:vibration frequencies, damping and amplitude ratios.
• Assess flexible structural modelling accuracies:
deployment/retraction vibrationsfinite element models (FEM) NASTRANdynamics simulation models: DISCOS, treetopsdeployment dynamics: DART
• Facilitate control of jitter and rapid slews in future spacecraft.
FIGURE 3.
766

KEY POINTS OF THE DYNAMICS EXPERIMENT
Figure 4 states the significant events of the dynamics experiment. The LACE satellite was launched
on February 14, 1990. As previously mentioned, observations of vibrations of the LACE satellite were
made on January 7, 8 and 10, 1991 (denoted in this report as days 91007, 91008 and 91010). In the
observations, the Firepond narrowband laser radar telescope, boresighted with the visible light radar,
observed differential Doppler reflections from the germanium comer reflectors on the lead boom and
body of the spacecraft after the boom length reached 9.144 m (30 ft) or less. The laser Doppler
measurement window of day 91007 observed about 38 seconds of forced dynamics motion of the lead
boom while the boom was being retracted. The window of day 91008 contained about 68 seconds of
retraction data and 25 seconds of free-decay data after retraction was stopped. Day 91010 data contained
about 45 seconds of useful free-decay data after retraction was stopped.
• LACE spacecraft launched February 14, 1990altitude at launch 540 km, circular, 430 inclination
• LACE satellite built and launched by Naval Research Lab.
• Dynamics experiment is a low-cost "piggyback" experiment.
• Germanium corner cubes (3) serve as targets for Firepondlaser radar of MIT Lincoln Laboratory, Westford, Mass.
• Corner cubes installed on LACE on December 22, 1989.
• Laser Doppler data collected on January 7, 8 and 10, 1991.
• Observed forced vibration and free-damped oscillations.
FIGURE 4:
767

COMPENSATION FOR RIGID BODY MOTION AND BOOM RETRACTION
In addition to the vibrational motion, the Doppler data includes the rigid body motion of the
spacecraft as well as the boom retraction speed of about .076 m/sec (.25 ft/sec). Since the spacecraft is
gravity-gradient stabilized it rotates once per orbit in inertia space at a uniform rate. However, from the
ground, its aspect angle changes at a variable rate with time; the rate appears to be a maximum when the
spacecraft is at its maximum elevation angle, as illustrated in Figure 5. These aspect angle changes and
aspect angle rate changes have several effects on the observed Doppler shifted laser return:
1. The rigid body motion and boom retraction speed will bias the vibration motion. It will be shown
that the boom retraction speed is several times larger than the vibration speed.
2. The frequency separation between the apparent rigid body motion and the lowest vibrational
mode of 0.019 Hz is small. Therefore the observability of this mode is affected.
3. The observed damping factors of the detected modes will be biased by an amount that depends
upon the position of the satellite in the sky. The calculated damping factors will be smaller for
observations with the satellite ascending to its maximum elevation angle, than for observations with the
satellite descending.
The effects of this apparent motion are treated by calculating the apparent rigid body motion during
the observation period using the spacecraft orbital rate, range, the boom lengths and boom retraction rate.
The bias produced by the rigid body motion is subtracted from the observed motion. The change in
observed damping with aspect angle is corrected by dividing the damping factor by the cosine of the angle
between the LOS vector and the pitch plane.
Figure 5 appears on the following page.
768

ROTATION OF EARTH-POINTING SATELLITEAS OBSERVED BY A GROUND STATION
at top o! pass ]
_ i= J'o)oRe / h _.
/(LOS) vector
o\/_- ---...
_\\\\ I
\_0
\
orbital rotation rate\\\\
Re
\\\\\ /\ /,,I /
//
//
//
//
//
//
FIGURE 5: Rotation of LACE as observed from a ground site.
769

OBSERVED STRUCTURAL VIBRATIONS
Figure 6 shows observed data from day 91008. The figure shows forced vibration data to about 67
seconds, followed by about 28 seconds of free-decay vibration data, on which is superimposed a
simulation of the rigid-body motion and boom retraction rate. The simulation comes fairly close to the
median of the observed vibration data: orbital uncertainties and uncertainties in the boom retraction rate
could account for the slight discrepancy between the real and computed central body motion. It can be
seen that the amplitude of the forced vibration is about 20 mm/sec. The boom retraction rate is about 75
mm/sec. Figure 7 shows a power spectral density plot obtained by Hamming weighting the data of the
entire temporal window and computing the power spectrum. The nominal resolution of the resultant
spectrum is 0.01 Hz. The result indicates the presence of multiple vibration frequencies. Values of
observed vibration frequencies are listed as follows: 0.12 Hz, 0.28 Hz, 0.51 Hz, 1.03 Hz, 1.25 Hz, 1.29
Hz, 1.31 Hz, 1.41 Hz, 1.45 Hz, 1.55 Hz, and 2.46 Hz. The accuracy of these measurements has not
been determined due to the limited number of observations.
The time-frequency analysis of the forced oscillation data from day 91008 is presented in Figure 8.
Represented in this way, the data clearly indicate that modes in the 0.28 Hz regime and in the higher 1.25
Hz - 2.46 Hz regime increase in frequency as the boom retracts. The figure also indicates the relative
stability of the 1.03 Hz frequency, a frequency close to the driving frequency of the boom deployment
mechanism.
Vibration observations: day 91008 compared with simulated rigid body rates
120 I
100
L_
o3
80Er-
_ 60
F-
4O
20
0
I • Observed boom lid vll_ratlon#• Simulated rlald body rate
20 40 60 80
Observation time in seconds
O0
770
FIGURE 6: Observed vibration of LACE on day 91008.
Figures 7 and 8 appear on the following pages.

POWER SPECTRAL DENSITY, DAY 91008
25 I i 1 I I
20 -
n-"LU
OD_
_JLLIrr
15--
10--
0.0 0.5 3.01.0 1.5 2.0 2.5
FREQUENCY (Hz)
FIGURE 7: Power spectral density plot of vibrations observed during boom retraction.
771

POWER SPECTRAL DENSITY VSBOOM LENGTH DURING RETRACTION
2.0I i I J I I I I
0.5
0.01.0 .94 .88 .82 .76 .70 .64 .58 .52 .46
Retro Boom Length x 10 meters
FIGURE 8: Forced oscillation frequencies versus boom length during retraction.
772

COMPARISON BETWEEN FEM MODES AND OBSERVED MODES
The eigensystem realization algorithm 1 (ERA) was used to calculate values of the observed modal
frequencies and damping factors. Table 1 shows a comparison between the ERA derived modes (order =
8) and modes computed with a finite element (FEM) structural model. The finite element model used was
a "stick" model in which the booms were modelled as simple beams rather than as trusses. Table 1 also
shows the boom tip modal displacements obtained from the FEM model. The displacements are
normalized so that the maximum displacment is 1.0. The observable modes are those with substantial
modal displacement, Az, perpendicular to the boom axis and coplanar with the line-of-sight vector and a
vector along the boom axis. The lowest ERA derived mode of .019 Hz does agree quite well with the
lowest FEM calculated mode. However, the day 91010 observation period was about 45 seconds, i.e., it
was close to the 53 second period of that mode. Therefore, the agreement in frequency between the
observed and calculated mode may be coincidental. The other observed modal frequencies of 0.124 Hz,
0.335 Hz and 0.547 Hz agree within 10% of the modal frequencies for the more highly observable
modes. Another interesting feature of the comparison is the presence of the FEM mode at 0.646 Hz,
which should have been observed, but was not. The close spacing between the FEM mode of 0.577 Hz
and the mode at 0.646 Hz might have produced a nonlinear modal coupling that resulted in a combination
mode at a frequency different from either, at 0.547 Hz. A more detailed modelling scheme with the
booms modelled as full trusses might produce a closer agreement with the observations.
TABLE 1: Comparison of ERA-identified modal frequences with FEM modes.
Comparison of observed with modes computedfrom FE modelling (stick model)
El = 1.55 * 104 N - m2 GJ = 5.74 * 102 N - m2
Obs freq FEM freq tip modal displacementsA__g_z A_.._x
*@o@I® Ms @o@i® I_s o@1@ =_
®ol]I]£ _£ °@@2 [email protected] Hz 0.125 Hz .09 .004
-0.335 Hz 0.316 Hz .10 .006
.0.547 Hz 0.577 Hz .1 4 .1 24
•Denotes modes observed.* Not positively identified
773
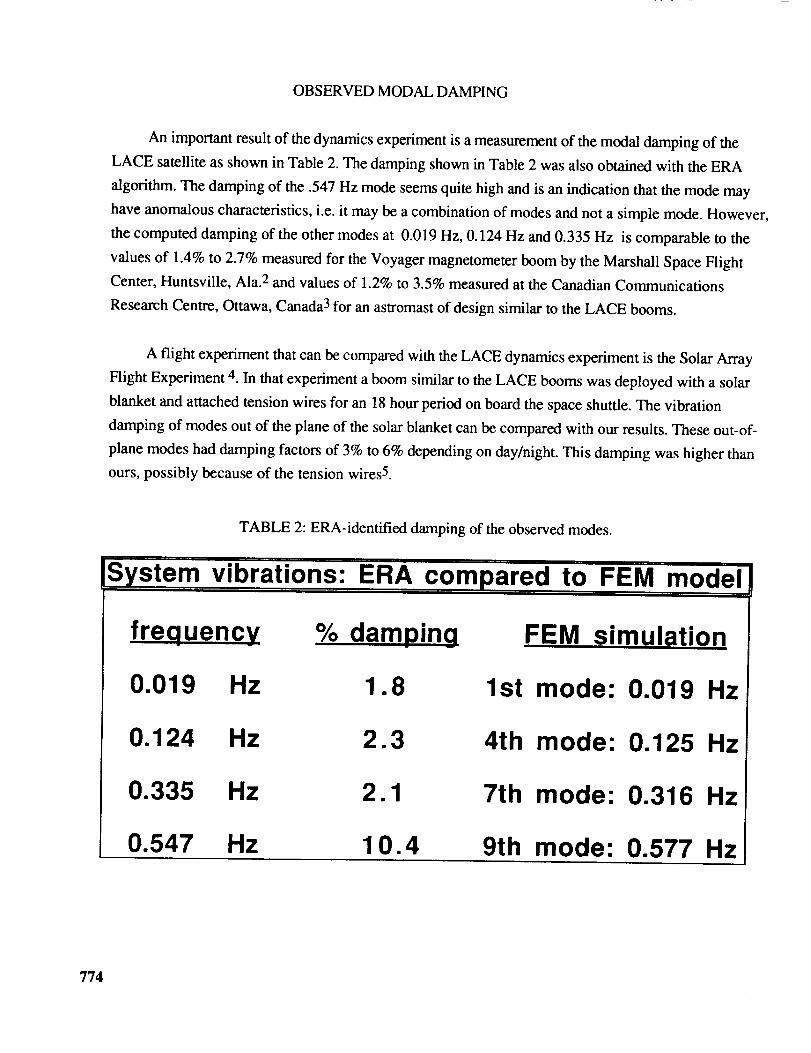
OBSERVED MODAL DAMPING
An important result of the dynamics experiment is a measurement of the modal damping of the
LACE satellite as shown in Table 2. The damping shown in Table 2 was also obtained with the ERA
algorithm. The damping of the .547 Hz mode seems quite high and is an indication that the mode may
have anomalous characteristics, i.e. it may be a combination of modes and not a simple mode. However,
the computed damping of the other modes at 0.019 Hz, 0.124 Hz and 0.335 Hz is comparable to the
values of 1.4% to 2.7% measured for the Voyager magnetometer boom by the Marshall Space Flight
Center, Huntsville, Ala. 2 and values of 1.2% to 3.5% measured at the Canadian Communications
Research Centre, Ottawa, Canada 3 for an astromast of design similar to the LACE booms.
A flight experiment that can be compared with the LACE dynamics experiment is the Solar Array
Flight Experiment 4. In that experiment a boom similar to the LACE booms was deployed with a solar
blanket and attached tension wires for an 18 hour period on board the space shuttle. The vibration
damping of modes out of the plane of the solar blanket can be compared with our results. These out-of-
plane modes had damping factors of 3% to 6% depending on day/night. This damping was higher than
ours, possibly because of the tension wires 5.
TABLE 2: ERA-identified damping of the observed modes.
frequency % dampinq FEM simulation
0.019 Hz 1.8 1st mode: 0.019 Hz
0.124 Hz 2.3 4th mode: 0.125 Hz
0.335 Hz 2.1 7th mode: 0.316 Hz
0.547 Hz 10.4 9th mode: 0.577 Hz
774

CONCLUSIONS FROM LACE DYNAMICS EXPERIMENT
The dynamics experiment performed on the low power atmospheric compensation experiment
satellite has established the feasibility of ground-based laser measurements of vibrations, slews and
deployments in orbiting satellites. The technique can be applied to health monitoring of large structures
such as the space station. The experiment has demonstrated that velocity resolutions of 1.8 mm/sec are
attainable with the current narrowband Firepond apparatus of the MIT Lincoln Laboratory.
775

ADVANCED CONTROLS TECHNOLOGY EXPERIMENT (ACTEX)
The ACTEX experiment, illustrated in Figure 9, is a secondary payload, manifested to fly on a
future Navy spacecraft. The experiment is being built at the present time and will be exposed to space on
the outside of the flight deck. Of course the electronics, comprised of a computer and solid state data
recorder, are below deck for shielding and thermal control. The experiment includes three graphite-epoxy
struts with embedded piezo-electric (PZT) sensors and actuators. Two of the struts are wrapped with
mylar thermal insulation blankets, while the other strut is painted. One of the stuts has an extra set of PZT
actuators to excite vibrations of the system.Thermistors are placed on the struts for temperature
measurements. Both the top plate and mounting bracket contain three-axis accelerometers, with a heater
on the top plate. The tripod is about 0.6 m (24 in) in length and weighs about 8.2 kg (18 lbs).
The experiment is intended to demonstrate that the technology of embedded PZT's is mature enough
to be used on space based payloads. It is also intended to demonstrate the application of PZT's for
passive and active vibration control in a large space structure. Different control algorithms, based on
changing gains, filter cutoffs or sensor averages, can be telemetered to the experiment computer. The
dynamic change mechanism (DCM) is attached to one of the struts. It contains a nitinol wire with attached
electrodes. Passing a current through the wire pulls the strut snugly against the top plate, thereby
increasing the strut stiffness. The purpose is to test the capability of modifying the control laws to damp
out vibrations in the presence of on-orbit structural changes. An additional goal of the experiment is to
evaluate the effect of radiation, thermal cycling and atomic oxygen erosion on the experiment performance
over a three year lifetime.
Figure 9 appears on the following page.
776

MOUNTING BRACKET
STRUT ENDFITTING
ACCELEROMETER BLOCK
ACCELEROMETER
)R
THERMAL STANDOFF
THERMOSTAT
HEATER
OUTER
/-- COMPOSITE
ACTUATION --_& SENSOR
IMPLANT
FIGURE 9: Design of the ACTEX experiment.
DCM
INNERCOMPOSITEWRAP
777

REFERENCES
1. Juang, J.N. and Pappa, R.S.,"An Eigensystem Realization Algorithm (ERA) for Modal Parameter
Identification and Model Reduction," Journal of Guidance, Control and Dynamics, Vol 8,
No. 5, 1985, pp. 620-627.
2. Johnson, G. D., "Modal Tests of the Voyager Magnetometer Boom," Marshall Space Flight Center,
Huntsville, Ala., Reference Letter ET 53 (83-98), 2H Waites, Oct. 24, 1983.
3. Soucym Y, and Vigneron, F. "Modelling and Identification of the Structural Properties of an
Astromast," Communications Research Center, CRC Report No. 1374, Ottawa, Can., November, 1983.
4. Lockheed Missiles and Space Co.,"Solar Array Flight Experiment Final Report," Marshall Space
Flight Center, Huntsville, Ala., Contract NASA-31352, Report No. LMSC-F087173, April 1986.
5. Young, L.E. and Pack, H.C. Jr. "Solar Array Flight Experiment/Dynamic Augmentation Experiment,"
NASA Technical Paper 2690, Marshall Space Flight Center, Huntsville, Ala., 1987.
778


REPORT DOCUMENTATION PAGE fo,_App .... dOMB No 0/04-0188
Public repoeting burden for this collection of in(ormaUon is estimated tc average [ hour per response _ncluding the time for reviewing _nstructions searching existing data sourcesgathering and maintaining the data needed and completJng and reviewing the collection of infcrmalion Send ccrrments regarding this burden estin'ate or any other aspect of thiscollection of inforn'ation including _uggesticns for reducing this burden to Washington Headquarters Services Directorate for Information Operations and Reports ]2]5 JeffersonDavis Highway Suite 1204 Arlington VA 22202 4302 and tc the Oi: ce of N]anagement and Budget Paperwork Reduction Project (0"/04 0[88) Washington D(_ 20r_03
1. AGENCY USE ONLY(Leave blanA) 2. REPORT DATE
February 19934. TITLE AND SUBTITLE
Fifth NASA/DoD Controls-Structures InteractionConference
6. AUTHOR(S)
Jerry R. Newsom, Compiler
7. PERFORMING ORGANIZATION NAME(S) AND ADDRESS(ES)
NASA Langley Research CenterHampton, VA 23681-0001
9. SPONSORING/MONITORING AGENCY NAME(S) AND ADDRESS(ES)
National Aeronautics and Space AdministrationWashington, DC 20546-0001Dcpartmcnt of DefenseWashington, DC 20301
11. SUPPLEMENTARY NOTES
3. REPORT TYPE AND DATES COVERED
Conference Publication
5. FUNDING NUMBERS
Technology590-14-41-01
8. PERFORMING ORGANIZATION
REPORT NUMBER
_17174
10. SPONSORING/MONITORING
AGENCY REPORT NUMBER
NASA CP-3177, Part 2
12a. DISTRIBUTION/AVAILABILITY STATEMENT 112b. DISTRIBUTION CODE
Unclassified-Unlimited
Subject Category 18
13. ABSTRACT (Max;morn 200 wo.'ds)
This publication is a compilation of the papers presented at the Fifth NASA/DoD Controls-StructuresInteraction (CSI) Technology Conference held in Lake Tahoe, Nevada, March 3-5, 1992. The conference,which was jointly sponsored by the NASA Office of Aeronautics and Space Technology and the Departmentof Defense, was organized by the NASA Langley Research Center. The purpose of this conference was toreport to industry, academia, and government agencies on the current status of controls-structures interactiontechnology. The agenda covercd ground testing, integrated design, analysis, flight experiments and concepts.
14. SUBJECT TERMS
Controls-structures interaction; Large space systems; Flexible structures
17. SECURITY CLASSIFICATION
OF REPORT
Unclassified
_ISN 1540- 0l- 280- 5500
18. SECURITY CLASSIFICATIOI_
OF THIS PAGE
Unclassified
15. NUMBER OF PAGES
365
16. PRICE CODE
AI_19. SECURITY CLASSIFICATIOI_ 20. LIMITATION
OF ABSTRACT Of ABSTRACT
iStandard Form 298(RED. 2-89)Prescribed by ANSI Std. Z39-18298 102
NASA langley 1903