csi forum 2009 improving safety in the industry: csi progress and priorities antony henshaw cemex /...
TRANSCRIPT

CSI Forum 2009
Improving safety in the industry: CSI progress and priorities
Antony Henshaw CEMEX / CSI

2
Background: Health and Safety• 1 of 6 key areas identified in Agenda for Action • CSI member commitments (2002):
– develop standard, joint systems to measure, monitor and report
– establish information exchange to share experiences and understand accident root cause
– improve existing systems, procedures and training for tracking, following up and preventing accidents
– report performance publicly in common format

3
Work to date‘Guidelines for Measuring and Reporting’
‘Examples of Good Practice’

4
Key Performance Indicators KPI’s (Cement only) Year 2003 Year 2004 Year 2005 Year 2006 Year 2007 Year 2008
CSI Members reporting 11 14 16 18 17 18
Total directly employed 130,752 138,940 148,684 172,133 188,834 190,747
Manhours, directly employed 246m 269m 286m 372m 402m 390m
LTIs, directly employed 1,651 1,585 1,699 1,381 1,301 1,038
LTI FR, directly employed 6.71 5.88 5.95 3.71 3.23 2.66
Number of Lost Days (calendar), directly employed
No data No data 69,074 67,035 59,949 70,566
LTI SR (calendar), directly employed
No data No data 242 180 149 181
Number of LTIs, indirectly employed (contractors)
652 739 835 1,199 1,285 1,122
Number of Fatalities, directly employed
28 27 22 25 33 26
Fatality Rate (per 10,000 directly employed)
2.14 1.94 1.48 1.45 1.75 1.36
Number of Fatalities, indirectly employed (contractors)
32 54 41 58 87 91
Number of Fatalities, third parties 21 11 12 6 11 16
Total number of Fatalities 81 92 75 89 131 133

5
Good progress in LTIs reduction
0
1
2
3
4
5
6
7
8
2003 2004 2005 2006 2007
Freq
uenc
y R
atio
0
50
100
150
200
250
300
2003 2004 2005 2006 2007
Sev
erity
Rat
io C
alen
dar
No D
ata
No D
ata
Data here: cement-only LTI data for all activities
shows similar positive downward trend
6
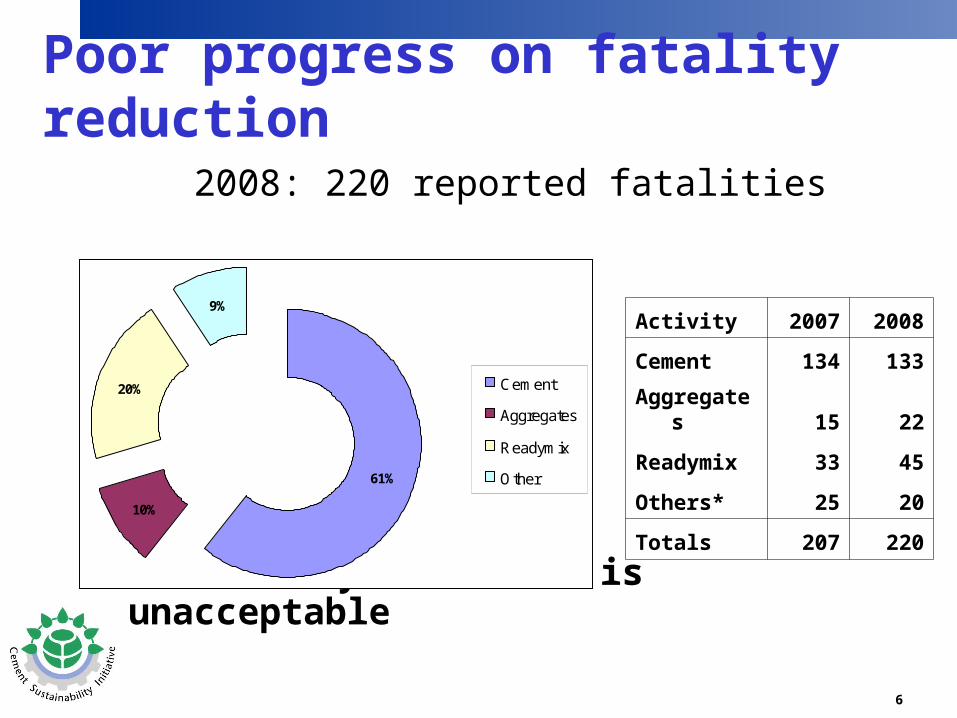
Poor progress on fatality reduction
2008: 220 reported fatalities
CSI fatality incidence is unacceptable
61%
10%
20%
9%
Cement
Aggregates
Readymix
Other
Activity 2007 2008
Cement 134 133
Aggregates 15 22
Readymix 33 45
Others* 25 20
Totals 207 220

7
Fatality rates: cement-only 2008: 133 cement-only fatalities (16 employee, 102 contractor, 15 third party)
Similar total to 2007
Reduction in employee fatalities offset by increase in contractor fatalities
3
0
20
40
60
80
100
120
140
2003 2004 2005 2006 2007 2008
# Fa
talit
ies
0
2
4
6
8
10
12
14
16
18
20
# Co
mpa
nies
Third PartyContractorEmployee# Companies Reporting

8
Peer comparison
3
Employee Fatality Rates
0
0.5
1
1.5
2
OGP Chem CSI
Fata
lity
Rate
Contractor Fatality Rates
0
2
4
6
8
10
12
14
16
OGP CSI
Fata
lity
Rate
(CSI contractor rate is estimated)
• Cement industry performance very poor compared to the Chemical and Oil & Gas industries
• Despite good practice sharing and ongoing safety commitments fatality rates are rising
• Likely to increase as CSI members expand into developing regions and construct new plants
11
Peer comparison: fatality prevention
Fatality Prevention Review (2009):
31 companies consultedFocused on fatality prevention statistics and
approaches to ascertain:– Best-performing companies– How they achieve success in fatality elimination– What the CSI can learn

12
Fatality rates“Class A” “Class B” “Class C” “Class D” “Class E”
Employee Fatality Rate of < or = 0.1
Employee Fatality Rate of 0.11 to 0.25
Employee Fatality Rate of 0.26 to 0.5
Employee Fatality Rate of 0.51 to 1.0
Employee Fatality Rate of 1.01 to1.5
Akzo NobelCATContinentalExelonFortumGEITTMondiPirelliUTC
ABBAEPBPDowShellUmicore
AlcoaDSMENIEvonik-DegussaPetro-CanadaRio TintoWeyerhaeuser
AlstomGoodyearHoeghStora EnsoTNT Express
Anglo-AmericanBHP BillitonEON
OGP CSI
If CSI moved to “Class A” it could save up to 200 lives a year

13
Learning for CSI• 70% have specific Fatality Prevention
initiatives• Successes:
– UTC & Rio Tinto reduced fatalities by factor of 10
– ABB by factor 7– AEP by factor of 5
• Successes typically gained over 5 years, some 3 years

14
Key success factors
Highly visible CEO commitment Senior Management safety training Establishing safety “Golden Rules” Strong safety management of contractors Strong safety management of drivers Rigorous fatality investigation procedures Implement specific fatality prevention focus

15
CSI: Root case analysis
Category 2007 2008
Employee 45 42
Contractor 122 133
Third Party 40 45
Totals 207 220
Highest risk category of person: contractors

16
47%
29%
9%
3%
6%
4% 2%
Traffic & Moblie Plant
Falls from Height & ItemsFalling
Caught in Moving/StartingEquipment
Electrocution during plantmaintenance
Buried in Stockpile/Silo
Explosion of tanks & tankers,Fires
Other
Root case analysis
Highest risk area of work: driving and vehicles

17
CSI actionDriver and Contractor Safety Initiatives
started in November 2008
To eliminate driver and contractor
related injuries and fatalities

18
Driver and Contractor SafetyDriver Safety guidelines:
– 8 Safety Elements for Drivers
– 9 Safety Elements for Managers
– Guidelines on Implementation of Safety Elements
– Guidelines for Transport Contractor Management

19
Driver and Contractor SafetyContractor safety guidelines:– Safety Considerations for Contractor
Management (Prequalification, Contract Definition and Award, Pre-Commencement, Implementation, Handover and Acceptance, Post-Contract Review)
– 6 Safety Elements for Contractor Management:
– Guidelines on Implementing Safety Elements for Contractor Management

20
Implementation
• Gap analysis by each CSI member company on systems already in place
• Adoption of Good Practice documents within 5 years across all activities and regions
• Public updates on implementation progress
21
Pilot projects (contractors)
• Overseen by individual companies
• Review success in near future and assess CSI-implementation potential
– USA (contractor prequalification)
– Poland (contractor employee passports)

22
Key messages• CEO-led initiative, expecting their approval
and leadership • Our injury performance as an industry is far
from where we need it to be • Without focused prevention initiatives we
can expect our performance to worsen• Industry support for the Driving and
Contractor Safety Management documents will set us on the right path to zero fatalities

23
For more information … Driver Safety breakout session:
This afternoon at 16.15
Chromium room
Task Force Co-Chairs:
Jim O’Brien: [email protected]
Paul Corbin: [email protected]
www.wbcsdcement.org/safety