csi: catch the chocolate thief!! - issaquah...
TRANSCRIPT
CSI: Catch the Chocolate Thief!! Stats 3.1 & 3.2
You will be able to provide one or more of these skills for your group today…Using Excel Measuring in the Metric systemUsing a Tablet Stick-with-it-nessUsing Nspires Building and Analyzing Scatter Plots
Hand Span Info CSI SkillsDeductive Reasoning Computing the Correlation
r-ValueCollecting Evidence Least Squares Regression
LinesInterrogation Skills Graphing and Calculating Residuals
Roles:RM: Team Questions, Make sure everyone has supplies, Organize clean up
Captain: Make sure everyone measures really accurately, Read task card steps carefully
RR: Make sure all data gets recorded, Enter group data onto the tablet holding all data
CSI: Catch the Chocolate Thief!! Stats 3.1 & 3.2
Facilitator: Watch the time, Keep the group moving, Help “measure twice, record once”
CSI: Catch the Chocolate Thief!! Stats 3.1 & 3.2
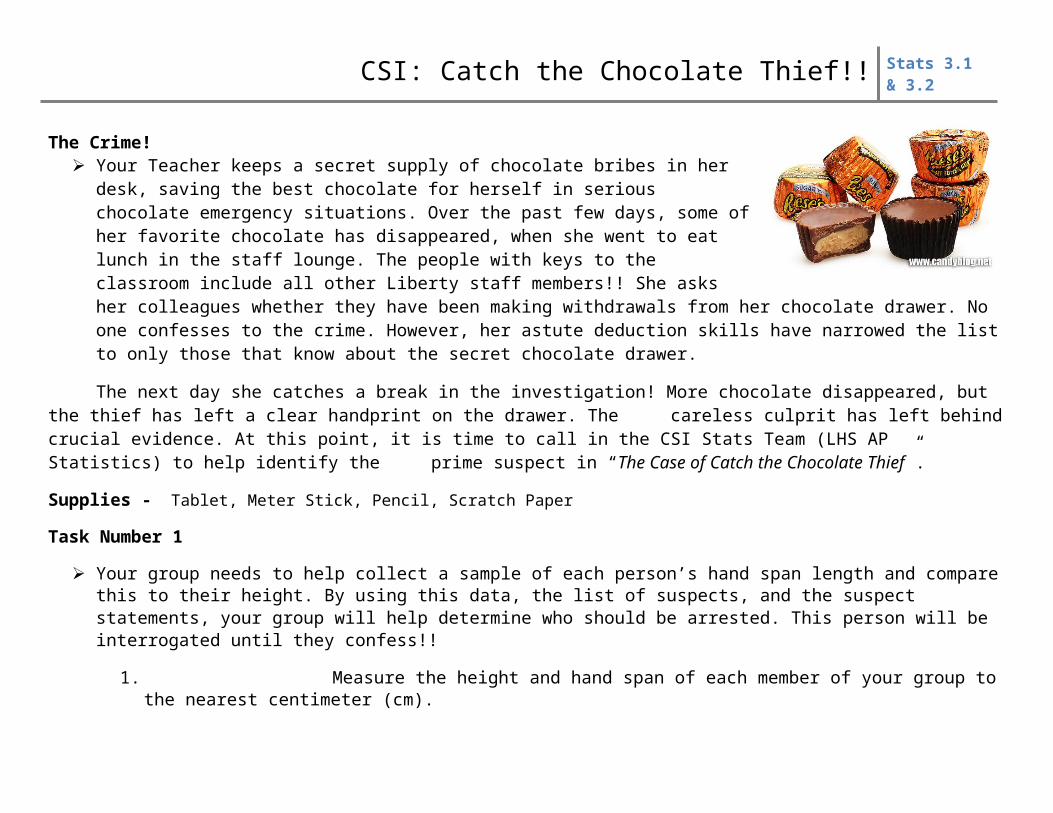
The Crime! Your Teacher keeps a secret supply of chocolate bribes in her desk, saving the best chocolate for herself
in serious chocolate emergency situations. Over the past few days, some of her favorite chocolate has disappeared, when she went to eat lunch in the staff lounge. The people with keys to the classroom include all other Liberty staff members!! She asks her colleagues whether they have been making withdrawals from her chocolate drawer. No one confesses to the crime. However, her astute deduction skills have narrowed the list to only those that know about the secret chocolate drawer.
The next day she catches a break in the investigation! More chocolate disappeared, but the thief has left a clear handprint on the drawer. The careless culprit has left behind crucial evidence. At this point, it is time to call in the CSI Stats Team (LHS AP Statistics) to help identify the prime suspect in “The Case of Catch the Chocolate Thief”.
Supplies - Tablet, Meter Stick, Pencil, Scratch Paper
Task Number 1 Your group needs to help collect a sample of each person’s hand span length and compare this to their height. By using this data, the list of
suspects, and the suspect statements, your group will help determine who should be arrested. This person will be interrogated until they confess!!
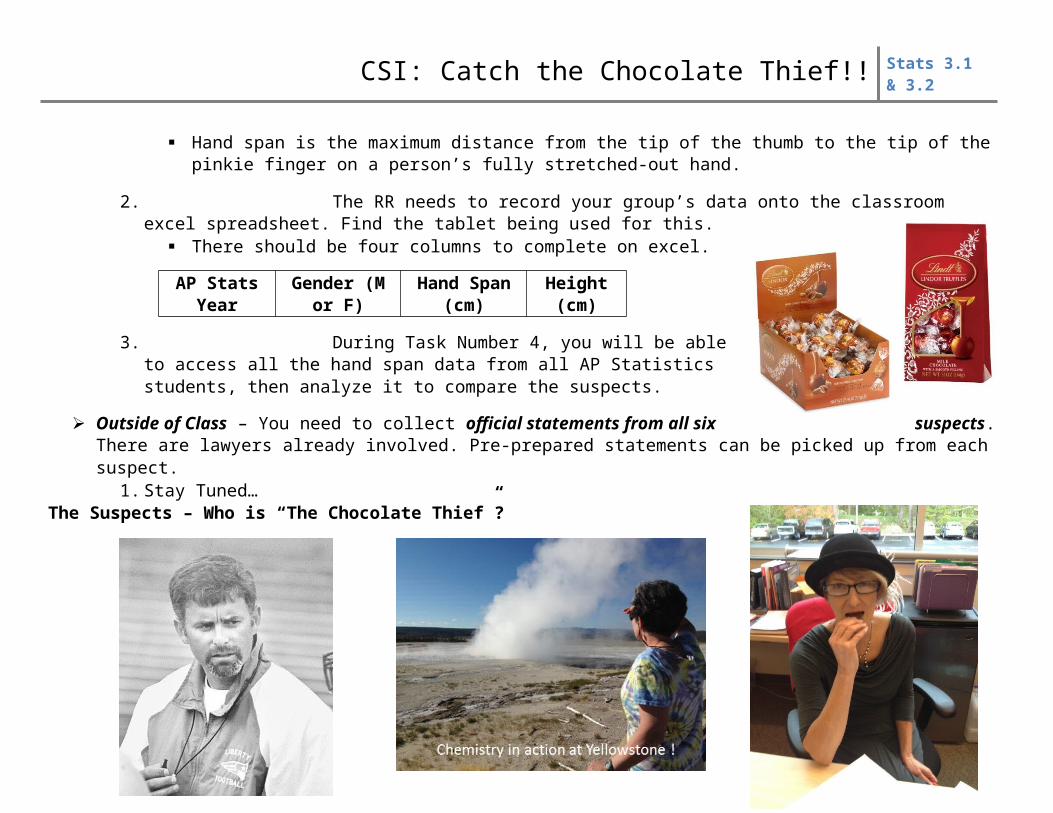
1. Measure the height and hand span of each member of your group to the nearest centimeter (cm). Hand span is the maximum distance from the tip of the thumb to the tip of the pinkie finger on a person’s fully stretched-out hand.
2. The RR needs to record your group’s data onto the classroom excel spreadsheet. Find the tablet being used for this. There should be four columns to complete on excel.
AP Stats Year Gender (M or F) Hand Span (cm) Height (cm)
3. During Task Number 4, you will be able to access all the hand span data from all AP Statistics students, then analyze it to compare the suspects.
Outside of Class – You need to collect official statements from all six suspects. There are lawyers already involved. Pre-prepared statements can be picked up from each suspect.
1.Stay Tuned…The Suspects – Who is “The Chocolate Thief”?
CSI: Catch the Chocolate Thief!! Stats 3.1 & 3.2
Task Number 2 - Track and Field Day The table below shows data for 13 students in a statistics class. Each member of the class ran a 40-yard sprint and then did a long jump (with a running start).
Ms. Leake?
Ms. Phillips?
Mr. Schneider?
Coach Hall?
Coach Valach?
Mr. Gardner?
CSI: Catch the Chocolate Thief!! Stats 3.1 & 3.2
For task 2, complete all work on an Nspire Calculator. There is an exit ticket to complete for task 2 and 3.
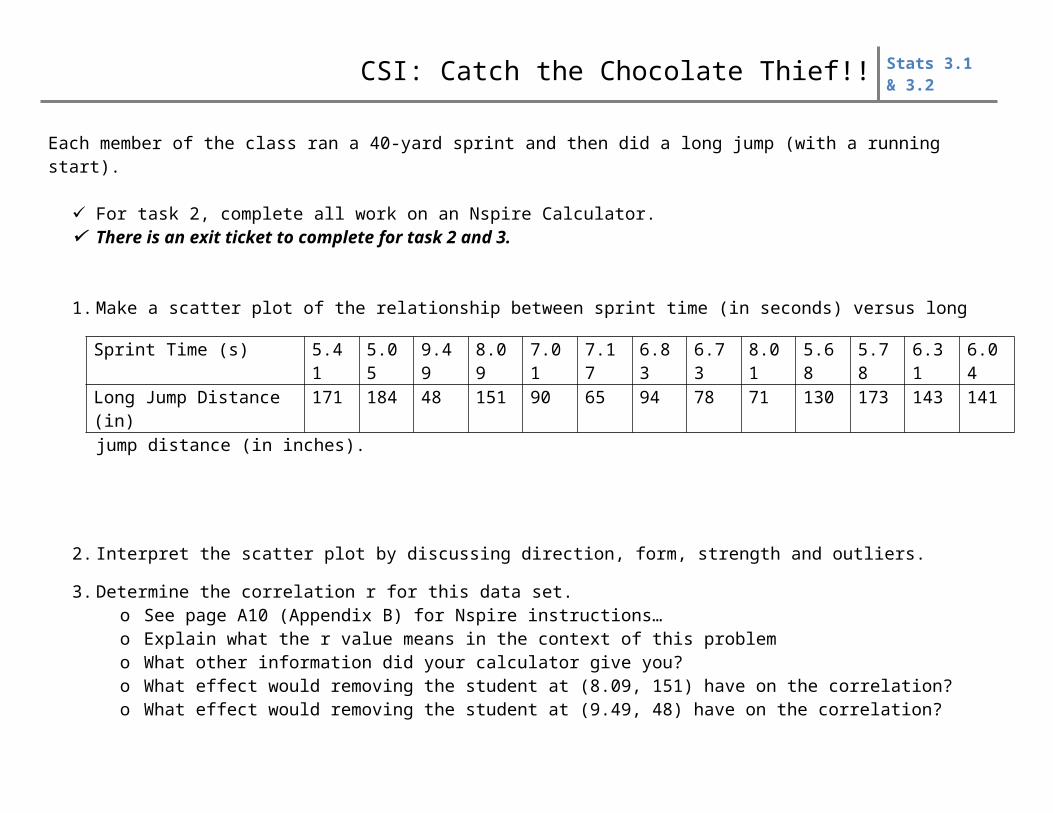
1. Make a scatter plot of the relationship between sprint time (in seconds) versus long jump distance (in inches).
2. Interpret the scatter plot by discussing direction, form, strength and outliers.
3. Determine the correlation r for this data set. o See page A10 (Appendix B) for Nspire instructions…
o Explain what the r value means in the context of this problemo What other information did your calculator give you?o What effect would removing the student at (8.09, 151) have on the correlation?o What effect would removing the student at (9.49, 48) have on the correlation?
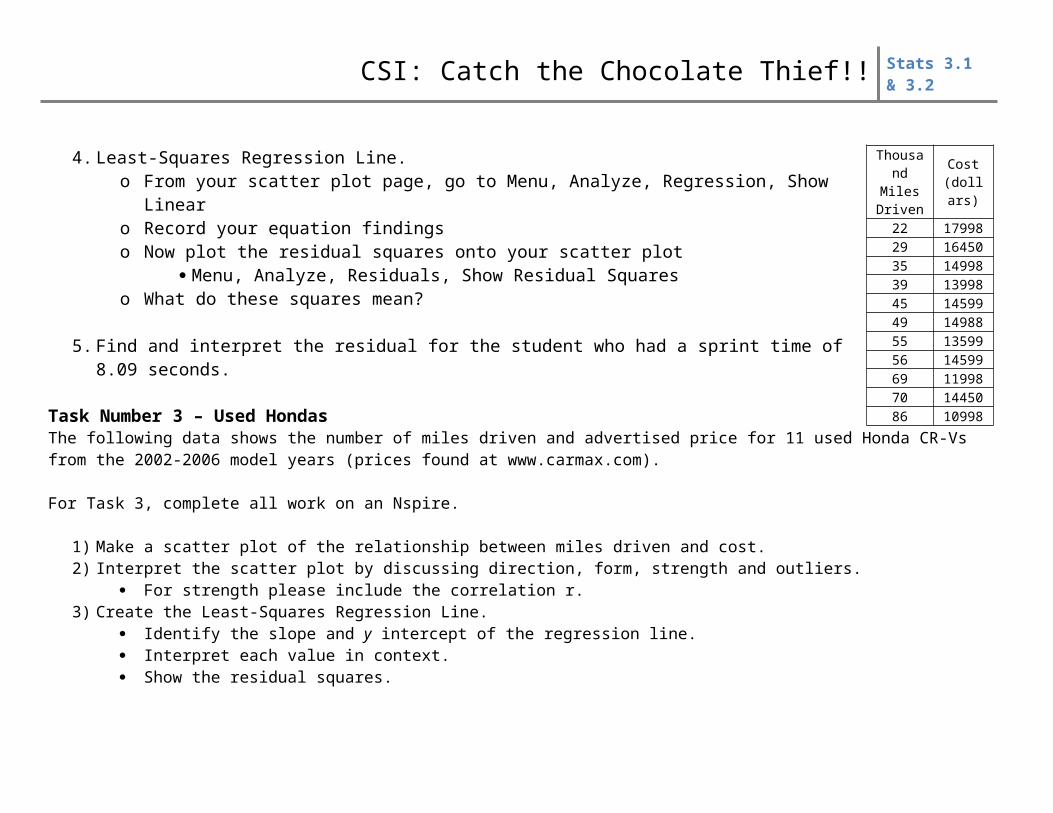
4. Least-Squares Regression Line.o From your scatter plot page, go to Menu, Analyze, Regression, Show Linearo Record your equation findingso Now plot the residual squares onto your scatter plot
Menu, Analyze, Residuals, Show Residual Squareso What do these squares mean?
5. Find and interpret the residual for the student who had a sprint time of 8.09 seconds.
Task Number 3 – Used Hondas The following data shows the number of miles driven and advertised price for 11 used Honda CR-Vs from the 2002-2006 model years (prices found at www.carmax.com).
Sprint Time (s) 5.41 5.05 9.49 8.09 7.01 7.17 6.83 6.73 8.01 5.68 5.78 6.31 6.04Long Jump Distance (in) 171 184 48 151 90 65 94 78 71 130 173 143 141
ThousandMilesDriven
Cost(dollars)
22 1799829 1645035 1499839 1399845 1459949 1498855 1359956 1459969 1199870 1445086 10998
CSI: Catch the Chocolate Thief!! Stats 3.1 & 3.2
For Task 3, complete all work on an Nspire.
1) Make a scatter plot of the relationship between miles driven and cost.2) Interpret the scatter plot by discussing direction, form, strength and outliers.
For strength please include the correlation r.3) Create the Least-Squares Regression Line.
Identify the slope and y intercept of the regression line. Interpret each value in context. Show the residual squares.
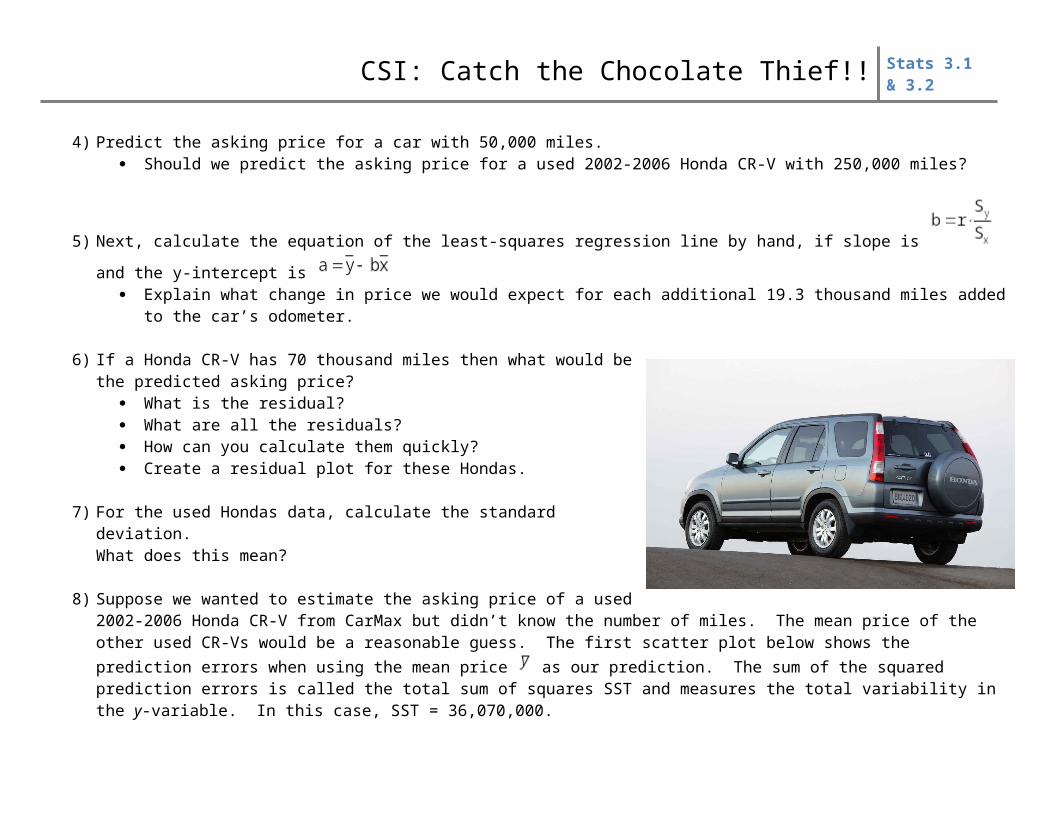
4) Predict the asking price for a car with 50,000 miles. Should we predict the asking price for a used 2002-2006 Honda CR-V with 250,000 miles?
5) Next, calculate the equation of the least-squares regression line by hand, if slope is and the y-intercept is Explain what change in price we would expect for each additional 19.3 thousand miles added to the car’s odometer.
6) If a Honda CR-V has 70 thousand miles then what would be the predicted asking price?
What is the residual? What are all the residuals? How can you calculate them quickly? Create a residual plot for these Hondas.
7) For the used Hondas data, calculate the standard deviation. What does this mean?
8) Suppose we wanted to estimate the asking price of a used 2002-2006 Honda CR-V from CarMax but didn’t know the number of miles. The mean price of the other used CR-Vs would be a reasonable guess. The first scatter plot below shows the prediction errors when using the mean price
CSI: Catch the Chocolate Thief!! Stats 3.1 & 3.2
as our prediction. The sum of the squared prediction errors is called the total sum of squares SST and measures the total variability in the y-variable. In this case, SST = 36,070,000.
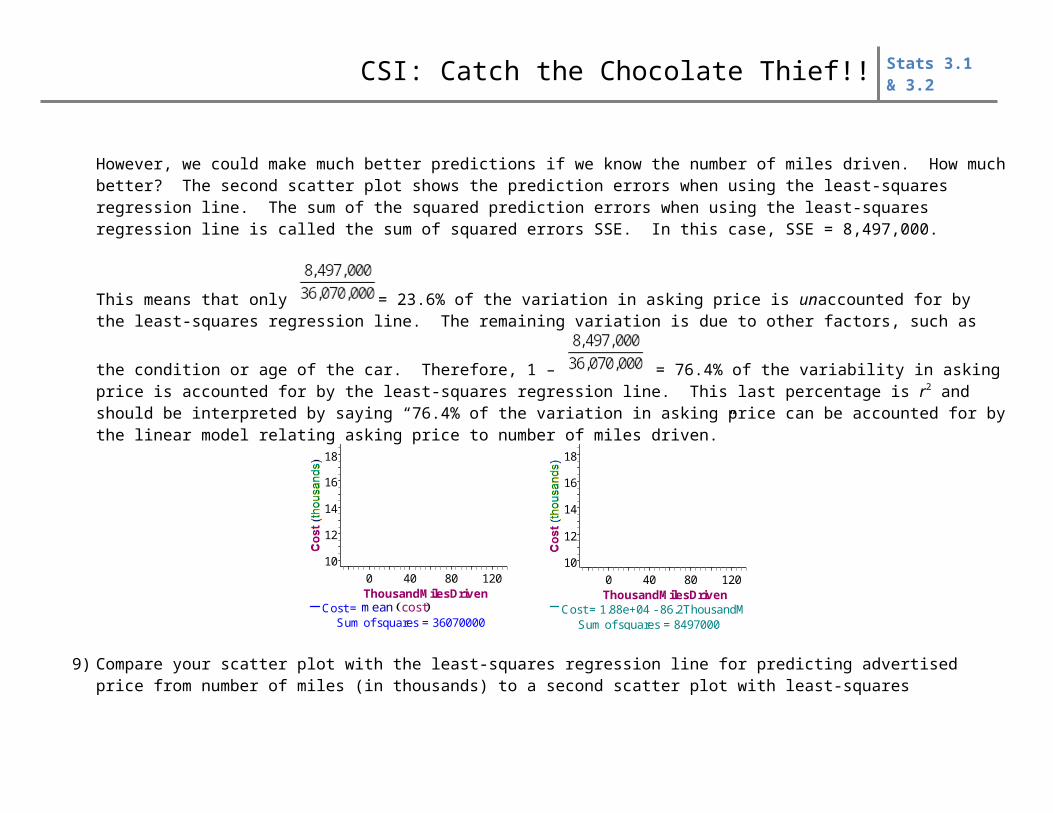
However, we could make much better predictions if we know the number of miles driven. How much better? The second scatter plot shows the prediction errors when using the least-squares regression line. The sum of the squared prediction errors when using the least-squares regression line is called the sum of squared errors SSE. In this case, SSE = 8,497,000.
This means that only = 23.6% of the variation in asking price is unaccounted for by the least-squares regression line.
The remaining variation is due to other factors, such as the condition or age of the car. Therefore, 1 – = 76.4% of the variability in asking price is accounted for by the least-squares regression line. This last percentage is r2 and should be interpreted by saying “76.4% of the variation in asking price can be accounted for by the linear model relating asking price to number of miles driven.”
10
12
14
16
18
ThousandMilesDriven0 40 80 120
Cost = Sum of squares = 36070000
cost mean
10
12
14
16
18
ThousandMilesDriven0 40 80 120
Cost = 1.88e+04 - 86.2ThousandMilesDriven Sum of squares = 8497000
9) Compare your scatter plot with the least-squares regression line for predicting advertised price from number of miles (in thousands) to a second scatter plot with least-squares regression line for predicting number of miles (in thousands) from advertised price. Start a new page in your Nspire document.
Task Number 4 – Identifying the Chocolate Thief For task 4, complete all work on a Surface Pro Tablet. Your group needs to determine who The Chocolate Thief is by analyzing all collected data.
CSI: Catch the Chocolate Thief!! Stats 3.1 & 3.2
You may wish to collect more evidence outside of class! Take this into consideration when determining the thief.
Download the class’s hand span and height data from the Homedirs file within lhssvr02. Go to the Network Go to LHS SVR 2 Go to Kruzich’s Folder Go to the AP Statistics Folder Then open and download the Excel Chapter 3 Chocolate Data
Using Excel, make a scatter plot of the class data. Insert – Scatter Go to the Layout Menu
o Fix the Chart Titleo Rescale your horizontal and vertical axeso Title you horizontal and vertical axeso Remove the Legendo Change any other features if they improve the scatter plot.
Graph a least squares regression lineo Click on one of the points on the grapho Then right click to Add Trendlineo Select Linear and Display Equation on chart and Display r-squared value on
chart Find the correlation coefficient (hint: undo the square of r)
In Class - Collect measurements of the handprint found on Kruzich’s desk. Outside of Class – Your group collected official statements from all six suspects.
Using your graph analysis, can you determine who The Chocolate Thief is?
CSI: Catch the Chocolate Thief!! Stats 3.1 & 3.2
Final Product Your whole group will present your CSI findings to the class.
o Use a PowerPoint presentation o Use a Google presentation…highly recommended for sharing.o Use a Prezi presentationo Use other equivalent presentation software…be creative!!
Include all statistical datao The Scatter Plot
Title Labeled axes with units The r-value The fitted least-squares line R squared - value
o Explanations of each in a thoroughly written context.o Be sure to explain the slope of your least-squares line in context.
Other Things to includeo Title Slide – names, date, periodo Thoughts or information that supports your analysis of who is The Chocolate Thief.o Conclusion Slide
Chocolate Thief’s identity Conclude in complete sentences Include every aspect of the context of this problem.
o Must spell Thief Correctly!!
Everyone must present an equal portion of the presentation.
This final product is due at the beginning of your next AP Stats class.
Chocolate in Cookies is absolutely the best thing EVER
invented!!