cse 567m computer systems analysisjain/cse567-06/ftp/k_01int.pdf · washington university in st....
TRANSCRIPT

1-1©2006 Raj JainCSE567MWashington University in St. Louis
CSE 567MCSE 567MComputer Systems Computer Systems
AnalysisAnalysis
Raj Jain Washington University in Saint Louis
Saint Louis, MO [email protected]
These slides are available on-line at:http://www.cse.wustl.edu/~jain/cse567-06/

1-2©2006 Raj JainCSE567MWashington University in St. Louis
OverviewOverview
! Goal of this Course! Contents of the course! Tentative Schedule! Project! Grading

1-3©2006 Raj JainCSE567MWashington University in St. Louis
Goal of This CourseGoal of This Course
! Comprehensive course on performance analysis! Includes measurement, statistical modeling,
experimental design, simulation, and queuing theory! How to avoid common mistakes in performance
analysis! Graduate course: (Advanced Topics) ⇒ Lot of independent reading and writing⇒ Project/Survey paper (Research techniques)

1-4©2006 Raj JainCSE567MWashington University in St. Louis
Text BookText Book
! R. Jain, “Art of Computer Systems Performance Analysis,” Wiley, 1991, ISBN:0471503363(Winner of the “1992 Best Computer Systems Book” Award from Computer Press Association”)

1-5©2006 Raj JainCSE567MWashington University in St. Louis
Objectives: What You Will LearnObjectives: What You Will Learn! Specifying performance requirements! Evaluating design alternatives! Comparing two or more systems! Determining the optimal value of a parameter (system tuning)! Finding the performance bottleneck (bottleneck identification)! Characterizing the load on the system (workload
characterization)! Determining the number and sizes of components (capacity
planning)! Predicting the performance at future loads (forecasting).

1-6©2006 Raj JainCSE567MWashington University in St. Louis
Basic TermsBasic Terms
! System: Any collection of hardware, software, and firmware
! Metrics: Criteria used to evaluate the performance of the system. components.
! Workloads: The requests made by the users of the system.

1-7©2006 Raj JainCSE567MWashington University in St. Louis
Main Parts of the CourseMain Parts of the Course
! Part I: An Overview of Performance Evaluation! Part II: Measurement Techniques and Tools! Part III: Probability Theory and Statistics! Part IV: Experimental Design and Analysis! Part V: Simulation! Part VI: Queueing Theory

1-8©2006 Raj JainCSE567MWashington University in St. Louis
Part I: An Overview of Performance Part I: An Overview of Performance EvaluationEvaluation
! Introduction! Common Mistakes and How To Avoid Them! Selection of Techniques and Metrics

1-9©2006 Raj JainCSE567MWashington University in St. Louis
Example IExample I
! What performance metrics should be used to compare the performance of the following systems:" Two disk drives?" Two transaction-processing systems?" Two packet-retransmission algorithms?
1-10©2006 Raj JainCSE567MWashington University in St. Louis
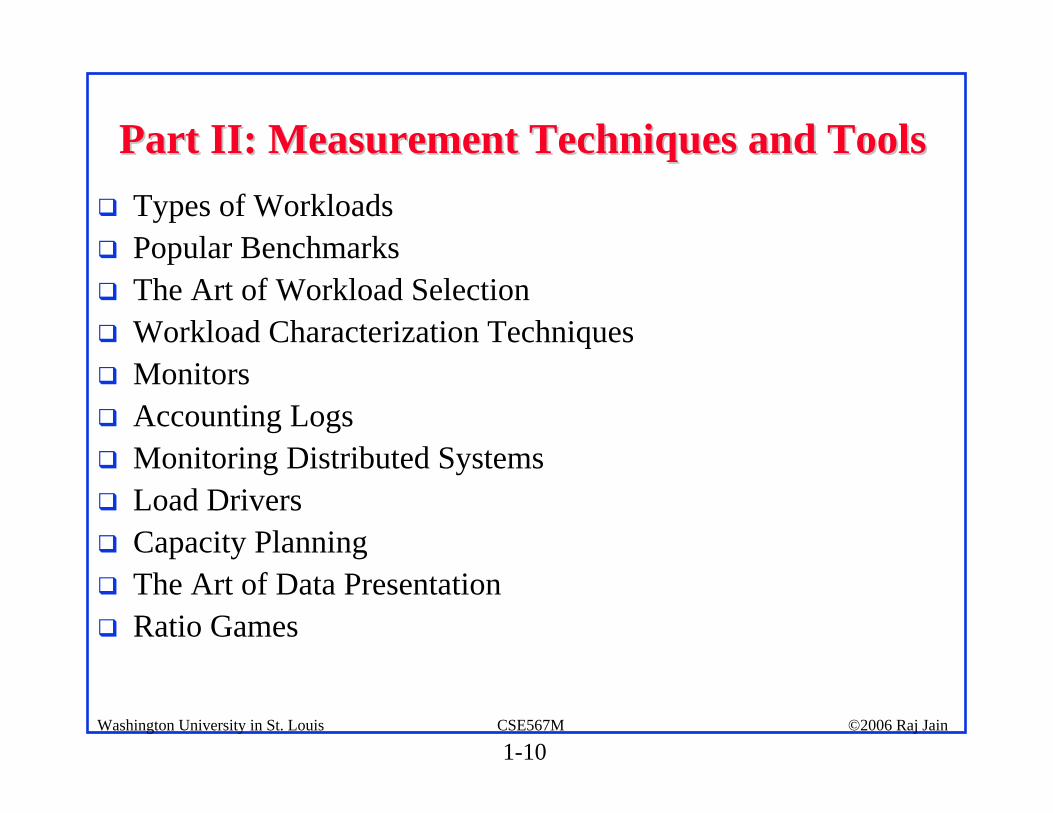
Part II: Measurement Techniques and ToolsPart II: Measurement Techniques and Tools! Types of Workloads! Popular Benchmarks! The Art of Workload Selection! Workload Characterization Techniques! Monitors! Accounting Logs! Monitoring Distributed Systems! Load Drivers! Capacity Planning! The Art of Data Presentation! Ratio Games

1-11©2006 Raj JainCSE567MWashington University in St. Louis
Example IIExample II
! Which type of monitor (software or hardware) would be more suitable for measuring each of the following quantities:" Number of Instructions executed by a processor?" Degree of multiprogramming on a timesharing
system?" Response time of packets on a network?

1-12©2006 Raj JainCSE567MWashington University in St. Louis
Part III: Probability Theory and StatisticsPart III: Probability Theory and Statistics! Probability and Statistics Concepts! Four Important Distributions! Summarizing Measured Data By a Single Number! Summarizing The Variability Of Measured Data! Graphical Methods to Determine Distributions of Measured
Data! Sample Statistics! Confidence Interval! Comparing Two Alternatives! Measures of Relationship! Simple Linear Regression Models! Multiple Linear Regression Models! Other Regression Models

1-13©2006 Raj JainCSE567MWashington University in St. Louis
Example IIIExample III
! The number of packets lost on two links was measured for our file sizes as shown below:
Which link is better?

1-14©2006 Raj JainCSE567MWashington University in St. Louis
Part IV: Experimental Design and AnalysisPart IV: Experimental Design and Analysis
! Introduction to Experimental Design! 2k Factorial Designs! 2kr Factorial Designs with Replications! 2k-p Fractional Factorial Designs! One Factor Experiments! Two Factors Full Factorial Design without
Replications! Two Factors Full Factorial Design with Replications! General Full Factorial Designs With k Factors

1-15©2006 Raj JainCSE567MWashington University in St. Louis
Example IVExample IV
! The performance of a system depends on the following three factors:" Garbage collection technique used: G1, G2, or
none." Type of workload: editing, computing, or AI." Type of CPU: C1, C2, or C3.
How many experiments are needed? How does one estimate the performance impact of each factor?

1-16©2006 Raj JainCSE567MWashington University in St. Louis
Part V: SimulationPart V: Simulation
! Introduction to Simulation! Types of Simulations! Model Verification and Validation! Analysis of Simulation Results! Random-Number Generation! Testing Random-Number Generators! Random-Variate Generation! Commonly Used Distributions

1-17©2006 Raj JainCSE567MWashington University in St. Louis
Example VExample V
! In order to compare the performance of two cache replacement algorithms:" What type of simulation model should be used?" How long should the simulation be run?" What can be done to get the same accuracy with a
shorter run?" How can one decide if the random-number
generator in the simulation is a good generator?

1-18©2006 Raj JainCSE567MWashington University in St. Louis
Part VI: Queueing TheoryPart VI: Queueing Theory
! Introduction to Queueing Theory! Analysis of A Single Queue! Queueing Networks! Operational Laws! Mean Value Analysis and Related Techniques! Convolution Algorithm! Advanced Techniques

1-19©2006 Raj JainCSE567MWashington University in St. Louis
Example VIExample VI! The average response time of a database system is three
seconds. During a one-minute observation interval, the idle time on the system was ten seconds.
Using a queueing model for the system, determine the following:" System utilization" Average service time per query" Number of queries completed during the observation
interval" Average number of jobs in the system" Probability of number of jobs in the system being greater
than 10" 90-percentile response time" 90-percentile waiting time

1-20©2006 Raj JainCSE567MWashington University in St. Louis
The Art of Performance EvaluationThe Art of Performance Evaluation
! Given the same data, two analysts may interpret them differently.
Example:! The throughputs of two systems A and B in
transactions per second is as follows:

1-21©2006 Raj JainCSE567MWashington University in St. Louis
Possible SolutionsPossible Solutions
! Compare the average:
Conclusion: The two systems are equally good.
! Compare the ratio with system B as the base
Conclusion: System A is better than B.

1-22©2006 Raj JainCSE567MWashington University in St. Louis
Solutions (Cont)Solutions (Cont)
! Compare the ratio with system A as the base
Conclusion: System B is better than A.! Similar games in: Selection of workload, Measuring
the systems, Presenting the results.! Common mistakes will also be discussed.
1-23©2006 Raj JainCSE567MWashington University in St. Louis
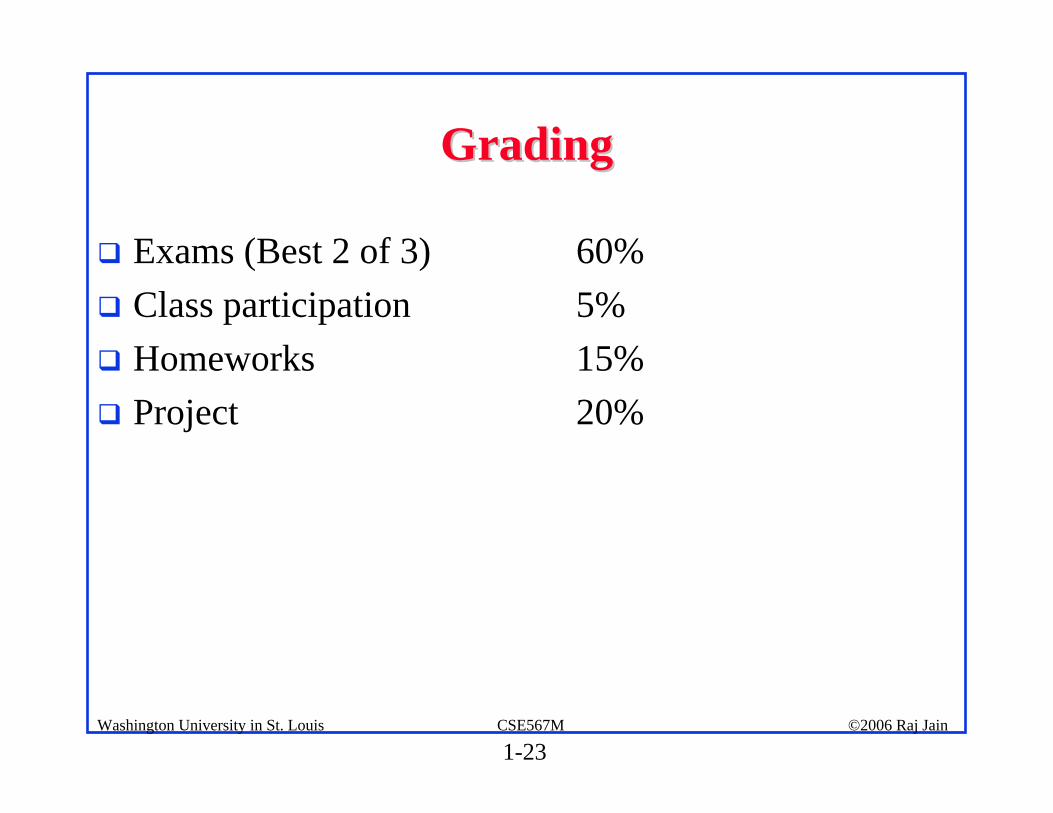
GradingGrading
! Exams (Best 2 of 3) 60%! Class participation 5%! Homeworks 15% ! Project 20%

1-24©2006 Raj JainCSE567MWashington University in St. Louis
PrerequisitesPrerequisites! CSE 131: Computer Science I! CSE 126: Introduction To Computer Programming ! CSE 260M: Introduction To Digital Logic And
Computer Design (Not required)! Basic Probability and Statistics

1-25©2006 Raj JainCSE567MWashington University in St. Louis
PrerequisitePrerequisite
! Statistics: " Mean, variance" Normal distribution" Density function, Distribution function " Coefficient of variation
Correlation coefficient" Median, mode, Quantile
! C Programming, UNIX

1-26©2006 Raj JainCSE567MWashington University in St. Louis
Tentative ScheduleTentative ScheduleDate Topic Chapters8/30 Introduction
9/4 Memorial Day Holiday 9/6 Common Mistakes 2
9/11 Introduction to Simulation 24 9/13 Single Queues 30 9/18 Selection of Techniques and Metrics 2,3 9/20 Workload Selection and Characterization 5, 6 9/25 Data Presentation, Ratio Games 10, 11 9/27 Summarizing Measured Data 12 10/2 Exam 1 10/4 Comparing Systems Using Random Data 13 10/9 Simple Linear Regression Models 14
10/11 Other Regression Models 15

1-27©2006 Raj JainCSE567MWashington University in St. Louis
Tentative Schedule (Cont)Tentative Schedule (Cont)Date Topic Chapters
10/16 Analysis of Simulation Results 25 10/18 Random Number Generation 26 10/23 Test Random Numbers 27 10/25 Experimental Designs 16, 17 10/30 Factorial Designs with Replication18 11/1 Fractional Factorial Designs 19 11/6 Exam 2 11/8 One Factor Experiments 20
11/13 Two Factor Full Factorial Designs 21, 22 11/15 General Full Factorial Designs 23 11/20 Analysis of Single Queue 31 11/22 Thanksgiving Holiday

1-28©2006 Raj JainCSE567MWashington University in St. Louis
Tentative Schedule (Cont)Tentative Schedule (Cont)Date Topic Chapters
11/27 Queueing Networks 32 11/29 Operational Laws 33
12/4 Mean-Value Analysis 34 12/6 Convolution Algorithm 35
12/11 Final Exam

1-29©2006 Raj JainCSE567MWashington University in St. Louis
ProjectsProjects! A survey paper on a performance topic
" Workloads/Metrics/Analysis: Databases, Networks, Computer Systems, Web Servers, Graphics, Sensors, Distributed Systems
" Comparison of Measurement, Modeling, Simulation, Analysis Tools: NS2
" Comprehensive Survey: Technical Papers, Industry Standards, Products
! A real case study on performance of a system you are already working on
! Average 6 Hrs/week/person on project + 9 Hrs/week/person on class
! Recent Developments: Last 5 to 10 years ⇒ Not in books! Better ones may be submitted to magazines or journals

1-30©2006 Raj JainCSE567MWashington University in St. Louis
Example of Previous Case StudiesExample of Previous Case Studies! Measure the performance of a remote procedure call
mechanism used in a distributed system.! Measure and compare the performance of window systems of
two artificial intelligence systems.! Simulate and compare the performance of two processor
interconnection networks.! Measure and analyze the performance of two microprocessors.! Characterize the workload of a campus timesharing system.! Compute the effects of various factors and their interactions on
the performance of two text-formatting programs.! Measure and analyze the performance of a distributed
information system.

1-31©2006 Raj JainCSE567MWashington University in St. Louis
Case Studies (Cont)Case Studies (Cont)! Simulate the communications controllers for an intelligent
terminal system.! Measure and analyze the performance of a computer-aided
design tool.! Measure and identify the factors that affect the performance of
an experimental garbage collection algorithm.! Measure and compare the performance of remote procedure
calls and remote pipe calls.! Analyze the effect of factors that impact the performance of
two RISC processor architectures.! Analyze the performance of a parallel compiler running on a
multiprocessor system.

1-32©2006 Raj JainCSE567MWashington University in St. Louis
Projects (Cont)Projects (Cont)! Develop a software monitor to observe the performance of a
large multiprocessor system.! Analyze the performance of a distributed game program
running on a network of artificial intelligence systems.! Compare the performance of several robot control algorithms.
! Goal: Provide an insight (or information) not obvious before the project.
! Real Problems: Thesis work, or job
! Homeworks: Apply techniques learnt to your system.

1-33©2006 Raj JainCSE567MWashington University in St. Louis
Project ScheduleProject Schedule
Mon 10/9/06 Topic SelectionMon 10/23/06 References Due Mon 10/30/06 Outline Due Mon 11/13/06 First Draft Due Mon 11/20/06 Reviews ReturnedMon 11/27/06 Final Report Due

1-34©2006 Raj JainCSE567MWashington University in St. Louis
Office HoursOffice Hours
! Monday: 11 AM to 12 noonWednesday: 3:30 PM to 4:30PM
! Office: Bryan 405D
! Graders: TBA

1-35©2006 Raj JainCSE567MWashington University in St. Louis
Frequently Asked QuestionsFrequently Asked Questions! Yes, I do use “curve”. Your grade depends upon the
performance of the rest of the class.! All homeworks are due on the following Monday unless
specified otherwise.! Any late submissions, if allowed, will *always* have a penalty.! All exams are open-book and extremely time limited.! Exams consist of numerical as well as multiple-choice (true-
false) questions.! There is negative grading on incorrect multiple-choice
questions. Grade: +1 for correct. -1/(n-1) for incorrect.! Everyone including the graduating students are graded the
same way.

1-36©2006 Raj JainCSE567MWashington University in St. Louis
SummarySummary
! Goal: To prepare you for correct analysis and modeling of any system
! There will be a lot of self-reading and writing! Get ready to work hard
1-37©2006 Raj JainCSE567MWashington University in St. Louis
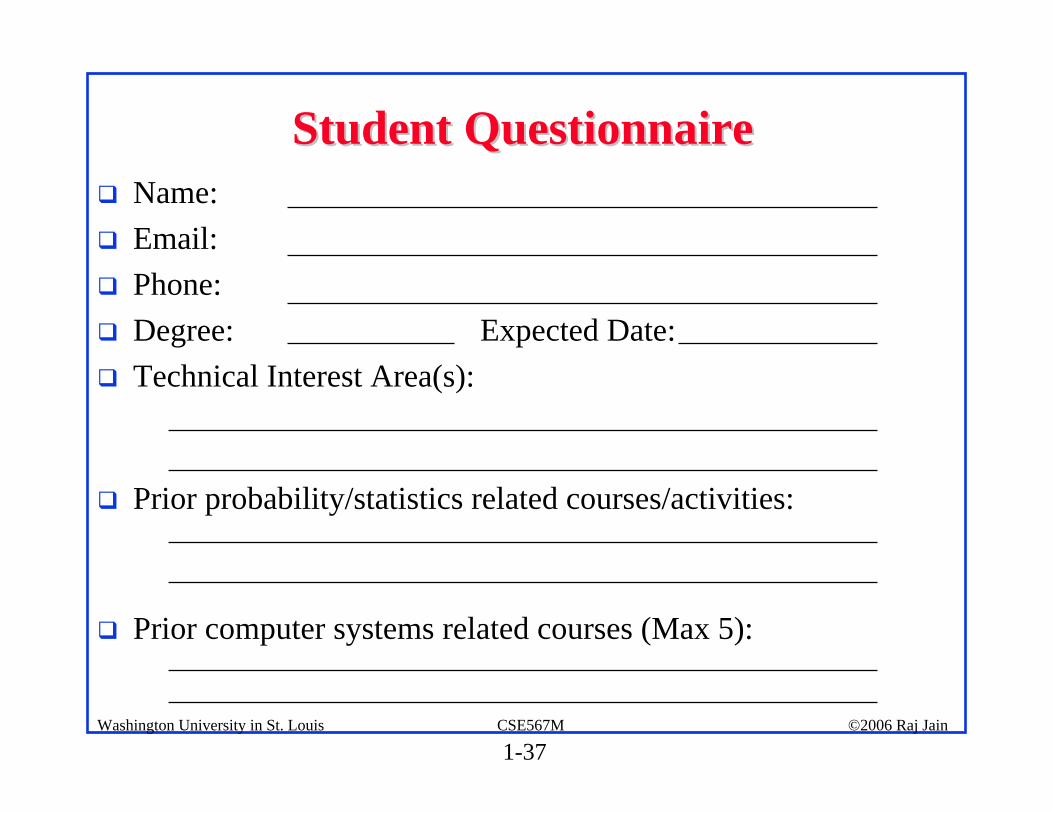
! Name:! Email:! Phone:! Degree: Expected Date:! Technical Interest Area(s):
! Prior probability/statistics related courses/activities:
! Prior computer systems related courses (Max 5):
Student QuestionnaireStudent Questionnaire
1-38©2006 Raj JainCSE567MWashington University in St. Louis
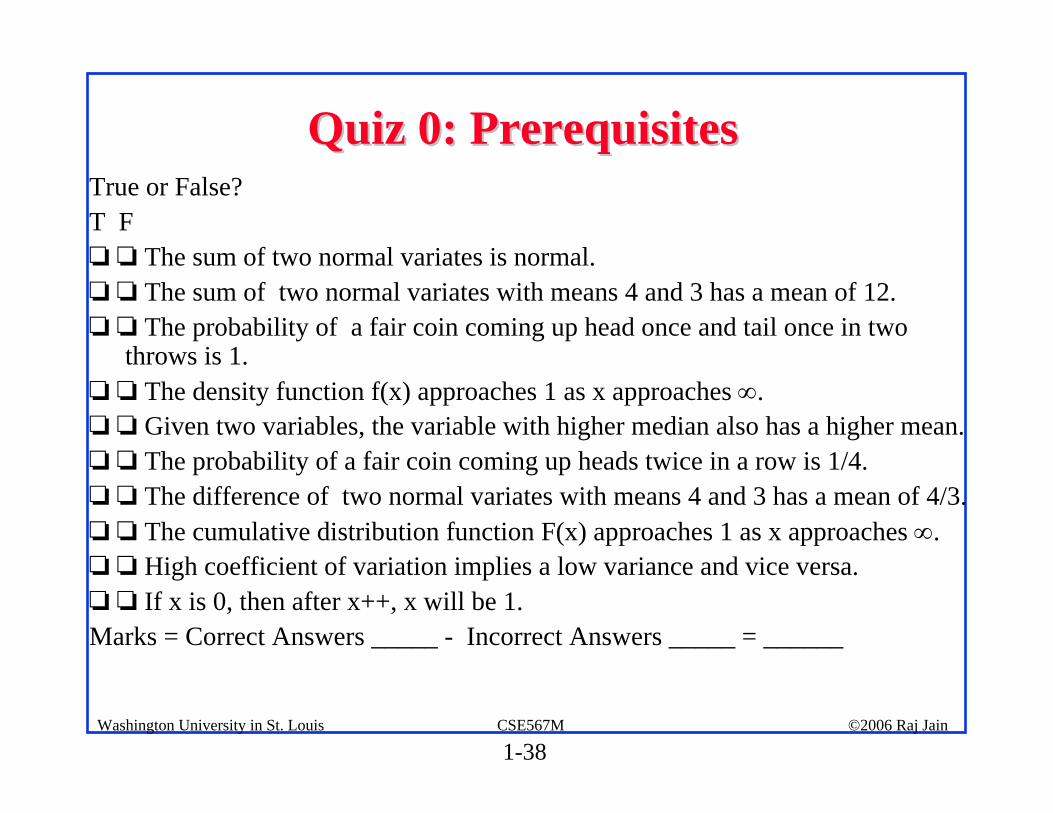
Quiz 0: PrerequisitesQuiz 0: PrerequisitesTrue or False?T F! ! The sum of two normal variates is normal.! ! The sum of two normal variates with means 4 and 3 has a mean of 12.! ! The probability of a fair coin coming up head once and tail once in two
throws is 1.! ! The density function f(x) approaches 1 as x approaches ∞.! ! Given two variables, the variable with higher median also has a higher mean.! ! The probability of a fair coin coming up heads twice in a row is 1/4.! ! The difference of two normal variates with means 4 and 3 has a mean of 4/3.! ! The cumulative distribution function F(x) approaches 1 as x approaches ∞.! ! High coefficient of variation implies a low variance and vice versa.! ! If x is 0, then after x++, x will be 1.Marks = Correct Answers _____ - Incorrect Answers _____ = ______