crunch&sip® policy evaluation · 6 introduction this report presents the evaluation findings...
TRANSCRIPT

1
Crunch&Sip® Policy Evaluation
Results of the Audit Survey and Tally Charts
2010
Prepared by Rosanne Barnes
September 2010

2
Table of contents
Executive summary ................................................................................................................................. 5
Introduction ............................................................................................................................................ 6
methods .................................................................................................................................................. 6
Data collection .................................................................................................................................... 6
Treatment of the data ........................................................................................................................ 6
RESULTS .................................................................................................................................................. 6
Audit Survey ........................................................................................................................................ 6
School characteristics ..................................................................................................................... 6
Respondent characteristics ............................................................................................................. 7
The Crunch&Sip® policy within the school ..................................................................................... 8
Review and changes to the Crunch&Sip® policy within schools ..................................................... 8
Promotion of the Crunch&Sip® policy in schools ........................................................................... 9
The Crunch&Sip® break at School ................................................................................................. 10
Crunch&Sip® participation rate by year group ............................................................................. 11
Food most commonly consumed during Crunch&Sip® ................................................................ 12
Food least commonly consumed for Crunch&Sip®....................................................................... 12
Prevalence of dried fruit for Crunch&Sip® .................................................................................... 13
Proportion of students regularly bringing fruit and vegetables for the Crunch&Sip® break ....... 13
Participation rates for Crunch&Sip® by location and socio-economic status of the school ......... 14
Most common reason for students not bringing fruit or vegetables to school for the
Crunch&Sip® break ........................................................................................................................ 15
How schools address the issue of access to fruit and vegetables ................................................ 17
Water drinking in the classroom at school ................................................................................... 19
Fruit, vegetable and water intake ................................................................................................. 20
Beliefs on the impact of Crunch&Sip® .......................................................................................... 20
Crunch&Sip® resources used ........................................................................................................ 23
Most liked about Crunch&Sip® ..................................................................................................... 23

3
Least liked about Crunch&Sip® ..................................................................................................... 24
Additional steps taken by respondents ........................................................................................ 25
Additional support needed ........................................................................................................... 26
Other comments ........................................................................................................................... 27
Classroom Participation Tally Charts ................................................................................................ 27
List of Tables
Table 1: School characteristics ................................................................................................................ 7
Table 2: Participant characteristics ......................................................................................................... 8
Table 3: Crunch&Sip® policy within the school ...................................................................................... 8
Table 4: Schools who reviewed and changed their policy ...................................................................... 9
Table 5: Promotion of the Crunch&Sip® Policy in schools ...................................................................... 9
Table 6: Process for informing new staff and students about Crunch&Sip .......................................... 10
Table 7: When the Crunch&Sip® break is at school .............................................................................. 10
Table 8: Timeframe / duration of Crunch&Sip® break at school .......................................................... 10
Table 9: What takes place during the Crunch&Sip® break? ................................................................. 11
Table 10: How often is dried fruit among the three most commonly consumed foods for
Crunch&Sip® ......................................................................................................................................... 13
Table 11: Participation rates for Crunch&Sip® by location and socio-economic status of the school . 15
Table 12: Most common reasons for students not bring fruit and vegetables for Crunch&Sip® ........ 15
Table 13: How schools address the issue of access to fruit and vegetables ........................................ 17
Table 14: Schools with a budget for Crunch&Sip® and participation in the Food Bank’s School
Breakfast Program ................................................................................................................................ 18
Table 15: Where students drink water from in class ............................................................................ 19
Table 16: Where students keep their water bottles or cups ................................................................ 19
Table 17: Cleaning of water bottles or cups at the school ................................................................... 19
Table 18: Proportion of students that regularly bring a water bottle to drink in class ........................ 20
Table 19: Change in Fruit, vegetable and water intake since introducing Crunch&Sip®...................... 20
Table 20: Beliefs of those who ‘strongly agreed’ by subgroups ........................................................... 21

4
Table 21: Crunch&Sip® resources used ................................................................................................ 23
List of Figures
Figure 1: Crunch&Sip® participation rate by year group ...................................................................... 12
Figure 2: Most commonly consumed food during the Crunch&Sip® break .......................................... 12
Figure 3: Least commonly consumed food during the Crunch&Sip® break .......................................... 13
Figure 4: Proportion of students from low, medium and high SES schools regularly bringing fruit and
vegetables for the Crunch&Sip® break .................................................................................................. 14
Figure 5: Most liked about Crunch&Sip® .............................................................................................. 23
Figure 6: Least liked about Crunch&Sip® .............................................................................................. 24
Figure 7: Additional steps taken to support Crunch&Sip® ................................................................... 25
Figure 8: Additional support needed to support Crunch&Sip® ............................................................ 26

5
EXECUTIVE SUMMARY
In 2008 Cancer Council WA undertook an evaluation of the Crunch&Sip® program in Western
Australian Crunch&Sip® certified schools. The evaluation involved distributing an audit survey to be
completed by the person coordinating Crunch&Sip® in the school and a classroom participation tally
chart to be completed by classroom teachers. 152 audits were completed and 910 tally charts were
completed. Results were entered into Microsoft Excel and analysed in SPSS Version 27.
Results indicated that the majority of schools were Government primary schools (67.8%) and slightly
more schools were located in the Perth Metropolitan area (53.3%) compared to country or rural
areas (46.7%). Almost half of respondents reported that their school was situated in a medium
socioeconomic status (SES) area (48.0%). The highest participation rates were reported among the
lowest year group (Kindergarten, Pre-primary and Year 1) for fruit and vegetables (84.4%) and water
(86.6%).
Fruit was the most commonly consumed food during the Crunch&Sip® break. Over half reported
fresh whole fruit (53.3%) and about 40% reported fresh chopped fruit as the most common food.
The least commonly consumed foods during Crunch&Sip® were canned fruit in natural juice (27.1%)
and dried fruit (26.1%). Nearly 70% of respondents from high SES schools reported that more than
80% of their students regularly bring in fruit and vegetables for the break, significantly more than
that reported by respondents from low SES schools (19.6%) (p<0.001). Country or rural schools had a
significantly higher average participation level for fruit and vegetables (82.3%) than Perth
metropolitan schools (75.0%). Low SES schools had a significantly lower average participation level
for fruit and vegetables (73.5%) than both medium SES schools (80.0%) and high SES schools
(82.6%).
Slightly more respondents from the Perth metropolitan area than country/rural areas reported
students forgetting as the most common reason for not bringing fruit and vegetables for
Crunch&Sip®. Lack of parental support and financial issues were more commonly reported among
respondents from low SES schools than other SES groups.
With the introduction of Crunch&Sip® most respondents reported that student intake was ‘more’ for
fruit (92.1%), vegetables (77.6%) and water (86.2%). Over half of schools had used the Crunch&Sip®
resources provided, the most commonly used resource was the water bottle (94.1%). Respondents
were asked about what they like best about Crunch&Sip® and the most commonly ‘liked’ aspect was
‘promotes health/feel satisfied by children’s healthy behaviour (48.7%).
Respondents described additional steps they took to support Crunch&Sip® and two most commonly
reported were holding events or activities and providing fruit for children. Respondents were also
asked to describe any additional support they need to support Crunch&Sip® and respondents most
commonly expressed how useful more promotional materials would be for motivating the children,
as well as the need for support in coordinating Crunch&Sip® at the school (15.1%).
The classroom tally charts revealed that the mean proportion of students in each class eating fruit
and vegetables during the Crunch&Sip® break was 74.4% per day (averaged across the three
reported days) and the mean proportion of students in each class drinking water during the
Crunch&Sip® break was 77.7% per day (averaged across the three reported days).

6
INTRODUCTION
This report presents the evaluation findings of the Crunch&Sip® policy implemented at primary
schools in Western Australia.
METHODS
Data collection
The data presented here were obtained from the audit survey and tally charts (n=152). The
coordinator of the Crunch&Sip® policy at each school was requested to complete the audit survey
and distribute the tally charts to all classrooms. Evaluation commenced in 2008.
Treatment of the data
Data were entered using Microsoft Excel and analysed in SPSS version 17. Where appropriate, Chi
square tests were used to compare groups defined by location of school (country/metro),
socioeconomic status (SES) or years since certification. Few Statistically significant differences were
identified and these are noted in table and figure footnotes.
RESULTS
Audit Survey
School characteristics
Respondents of the Crunch&Sip® Audit survey were asked to describe some of the demographic and
other characteristics of the schools at which they worked (Table 1). The majority of schools
evaluated were Government primary schools (67.8%). Slightly more schools were located in the
Perth metropolitan area (53.3%) than in country or rural areas (46.7%). Almost half of respondents
reported the demographic that best described their school was medium socioeconomic status (SES)
(48.0%), 28.9% reported low SES and 15.8% reported high SES. Over half of respondents reported
the number of classrooms operating at their schools from kindergarten to year 7 was 1-10, nearly
30% reported 11-21 and nearly 10% reported 21-33. Over 35% of the schools had 201 to 500
students attending and just over 30% had 50 to 200 students attending. About one quarter of
schools had been certified for Crunch&Sip® for less than one year, over one third for 1-2 years and
about a third for over 2 years.

7
Table 1: School characteristics
n %
School type
Government Primary School 103 67.8
Catholic Education School 13 8.6
Independent School 10 6.6
District High School 9 5.9
Remote Community School 4 2.6
Education Support Centre 6 3.9
Other 6 3.9
School location
Perth Metropolitan Area 81 53.3
Country/Rural 71 46.7
Socioeconomic status
Low 51 33.6
Medium 73 48.0
High 24 15.8
Number of classrooms
1 – 10 85 55.9
11 – 20 45 29.6
21 – 33 15 9.9
Number of students attending the school
Under 49 28 18.4
50 – 200 47 30.9
201 – 500 54 35.5
501 – 800 20 13.2
Over 800 2 1.3
Years since the school became certified for Crunch&Sip®
<1 year (2008) 39 25.7
1-2 years (2007) 55 36.2
2+ years (2006 or 2005) 49 32.2
Respondent characteristics
Over 40% of respondents were teachers and nearly 43% were school principals (Table 2). Almost
30% of respondents had been at their current school for one to two years, just over 30% for three to
five years and nearly 40% for more than five years. The vast majority of respondents were the
Crunch&Sip® coordinator at the school (87.5%).

8
Table 2: Participant characteristics
n %
Position
Teacher 62 40.8
Principal 65 42.8
Other 22 14.5
Number of years at the school
1-2 years 43 28.3
3-5 years 47 30.9
More than 5 years 58 38.2
Coordinator of the Crunch&Sip policy at school
Yes 133 87.5
No 15 9.9
The Crunch&Sip® policy within the school
Most respondents reported they had read the Crunch&Sip® policy (89.5%) and that the policy
document had been shared with other staff and parents (86.2%) (Table 3). Nearly 30% of
respondents reported that the Crunch&Sip® policy had been reviewed since certification and 10.5%
reported that changes to the policy were made. The majority of respondents had seen the
Crunch&Sip® fence sign at their school.
Table 3: Crunch&Sip® policy within the school
n=152
%
Read Crunch&Sip® policy 89.5
Policy document has been ‘shared’ with other staff and parents
86.2
Crunch&Sip® policy has been reviewed 29.6
Changes were made to the policy since certification
10.5
Seen the Crunch&Sip® fence sign 71.1
Review and changes to the Crunch&Sip® policy within schools
The table below presents the proportion of schools that had reviewed their Crunch&Sip® policy and
the proportion that made changes to the policy, by years since certification. The policy had been
reviewed by over a third of schools certified in 2008 (36.8%) and in 2005 or 2006 (34.0%), but less
than a quarter of those certified in 2007 (22.2%). Changes were made to the policy by 15.4% of
schools certified in 2008, 17.0% of those certified in 2005 or 2006 and less than 4% of those certified
in 2007. There were no statistically significant differences between groups.

9
Table 4: Schools who reviewed and changed their policy
n
Policy was reviewed Policy was changed % %
Year the school became certified for Crunch&Sip®
2008 38 36.8 15.4
2007 54 22.2 3.8
2006 24 25.0 16.7
2005 23 43.5 17.4
Promotion of the Crunch&Sip® policy in schools
Respondents were asked if their school used a series of methods of promoting the Crunch&Sip®
policy to parents, teachers and staff of the school and the students (Table 5). The school newsletter
was the most commonly reported medium for promoting the Crunch&Sip® policy to parents, with
over half of respondents reporting it was used every term, and about 30% reporting it was used at
least once a year. Staff meetings were the most common way of promoting the Crunch&Sip® policy
to teachers with nearly 40% of respondents reporting promotion at staff meetings every term, about
25% reporting ‘at least once a year’ and about 30% reporting ‘at the start of the year’. The
Crunch&Sip® policy was mostly promoted to students by oral reminders in class, and by being linked
to the curriculum during class, with almost half of respondents reporting these methods were used
every term. Over 60% of respondents reported that Crunch&Sip® was promoted to students by
activities during special promotional weeks such as Crunch&Sip® week and Fruit ‘n’ Veg week at
least once a year.
Table 5: Promotion of the Crunch&Sip® Policy in schools
Promotion of the Crunch&Sip® policy to... Every term (n=152) %
At least once a year (n=152) %
Start of the year only (n=152) %
Never (n=152) %
Parents
School newsletter 53.3 28.3 13.8 2.0
Letter outlining Crunch&Sip policy 5.9 42.1 25.7 12.5
Note in students’ diaries 17.8 13.8 5.9 31.6
Teachers and staff
Staff meetings 39.5 25.7 30.3 2.6
Email 16.4 15.8 7.9 33.6
Notice board 21.7 33.6 13.8 13.8
Students
Oral reminders in class 47.4 13.8 32.2 2.6
Incentives program 27.0 31.6 5.9 19.7
Linked through curriculum during class 48.7 38.8 3.3 2.6
Activities during special weeks 27.0 61.8 0.7 3.9

10
eg. Crunch&Sip week, Fruit ‘n’ Veg week
Assembly 19.7 51.3 6.6 15.1
The three most commonly reported processes for informing new staff of the Crunch&Sip® policy at
schools were brochures, newsletter or policy documents (21.1%), the induction process (20.4%) and
by verbal communication (19.1%) (Table 6).
Table 6: Process for informing new staff and students about Crunch&Sip
n=152 %
Brochure/newsletter/policy documents 21.1
Induction process 20.4
Verbal communication 19.1
Verbal and written 10.5
Water bottles and verbal communication 3.9
Water bottle and written 2.6
Water bottles 1.3
Provide fruit and vegetables 0.7
The Crunch&Sip® break at School
The Crunch&Sip® break time varied from class to class in over 40% of schools surveyed (Table 7). The
most commonly reported whole of school time for the Crunch&Sip® break was before morning
recess (22.4%).
Table 7: When the Crunch&Sip® break is at school
n=152 %
It varies from class to class 41.4
Before morning recess 22.4
Throughout the day 14.5
Last period of the day 10.5
After morning recess 2.6
Straight after lunch 2.0
Other 5.9
The timeframe of the Crunch&Sip® break at school was also reported to have varied greatly from
class to class by almost 40% of respondents (Table 8).
Table 8: Timeframe / duration of Crunch&Sip® break at school
n=152 %
Varies greatly from class to class 38.2

11
Designated 10 minute break 29.6
Break takes place throughout the whole day, students can graze of fruit and vegetables as they please
13.8
Designated five minute break 10.5
Break takes place loosely over one period 5.9
Other 0.7
The most common response for what takes place during the Crunch&Sip® break was that the class
ate together at a set time (26.3%) (Table 9).
Table 9: What takes place during the Crunch&Sip® break?
n=152 %
Class eat together at set time 26.3
Stop class, children eat on their own 11.8
Free eating/grazing all day 11.2
Students eat during reading time or designated class time
10.5
Cut up and share fruit and vegetables at a set time
7.9
Varies – some classes have a set time, others graze
7.2
Unknown 6.6
Provide fruit and vegetable trays to class 4.6
Class grazes over set time 4.6
School eats together at set time 2.0
Students break individually 0.7
Crunch&Sip® participation rate by year group
The figure below (Figure 1) presents the average per class participation rate of consuming fruit or
vegetables and water during Crunch&Sip® (for each year group). The highest participation rates
were observed among the lowest year group (Kindergarten, Pre-primary and Year 1) for both fruit
and vegetables (84.4%) and water (86.6%). The lowest participation rates were among the highest
year group for both fruit and vegetables (66.2%) and water (70.4%).

12
Figure 1: Crunch&Sip® participation rate by year group
Food most commonly consumed during Crunch&Sip®
Respondents’ were given a range of six possible foods that children consumed for the Crunch&Sip
break and asked to rank what they observed was the most common (1), to the least common (6).
The proportions of what was ranked as the most common are presented in Figure 2. Fruit was the
most commonly consumed food with over half of respondents reporting fresh whole fruit (53.3%)
and about 40% reporting fresh chopped fruit as most common.
Figure 2: Most commonly consumed food during the Crunch&Sip® break
Food least commonly consumed for Crunch&Sip®
The figure below presents the proportion of respondents that rated the particular food as either ‘5’
or ‘6’ out of the possible six options given. Many respondents did not supply a ‘5’ or ‘6’ rating for this

13
question and so only 70.8% of schools are represented here. The least commonly consumed foods
during Crunch&Sip® were canned fruit in natural juice (27.1%) and dried fruit (26.1%).
Figure 3: Least commonly consumed food during the Crunch&Sip® break
Prevalence of dried fruit for Crunch&Sip®
The table below presents the proportion of respondents, in specified subgroups, reporting that dried
fruit was among the three most commonly consumed foods for Crunch&Sip®. Schools located in the
Perth metropolitan area and of a high SES demographic had the highest prevalence of dried fruit for
Crunch&Sip®. These differences were not statistically significant.
Table 10: How often is dried fruit among the three most commonly consumed foods
for Crunch&Sip®
n %
Location
Perth Metropolitan Area 11 18.3
Country/Rural 8 14.5
Socioeconomic status
Low 6 15.8
Medium 7 12.3
High 6 35.3
Proportion of students regularly bringing fruit and vegetables for the Crunch&Sip®
break
Respondents were asked on average, what proportion of students regularly brings fruit and
vegetables for the Crunch&Sip® break. The results are presented as a proportion of the self-reported

14
SES group of the school in Figure 4. Overall, 43% of respondents reported that more than 80% of
students regularly brought fruit and vegetables, about 30% reported between 60% and 80% of
students and 21% reported less than 60% of students (data not shown). Nearly 70% of respondents
from high SES schools reported that more than 80% of their students regularly bring in fruit and
vegetables for the break, significantly more than that reported by respondents from low SES schools
(19.6%) (p<0.001). Over one third of respondents from low SES schools reported that less than 60%
of students regularly bring in fruit and vegetables for the Crunch&Sip® break.
Figure 4: Proportion of students from low, medium and high SES schools regularly
bringing fruit and vegetables for the Crunch&Sip® break
* Denotes a statistically significant difference between Low SES and Medium SES
^ Denotes a statistically significant difference between Low SES and High SES
Participation rates for Crunch&Sip® by location and socio-economic status of the
school
The table below presents the average class participation rates for consuming fruit and vegetables
and water during Crunch&Sip®, by location and socio-economic status of the school. Country or rural
schools had a significantly higher average participation level for fruit and vegetables (82.3%) than
Perth metropolitan schools (75.0%). Low SES schools had a significantly lower average participation
level for fruit and vegetables (73.5%) than both medium SES schools (80.0%) and high SES schools
(82.6%). There were no statistically significant differences between groups for the average
participation level for water.
*
*
*^
* ^
^

15
Table 11: Participation rates for Crunch&Sip® by location and socio-economic status
of the school
n
Participation rate
Fruit and vegetables Water % %
Location
Perth Metropolitan Area 70 75.0* 78.2
Country/Rural 58 82.3* 83.1
Socioeconomic status
Low 42 73.5*^ 77.5
Medium 62 80.0* 81.7
High 20 82.6^ 81.6 * and ^ denote a statistically significant difference between groups (p<0.05)
Most common reason for students not bringing fruit or vegetables to school for the
Crunch&Sip® break
Respondents ranked a series of suggested reasons for students not bringing in fruit and vegetables
for the Crunch&Sip® break from most (1) to least (7) common. These results are reported as a
proportion of subgroup categories (Table 12). Slightly more respondents from the Perth
metropolitan area than country/rural areas reported students forgetting as the most common
reason for not bringing fruit and vegetables for Crunch&Sip®. Lack of parental support and financial
issues were more commonly reported among respondents from low SES schools than other SES
groups.
Table 12: Most common reasons for students not bring fruit and vegetables for
Crunch&Sip®
n %
Students forget
Location
Perth Metropolitan Area 41 61.2
Country/Rural 31 56.4
Socioeconomic status
Low 17 40.5
Medium 42 67.7
High 12 80.0
Years since the school became certified for Crunch&Sip®
< 1 year (2008) 21 65.6
1-2 years (2007) 25 58.1
2+ years (2006 or 2005) 20 52.6
Lack of parental support

16
Location
Perth Metropolitan Area 20 31.3
Country/Rural 13 26.0
Socioeconomic status
Low 16 39.0
Medium 10 17.5
High 6 46.2
Years since the school became certified for Crunch&Sip®
< 1 year (2008) 7 22.6
1-2 years (2007) 11 29.7
2+ years (2006 or 2005) 12 31.6
Financial issues
Location
Perth Metropolitan Area 11 19.6
Country/Rural 9 20.0
Socioeconomic status
Low 14 31.1
Medium 3 6.3
High 2 28.6
Years since the school became certified for Crunch&Sip®
< 1 year (2008) 7 25.0
1-2 years (2007) 9 25.0
2+ years (2006 or 2005) 3 9.7
Lack of reminding by teachers
Location
Perth Metropolitan Area 5 10.0
Country/Rural 4 10.0
Socioeconomic status
Low 4 11.4
Medium 4 8.7
High 1 16.7
Years since the school became certified for Crunch&Sip®
< 1 year (2008) 2 8.0
1-2 years (2007) 4 13.8
2+ years (2006 or 2005) 3 9.7
Students don’t like fruit or vegetables
Location
Perth Metropolitan Area 4 7.5
Country/Rural 5 11.6
Socioeconomic status

17
Low 2 5.7
Medium 7 14.0
High 0 0.0
Years since the school became certified for Crunch&Sip®
< 1 year (2008) 1 3.7
1-2 years (2007) 3 9.4
2+ years (2006 or 2005) 4 12.9
Poor availability of fruit and vegetables in the area
Location
Perth Metropolitan Area 0 0.0
Country/Rural 7 16.3
Socioeconomic status
Low 1 2.9
Medium 6 14.6
High 0 0.0
Years since the school became certified for Crunch&Sip®
< 1 year (2008) 2 8.7
1-2 years (2007) 2 7.7
2+ years (2006 or 2005) 3 9.7
Poor quality of fruit and vegetables in the area
Location
Perth Metropolitan Area 0 0.0
Country/Rural 2 5.9
Socioeconomic status
Low 1 3.4
Medium 1 2.9
High 0 0.0
Years since the school became certified for Crunch&Sip®
< 1 year (2008) 2 10.0
1-2 years (2007) 0 0.0
2+ years (2006 or 2005) 0 0.0
How schools address the issue of access to fruit and vegetables
Respondents were asked an open-ended question on what is done at their school to address the
issue of ‘access’ (i.e. students regularly not bringing fruit of vegetables for the Crunch&Sip® break).
Donations or consideration in the school budget and reminders were the most common methods
(17.8%) and also cutting up the fruit and vegetables so that others can share (15.8%).
Table 13: How schools address the issue of access to fruit and vegetables

18
n=152 %
Donations or school budget for fruit and vegetables
17.8
Reminders 17.8
Cut up and share fruit and vegetables 15.8
Not an issue 9.9
Provide fruit and vegetables for certain students
6.6
Fruit from Foodbank, Breakfast Club, Red Cross 5.3
Provided for students that forget and reminder is sent home
3.9
Incentives to bring fruit and vegetables 3.9
School garden provides 2.0
Unknown 2.0
Access to fruit and vegetables at school canteen 1.3
Respondents were asked specifically if their school had a budget for Crunch&Sip® and if their school
participated in the Food Bank School Breakfast Program. Responses to these have been presented as
a proportion of subgroups in Table 14. A larger proportion of Perth Metropolitan schools (29.6%)
were reported to have a budget than Country/Rural schools (20.6%). Over half of the schools from
low SES demographic were reported to participate in the Food Bank’s School Breakfast Program
(56.9%)
Table 14: Schools with a budget for Crunch&Sip® and participation in the Food Bank’s
School Breakfast Program
School has a budget for Crunch&Sip®
n %
School participates in Food Bank’s School Breakfast Program
n %
Location
Perth Metropolitan Area 24 29.6 19 23.5
Country/Rural 14 20.6 14 19.7
Socioeconomic status
Low 15 30.0 29 56.9
Medium 17 23.6 4 5.5
High 5 20.8 0 0.0
Years since the school became certified for Crunch&Sip®
< 1 year (2008) 9 23.1 10 25.6
1-2 years (2007) 14 26.4 10 18.2
2+ years (2006 or 2005) 13 26.5 13 26.5
19
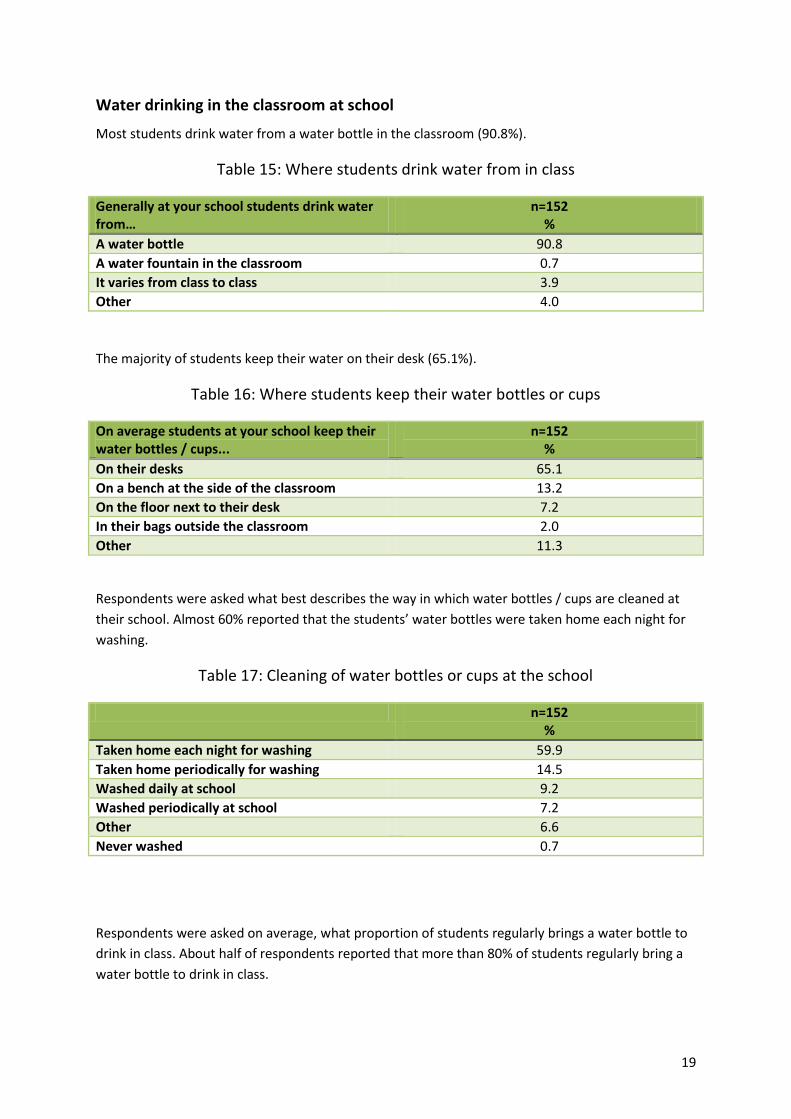
Water drinking in the classroom at school
Most students drink water from a water bottle in the classroom (90.8%).
Table 15: Where students drink water from in class
Generally at your school students drink water from…
n=152 %
A water bottle 90.8
A water fountain in the classroom 0.7
It varies from class to class 3.9
Other 4.0
The majority of students keep their water on their desk (65.1%).
Table 16: Where students keep their water bottles or cups
On average students at your school keep their water bottles / cups...
n=152 %
On their desks 65.1
On a bench at the side of the classroom 13.2
On the floor next to their desk 7.2
In their bags outside the classroom 2.0
Other 11.3
Respondents were asked what best describes the way in which water bottles / cups are cleaned at
their school. Almost 60% reported that the students’ water bottles were taken home each night for
washing.
Table 17: Cleaning of water bottles or cups at the school
n=152 %
Taken home each night for washing 59.9
Taken home periodically for washing 14.5
Washed daily at school 9.2
Washed periodically at school 7.2
Other 6.6
Never washed 0.7
Respondents were asked on average, what proportion of students regularly brings a water bottle to
drink in class. About half of respondents reported that more than 80% of students regularly bring a
water bottle to drink in class.

20
Table 18: Proportion of students that regularly bring a water bottle to drink in class
n=152 %
More than 80% 48.0
Between 60% and 80% 31.6
Less than 60% 16.5
Fruit, vegetable and water intake
Respondents were asked if, since introducing Crunch&Sip®, the students’ intake of fruit, vegetables
and water had changed (Table 19). The vast majority of respondents reported that student intake
was ‘more’ for fruit (92.1%), vegetables (77.6%) and water (86.2%).
Table 19: Change in Fruit, vegetable and water intake since introducing Crunch&Sip®
n=152 %
Fruit intake
More 92.1
Less 0.7
About the same 2.6
Unsure 3.9
Vegetable intake
More 77.6
Less 0.0
About the same 11.2
Unsure 9.2
Water intake
More 86.2
Less 0.0
About the same 10.5
Unsure 2.0
Beliefs on the impact of Crunch&Sip®
Respondents were given a series of belief statements on the impact of the Crunch&Sip® policy. The
results of those who ‘strongly agreed’ are presented as a proportion of subgroups in Table 20. Larger
proportions of respondents from schools in the Perth metropolitan area (than from Country/rural
schools) strongly agreed with all six statements, however the difference only reached statistical
significance for “Crunch&Sip® provides health benefits to students”. Similarly, more respondents from
Schools with a high SES demographic strongly agreed with all six statements than respondents in
other SES categories, though none of these differences were statistically significant.
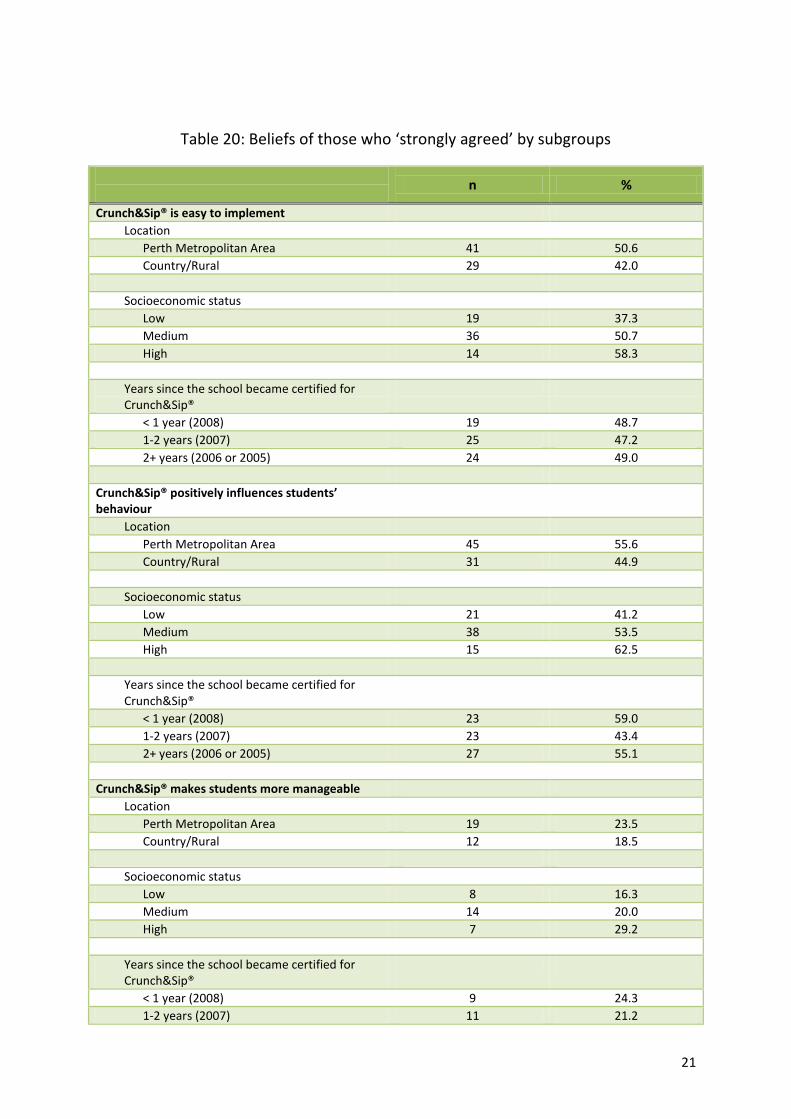
21
Table 20: Beliefs of those who ‘strongly agreed’ by subgroups
n %
Crunch&Sip® is easy to implement
Location
Perth Metropolitan Area 41 50.6
Country/Rural 29 42.0
Socioeconomic status
Low 19 37.3
Medium 36 50.7
High 14 58.3
Years since the school became certified for Crunch&Sip®
< 1 year (2008) 19 48.7
1-2 years (2007) 25 47.2
2+ years (2006 or 2005) 24 49.0
Crunch&Sip® positively influences students’ behaviour
Location
Perth Metropolitan Area 45 55.6
Country/Rural 31 44.9
Socioeconomic status
Low 21 41.2
Medium 38 53.5
High 15 62.5
Years since the school became certified for Crunch&Sip®
< 1 year (2008) 23 59.0
1-2 years (2007) 23 43.4
2+ years (2006 or 2005) 27 55.1
Crunch&Sip® makes students more manageable
Location
Perth Metropolitan Area 19 23.5
Country/Rural 12 18.5
Socioeconomic status
Low 8 16.3
Medium 14 20.0
High 7 29.2
Years since the school became certified for Crunch&Sip®
< 1 year (2008) 9 24.3
1-2 years (2007) 11 21.2

22
2+ years (2006 or 2005) 9 18.8
Crunch&Sip® supports teachers to deliver nutrition curriculum
Location
Perth Metropolitan Area 39 48.1
Country/Rural 28 41.2
Socioeconomic status
Low 19 37.3
Medium 32 45.7
High 14 58.3
Years since the school became certified for Crunch&Sip®
< 1 year (2008) 17 44.7
1-2 years (2007) 25 47.2
2+ years (2006 or 2005) 24 49.0
Crunch&Sip® provides health benefits to students
Location
Perth Metropolitan Area 60 74.1*
Country/Rural 40 58.0*
Socioeconomic status
Low 31 60.8
Medium 49 69.0
High 16 66.7
Years since the school became certified for Crunch&Sip®
< 1 year (2008) 26 66.7
1-2 years (2007) 35 66.0
2+ years (2006 or 2005) 35 71.4
Crunch&Sip® provides education benefits to students
Location
Perth Metropolitan Area 44 54.3
Country/Rural 32 47.8
Socioeconomic status
Low 23 45.1
Medium 39 55.7
High 13 54.2
Years since the school became certified for Crunch&Sip®
< 1 year (2008) 21 55.3
1-2 years (2007) 27 50.9
2+ years (2006 or 2005) 25 52.1
* Denotes a statistically significant difference between groups (p<0.05)

23
Crunch&Sip® resources used
Respondents were given a range of Crunch&Sip® resources that are provided and indicated whether
their school had used them. Over half of schools had used each resource listed in Table 21. The most
commonly used resource was the water bottle (94.1%).
Table 21: Crunch&Sip® resources used
n=152 %
Water bottle 94.1
Brochure 84.9
Crunch&Sip website 77.0
Curriculum activities from Fruit ‘n’ Veg® week website
70.4
Tally charts 66.4
Bookmark 66.4
Curriculum activities from Crunch&Sip® website 64.5
Curriculum activities from Go for 2&5® website 61.8
Most liked about Crunch&Sip®
Respondents were provided an opportunity to comment on what they liked best about the
Crunch&Sip® policy at their school. The grouped responses are shown in Figure 5. The most
commonly ‘liked’ aspect was around promoting health and feeling satisfaction that the children
were getting fruit and vegetables (48.7%).
Figure 5: Most liked about Crunch&Sip®

24
Respondent’s comments on “...what like best”
“Provides and encourages children with the opportunity to eat fruit and vegetables each day.
Students incidentally learn the educational benefits of eating fruit and vegetables and realise they
can taste quite nice.”
“Students now eat vegetables they previously did not like”
“Water bottles, advertising, teaching support materials”
“Easy to implement – doesn’t require too much teacher time”
“Students initiating the best ‘time’ in their class. Their excitement – they ALWAYS remember”
“Sharing time – only 19 students in total – good time for teaching social skills”
Least liked about Crunch&Sip®
The most commonly reported ‘least’ liked aspect was around the inconvenience in the classroom of
cleaning up messy fruit and children requiring more frequent toilet trips (12.5%), followed by the
difficulties of supply of fruit and vegetables for children (11.2%) (Figure 6).
Figure 6: Least liked about Crunch&Sip®

25
Respondent’s comments on “...what like least”
“Parents who do not support the program or encourage their children to eat fruit and vegetables”
“Prompting parents to send only appropriately healthy snacks – some hostility from parents about
‘what is a healthy snack’ especially if child is not willing to eat fruit or vegetables”
“Some days it is hard to fit everything in”
“Fruit is so expensive. Activities can be costly, parents are always asked for donations.”
“The problem of receiving good quality fruit and vegetables in a remote area”
“Only getting to Port Hedland about once a fortnight to get fresh fruit”
“Some children never bring fruit and vegetables in”
Additional steps taken by respondents
Respondents described additional steps they took to support Crunch&Sip® and these responses
were coded into nine categories shown in Figure 7. The two most commonly reported additional
steps taken were holding events or activities and actually providing fruit for children.
Figure 7: Additional steps taken to support Crunch&Sip®

26
Respondent’s comments on “...any additional steps you have taken to support
Crunch&Sip®”
“Purchase of resources from health budget. Children create posters for school viewing to promote
Crunch&Sip regime, school plays, assembly.”
“Planted vege garden at school with students doing the work. Produce then distribute throughout the
school”
“Parent workshop, newsletter home, mystery fruit and vegetable competition”
Additional support needed
Respondents were also asked to describe any additional support they need to support Crunch&Sip®
and these responses were grouped into five categories shown in Figure 8. Respondents most
commonly expressed how useful more promotional materials would be for motivating the children,
as well as the need for support in coordinating Crunch&Sip® at the school (15.1%).
Figure 8: Additional support needed to support Crunch&Sip®
27
Respondent’s comments on “...any additional support you need to support
Crunch&Sip®”
“Would be great if brochures and additional water bottles were sent to schools early Term 1 to
ensure newcomers and youngest children can be involved right from the star.”
“Some different incentives or promotional items for when enthusiasm wanes – usually when our local
shop only has green apples and carrots!”
“Any help to revitalise the program and to encourage all teachers to participate.”
“Funding for “Kickstart” was a great bonus. Different ways to present message to those still not
‘hearing’ it.”
Other comments
“Fantastic program. Should be in every school.”
“Students enjoy Crunch&Sip and it is well supported by parents. School is keen to continue program”
“Great concept and changing student ideas of good choice and selecting healthy foods.”
“It is interesting to look at the participation rates – it has identified that we need to focus on years 5-
7 as the participation rates are low.”
“Thanks for all your support, keep up the great work and promotion of this worthwhile initiative.”
Classroom Participation Tally Charts
Respondents completed a tally chart of the number of students in their class consuming a piece of
fruit or vegetable, and consuming water, during the Crunch&Sip® break. The tallies were completed
on any three days of a given school week.
The mean proportion of students in each class eating fruit and vegetables during the
Crunch&Sip® break was 74.4% per day (averaged across the three reported days).
The mean proportion of students in each class drinking water during the Crunch&Sip® break
was 77.7% per day (averaged across the three reported days).
The table below presents the average class participation rates for consuming fruit and vegetables
and water during Crunch&Sip, by location and socio-economic status of the school. Country or rural
schools had a significantly higher average participation level for fruit and vegetables (82.3%) than
Perth metropolitan schools (75.0%). Low SES schools had a significantly lower average participation
level for fruit and vegetables (73.5%) than both medium SES schools (80.0%) and high SES schools
(82.6%). There were no statistically significant differences between groups for the average
participation level for water.

28
n
Participation rate
Fruit and vegetables Water % %
Location
Perth Metropolitan Area 70 75.0* 78.2
Country/Rural 58 82.3* 83.1
Socioeconomic status
Low 42 73.5*^ 77.5
Medium 62 80.0* 81.7
High 20 82.6^ 81.6 * and ^ denote a statistically significant difference between groups (p<0.05)