cruise ship plume tracking survey report - us epa · pdf fileii acknowledgements the u.s....
TRANSCRIPT

Cruise Ship PlumeTracking Survey
Report

ii
Acknowledgements
The U.S. Environmental Protection Agency (EPA), Office of Water prepared this Cruise ShipPlume Tracking Survey Report. The EPA’s Ocean Survey Vessel Peter W. Anderson(Anderson) was used as the platform to conduct operations. Appreciation is extended to the crewof the Anderson, as contracted by Metson Marine, Inc., in the management of ship operationsand Battelle for assistance in the design and implementation of sampling protocols. RoyalCaribbean and Carnival Cruise Lines were most accommodating in providing access to cruiseships and working with EPA personnel to assure the sampling protocols would be successfullycoordinated and performed with their vessels.
Special Appreciation is accorded to the following individuals whose technical expertise andassistance made this report successful.
David Redford, EPA Office of WaterKennard Potts, EPA Office of WaterRobert Howard, EPA Region IVNancy Wheatley, Royal Caribbean Cruise LinesWilliam Wright, Royal Caribbean Cruise LinesJim Walsh, Carnival Cruise LinesElaine Heldewier, Carnival Cruise LinesKenwyn George, State of AlaskaDon Kim, AMSEC,LLCStan Deno, International Council of Cruise Lines
Office of WaterOffice of Wetlands, Oceans, and WatershedsEPA842-R-02-001www.epa.gov/owow/oceans/September 2002

iii
TABLE OF CONTENTS
1. Introduction………………………………………………………………………………….12. Methods……………………………………………………………………………………...3
2.1 Vessel Specifications and Test Conditions for Cruise Ships………………………….32.2 Methods Description…………………………………………………………………..3
3. Survey Results and Discussion……………………………………………………………... 74. Findings and Conclusions………………………………………………………………….175. References………………………………………………………………………….………18
LIST OF TABLES
Table 1. Survey Party and Responsibilities……………………………………………………. 1Table 2. Vessel Specifications and Test Conditions for Cruise Ship……………………………. 4Table 3. Summary of Field Instrument Measurements…………………………………………. 5Table 4. Numbers of Samples Collected and Plume Tracking Transects Completed…………….6Table 5. Analyte, Sampling Method, Volume, Preservation, and Holding Times……………….. 7Table 6. Locations of Buoys Deployments from Cruise Ships and Buoy Retrieval by the OSV
Anderson During Each Plume Tracking Event..………………………………………... 8Table 7. Average Dye Concentrations in Each Transect for Each Cruise Ship………………… 15Table 8. Calculated and Measured Dye Concentrations and Dilutions for Each of the Four
Cruise Ships……………………………………………………………………………. 17
LIST OF FIGURESFigure 1. Miami, FL, Offshore Study Area Showing Tracks of the OSV Anderson Through the
Plumes of Each of Four Cruise Ships Monitored…………………………………….. 2Figure 2. Background and Plume Tracking Transects and Sampling Locations for M/S Majesty,
August 10, 2001……………………………………………………………………… 10Figure 3. Background and Plume Tracking Transects and Sampling Locations for M/S
Explorer, August 11, 2001…………………………………………………………… 11Figure 4. Background and Plume Tracking Transects and Sampling Locations for M/S
Paradise, August 12, 2001…………………………………………………………... 12Figure 5. Background and Plume Tracking Transects and Sampling Locations for M/S
Fascination, August 13, 2001……………………………………………………….. 13Figure 6. Current Profile Data Taken Aboard the Explorer and Provided by the NOAA Office
in Miami, FL………………………………………………………………………… 14

iv
APPENDICES
Appendix A: Drifter Tracks Three of the Four Cruise Ships MonitoredAppendix B: Sampling Log TableAppendix C: Ship Tracks Showing Dye 2 Concentrations vs. Depth using Color CodesAppendix D: Time Series Plots of Depth vs. Dye for Each Cruise Ship/Plume TrackedAppendix E: Scatter Plots of Dye 2 Concentration vs. DepthAppendix F: Discrete Dye Sample DataAppendix G: Calculations for Calculated vs. Measured Dye Dilutions for Each Cruise Ship

1
1. Introduction
The U. S. Environmental Protection Agency (EPA) is developing a Cruise Ship DischargeAssessment Report in response to a petition the agency received in March 2000. The petitionrequested that EPA assess and where necessary control discharges from cruise ships. Commentsreceived during public hearings, in 2000, resulted in the EPA agreeing to conduct a survey toassess the discharge plumes resulting from cruise ships, operating in ocean waters off the Floridacoast and to compare the results to the Alaska dispersion models.
The EPA conducted a survey to track and quantify the plume dilution and dispersal, offshoreMiami, Florida (Figure 1), and within the normal transit lanes for cruise ships operating out ofMiami, on August 7-15, 2001. The survey was conducted aboard the U.S. EnvironmentalProtection Agency’s Ocean Survey Vessel Peter W. Anderson (OSV Anderson). The surveyparticipants along with affiliation and survey responsibility are listed in Table 1. Mobilizationfor the survey was conducted at the U.S. Coast Guard Base in Miami, Florida on August 7, 8 and9, 2001.
Table 1. Survey Party and Responsibilities.Name Affiliation Survey Responsibility Survey Dates
Dave Redford EPA Headquarters Chief Scientist Aug 7-14, 2001Ken Potts EPA Headquarters Work Assignment Manager Aug 7-14, 2001Wayne Trulli Battelle Battelle Lead Scientist Aug 7-14, 2001Bob Mandeville Battelle BOSS Operator Aug 7-14, 2001Stacy Abramson Battelle Sampling Technician Aug 7-14, 2001Tim Kaufman Battelle Winch operator Aug 7-14, 2001Brandy Curtis Battelle Sampling technician Aug 7-14, 2001Kenwyn George Alaska DEC Observer Aug 10-13, 2001Bob Howard EPA Region IV Observer Aug 10-13, 2001Don Kim AMSEC Observer Aug 10-13, 2001Stan Demo ICCL Observer Aug 10-13, 2001
EPA worked with the International Council of Cruise Lines to identify cruise ships, theirlocation, transit routes and sailing schedules, and to coordinate with the needs of the survey.EPA worked closely with Royal Caribbean Cruise Lines and Carnival Cruise Linesrepresentatives and ship personnel to understand the complexities of identifying holding tanks,and to coordinate the addition of dye to tanks, and the discharge of dye and drogues. The bridgeofficers from the OSV Anderson and cruise ships also met to discuss protocols of handling theships while in close proximity of each other.
The dye plumes of four cruise ships were monitored: the Majesty of the Seas, the Explorer of theSeas, the Paradise, and the Fascination. The Majesty of the Seas and the Explorer of the Seasfrom Royal Caribbean Cruise Lines were monitored on August 10 and 11, respectively; and the
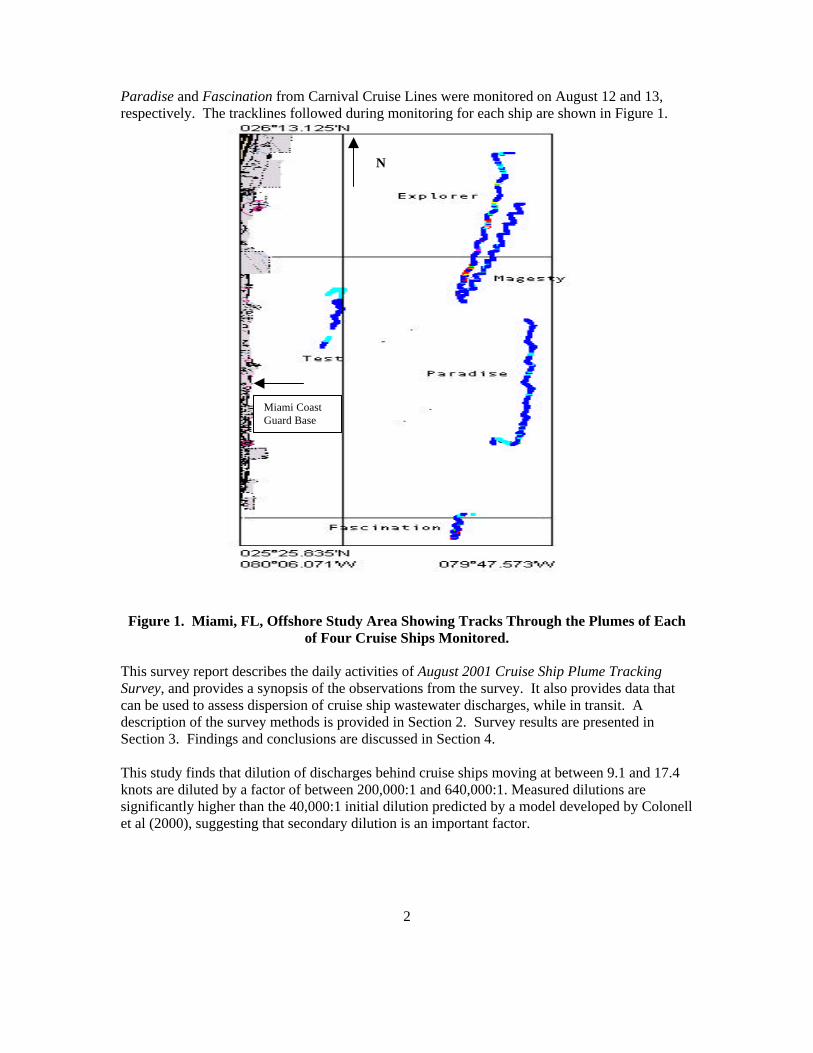
2
Paradise and Fascination from Carnival Cruise Lines were monitored on August 12 and 13,respectively. The tracklines followed during monitoring for each ship are shown in Figure 1.
Figure 1. Miami, FL, Offshore Study Area Showing Tracks Through the Plumes of Eachof Four Cruise Ships Monitored.
This survey report describes the daily activities of August 2001 Cruise Ship Plume TrackingSurvey, and provides a synopsis of the observations from the survey. It also provides data thatcan be used to assess dispersion of cruise ship wastewater discharges, while in transit. Adescription of the survey methods is provided in Section 2. Survey results are presented inSection 3. Findings and conclusions are discussed in Section 4.
This study finds that dilution of discharges behind cruise ships moving at between 9.1 and 17.4knots are diluted by a factor of between 200,000:1 and 640,000:1. Measured dilutions aresignificantly higher than the 40,000:1 initial dilution predicted by a model developed by Colonellet al (2000), suggesting that secondary dilution is an important factor.
N
Miami Coast Guard Base
3
2. MethodsThe following subsections briefly summarize the methods used during this survey. Thecombined work/quality assurance project plan (W/QAPP) for Cruise Ship Sampling (Battelle2001)1 contains additional details on survey sampling methods.
2.1. Vessel Specifications and Test Conditions for Cruise Ships
The vessels provided a range of study platforms in terms of vessel sizes, types, and rates ofdischarge studied. Table 2 lists each vessel’s specifications as they pertain to the study.
2.2. Method Descriptions:
Navigation. Vessel positioning during sampling operations was accomplished using the OSVAnderson Differential Global Positioning System (DGPS) interfaced to Battelle’s NavSam©navigation system. The DGPS receiver has six dedicated channels and is capable of locking ontosix different satellites at one time. To correct the Global Positioning System (GPS) calculations,the DGPS receives correction data from one of the United States Coast Guard DGPS broadcastsites in Florida: Key West, Virginia Key, Cape Canaveral, Macdill AFB, and Egmont Key. Thiscapability ensured strong signal reception, and accurate and reliable positioning with 2-secondupdates. The DGPS was operated and maintained according to the operator’s manual.
A calibration check of the navigation system vs. known benchmarks was conducted twice dailyto verify that the system was working properly. The checks were conducted prior to departingthe dock and following arrival at the dock during daily operations.
Plume Tracking Using the Battelle Ocean Sampling System. Plume tracking was conductedusing the Battelle Ocean Sampling System (BOSS) deployed from the OSV Anderson. Threetypes of plume tracking activities were conducted during the survey: a shakedown survey, fourbackground surveys conducted on each survey day for each of the four ships, and the four plumetracking surveys. Each type of survey is briefly discussed below.
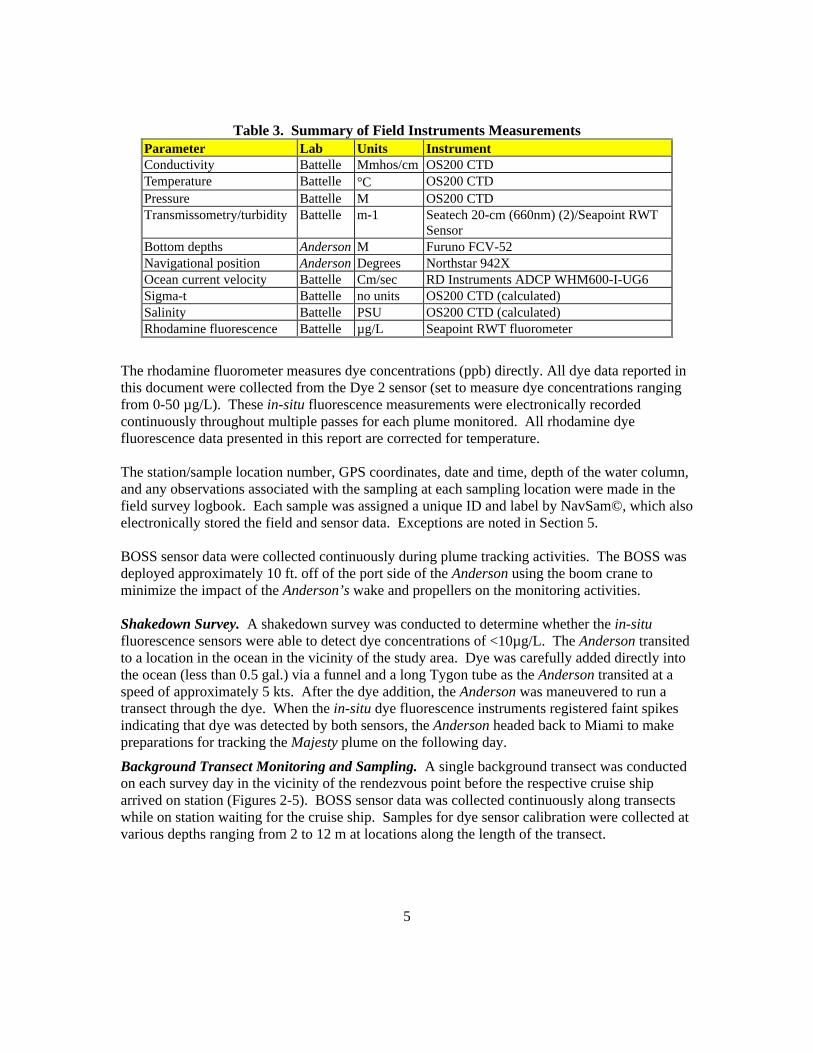
The towfish with in situ sensor package (BOSS) was used to conduct all of the plume trackingactivities. The sensor package included a conductivity, temperature, depth (CTD) sensor, and afluorescence sensor (set at 0-5µg/L – referred to as Dye 1). A second fluorescence sensor (set at0-50µg - referred to as Dye 2), was used in case concentrations exceeded the range of the firstsensor. Table 3 lists the field measurements acquired from the BOSS during each monitoringevent.
1 Battelle. 2001. Work/Quality Assurance Project Plan for Cruise Ship Sampling. Prepared for U.S. EnvironmentalProtection Agency Oceans and Coastal Protection Division, Washington, DC. Contract No. 68-C-00-121, WorkAssignment 1-23. 33pp+apps.

4
Table 2. Vessel Specifications and Test Conditions for Cruise Ships.
Most of the data were provided by the cruise lines.Specification or Test Condition Cruise Ship
Majesty Explorer Paradise FascinationVessel Specifications
Length/Beam 268.3m/32.6m 311.13m/38.6m 260.6/31.4 260.6/31.4Draft to lowest tip of screws 7.50 m 8.80 m 7.75 m 1.5 mDraft to bottom of ship 7.70 m 8.80 m 7.75 m 7.75 mSize of tank in study 220 m3 25.9 m3 175 m3 30 m3
Type of tank Gray water Black water Gray water Gray water/ laundryLocation of discharge port N/A DN 150
FRAME 75-76Starboard, frame 136 Port side, frame 32
Vertical depth 5.6 m 6.4 6 m 6.35 mDistance from bow ~172.36 m from
forward PP225 m 146 m at waterline 200.8 m at waterline
Distance from stern ~65.64 m from aft PP 66.6 m 114.6 m at waterline 59.8 m at waterlineDistance from screws 54.25 m 57.6 m 99.8 m ~15.2+mDistance from keel 1.9 m 2.4 m 55.16 m 28.81 mDistance from water line 5.6 m 6.4 m 6 m 1.25 mSize of discharge pipe andthrough-hull fitting
203 mm 203 mm 200 mm 88.9 mm
Discharge pump rate (rated) 220 m3/hr 50 m3/h 50 m3/hr 50 m3/hrNumber of propellers 2 3 2 2Diameter of propellers 4.9 m (4 blades) 5.4 m fixipod
5.6 m azipods5.2 m Azipods 5.2 m
Direction of propeller rotation (aftview)
CW (port)CC (starboard)
CC (starboard)CW (port)CW (fixipod)
CC (port)CW (starboard)
CC (port)CW (starboard)
Test ConditionsVessel speed during test:Speed Over Water (SOW)
17.4 knots 19 knots 15.0 knots (seeSurvey Chronology)
9.1 knots (see SurveyChronology)
Volume of seawater added to tank 113 m3 gray wateronly
16.6 m3 108 m3 gray wateronly
27 m3 gray/ freshwater
Volume of test solution atdischarge Time Zero (T0)
113 m3 + 114 L dye(~0.1m3 dye)
18 m3 (includes133 L dye -~0.1m3 dye)
108 m3 + 133L dye(~0.1m3 dye)
27 m3 + 137L dye(~0.1m3 dye)
Date - Time discharge began (T0) 8/10/01 - 18:44 8/11/01 - 19:43 8/12/01 - 19:00 8/13/01 - 19:15Time discharge completed (Tend) 19:41 20:01 19:30 19:35Volume in tank when dischargecompleted (Tend)
7 m3 1.2 m3 40 m3 3 m3
Volume in tank after 20 min(calculated)
78 m3 ~1.2 m3 62.6 m3 ** 3 m3 ***
Number of pumps used todischarge water/dye solution for20 min.
1 0-20 min2 20+ min
1 2 1
Discharge rate of pump(s)(rated/actual)
220/112 m3/hr 50/56 m3/hr 50/68.0 m3/hr 50/72 m3/hr
Amount of dye in tank at T0 30 gal. 35 gal. 35 gal. 36 gal.
** Calculation: 108 m3 - 40 m3 = 68 m3 , and 68 m3 in 30 min pumping = 2.27 m3/min, then 2.27 m3/min * 20 min = 45.4 m3, and 108 m3 – 45.4m3 = 62.6 m3.***Calculation: 27 m3 - 3 m3 = 24 m3 , and 24 m3 in 20 min pumping = 1.2 m3/min, then 1.2 m3/min * 20 min = 24 m3, and 27 m3 – 24 m3 = 3m3.
5
Table 3. Summary of Field Instruments MeasurementsParameter Lab Units InstrumentConductivity Battelle Mmhos/cm OS200 CTDTemperature Battelle °C OS200 CTDPressure Battelle M OS200 CTDTransmissometry/turbidity Battelle m-1 Seatech 20-cm (660nm) (2)/Seapoint RWT
SensorBottom depths Anderson M Furuno FCV-52Navigational position Anderson Degrees Northstar 942XOcean current velocity Battelle Cm/sec RD Instruments ADCP WHM600-I-UG6Sigma-t Battelle no units OS200 CTD (calculated)Salinity Battelle PSU OS200 CTD (calculated)Rhodamine fluorescence Battelle µg/L Seapoint RWT fluorometer
The rhodamine fluorometer measures dye concentrations (ppb) directly. All dye data reported inthis document were collected from the Dye 2 sensor (set to measure dye concentrations rangingfrom 0-50 µg/L). These in-situ fluorescence measurements were electronically recordedcontinuously throughout multiple passes for each plume monitored. All rhodamine dyefluorescence data presented in this report are corrected for temperature.
The station/sample location number, GPS coordinates, date and time, depth of the water column,and any observations associated with the sampling at each sampling location were made in thefield survey logbook. Each sample was assigned a unique ID and label by NavSam©, which alsoelectronically stored the field and sensor data. Exceptions are noted in Section 5.
BOSS sensor data were collected continuously during plume tracking activities. The BOSS wasdeployed approximately 10 ft. off of the port side of the Anderson using the boom crane tominimize the impact of the Anderson’s wake and propellers on the monitoring activities.
Shakedown Survey. A shakedown survey was conducted to determine whether the in-situfluorescence sensors were able to detect dye concentrations of <10µg/L. The Anderson transitedto a location in the ocean in the vicinity of the study area. Dye was carefully added directly intothe ocean (less than 0.5 gal.) via a funnel and a long Tygon tube as the Anderson transited at aspeed of approximately 5 kts. After the dye addition, the Anderson was maneuvered to run atransect through the dye. When the in-situ dye fluorescence instruments registered faint spikesindicating that dye was detected by both sensors, the Anderson headed back to Miami to makepreparations for tracking the Majesty plume on the following day.
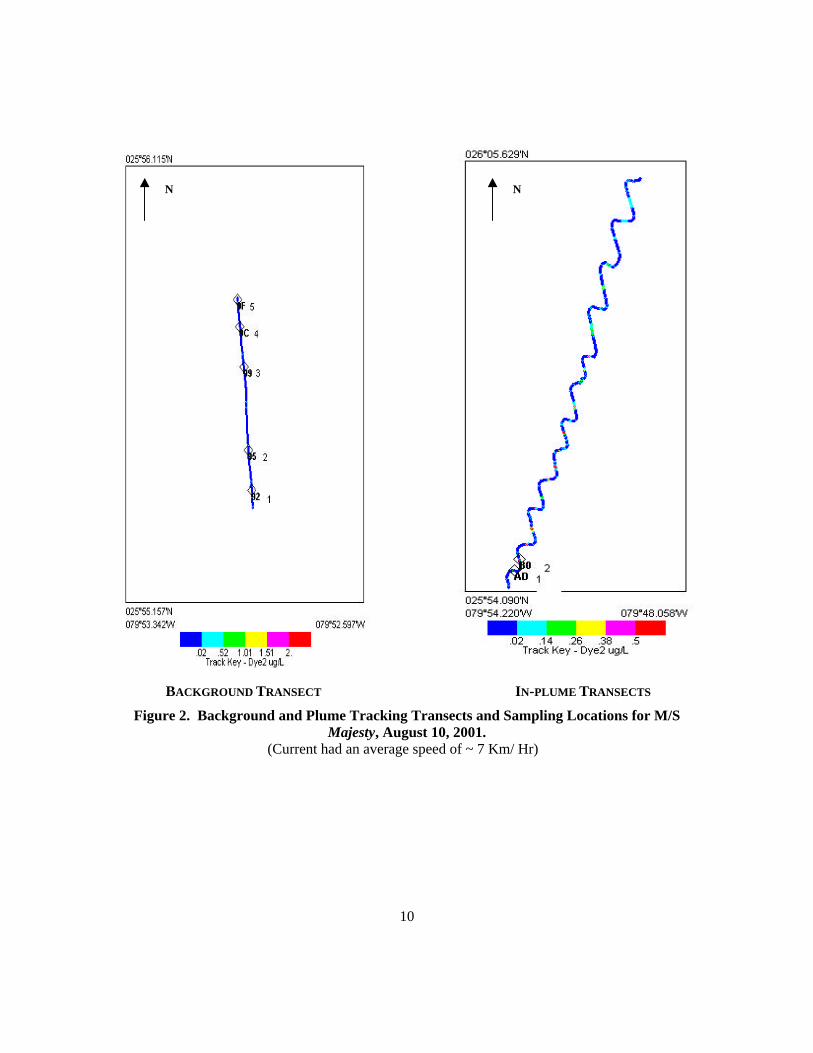
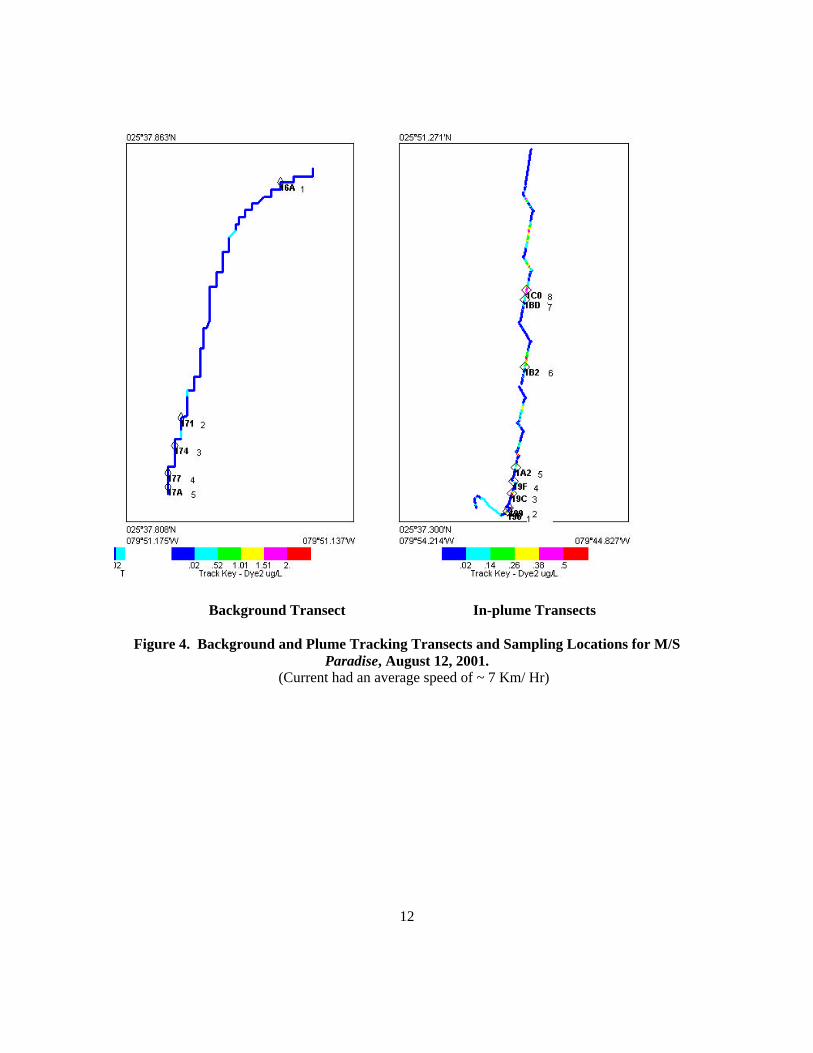
Background Transect Monitoring and Sampling. A single background transect was conductedon each survey day in the vicinity of the rendezvous point before the respective cruise shiparrived on station (Figures 2-5). BOSS sensor data was collected continuously along transectswhile on station waiting for the cruise ship. Samples for dye sensor calibration were collected atvarious depths ranging from 2 to 12 m at locations along the length of the transect.
6
Plume Transect Monitoring and Sampling. The transect configuration and the samplinglocations along each plume transect were different for each cruise ship. Each configurationvaried based on how the dye plume behaved in the existing currents after the dye was released.During the release of the dye from each cruise ship, drogued buoys equipped with lights andradar reflectors were released at approximately two-minute intervals (beginning when dyerelease was initiated) to permit easier tracking of the sub-surface plume. The drogues for eachbuoy were tethered ~2 m below the bottom of its associated buoy so that any existing surfacecurrents would carry the drogues along with the targeted plume. Buoys were used to aid intracking the plume. The deployment and retrieval locations were recorded by hand for allvessels except the Majesty.
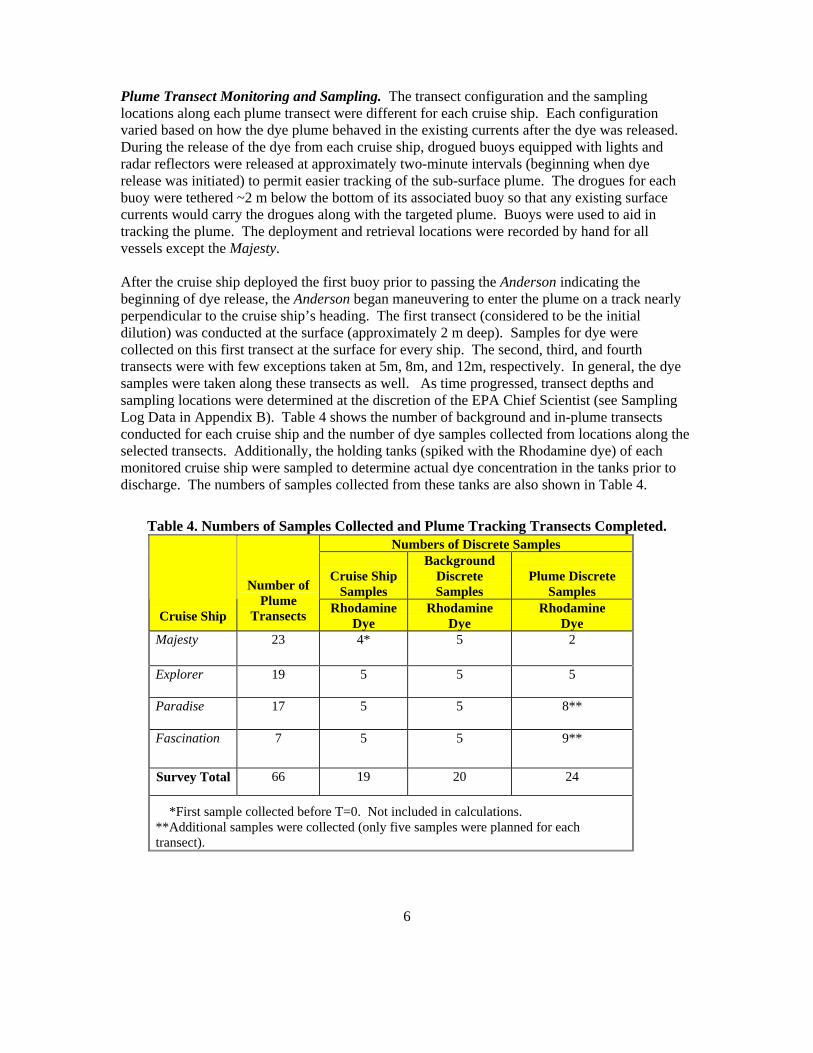
After the cruise ship deployed the first buoy prior to passing the Anderson indicating thebeginning of dye release, the Anderson began maneuvering to enter the plume on a track nearlyperpendicular to the cruise ship’s heading. The first transect (considered to be the initialdilution) was conducted at the surface (approximately 2 m deep). Samples for dye werecollected on this first transect at the surface for every ship. The second, third, and fourthtransects were with few exceptions taken at 5m, 8m, and 12m, respectively. In general, the dyesamples were taken along these transects as well. As time progressed, transect depths andsampling locations were determined at the discretion of the EPA Chief Scientist (see SamplingLog Data in Appendix B). Table 4 shows the number of background and in-plume transectsconducted for each cruise ship and the number of dye samples collected from locations along theselected transects. Additionally, the holding tanks (spiked with the Rhodamine dye) of eachmonitored cruise ship were sampled to determine actual dye concentration in the tanks prior todischarge. The numbers of samples collected from these tanks are also shown in Table 4.
Table 4. Numbers of Samples Collected and Plume Tracking Transects Completed.Numbers of Discrete Samples
Cruise ShipSamples
BackgroundDiscreteSamples
Plume DiscreteSamples
Cruise Ship
Number ofPlume
TransectsRhodamine
DyeRhodamine
DyeRhodamine
DyeMajesty 23 4* 5 2
Explorer 19 5 5 5
Paradise 17 5 5 8**
Fascination 7 5 5 9**
Survey Total 66 19 20 24
*First sample collected before T=0. Not included in calculations.**Additional samples were collected (only five samples were planned for eachtransect).

7
Average values of depth and dye concentration were taken along each transect for each cruiseship from the point where dye values exceeded background levels until they returned tobackground levels. Plume width measurements were also made using the same points forobtaining average depth and dye concentrations.
Additional samples, above the five planned dye samples, were taken during monitoringoperations for the Paradise and Fascination.
Upon survey completion, the samples were shipped in coolers containing ice to Battelle for finalanalysis. Before shipping, the sample custody forms were completed and placed in a sealedZiploc bag that was taped to the inside of the cooler lid. The Battelle Field Custodian, Mr. TimKaufman, shipped in-situ plume dye samples from Miami and received them at Battelle. Healso received sample shipments from the cruise lines for samples collected aboard the cruiseships.
Sample Storage Conditions. Discrete rhodamine dye samples collected aboard the cruise shipswere stored chilled at ~ 4ºC. Each cruise ship was provided a shipping cooler and giveninstructions to store and ship samples on ice. Additional sample storage conditions are presentedin Table 5.
Table 5. Analyte, Sampling Method, Volume, Preservation, and Holding Times.
Analyte (AnalyticalLaboratory)(a) Matrix Method
SampleVolume Container Type Preservation
HoldingTime
Laboratory AnalysesRhodamine dye(Battelle)
Water Seapoint RWTSensor
500 mL Polyethylene plastic Cool, ~ 4oC undetermined
Field AnalysesTemperature (BDO) Water OS200 CTD NA NA NA In situDepth (BDO) Water OS200 CTD NA NA NA In situTransmissometry/Turbidity (BDO)
Water Seatech 20-cm(660nm)
NA NA NA In situ
Conductivity (BDO) Water OS200 CTD NA NA NA In situ
(a) BDO: Battelle Duxbury OperationsNA = Not applicable.
Acoustic Doppler Profiles. Current data from an acoustic Doppler current profiler (ADCP) onboard Royal Caribbean Cruise Line’s Explorer was obtained from NOAA. This data wascollected during transit through the site during the plume tracking survey on August 11.
3. Survey Results and Discussion
All plume tracking and sampling operations were successfully completed over the targeted 4-dayperiod (spanning August 10-14) during which four separate cruise ship discharge plumes werecontinuously monitored and sampled. Numbers of transects conducted and samples collected arepresented in Table 4.

8
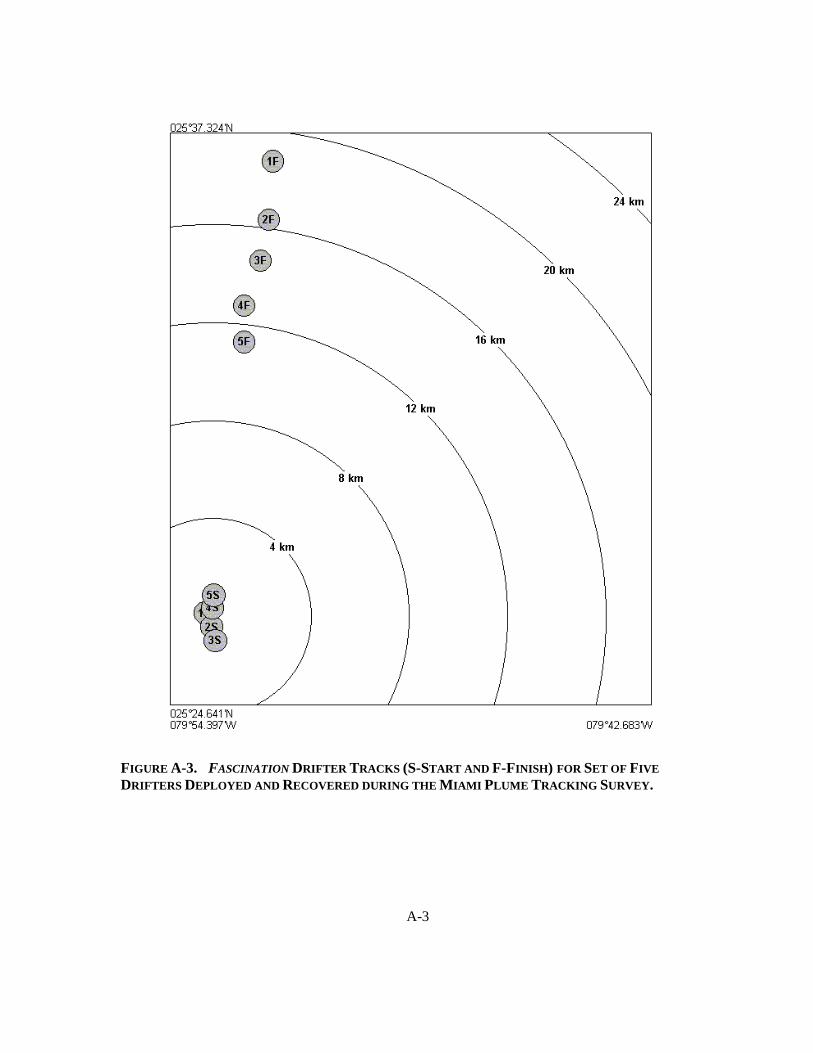
Drogues. The initial and final locations for the drogues are shown in Appendix A and listed inTable 6. The figures in Appendix A indicate that the drogues drifted almost due north at anaverage speed of 7 Km/Hr and distances ranging from 12 to 20 km for the Fascination to 30 to34 km for the Explorer and Paradise over the three to five hour sampling periods. The fact thatthe relative positions of the drogues remained the same indicates that the plumes did not breakapart in this time frame as the Florida Current was carrying them northward.
Table 6. Locations of Buoy Deployments from Cruise Ships andRetrieval by Anderson During Each Plume Tracking Event.
Cruise ShipBeginDate Buoy Activity
Time(24-h)
Latitude(N)
Longitude(W)
Majesty 08-10-01 No data collectedDeploy 1943 25°55.697� 79°52.697�
1 Retrieve Not recoveredDeploy 1945 26°13.080� 79°52.697�
2 Retrieve 0030 26°13.35� 79°51.03�Deploy 1946 25°55.5� 79°52.8�
3 Retrieve 0040 26°12.950� 79°51.795�Deploy 1948 25°55.9� 79°51.5�
4 Retrieve 0050 26°12.470� 79°52.424�Deploy 1950 25°56.405� 79°50.724�
Explorer 08-11-01 5 Retrieve 0058 26°11.989� 79°52.993�Deploy 1859 25°38.5� 79°51.4�
1 Retrieve 2350 25°52.8� 79°50.0�Deploy 1901 25°38.1� 79°50.9�
2 Retrieve 0000 25°53.8� 79°50.7�Deploy 1903 25°37.6� 79°50.6�
3 Retrieve 0010 25°54.1� 79°51.6�Deploy 1905 25°37.3� 79°50.2�
4 Retrieve 0020 25°55.2� 79°52.3�Deploy 1907 25°36.8� 79°49.7�
Paradise 08-12-01 5 Retrieve 0027 25°56.3� 79°53.1�Deploy 1910 25°26.70� 79°53.55�
1 Retrieve 2138 25°26.77� 79°51.9�Deploy 1914 25°26.39� 79°53.39�
2 Retrieve 2130 25°35.4� 79°52.0�Deploy 1916 25°26.09� 79°53.30�
3 Retrieve 2221 25°34.5� 79°52.2�Deploy 1918 25°26.81� 79°59.37�
4 Retrieve 2112 25°33.5� 79°52.6�Deploy 1921 25°27.09� 79°53.34�
Fascination 08-13-01 5 Retrieve 2104 25°32.7� 79°52.6�1Cruise ship time, position, and activity

9
The order of deployment vs. recovery did reverse during monitoring of activities for both theExplorer and Paradise. Since the buoys were not labeled prior to deployment, the order ofrecovery may have been recorded incorrectly. Otherwise the local currents would have to behighly variable which is not evident from the current data provided by NOAA (Figure 6).
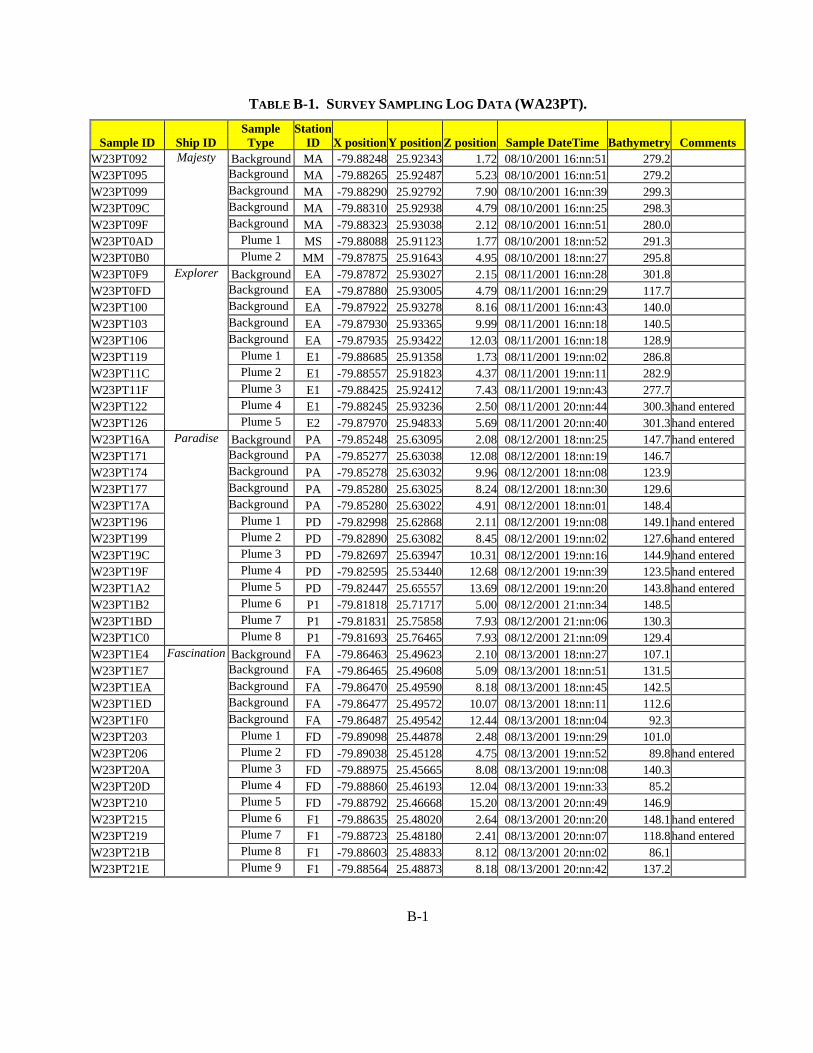
Field Data. All field data (date, time, sampling coordinates, bathymetry, and sample depth)associated with the collection of discrete samples during this survey are presented Appendix B.
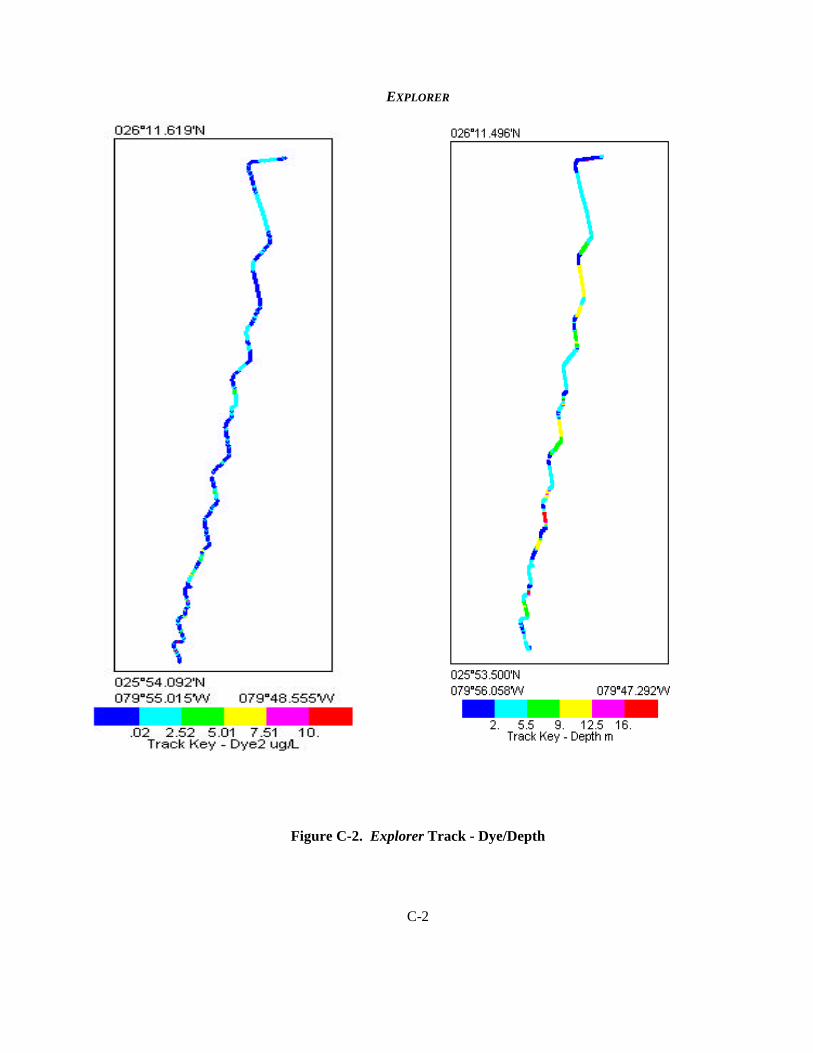
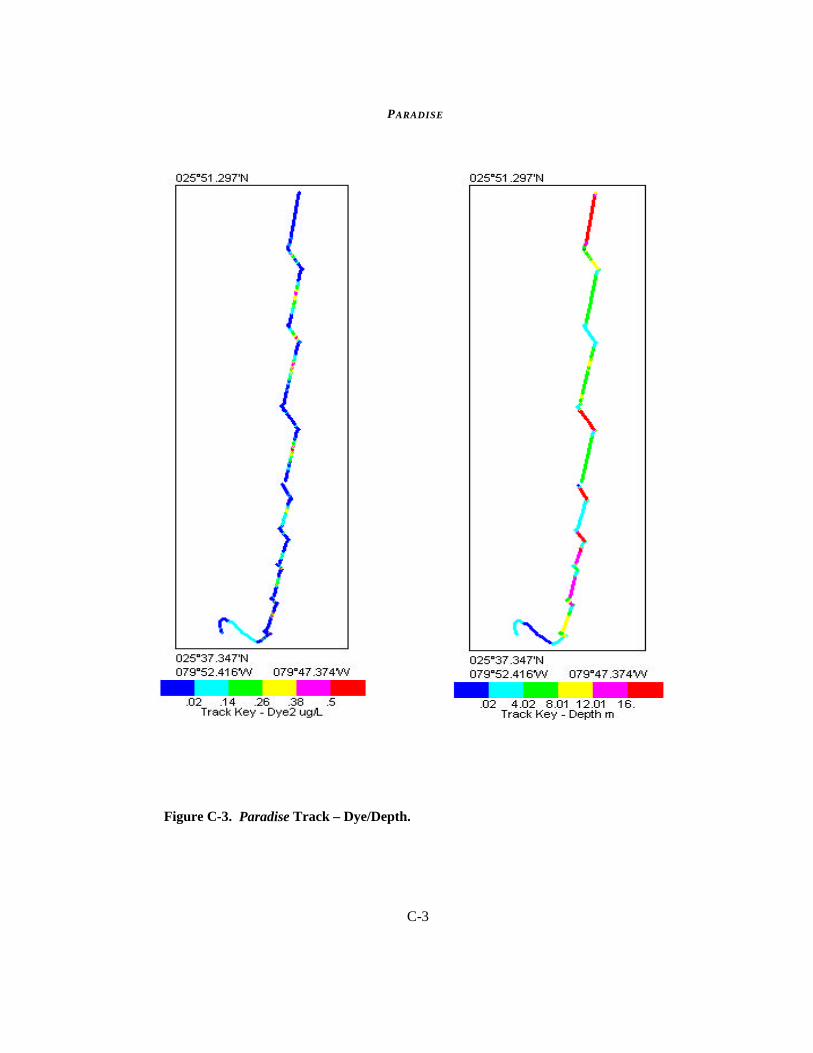
Plume Transects, Tracks, and Dye Data. Maps showing the background and survey tracks foreach set of plume-tracking events are shown in Figures 2 through 5. Appendix C presents surveytracks and depths for each plume survey. The transect lines are color coded to indicate relativeamount of fluorescence and depth of the sensor during a particular transect.
Initial dye concentrations varied considerably depending on the ship and tank specifications atthe time of discharge. Table 7 presents several measurements taken during monitoring activitiesalong multiple transects for each cruise ship plume.
The Majesty and Paradise discharges exhibited the lowest initial average concentrations of<0.5µg/L. The Explorer had the highest initial average concentration exceeding 5µg/L with amaximum of > 36µg/L. The Fascination had the second initial highest average concentration>3µg/L with maximum >9µg/L (Table 7).
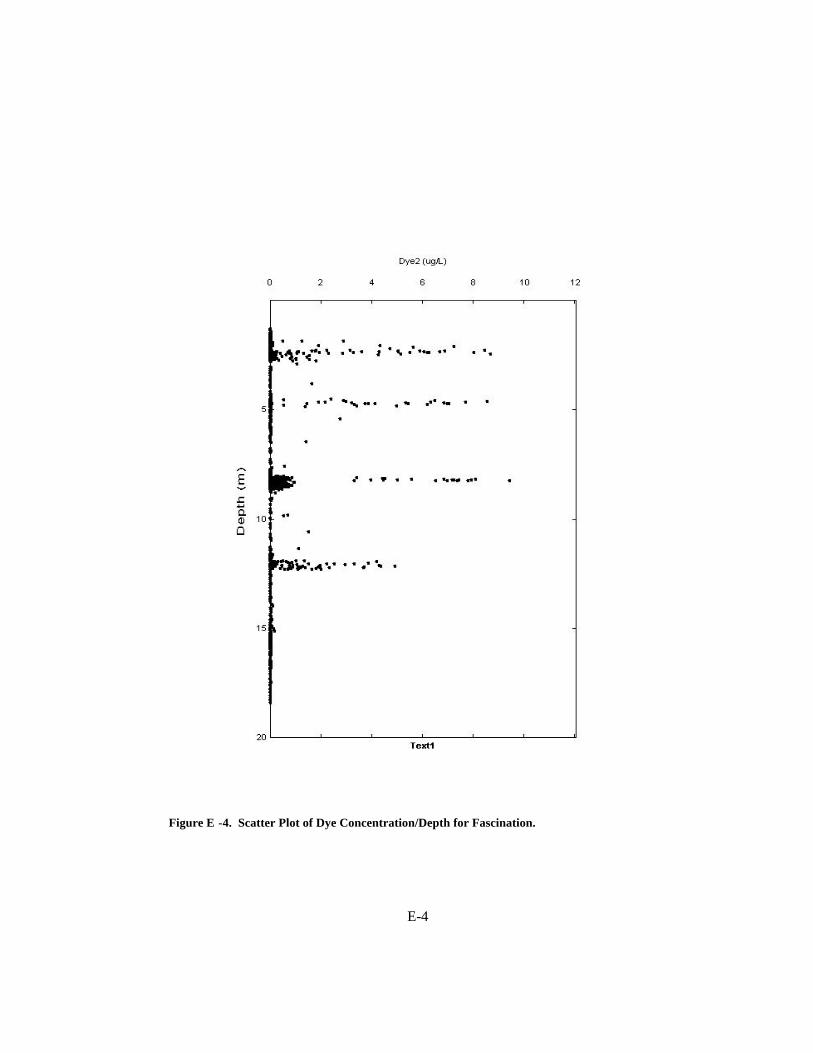
Time Series Plots and Scatter Plots. Time series plots of dye fluorescence/depth are presentedin Appendix D. These plots show the time line of the entire plume survey for each cruise shipand the spikes in dye fluorescence and the transect depth at which the spikes occurred.Appendix E presents the scatter plots of dye fluorescence versus depth. In these plots, the extentof the dye plume relative to depth is evident. These plots were prepared by combining all datafiles and represent dye concentrations above background levels (0.02 µg/L). All four cruise-shipplumes exhibited high dye concentrations in the surface waters. However for the Majesty andParadise, the dye plumes are most concentrated between 5 and 10m, but both plumes penetratethe water column to a depth of approximately 18m. The dye plume of the Explorer is veryconcentrated at the surface and penetrates the water column no deeper than 10 or 12m, possiblybecause of the propulsion configuration of that vessel. The pattern of the dye-plume scatter plotfor the Fascination is between the pattern exhibited by the plumes of the Paradise and Explorer.
10
BACKGROUND TRANSECT IN-PLUME TRANSECTS
Figure 2. Background and Plume Tracking Transects and Sampling Locations for M/SMajesty, August 10, 2001.
(Current had an average speed of ~ 7 Km/ Hr)
N N

11
Background Transect In-plume Transects
Figure 3. Background and Plume Tracking Transects and Sampling Locations for M/SExplorer, August 11, 2001.
(Current had an average speed of ~ 7 Km/ Hr)
12
Background Transect In-plume Transects
Figure 4. Background and Plume Tracking Transects and Sampling Locations for M/SParadise, August 12, 2001.
(Current had an average speed of ~ 7 Km/ Hr)

13
Background Transect In-plume Transects
Figure 5. Background and Plume Tracking Transects and Sampling Locations for M/SFascination, August 13, 2001.
(Current had an average speed of ~ 7 Km/ Hr)

14
ADCP Data from the M/S Explorer.Figure 6 shows the current profile structure in the depths ranging from 14 to 44 meters over afour-hour period. These data are provided by the NOAA office located in Miami, Florida. Thetop segment of Figure 6 shows the depth range from 0 to -44m and the number of pings(ensemble) over time from 0 to ~4.5 hours. The middle and bottom segments of the figure showthe direction and magnitude of the currents over the same time period (0 to ~4.5 hours). Thedate that the data were collected is 8/11/01 (shown as 01/08/11 on the figure); the same day theExplorer plume was monitored. The time period of data collection ranged from 22:17 to 02:42GMT (17:17 to 21:42 EDT) (within the time frame of the plume tracking survey).
The data were taken in 10-meter bins. A bin is a slice of the water column. In this case eachslice is 10 meters thick. The top 4 bins are shown (middle and bottom segment of Figure 6): bin001 (light blue) is centered at -14m, bin 002 (dark blue) is centered at -24m, bin 003 (green) iscentered at -34m, and bin 004 (red) is centered at -44m. The course followed by the Explorertakes it through the study area and across the Florida Current. The coordinates of the segmentextend from 25.78 N latitude, 80.18 W longitude to 26.28N latitude, 78.95 W longitude.
Figure 6. Current Profile Data Taken Aboard the Explorer and Provided by the NOAAOffice in Miami, Fl
The currents for all depth ranges (bins 001 through 004) are primarily south to north withmagnitudes in the range from slightly under 0.5 m/s (~1 Kt.) to nearly 2 m/s (~4 kts.). Thecurrents for all depths match at each location. If shear is present, the direction of one or more ofthe bins would deviate from the others. This does not occur and currents seem to be uniformover the depths of interest.
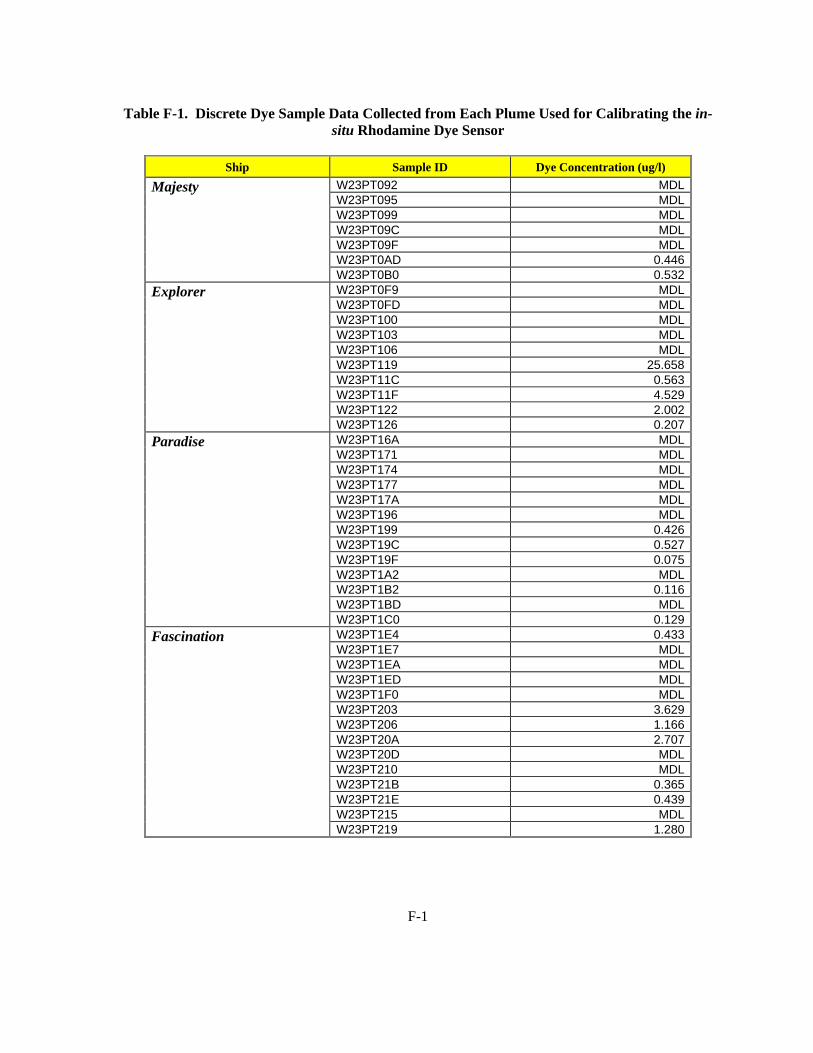
Discrete Dye Data. Appendix F contains all the dye data gathered from the discrete samplescollected in the cruise ship plumes and collected from the cruise ship tanks. Table F-1 provides

15
measurements for all samples collected in the cruise ship plumes aboard the Anderson. Table F-2 shows discrete sample data collected from the specified cruise ship tanks. It also provides theamount of dye added to the tanks as well as the average measured dye concentrations based onmeasurements of dye fluorescence from discrete tank samples taken for each cruise ship.
Plume Dilution. Dye concentrations after discharge were measured above background behindevery plume. Measured concentrations were lower than calculated concentrations (see AppendixH) except for the Explorer and Paradise, indicating that initial dilutions are greater thananticipated. Initial dye dilution estimates both calculated and measured were made afterdischarge. These estimates exceeded dilutions of 100,000:1 and in some cases exceeded600,000:1 (Table 8 and Appendix G). The calculated estimates were made from tank dyeconcentration calculations and plume volume estimates based on length, width, and depth of theplume at T=0. The measured estimates are based on fluorescense measurements from tanksamples and direct plume measurements (Table 8). In general, dye concentrations generallydecreased over time and with depth (Table 7).
Table 7. Average Dye Concentrations in Each Transect for Each Cruise Ship.Depth of tow (m) Dye Concentration (µg/L)
Pass Date Time Average Std. Dev.
EstimatedPlume Width
(m) Average MaximumStd. Dev.
FilenameCruise Ship: Majesty
1 10-Aug-01 18:48 1.92 0.09 66 0.35 1.08 0.37 W23PT059-00137.Pat
2 10-Aug-01 18:53 5.07 0.06 26 0.42 0.86 0.32 W23PT059-00256.Pat
3 10-Aug-01 18:58 7.89 0.05 75 0.31 1.10 0.36 W23PT059-00401.Pat
4 10-Aug-01 19:04 6.67 5.51 66 0.29 0.93 0.27 W23PT059-00553.Pat
5 10-Aug-01 19:14 2.24 0.08 137 0.20 0.62 0.16 W23PT060-00049.Pat
6 10-Aug-01 19:20 5.11 0.19 37 0.18 0.36 0.11 W23PT060-00190.Pat
7 10-Aug-01 19:27 8.73 0.08 125 0.26 0.51 0.17 W23PT060-00378.Pat
8 10-Aug-01 19:32 11.77 7.80 66 0.29 1.22 0.39 W23PT060-00503.Pat
9 10-Aug-01 19:40 3.40 1.67 300 0.11 1.13 0.23 W23PT060-00708.Pat
10 10-Aug-01 19:48 2.12 0.03 48 0.37 0.72 0.25 W23PT060-00925.Pat
11 10-Aug-01 19:54 5.19 0.02 95 0.27 1.07 0.36 W23PT060-01084.Pat
12 10-Aug-01 20:00 8.33 0.16 76 0.18 0.67 0.17 W23PT060-01230.Pat
13 10-Aug-01 20:11 6.82 7.68 124 0.07 0.34 0.07 W23PT061-00206.Pat
14 10-Aug-01 20:18 2.07 0.03 35 0.19 0.36 0.13 W23PT061-00393.Pat
15 10-Aug-01 20:23 4.38 0.04 92 0.39 0.98 0.30 W23PT061-00528.Pat
16 10-Aug-01 20:32 8.88 0.08 114 0.12 0.25 0.07 W23PT062-00129.Pat
17 10-Aug-01 20:45 10.38 0.06 67 0.21 0.61 0.21 W23PT062-00462.Pat
18 10-Aug-01 20:53 12.03 0.03 40 0.18 0.40 0.12 W23PT062-00661.Pat
19 10-Aug-01 21:01 14.26 0.06 111 0.09 0.29 0.08 W23PT062-00888.Pat
20 10-Aug-01 21:12 17.41 0.07 30 0.04 0.07 0.02 W23PT063-00001.Pat
21 10-Aug-01 21:21 2.17 0.06 298 0.06 0.15 0.03 W23PT063-00241.Pat
22 10-Aug-01 21:31 5.28 0.02 124 0.06 0.10 0.03 W23PT063-00498.Pat
23 10-Aug-01 21:39 8.82 0.17 202 0.02 0.10 0.02 W23PT063-00709.Pat
Cruise Ship: Explorer
1 11-Aug-01 19:44 1.95 0.11 147 5.13 36.15 10.02 W23PT087-00080.Pat
2 11-Aug-01 19:48 4.04 0.83 157 3.08 17.56 5.06 W23PT087-00176.Pat
3 11-Aug-01 19:54 7.54 0.22 86 3.02 9.81 3.20 W23PT087-00339.Pat

16
Depth of tow (m) Dye Concentration (µg/L)
Pass Date Time Average Std. Dev.
EstimatedPlume Width
(m) Average MaximumStd. Dev.
Filename4 11-Aug-01 20:01 5.35 6.61 144 1.93 10.77 3.19 W23PT087-00506.Pat
5 11-Aug-01 20:07 4.05 4.18 53 4.30 8.89 3.62 W23PT087-00662.Pat
6 11-Aug-01 20:11 2.24 0.03 59 5.46 20.79 6.99 W23PT087-00769.Pat
7 11-Aug-01 20:22 2.51 0.38 69 0.85 3.56 1.17 W23PT088-00207.Pat
8 11-Aug-01 20:25 1.66 1.61 279 2.98 8.54 1.85 W23PT089-00001.Pat
9 11-Aug-01 20:30 3.89 3.35 293 2.56 8.07 2.49 W23PT089-00152.Pat
10 11-Aug-01 21:02 2.59 0.10 67 0.56 2.01 0.58 W23PT089-00972.Pat
11 11-Aug-01 21:05 2.84 0.06 48 2.11 3.59 0.76 W23PT090-00001.Pat
12 11-Aug-01 21:19 6.82 0.57 102 2.28 4.27 1.29 W23PT091-00199.Pat
13 11-Aug-01 21:42 3.98 3.61 119 1.19 4.86 0.94 W23PT092-00198.Pat
14 11-Aug-01 22:05 2.29 0.05 104 1.69 3.08 0.93 W23PT093-00194.Pat
15 11-Aug-01 22:08 2.29 0.06 122 0.50 0.82 0.18 W23PT094-00001.Pat
16 11-Aug-01 22:20 4.58 3.11 68 0.68 1.54 0.55 W23PT095-00133.Pat
17 11-Aug-01 23:00 1.78 0.08 125 1.40 1.94 0.26 W23PT096-00001.Pat
18 11-Aug-01 23:26 5.03 0.04 574 0.38 1.88 0.24 W23PT097-00421.Pat
19 11-Aug-01 23:54 1.87 1.06 909 0.36 1.12 0.24 W23PT098Z-00196.pat
Cruise Ship: Paradise
1 12-Aug-01 19:19 2.11 0.07 182 0.08 0.42 0.10 W23PT119-00066.Pat
2 12-Aug-01 19:24 8.40 0.13 76 0.42 1.28 0.47 W23PT119-00199.Pat
3 12-Aug-01 19:34 9.66 1.09 93 0.41 0.96 0.31 W23PT120-00225.Pat
4 12-Aug-01 19:43 12.62 0.24 57 0.17 0.48 0.15 W23PT120-00457.Pat
5 12-Aug-01 19:54 13.63 0.20 84 0.14 0.34 0.09 W23PT120-00737.Pat
6 12-Aug-01 20:04 4.61 0.50 143 0.39 1.31 0.38 W23PT121-00084.Pat
7 12-Aug-01 20:12 15.54 0.47 109 0.08 0.25 0.06 W23PT122-00040.Pat
8 12-Aug-01 20:26 17.93 0.28 64 0.09 0.31 0.08 W23PT122-00392.Pat
9 12-Aug-01 20:34 2.11 0.12 274 0.12 0.38 0.11 W23PT122-00595.Pat
10 12-Aug-01 20:44 16.28 7.12 296 0.02 0.37 0.03 W23PT123.Pat
11 12-Aug-01 21:04 5.11 0.14 305 0.21 0.62 0.15 W23PT125-00104.Pat
12 12-Aug-01 21:16 15.23 6.39 580 0.01 0.11 0.01 W23PT126.Pat
13 12-Aug-01 21:48 7.97 0.06 341 0.21 0.67 0.17 W23PT128-00165.Pat
14 12-Aug-01 22:05 2.07 0.21 455 0.21 0.56 0.15 W23PT129-00090.Pat
15 12-Aug-01 22:23 5.20 0.31 210 0.18 0.36 0.11 W23PT130-00081.Pat
16 12-Aug-01 22:30 5.06 0.52 135 0.22 0.47 0.13 W23PT131-00001.Pat
17 12-Aug-01 22:44 8.16 0.26 480 0.11 0.50 0.12 W23PT131-00365.Pat
Cruise Ship: Fascination
1 13-Aug-01 19:29 2.30 0.13 88 3.40 8.65 2.66 W23PT149-00042.Pat
2 13-Aug-01 19:34 4.70 0.07 84 3.80 8.52 2.58 W23PT149-00188.Pat
3 13-Aug-01 19:42 8.23 0.11 87 2.27 9.40 3.12 W23PT149-00390.Pat
4 13-Aug-01 19:51 12.07 0.17 189 1.08 4.89 1.22 W23PT149-00625.Pat
5 13-Aug-01 20:02 7.53 5.88 54 0.31 2.74 0.67 W23PT149-00896.Pat
6 13-Aug-01 20:20 2.52 0.12 174 0.30 1.80 0.45 W23PT150-00168.Pat
7 13-Aug-01 20:34 8.35 0.17 471 0.36 0.94 0.20 W23PT151-00245.Pat

17
Table 8. Calculated and Measured Dye Concentrations and Dilutions for Each of the FourCruise Ships.
Vessel Parameter Majesty Explorer Paradise Fascination
Dye - v (L)/ wt.(kg) 114/22.6 133/26.4 133/26.4 137/27.1Volume of water + dye in tank (L) 113,114 18,300 108,133 27,137Tank Concentration (g/L) 0.1998 1.443 0.244 0.999Dye discharged (kg) 21,201 24,669 16,635 24103Calculated Plume Volume (L) 36,302,904,000 15,517,320,000 45,503,640,000 6,172,100,000Calculated plume concentration (g/L) 5.84E-07 1.59E-06 3.66E-07 3.91E-06
CalculatedValues
Calculated Dilution 342,123:1 907,547:1 666,667:1 255,499:1Measured Tank Concentration (g/L) 0.13,512 1.002 0.2704 0.9806Measured Plume Concentration (g/L) 3.50E-07 5.13E-06 4.20E-07 3.40E-06
MeasuredValues
Measured Dilution 386057:1 195,322:1 643,810:1 288,412:1
4. Findings and Conclusions
The August 2001 plume tracking survey was designed to provide field data on the cruise shipdischarge (effluent) plume characteristics in offshore waters, and provide information on whetheror not the cruise ship blackwater or graywater discharge-plumes behave as predicted by a modeldeveloped for Alaska waters (Colonell et al. 2000)2.
Based on the Alaska model, effluent discharges from cruise ships were expected to undergo aninitial dilution of approximately 40,000:1. Colonell et al. (2000)2 defines initial dilution as thephysical mixing of a relatively small and moving discharge entering the water body andsecondary dilutions as caused by mixing by the ship propellers. In this plume and trackingreport, initial and secondary are not distinguished, but are called initial dilution.
The following findings for each ship were:
M/S Majesty
Calculated dilution: 342,000:1Measured dilution: 386,000:1
M/S Explorer
Calculated dilution: 908,000:1Measured dilution: 195,000:1
2 Colonell, JM, SV Smith, and RB Spies. 2000. Cruise Ship Wastewater Discharge into Alaskan Coastal Waters.Alaska SeaLife Center Technical Report Number 2000-01. 48pp.

18
M/S Paradise
Calculated dilution: 667,000:1Measured dilution: 643,000:1
M/S Fascination
Calculated dilution: 255,000:1Measured dilution: 288,000:1
This survey indicates that discharges from cruise ships undergo a dilution that is much greaterthan the initial dilution predicted by a model developed by Collonel et al (2000)2. Measureddilutions ranged from 195,000 : 1 to 666,000 :1. This indicates that secondary dilution, as theeffluent passes through the propellers is an important factor when considering the ambientconcentrations of discharge effluents. The effluent will undergo a dramatic and rapid dilutionafter mixing with ambient water in the prop wash.
In this study, the observed dilution is unlikely to have been influenced by shear currents. The useof surface drogues allowed the OSV Anderson to maintain position with the dye plume as itmoved northward in the Florida current. The drogues maintained a relative position during theirdrift, which indicates that the plume was not exposed to highly variable currents. The acousticDoppler current profiler data, obtained from the Majesty, also indicates that the plumes did notencounter shear or variability in the current.
5. References
Battelle. 2001. Work/Quality Assurance Project Plan for Cruise Ship Sampling. Prepared forU.S. Environmental Protection Agency Oceans and Coastal Protection Division, Washington,DC. Contract NO. 68-C-00-121, Work Assignment 1-23.
Battelle. 2001a. Survey Plan for Cruise Ship Sampling. Prepared for U.S. EnvironmentalProtection Agency Oceans and Coastal Protection Division, Washington, DC. Contract NO. 68-C-00-121, Work Assignment 1-23.
Colonell, JM, SV Smith, and RB Spies. 2000. Cruise Ship Wastewater Discharge into AlaskanCoastal Waters. Alaska SeaLife Center Technical Report Number 2000-01. 4

APPENDIX A
DRIFTER TRACKS FOR THREE OF THE FOUR CRUISE SHIPS MONITORED

A-1
Figure A - 1. Explorer Drifter Tracks (S - Start and F - Finish) for Set of Five Drifters Deployed and Recovered during the Miami Plume Tracking Survey.

A-2
Figure A2. Paradise Drifter Tracks (S - Start and F - Finish) for Set of Five Drifters Deployed and Recovered during the Miami Plume Tracking Survey.
A-3
FIGURE A-3. FASCINATION DRIFTER TRACKS (S-START AND F-FINISH) FOR SET OF FIVE
DRIFTERS DEPLOYED AND RECOVERED DURING THE MIAMI PLUME TRACKING SURVEY.

APPENDIX B
SAMPLING LOG TABLE
B-1
TABLE B-1. SURVEY SAMPLING LOG DATA (WA23PT).
Sample ID Ship IDSampleType
StationID X position Y position Z position Sample DateTime Bathymetry Comments
W23PT092 Background MA -79.88248 25.92343 1.72 08/10/2001 16:nn:51 279.2 W23PT095 Background MA -79.88265 25.92487 5.23 08/10/2001 16:nn:51 279.2 W23PT099 Background MA -79.88290 25.92792 7.90 08/10/2001 16:nn:39 299.3 W23PT09C Background MA -79.88310 25.92938 4.79 08/10/2001 16:nn:25 298.3 W23PT09F Background MA -79.88323 25.93038 2.12 08/10/2001 16:nn:51 280.0 W23PT0AD Plume 1 MS -79.88088 25.91123 1.77 08/10/2001 18:nn:52 291.3 W23PT0B0
Majesty
Plume 2 MM -79.87875 25.91643 4.95 08/10/2001 18:nn:27 295.8 W23PT0F9 Background EA -79.87872 25.93027 2.15 08/11/2001 16:nn:28 301.8 W23PT0FD Background EA -79.87880 25.93005 4.79 08/11/2001 16:nn:29 117.7 W23PT100 Background EA -79.87922 25.93278 8.16 08/11/2001 16:nn:43 140.0 W23PT103 Background EA -79.87930 25.93365 9.99 08/11/2001 16:nn:18 140.5 W23PT106 Background EA -79.87935 25.93422 12.03 08/11/2001 16:nn:18 128.9 W23PT119 Plume 1 E1 -79.88685 25.91358 1.73 08/11/2001 19:nn:02 286.8 W23PT11C Plume 2 E1 -79.88557 25.91823 4.37 08/11/2001 19:nn:11 282.9 W23PT11F Plume 3 E1 -79.88425 25.92412 7.43 08/11/2001 19:nn:43 277.7 W23PT122 Plume 4 E1 -79.88245 25.93236 2.50 08/11/2001 20:nn:44 300.3hand enteredW23PT126
Explorer
Plume 5 E2 -79.87970 25.94833 5.69 08/11/2001 20:nn:40 301.3hand enteredW23PT16A Background PA -79.85248 25.63095 2.08 08/12/2001 18:nn:25 147.7hand enteredW23PT171 Background PA -79.85277 25.63038 12.08 08/12/2001 18:nn:19 146.7 W23PT174 Background PA -79.85278 25.63032 9.96 08/12/2001 18:nn:08 123.9 W23PT177 Background PA -79.85280 25.63025 8.24 08/12/2001 18:nn:30 129.6 W23PT17A Background PA -79.85280 25.63022 4.91 08/12/2001 18:nn:01 148.4 W23PT196 Plume 1 PD -79.82998 25.62868 2.11 08/12/2001 19:nn:08 149.1hand enteredW23PT199 Plume 2 PD -79.82890 25.63082 8.45 08/12/2001 19:nn:02 127.6hand enteredW23PT19C Plume 3 PD -79.82697 25.63947 10.31 08/12/2001 19:nn:16 144.9hand enteredW23PT19F Plume 4 PD -79.82595 25.53440 12.68 08/12/2001 19:nn:39 123.5hand enteredW23PT1A2 Plume 5 PD -79.82447 25.65557 13.69 08/12/2001 19:nn:20 143.8hand enteredW23PT1B2 Plume 6 P1 -79.81818 25.71717 5.00 08/12/2001 21:nn:34 148.5 W23PT1BD Plume 7 P1 -79.81831 25.75858 7.93 08/12/2001 21:nn:06 130.3 W23PT1C0
Paradise
Plume 8 P1 -79.81693 25.76465 7.93 08/12/2001 21:nn:09 129.4 W23PT1E4 Background FA -79.86463 25.49623 2.10 08/13/2001 18:nn:27 107.1 W23PT1E7 Background FA -79.86465 25.49608 5.09 08/13/2001 18:nn:51 131.5 W23PT1EA Background FA -79.86470 25.49590 8.18 08/13/2001 18:nn:45 142.5 W23PT1ED Background FA -79.86477 25.49572 10.07 08/13/2001 18:nn:11 112.6 W23PT1F0 Background FA -79.86487 25.49542 12.44 08/13/2001 18:nn:04 92.3 W23PT203 Plume 1 FD -79.89098 25.44878 2.48 08/13/2001 19:nn:29 101.0 W23PT206 Plume 2 FD -79.89038 25.45128 4.75 08/13/2001 19:nn:52 89.8hand enteredW23PT20A Plume 3 FD -79.88975 25.45665 8.08 08/13/2001 19:nn:08 140.3 W23PT20D Plume 4 FD -79.88860 25.46193 12.04 08/13/2001 19:nn:33 85.2 W23PT210 Plume 5 FD -79.88792 25.46668 15.20 08/13/2001 20:nn:49 146.9 W23PT215 Plume 6 F1 -79.88635 25.48020 2.64 08/13/2001 20:nn:20 148.1hand enteredW23PT219 Plume 7 F1 -79.88723 25.48180 2.41 08/13/2001 20:nn:07 118.8hand enteredW23PT21B Plume 8 F1 -79.88603 25.48833 8.12 08/13/2001 20:nn:02 86.1 W23PT21E
Fascination
Plume 9 F1 -79.88564 25.48873 8.18 08/13/2001 20:nn:42 137.2

APPENDIX C
SHIP TRACKS SHOWING DYE 2 CONCENTRATIONS VS. DEPTH USING
COLOR CODES

C-1
MAJESTY
Figure C-- 1 Majesty Track – Dye/Depth
C-2
EXPLORER
Figure C-2. Explorer Track - Dye/Depth
C-3
PARADISE
Figure C-3. Paradise Track – Dye/Depth.

C-4
FASCINATION
Figure C - 4. Fascination Track - Dye/Depth

APPENDIX D
TIME SERIES PLOTS OF DEPTH VS. DYE FOR EACH CRUISE SHIP/PLUME TRACKED

D-1
.
Figure D - 1. Majesty Time Series Plot of Dye Concentration vs. Depth for All Transect Passes Through
the
Plume.

D-2
Figure D-2. .Explorer Time Series Plot of Dye Concentration/Depth for All Transect Passes Through the Plume.

D-3
Figure D-3. Paradise Dye Concentration/Depth for All Transect Passes Through the Plume.

APPENDIX E
SCATTER PLOTS OF DYE 2 CONCENTRATION VS. DEPTH

E-1
Figure E - 1. Scatter Plot of Dye Concentration/Depth for Majesty.

E-2
Figure E - 2. Scatter Plot of Dye Concentration/Depth for Explorer.

E-3
Figure E - 3. Scatter Plot of Dye Concentration/Depth for Paradise.
E-4
Figure E - 4. Scatter Plot of Dye Concentration/Depth for Fascination.

APPENDIX F
DISCRETE DYE SAMPLE DATA
F-1
Table F-1. Discrete Dye Sample Data Collected from Each Plume Used for Calibrating the in-situ Rhodamine Dye Sensor
Ship Sample ID Dye Concentration (ug/l)
W23PT092 MDLW23PT095 MDLW23PT099 MDLW23PT09C MDLW23PT09F MDLW23PT0AD 0.446
Majesty
W23PT0B0 0.532W23PT0F9 MDLW23PT0FD MDLW23PT100 MDLW23PT103 MDLW23PT106 MDLW23PT119 25.658W23PT11C 0.563W23PT11F 4.529W23PT122 2.002
Explorer
W23PT126 0.207W23PT16A MDLW23PT171 MDLW23PT174 MDLW23PT177 MDLW23PT17A MDLW23PT196 MDLW23PT199 0.426W23PT19C 0.527W23PT19F 0.075W23PT1A2 MDLW23PT1B2 0.116W23PT1BD MDL
Paradise
W23PT1C0 0.129W23PT1E4 0.433W23PT1E7 MDLW23PT1EA MDLW23PT1ED MDLW23PT1F0 MDLW23PT203 3.629W23PT206 1.166W23PT20A 2.707W23PT20D MDLW23PT210 MDLW23PT21B 0.365W23PT21E 0.439W23PT215 MDL
Fascination
W23PT219 1.280

F-2
Table F-2. Measured Dye Concentrations and Average Concentration for Each Cruise ShipMonitored during the Survey.
*Not used in calculations
Ship Sample ID Value ug/L
Tank Conc. (ug/L) (after
accounting for dilution )
Tank Conc. (g/L)
Average Tank Conc.
(g/L)
Calculated Tank Conc.
(g/L)
Amount of Dye
Added (gallons)
Amount of Dye
Added (kg)
ET=1D 0.54 1077030.44 1.08 1.00 1.44 35 26.4kg ET=2C 41.90 838024.33 0.84 ET=3C 42.79 855741.66 0.86 ET=4C 23.29 465898.95 0.47 ET=OD 0.89 1773055.80 1.77
Sum 5.01
FT=1D 2.45 980549.92 0.98 0.98 1.00 36 27.1kg FT=2D 1.54 615647.82 0.62 FT=3D 1.29 517182.18 0.52 FT=4D 1.00 401364.81 0.40 FT=OD 5.97 2388029.43 2.39
Sum 4.90
MT=0 <0.024 0.00 0.14 0.20 30 22.6kg MT=1C 10.19 101881.14 0.10 MT=2C 12.37 123746.47 0.12 MT=3C 14.17 141709.15 0.14 MT=4C 17.32 173159.56 0.17
Sum 0.54
PT=1C 17.30 173018.30 0.17 0.27 0.24 35 26.4kg PT=2C 18.42 184170.35 0.18 PT=3C 34.23 342336.78 0.34 PT=4C 42.55 425474.73 0.43 PT=OC 22.72 227152.75 0.23
Sum 1.35
Majesty
Paradise
Explorer
Fascination

APPENDIX G
CALCULATIONS FOR CALCULATED VS. MEASURED DYE DILUTIONS FOR EACH CRUISE SHIP.

G-1
M/S Majesty
Majesty calculated dye concentration in tankVolume of graywater in tank (Vgw) - 113 m3 X 1000L/m3 =113,000L graywater/blackwaterVolume of dye (Vdy) - 30gal . dye = 113.6LVgw + Vdy = 113,114Wt. Of active ingredient in 30 gal, dye - 22.6 kg active ingredient/114 L dyetherefore Concentration of active ingredient in tank (Ctc) = 22.6kg dy/113,114 L gw or 22600 g dy/113,114 L gwCalculated Tank Dye Concentration (Ctc)= 0.1998 g dy/LMeasured Tank Dye Concentration (C tm) from Appendix F -Table F- 2 = 0.13512 g dy/L
Amount of dye not discharged (left in the tank)Of the 113,114 L of Dye in the tank at the initiation of pumping 7000 L (7 m3) were not pumped overboard.0.1998 g dy/L (conc dye in tank)= Xg/7000L where X=amount of dye not discharged0.1998 g dy/L* 7000 L = X g = 1398.6 g dy
Distance traveled Dx in 57 min at a speed of 17.4 kts.DX/57=17.4/60Dx = 57 min. * 17.4 kts./60 min.Dx = 991.8 min kts./60 minDx = 16.5 nmi traveled
Majesty calculated initial concentration based on length (ship pumping specifications - Table2), width, and depth of initial plume transect.Plume dimensions and volume1 nmi = 1852 m1852 x 16.5 = 30,558 mPlume width = width of plume at first transect = 66mDepth of plume ~ 18 mVolume of plume~ 66m * 18m * 30,558= 36,302,904 m3 * 1000L/m3 = 36,302,904,000 L
Calculated concentration of dye in plume (Cpc) = g/LCpc = 22600g – Xg from above/36,302,904,000 = 22600g –1399g/36,302,904,000 L= 21201/36,302,904,000 LCpc = 5.84 * 10(-7) g/L =Majesty Initial Calculated Dye Concentration (Cpc) = 0.584 ug/L
Majesty - Calculated Dilution = Tank Concentration/Seawater Concentration0.1998g/0.584ug/L = 0.1998g/L/.000000584g/L =Majesty Calculated Dilution = 342,123:1
Majesty - Average Initial Measured Dye Concentration (dye 2) in Plume = 0.35 µg/L (FirstTransect)
Majesty - Measured Dilution = Tank Concentration/Seawater Concentration0.13512g/L/0.35ug/L = 0.13512g/L/.00000035g/L =Majesty Measured Dilution 386,057:1

G-2
M/S Explorer
Explorer calculated dye concentration in tankVolume of blackwater and dye in tank ( Vbw+dy) - 18.3 m3 *1000L/m3 =18,300L gw+dyeVolume of dye (Vdy) - 35 gal. dye = 133 L (already measured as part of the gray water volume)Wt. Of active ingredient in 35 gal (133 L) dye - 26.4 kg active ingredient/133 L dye26.4kg dy/18300 L gw+dye therefore 26400 g dy/18300 L gw+dyeCalculated Tank Dye Concentration =1.443 g/LMeasured Tank Dye Concentration = 1.002 g/L
Amount of dye not discharged (left in the tank)Of the 18300 L of Dye in the tank at the initiation of pumping 1200 L (1.2 m3) were not pumped overboard.1.443 g dy/L (conc dye in tank)= Xg/1200 L where X=amount of dye not discharged1.443 g dy/L* 1200 L = X g = 1731 g dy
Distance traveled (DX) in 18 min at a speed of 19 kts.DX /18=19/60DX =18 min.*19 kts./60 min.DX = 342 minkts./60 minDX = 5.7 nmi traveled
Explorer calculated initial concentration based on length (ship pumping specifications - Table2), width, and depth of initial plume transect.Plume dimensions and volume1 nmi = 1852 m1852 x 5.7 nmi =10556Plume width = width of plume at first transect = 147mDepth of plume ~ 10 mVolume of plume~ 147m * 10m * 10556 = 15,517,320 m3 * 1000L/ m3 = 15,517,320,000 L
Calculated concentration of dye in plume (Cpc) = g/LCpc = 26400g – Xg dy from above/15,517,320,000L = 26400g –1731g dy/15,517,320,000L= 24,669gdy/15,517,320,000L1.59 * 10(-6)g/L =Explorer - Calculated Initial Dye Concentration = 1.59 ug/L
Explorer- Calculated Dilution = Tank Concentration/Seawater Concentration1.443g/L/1.59ug/L =1.443g/L.00000159g/L =Explorer Calculated Dilution = 907,547:1
Explorer - Average Initial Measured Dye Concentration (Dye 2) in Plume = 5.13 ug/L (FirstTransect)
Explorer - Measured Dilution = Tank Concentration/Seawater Concentration1.002g/5.13ug/L = 1.002g/.00000513g/L =Explorer Measured Dilution = 195,321:1

G-3
M/S Paradise
Paradise calculated dye concentration in tankVolume of graywater in tank (Vgw) - 108 m3 * 1000L/ m3 = 108,000L gw+dyeVolume of dye (Vdy ) 35gal . = 133 L dyeVgw + Vdy = 108,133Wt. Of active ingredient in 35 gal (133 L) dye - 26.4 kg active ingredient/133 L dye26.4 kg dye/108,133L gw+dy therefore 26400 g dy/108,133 L gw+dyCalculated Tank Dye Concentration = 0.244 g/LMeasured Tank Dye Concentration = 0.2704 (from Table F-2 in Appendix F)
Amount of dye not discharged (left in the tank)Of the 108,133 L (108.133 m3 )of dye + graywater in the tank at initiation of pumping 40,000 L (40 m3) were notpumped overboard (pumping lasted for 30 min).0.244 g/L (conc dye in tank) = Xg/40,000L where Xg = amount of dye not discharged0.244 g/L * 40,000L =Xg therefore Xg = 9765g
Distance traveled (DX) in 30 min at a speed of 15 kts.DX /30=15/60DX =30 min * 15 kts./60 min.DX = 450 min kts./60 minDX = 7.5 nmi traveled
Paradise calculated initial plume concentration based on length (ship pumpingspecifications - Table 2), width, and depth of initial plume transect.Plume dimensions and volume1 nmi = 1852 m/nmi1852 * 7.5=13,890 mPlume width = width of plume at first transect = 182 mDepth of plume ~ 18 mVolume of plume~ 182m * 18m * 13890= 45,503,640 m3 * 1000L/m3 = 45,503,640,000 L
Calculated concentration of dye in plume (Cpc) = g/L26400 g - Xg from above/45,503,640,000 L = 26400g –9765g/45,503,640,000 L =16635/45,503,640,000 L = 3.656 *10(-7) g/L =Paradise Initial Calculated Dye Concentration = 0.3656 ug/L
Paradise Calculated Dilution = Tank Concentration/Seawater Concentration0.244g/L/0.366ug/L = 0.244g/L/.000000366g/L =Paradise Calculated Dilution =666,667:1
Paradise - Average Initial Measured Dye Concentration (Dye 2) in Plume = 0.42 ug/L (FirstTransect)
Paradise - Measured Dilution = Tank Concentration/Seawater Concentration0.2704g/L/0.42ug/L = 0.2704g/L/.00000042g/L =Paradise Measured Dilution = 643,809:1

G-4
M/S Fascination
Fascination calculated concentration in tankVolume of graywater in tank (Vgw) - 27m3 * 1000L/m3 =27,000L gwVolume of dye (Vdy ) 36gal . = 137 L dyeVgw + Vdy = 27,137Wt. Of active dye ingredient in 36 gal, 27.1 kg dye27.1 kg dye/27,137L gw+dy therefore 27100 g dy/27,137 L gw+dyCalculated Tank Dye Concentration = 0.999 g/LMeasured Tank Dye Concentration = 0.9806 (from Table F-2 in Appendix F)
Amount of dye not discharged (left in the tank)Of the 27,137 L (108.1370m3) of Dye in the tank at initiation of pumping3000 L (3 m3) were not pumped overboard. (pumping lasted for 30 min).0.999 g/L (conc dye in tank)= Xg/3,000L where Xg=amount of dye not discharged0.999g/L * 3,000L = Xg therefore Xg = 2997g
Distance traveled in 20 min at a speed of 9.1 kts.X/20=9.1/60X =20 min * 9.1 kts./60 min.X= 182 min kts./60 minX = 3.03 nmi traveled
FASCINATION CALCULATED INITIAL CONCENTRATION BASED ON LENGTH (SHIP PUMPING
SPECIFICATIONS - TABLE 2), WIDTH, AND DEPTH OF INITIAL PLUME TRANSECT.Plume Dimensions and Volume1852 * 3.03=5612 mPlume width = width of plume at first transect = 88mDepth of plume ~ 12.5 m Volume of plume~ 88m x 12.5m x 5612= 6,172,100 m3 * 1000L/m3 = 6,172,100,000 L
Calculated concentration of dye in plume (Cpc) = g/L27100 g - Xg from above/6,172,100,000 L = 27100g dye –2997g/6,172,100,000 L =24103g dye/6,172,100,000 L = 3.91 * 10(-6) g/L =Initial Calculated Dye Concentration = 3.91 ug/L
Fascination - Calculated Dilution = Tank Concentration/Seawater Concentration0.999g/3.91ug = 0.999g/.00000391g/L =Fascination Calculated Dilution = 255,499:1
Fascination -Average Measured Dye Concentration (Dye 2) in Plume= 3.4 ug/L (First Transect)
Fascination Measured Dilution = Tank Concentration/Seawater Concentration0.9806g/L/3.4ug/L = 0.9806g/L/.0000034g/L =Fascination Measured Dilution = 288,411:1