cross functional alignment in supply chain planning: a case … · 2015-07-28 · cross functional...
TRANSCRIPT

07-001
Copyright © 2006 Rogelio Oliva and Noel Watson
Working papers are in draft form. This working paper is distributed for purposes of comment and discussion only. It may not be cited or reproduced without permission of the copyright holders. Copies of working papers are available from the authors.
Cross Functional Alignment in Supply Chain Planning: A Case Study of Sales & Operations Planning
Revised October 11, 2006 Professor Rogelio Oliva* Professor Noel Watson**
*Mays Business School, Texas A&M University, College Station, TX 77843-4217 [email protected] **Harvard Business School, Boston, MA 02163-1010 [email protected]
Cross Functional Alignment in Supply Chain Planning: A Case Study of Sales & Operations Planning
Abstract
In 2002, Leitax, a niche consumer electronics company, suffered serious supply chain planning mishaps
due to poor cross-functional integration in the supply/demand planning activities. The poor integration
resulted from organizational differentiation among the functions and an unsophisticated approach to
integration. In response to the planning mishaps, the organization introduced significant changes, which
we examine in this case study. After highlighting the constituent responsibilities, structures, and
processes, we recognize a system, as opposed to a list of mechanisms, as responsible for cross-functional
integration. Operationalizing integration as functional alignment with generated plans, we find
collaborative engagement of the functions to be a consistent process feature and operational norm
encouraged and maintained by integrators. In particular, the information processing nature of the sales
and operations planning (S&OP) process introduced at Leitax is argued effective as a result of this
collaborative engagement. We argue that this collaborative engagement positively influences alignment
even in the absence of an overall reduction in the level of differentiation exhibited by an organization,
which stands in contrast to academic structural recommendations for changes in incentives for achieving
integration. Examining a systemic tradeoff consciously acknowledged by the organization, we further
argue that alignment encouraged by this collaborative engagement can be more important than achieving,
superior performance along such dimensions as speed or accuracy in individual information processing
steps of the S&OP process, a tradeoff which to our knowledge has not been highlighted in the supply
chain management literature.

1
1. Introduction Within most organizations, the administration of its supply-facing and demand-facing sides so as to minimize
mismatches and thus create and capture value is a cross-functional effort. Traditionally functional areas –e.g.,
sales, marketing, finance, operations– have tended to specialize in portions of these supply chain planning
activities. However, this specialization or differentiation is notorious for generating conflicts in organizations
(Shapiro 1977), conflicts which generally center around differing expectations about both demand and
supply, and differing functional preferences and priorities on how the matching of demand and supply should
be accomplished. Poor reconciliation of such inter-functional conflicts has the potential to create huge
demand/supply mismatches and their attendant inventory holding, production, and opportunity costs
(Christopher 1998), and even contribute to the bull-whip effect (Hammond 1994). Consequently, the need for
explicit attention to coordinating or integrating the functional efforts to achieve particular planning results
has been considered significant (Stank et al. 1999; Stank et al. 2001), but difficult to achieve as a result of the
persistence of the differentiation inducing factors (Barratt 2004; Fawcett and Magnan 2002; Kahn and
Mentzer 1996). In this paper we focus on cross-functional integration to support the mid-term (from a couple
weeks to a year) supply/demand planning and execution of the plans in highly differentiated organizations.
We consider planning that involves simultaneously assessing the demand and supply side potentials and
managing the flow of inventory and the creation of demand so as to minimize mismatches.
We expect this type of planning in a highly differentiated organization to require quite an explicit and
broad cross-functional reach for integration. Although particular interfaces have been developed—e.g.,
marketing and logistics (Ellinger 2000; Stank et al. 1999), purchasing and manufacturing (Fawcett and
Magnan 2002)—very few organizations have achieved “broader–reaching integration” within the
organization (Barratt 2004; Fawcett and Magnan 2002). With opportunities and challenges for planning
within supply chain management increasing as a result of such forces as increased competition and
globalization (Raman and Watson 2004), a clear understanding of the behavioral processes and systems
associated with successful interdepartmental integration is needed. While researchers have addressed the
roles and infrastructure required for integration, most of their proposals result from attempts to address

2
particular shortcomings identified in a setting (e.g., Chen 2005; Porteus and Whang 1991) or from
organizational-level analysis across firms (e.g., Lawrence and Lorsch 1986; O'Leary-Kelly and Flores 2002).
To date, however, very little empirical research has been done on functioning integration approaches
(Malhotra and Sharma 2002) and a comprehensive understanding of interdepartmental integration based on
micro-level data has yet to be established (Griffin and Hauser 1996; Kahn 1996; Kahn and Mentzer 1998).
This work aims to shed light on this issue by exploring how cross-functional integration can be achieved in a
functionally differentiated context.
In this article we report the findings from a detailed case analysis of a functioning and successful
integrated planning process. As a first contribution, the case study provides an empirical account of such an
integration approach in this particular planning setting. Our analysis of the responsibilities, structures, and
processes provide insights into how features of the approach encourage not only integration but also effective
planning. We find preliminary evidence that a collaborative planning process that encodes efficient
information processing encourages effective integration even though the incentive structure does not directly
support this integration. That is, the organization is capable of effective integration while retaining different
incentives across functions that enable the participating functions to maintain their focus on their
stakeholders’ needs. Our analysis also suggests that the specification of the coordination system needs to go
beyond the definition of responsibilities, structures, and explicitly consider the social and organizational
dimensions of the process to achieve alignment. In our case study, the characteristics of the process
generated collaborative engagement, i.e., active participations from all functions, that resulted in better
information sharing across functions, accurate and validated plans, and alignment in the execution of those
plans.
In the next section, we provide a review of the literature, then describe in section 3 our research setting and
methodology. In section 4, we detail the supply chain planning process that was implemented and the
organizational and structural changes that accompanied implementation, and in section 5 analyze the process
and explore how and why it works. We discuss the implications of our findings for organizational operations
and performance in section 6, and current practice and research in supply chain integration in section 7.
3
2. Literature Review Why is integration so difficult? Classical research suggests that the effort required to achieve integration
increases with the level of differentiation in the organizational environment (Lawrence and Lorsch 1986;
Lorsch and Allen 1973), differentiation being defined as differences in the cognitive and emotional
orientation of managers in different functional departments. This differentiation provides a breeding ground
for conflict between the groups when these cognitive and emotional orientations such as goals, incentives,
and perspectives on time and relationships create short-term conflicts and deemphasize long-term
organization goals. The effort required to achieve integration has also been found to increase with the
complexity of the collective effort. Funk (1995), for example, finds that greater logistics complexity requires
more mechanisms for coordination. Integration is made more difficult by its effects on power relationships
and organizational dynamics (Christopher 1998); it occasions resistance by giving rise to “a more process-
oriented structure which is likely to affect the position of the functional manager, his/her role in the
hierarchy, and the function itself” (Skjoett-Larsen et al. 2003). Although functional differentiation seems to
be the norm within supply chain organizations (Kahn and Mentzer 1996), questions about organizational
structure and its impact on performance have only recently begun to be asked.
The academic literature on integration within planning contexts has primarily concentrated on the
roles/responsibilities and structures supporting integration. By responsibilities we mean the participants and
the distribution of decision rights among them in the collaborative effort (e.g., Lawrence and Lorsch 1986),
and by structures we mean the accompanying formal systematic arrangements, relationships and
infrastructure (Anand and Mendelson 1997; Malone and Crowston 1994).
The literature on responsibilities primarily draws on that from organizational behavior literature. Lawrence
and Lorsch (1986) recommends explicitly the role of integrators for coordinating unity of effort. These
integrators act as translators, mediators and integrative goal setters facilitating the differing cognitive and
emotional perspectives of the various functions and directing collective efforts.
Structural recommendations for improving integration have come from analysis of the informational and
organizational infrastructure impeding integration. Such infrastructure includes the level of information
sharing among functional decision makers (Dougherty 1992; Shapiro 1977; Van Dierdonck and Miller 1980)
4
including that facilitated by enterprise information systems (Al-Mashari et al. 2003); evaluation and
incentive systems whether for individual functions (Chen 2005; Gonik 1978; Kouvelis and Lariviere 2000;
Porteus and Whang 1991) or collective incentives (Mallik and Harker 2004); support for complex decision
making whether from quantitative models (Yano and Gilbert 2004), decision support systems (Crittenden et
al. 1993), and outsourcing planning decision-making to competent third parties (Troyer et al. 2005); and
formal arrangements systematizing the desired integrative norms (Stonebraker and Afifi 2004) such as
standardization of policies, compatible communications formats, and formal hierarchies and
departmentalization
In terms of general process features for integration, the academic literature posits that interdepartmental
integration is fostered by two types of activities (Barratt 2004), (1) interaction/communication activities
(Dougherty 1992; Griffin and Hauser 1992; Ruekert and Walker 1987), and (2) collaboration-related
activities (Lawrence and Lorsch 1986; Pinto et al. 1993). Both types of activities are facilitated by norms
and specific responsibilities and goals. Interaction/communication activities, however, relate to the activities
that enable the existing types, quantity, quality, and frequency of information flows (structure) between
functions. Collaboration activities, on the other hand, relate to the roles (responsibilities) spread across
functions that in combination –and usually in the short term– have shared goals. Whereas integration and
communication activities are necessary for collaboration, collaborative activities are generally believed to be
a precondition for full integration (Barratt 2004).
The type of collaborative planning processes we examine in the case study are referred to in the
practitioner literature as sales and operations planning (S&OP) processes (Bower 2005; Lapide 2004a; b;
2005a; b). Among the primary roles of S&OP processes is to facilitate master planning and demand planning
and the flow of information between them. Practitioners and academics alike argue that the process can move
beyond the superficial synchronization of master and demand planning and begin to approach coordinated
joint planning with sophistication in the quality of plans generated (Lapide 2005a; Van Landeghem and
Vanmaele 2002).
The above review begins to suggest that a systemic perspective on integration is appropriate as the three
5
components of responsibility, structures and processes are inter-related and it is reasonable to expect that a
better fit between them will encourage greater integration. The review also reveals that the dimension of
process and its contribution to integration is one of the lesser understood components of the system. The
present in-depth case study provides the opportunity to develop insights into the dimension of process in
mid-term supply chain/demand side planning and its relation to the system needed to achieve broader-
reaching integration. Given the emphasis on coordination in supply chain management in general we refer to
this system for generating cross-functional system as a coordination system (Oliva and Watson 2004).
3. Research Methodology
3.1 Overview of the Research Site The case site is a consumer electronics firm with headquarters in northern California, and with a global sales
presence. Leitax (the firm’s name and industry have been disguised) sold its electronic items primarily
through retailers such as Best Buy and Target and has distribution centers (DC) in North America, Europe
and the Far East. Production is handled by contract-manufacturers with plants in Asia and Latin America.
Leitax maintained seven to nine models in its product portfolio, each of which had multiple SKUs. Product
life ranged from fifteen to nine months and was getting shorter. High-end, feature-packed products tended to
have the shortest product lives.
Prior to 2001, the demand and master planning processes at Leitax were ill defined. For new product
introductions and mid-life product replenishment, the sales group initially made forecasts that were
informally disseminated to the operations and finance groups, sometimes via discussions in the hallways.
These shared forecasts were intended to be used by the operations group to guide the communication of build
requests to the supply chain, and by the finance group to guide financial planning and monitoring.
Traditionally, Leitax’s sales directors forecasted sell-in sales, the expected sales from DCs to resellers.
Sell-in sales tended to be a distorted signal of demand since the sales force had an incentive to influence sell-
in in the short-term and retailers had time-varying appetites for inventory. Not surprisingly, these sales’
forecasts were often mistrusted or second-guessed when they crossed into other functional areas. For
example, with inventory shortages as its primary responsibility, the operations group would frequently
generate its own forecasts to minimize their perceived risk of an inventory discrepancy, and marketing would
6
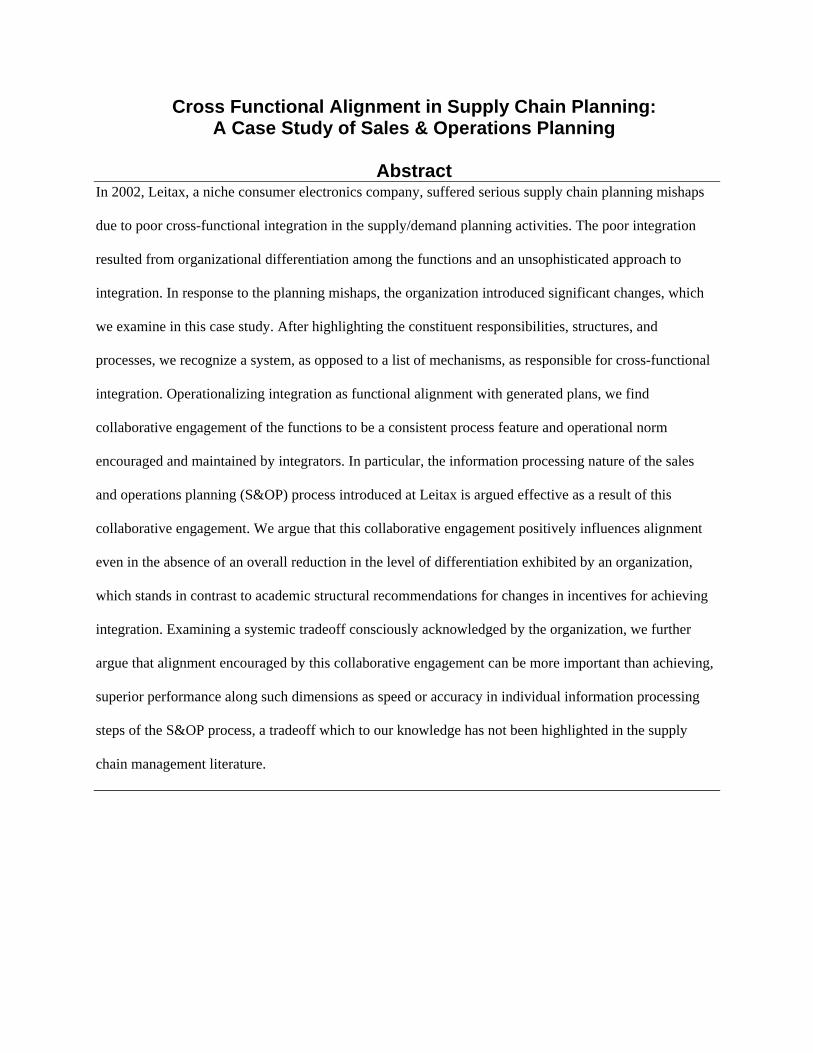
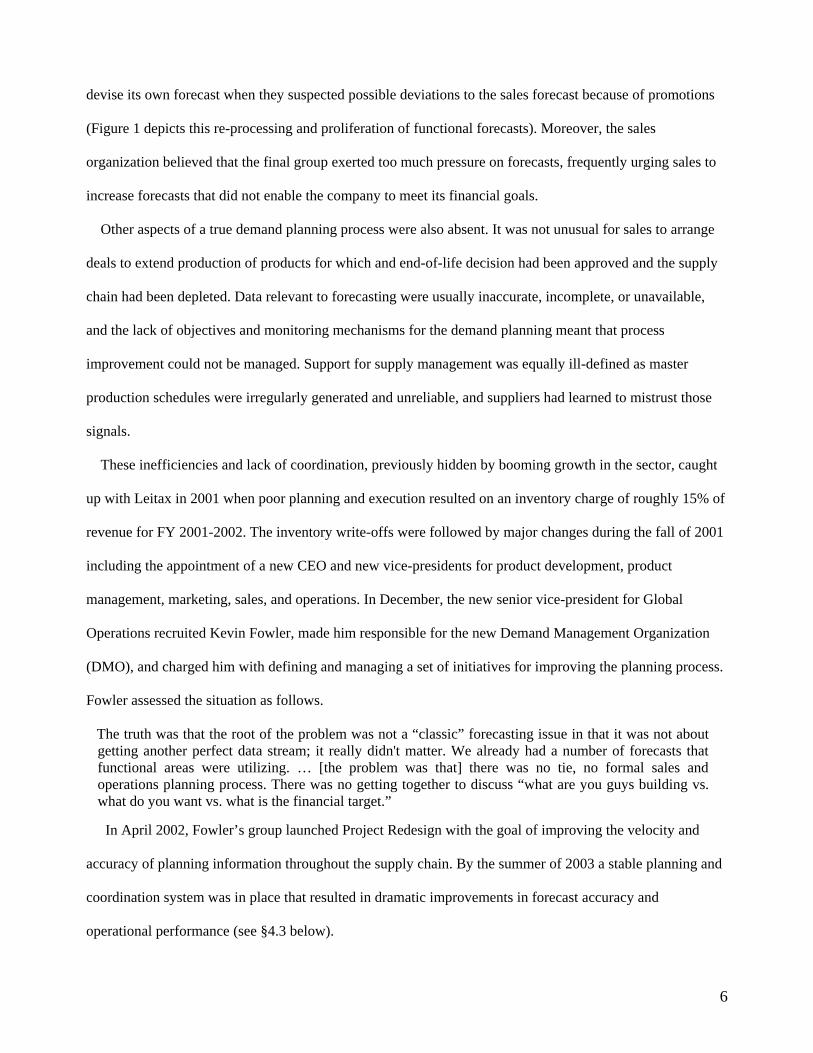
devise its own forecast when they suspected possible deviations to the sales forecast because of promotions
(Figure 1 depicts this re-processing and proliferation of functional forecasts). Moreover, the sales
organization believed that the final group exerted too much pressure on forecasts, frequently urging sales to
increase forecasts that did not enable the company to meet its financial goals.
Other aspects of a true demand planning process were also absent. It was not unusual for sales to arrange
deals to extend production of products for which and end-of-life decision had been approved and the supply
chain had been depleted. Data relevant to forecasting were usually inaccurate, incomplete, or unavailable,
and the lack of objectives and monitoring mechanisms for the demand planning meant that process
improvement could not be managed. Support for supply management was equally ill-defined as master
production schedules were irregularly generated and unreliable, and suppliers had learned to mistrust those
signals.
These inefficiencies and lack of coordination, previously hidden by booming growth in the sector, caught
up with Leitax in 2001 when poor planning and execution resulted on an inventory charge of roughly 15% of
revenue for FY 2001-2002. The inventory write-offs were followed by major changes during the fall of 2001
including the appointment of a new CEO and new vice-presidents for product development, product
management, marketing, sales, and operations. In December, the new senior vice-president for Global
Operations recruited Kevin Fowler, made him responsible for the new Demand Management Organization
(DMO), and charged him with defining and managing a set of initiatives for improving the planning process.
Fowler assessed the situation as follows.
The truth was that the root of the problem was not a “classic” forecasting issue in that it was not about getting another perfect data stream; it really didn't matter. We already had a number of forecasts that functional areas were utilizing. … [the problem was that] there was no tie, no formal sales and operations planning process. There was no getting together to discuss “what are you guys building vs. what do you want vs. what is the financial target.”
In April 2002, Fowler’s group launched Project Redesign with the goal of improving the velocity and
accuracy of planning information throughout the supply chain. By the summer of 2003 a stable planning and
coordination system was in place that resulted in dramatic improvements in forecast accuracy and
operational performance (see §4.3 below).

7
3.2 Research Method The primary tool used to derive insights from this study was intensive case study research (Eisenhardt 1989;
Yin 1984) following established protocols for grounded theory development (Glaser and Strauss 1967; Miles
and Huberman 1984). The research was retrospective; the primary initiative studied was, although evolving,
fully operational at the time the research was undertaken.
Data were collected through 25 semi-structured interviews and reviews of archival data. We interviewed
leaders, analysts and participants from all the functional areas involved in the S&OP process, as well as
heads of other divisions affected by it. We conducted most interviews in the organization’s northern CA
facility, but some follow up interviews were done by telephone. Interviews lasted from 45 to 90 minutes and
given the nature of the research, interviewees were not required to stay within the standard questions;
interviewees perceived to be exploring fruitful avenues were permitted to continue in that direction. All
interviews were recorded. Several participants were subsequently contacted and asked to elaborate on issues
they had raised or to clarify comments. The interviews were supplemented with extensive reviews of archival
data and direct observation of two planning and forecasting meetings. We summarized the data in the form of
a detailed case study that relates the story of the initiative and current challenges (**citation ommited**).
Feedback was solicited from the participants, who were asked to review their quotations, and the case, for
accuracy.
In addition to mapping the forecasting methodology and processes, we analyzed the case data using two
explicit frameworks to address planning and cross-functional integration. First, we relied on an information
processing framework to analyze the planning process (Simon and Newell 1972). The process begins with
the sharing of functionally generated data between the relevant groups. The shared information, along with
any private information that the function possesses forms, the problem space of planning for that particular
function. The functions process or make inferences from this information in order to develop their individual
plans, which they then execute. Such an approach will foster coordinated action across the different groups if
the following conditions for efficient information processing and coordination are satisfied: 1) the function’s
information package is appropriate, in terms of both content and form, to the development of adequate plans;
2) the rules of inference used by the different functions are sound; and 3) planning and execution are
8
coordinated in the aggregate and also inter-temporally across functions. The second framework was utilized
to assess cross-functional integration. According to Lawrence and Lorsch (1986), the difficulty of resolving
integration problems flows from the inevitable conflicts occasioned by the function’s differing cognitive and
emotional orientations resulting from the natural division of labor. The more differentiated the functional
areas are, the more variety the coordinating mechanism needs to accommodate (Ashby 1956). An explicit
mapping of the functional orientations along the dimensions proposed by Lawrence and Lorsch (1986)
(goals, time, formality in structure, and interpersonal), and documentation of the characteristics of the
coordination system allowed us to assess its appropriateness and uncover the impact of collaborative
engagement on the quality of information processed and degree of alignment reached.
4. Coordination System To improve forecasting and planning, Fowler introduced organizational changes that supported the needed
cross-functional activities and their coordination. These mechanisms are highlighted by first examining the
causes of the breakdown of planning at Leitax before the implementation of the coordination system. Prior to
Project Redesign, the sales force provided coordination signals in the form of forecasts and from these
signals the functional groups generated their own forecasts and plans for managing supply or demand (see
Figure 1). This approach proved ineffective at Leitax because of the mistrust other functional areas had on
the original forecast, misalignment among functions, and poor inter-temporal coordination of plans. Below,
we explore each of these causes in detail.
Forecasts communicated by the sales group were thought, and sometimes found, to be inaccurate. Among
possible reasons for the inaccuracy or perception thereof were the effects of sales’ incentives, insufficient
motivation to generate accurate forecasts, and faulty forecasting processes. Commissions on sell-in might
have prompted forecasts that positioned excess inventory in the chain to prevent stockouts. A history of poor
demand and supply planning might have fostered complacency in the preparation of forecasts. Finally, faulty
forecasts might have been a consequence of forecasting shortages instead of unconstrained demand or of
other judgmental forecasting biases.
While the primary repercussion of mistrust of the sales organization’s forecasts was the generation of
9
multiple forecasts, mistrust was not the only reason for misalignment. Functions’ naturally differing
orientations also hindered alignment. Differentiation in goals among functions at Leitax arose from natural
differences in functional objectives and resulted in specific biases. For example, incentives biased the sales
organization to want sufficient inventory to avoid stockouts, and the operations group, which was responsible
for shortages and excess inventory and for managing relationships with suppliers, to want more measured,
stable inventory levels. Sales’ emphasis on current sales opportunities, and operations’ medium- to long-term
focuses on inventory and capacity planning requirements are examples of differentiation with respect to time.
Finally, differentiation in formality of structure was observed in terms of formal reporting relationships,
criteria for rewards, and control procedures. Operations, for example, had more established routines and need
for specific details in order to communicate manufacturing requests to its contract manufacturers than did the
sales group for managing its sales accounts.
Executing a medium- to long-term demand and supply plan, especially a dynamic one, ultimately requires
coordinating over time the activities that support the plan. Poor inter-temporal coordination of auxiliary
activities and plans will compromise even a well-intentioned aggregate supply and demand plan (Barratt
2004). The setting at Leitax worked against good inter-temporal coordination, there being no explicit
processes for effecting appropriately timed broadcast and reception of inter-temporal coordinating signals.
This was exacerbated by distrust of sales’ forecasts and by the natural differentiation among functions,
particularly with respect to time, which hindered the generation and reception of inter-temporal coordinating
signals.
In the next section, the changes introduced at Leitax are described through the lens of the coordination
system introduced in §1 and §2, the explicit definition of processes, responsibilities, and structures meant to
facilitate the coordination of activities (Oliva and Watson 2004).
4.1 Responsibilities and Organizational Structure Organizationally, ownership of the forecasting and planning process was assigned to a newly formed
operations unit, the Demand Management Organization. The DMO was (and still is) responsible for:
synthesizing the necessary data; managing the planning process; resolving conflicts; and challenging,

10
creating, and disseminating demand projections to pace worldwide operations.
Fowler’s previous experience with establishing a demand forecasting group had involved heavy reliance
on statistical and simulation models. But it was his realization that the buy-in of different functional groups
was critical to the improvement of demand planning that gave rise to the consensus forecasting process that
was developed at Leitax. In soliciting functional support for the proposed new forecasting process, Fowler
offered assurances that the voices and perspectives of those in the different groups would be heard. Even
though there was general agreement that the forecasting process needed to be changed, Fowler took the time
to acquaint each group with the company’s forecast and inventory performance to date, and emphasized that
the problem was not localized in a particular group but collective. Instead of developing another statistically-
based forecasting stream, he created mechanisms that would ensure that a single forecast drove the
organization. Fowler emphasized that one of the tasks of the DMO was to eliminate bias within the planning
process.
Since we started the process we were clear that we wanted to align separate but equal data streams. It is a simple idea, but in practice it is difficult to put in place. You are trying to address bias, and it starts by just explicitly stating what the bias of each functional group is.
Fowler had begun to integrate Leitax’s disparate information streams in May 2002, but was soon
promoted to senior director of Planning and Fulfillment with responsibility for supply and demand
management. The new position afforded him an opportunity to integrate an even broader set of activities.
Fowler named Brian McMillan, whom he had hired into the DMO, to head the organization and assigned him
responsibility for driving the forecasting and demand planning processes.
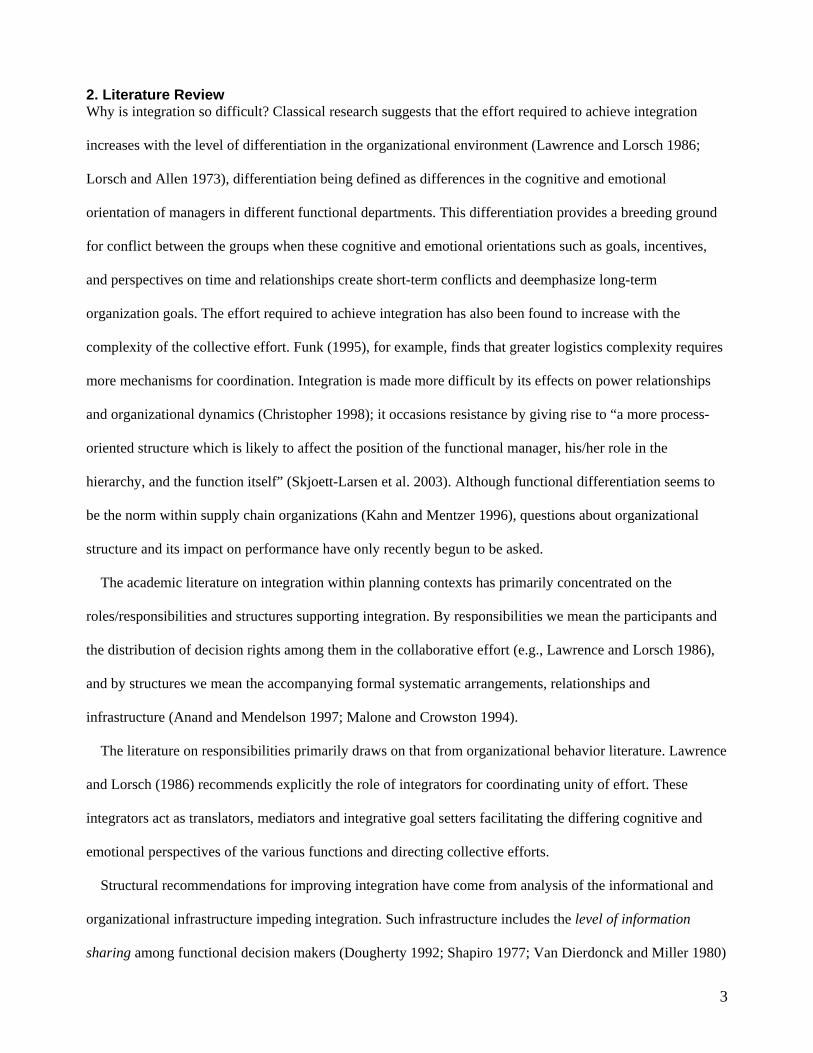
4.2 Sales and Operations Planning Process The principal output of the planning process was a consensus forecast that was used to drive all supply and
demand management decisions. The consensus forecast was generated monthly by a group that included the
sales directors and VPs of marketing, product strategy, finance, and product management. Before describing
the steps in detail, here we provide an overview of the Sales and Operations Planning (S&OP) process (see
Figure 2). The first step was the preparation of an information package referred to as the business
assumptions package (BAP). The elaboration of the BAP also functioned as the strategic planning step of the
process as it contained the current supply and demand plans for the supply chain via the decisions on price,

11
product offerings, promotions, launch and end-of-life dates for each product line. The BAP was followed by
careful validation of the strategic plan via functional forecasts, a consensus forecasting, and financial and
supply chain validation of the proposed forecast to assess whether the plans as captured in the BAP are
feasible and financially attractive. The consensus forecasting process determined the potential demand based
on the strategic decisions in the BAP. Validation by operations revealed whether capacity to accommodate
that demand was available, and validation by finance the financial attractiveness of the strategic plans. If
there were capacity or financial concerns, the assumptions in the BAP were changed, that is, the strategic
plan was changed and the process of validation repeated. Additional planning, feedback, and learning were
facilitated by directed interaction within the consensus forecasting meeting.
Information Collection and Strategic Planning: Business Assumptions Package The BAP integrated primarily two types of information, (1) current plans for product offerings including
marketing campaigns, price plans for each SKU, and end-of-life and new product introduction dates, and (2)
information that reflected the market environment such as intelligence about market trends and competitors’
products and marketing strategies and other information that had relevance for the industry in general. The
entire BAP, including current plans, was updated monthly and discussed and agreed upon by the forecasting
group during a (usually) two-hour meeting. The product planning and strategy, marketing, and DMO groups
used the information on the marketing environment to provide guidance in assessing the impact of the
information on future business performance and entered their recommendations (carefully labeled as such)
into the BAP.
Interestingly, the BAP was not initially part of the planning process. In early iterations, varying
assumptions about product price changes and promotion schedules were a significant source of variation in
the forecasts. Realizing that business assumptions were crucial to the overall process, the DMO devoted
considerable attention to developing and refining a package that summarized promotional as well as
competitors’ product information.
Validation: Functional Forecasts Once the BAP was agreed upon, the information in it was used to elaborate three functional forecasts. Fowler
and McMillan decided on three methodological changes that would help to standardize and improve the

12
accuracy of forecasts across the organization. First, the focus of the forecast was switched from sell-in to
sell-through, that is, the quantities sold from the resellers in North America or shipped from the resellers’
DCs in the other regions. Second, these forecasts ignored capacity constraints in estimating demand.1 Third,
for the planning meetings, forecasting and planning would be at the product family level.
Product planning and strategy (PPS), a three-person group that supported all aspects of the product life
cycle from launch to end-of-life, assessed competitive products and effects of price changes on demand, and
prepared a top-down forecast of anticipated global demand for Leitax products. The PPS forecast, derived
from a worldwide estimate of Leitax’s product demand, derived product- and region-specific forecasts from
historical and current trends in market share.2
The sales directors (SDs) utilized a bottom-up approach to generate their forecast. SDs from all regions
aggregated their account managers’ as well as their own knowledge about channel holdings, current sales,
and expected promotions to develop a forecast based on information about what was happening in the
distribution channel. The SDs’ bottom-up forecast was first stated as a sell-in forecast, then translated into a
sell-through forecast by maintaining for each SKU a maximum level of channel inventory (inventory at
downstream DCs and resellers). SDs’ bottom-up forecast, being based on orders and retail and distribution
partner feedback, was instrumental in determining the first 13 weeks of the master production schedule.
A third forecast of sell-through by region, prepared by the DMO entirely on the basis of statistical
inferences from past sales, was intended primarily to provide a reference point for the other two forecasts.
Significant deviations from the statistical forecast dictated that the other forecasting groups investigate and
justify their assumptions.
All forecasts included, for each product type and by region, monthly expected sales that were spread
1 It was common at this time for forecasts to be affected by perceptions of present and future supply chain capacity, which resulted in a subtle form of self-fulfilling prophecy. Even if manufacturing capacity were to become available in the future, deflated forecasts would have positioned lesser quantities of raw materials and components. Thus, expected capacity constraints could give rise to real ones.
2 The PPS group relied on market research provided by NPD Group and IDC, among others, to spot current trends, and used appropriate history as precedent in assessing competitive situations and price effects.

13
evenly over the month to yield weekly forecasts. The PPS and DMO groups’ forecasts had one-year
horizons; the SDs’ forecast was for the next two quarters.
Validation: Consensus Forecast The three groups’ forecasts were submitted on Excel templates and merged into a proposed consensus
forecast using a formulaic approach devised by the DMO that gave more weight to the SDs’ bottom-up
forecast in the short term and increased the weight of the top-down forecast as it went out to the future. The
forecasting group evaluated, in a monthly meeting, the proposed consensus forecast and three independent
forecasts. All parties were acquainted with the assumptions that drove the different forecasts with the object
of arriving at a final consensus. Discussion tended to focus on the nearest two quarters.
Whereas the first few had sometimes consumed an entire day and been characterized by heated
discussions, by the fall of 2003 consensus meetings were lasting between 2-4 hours and conversations were
cordial. McMillan focused participants on understanding the reasons behind significant differences among
the functional forecasts. The underlying reasons for diverging forecasts would be identified and discussed
and the proposed consensus forecast revised by open conversation. When justified on the basis of the SDs’
intimate knowledge of upcoming sales deals or prospects, bottom-up sales’ forecasts that were slightly higher
than the PPS’s or DMO’s were often accepted. Given its understanding of the revenue potentials at stake, the
finance group, although it did not submit a forecast, voiced opinions and concerns about the forecasts. With
little functional stake in the outcomes of the meetings, the PPS group tended to be vocal, objective, and
unemotional about the forecasts and demand planning.
Validation: Financial and Operational Assessment The final consensus forecast was sent to the finance department for financial roll up. Finance combined the
consensus forecast with pricing and promotion information from the BAP to determine expected sales,
thereby converting forecasted quantities into their revenue equivalents. Forecasted revenues were compared
with the company’s financial targets. If gaps were identified, the finance group would first ensure that the
sales group was not under-estimating the product’s market potential. If revisions made at this point did not
result in satisfactory financial performance, the forecasting group would return to the business assumptions
and, together with the marketing department, revise the pricing and promotion strategies to meet financial

14
goals and analyst expectations. These gap-filling exercises, as they were called, usually occurred at the end
of each quarter and could result in significant changes to forecasts. The approved forecast was released and
used to generate the master production schedule (MPS).
Operations validation of the final consensus forecast was an ongoing affair. In response to more consistent
and reliable MPSs, suppliers would improve the accuracy of information flows to Leitax about the status of
the supply chain and their commitment to produce received orders. More reliable MPSs also translated into
suppliers better prepared to meet future expected demand. Capacity issues were also communicated and
discussed in the consensus meetings. The feedback to the planning group provided by operations’ validation
in essence synchronized, and ensured compatibility between, the demand and supply plans.
Tactical Planning and Learning: The Other Roles of Consensus Meetings Consensus forecasting meetings were also planning meetings. The group considered new product
introductions and determined initial inventory for product launches. As a launch date drew nearer, the
consensus forecasting meeting was used to report the expected inventory status at launch, revise regional
requests, and seek consensus on regional allocations, taking into consideration any expected shortfalls.
Products to be discontinued in the current quarter were also discussed during the consensus forecasting
meetings. Proposed drop dates were presented together with sales to date, predicted sales for the rest of the
product life cycle, and available inventory. Consensus was sought on how a product’s end-of-life should be
managed.
For ongoing products, sell-in and sell-through rates and channel inventory were analyzed and compared to
expected sales. Finance aggregated channel inventory and sales data from resellers’ weekly EDI reports.
Discrepancies between reported inventories and inventories calculated from sell-in and sell-through data
were resolved and consensus sales forecasts updated based on the latest available information. Promotion or
price-change decisions were also revised in light of these data.
Throughout these tactical discussions, the group was, in effect, simultaneously planning supply and
demand operations. The consensus forecast and derived sales plans and master production schedules
reflected the strategic alignment between demand and supply plans, and the detailed discussion of product

15
introductions, withdrawals, and replenishment ensured alignment down to the technical and operational level
(e.g., shipping schedules).
The consensus forecasting meeting was also a source of feedback on forecasting performance that
emphasized, specifically, biases exhibited by functional forecasts in past meetings. The DMO, being
responsible for forecast accuracy, continuously monitored this information and used it to improve its
forecasting algorithms and heuristics and to help functional areas improve their forecasting processes. In
recent meetings, for example, the DMO had presented evidence that sales forecasts tended to over-estimate
near-term and under-estimate long-term sales.
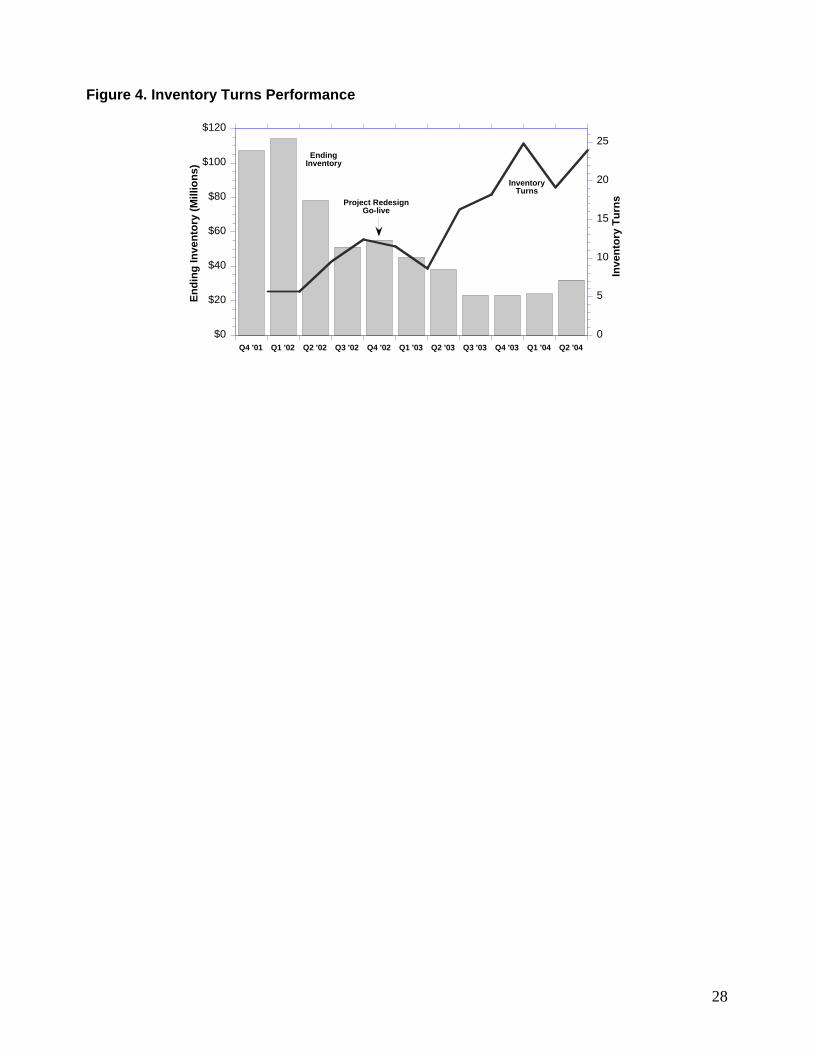
4.3 Performance Dramatic improvements in forecasting accuracy were observed by the fall of 2003. Three-month ahead sell-
thru (sell-in) forecast accuracy improved from 58% (49%) in the summer of 2002 to 88% (84%) (see Figure
3). DMO estimated, using a formula that reflected the fractional variance of the forecast error (FA=1-
ABS(sales-forecast)/forecast), the 13-week forecasting accuracy of both the sell-in and sell-through
forecasts, thirteen weeks being the longest lead-time for a principle component in Leitax’s supply chain.
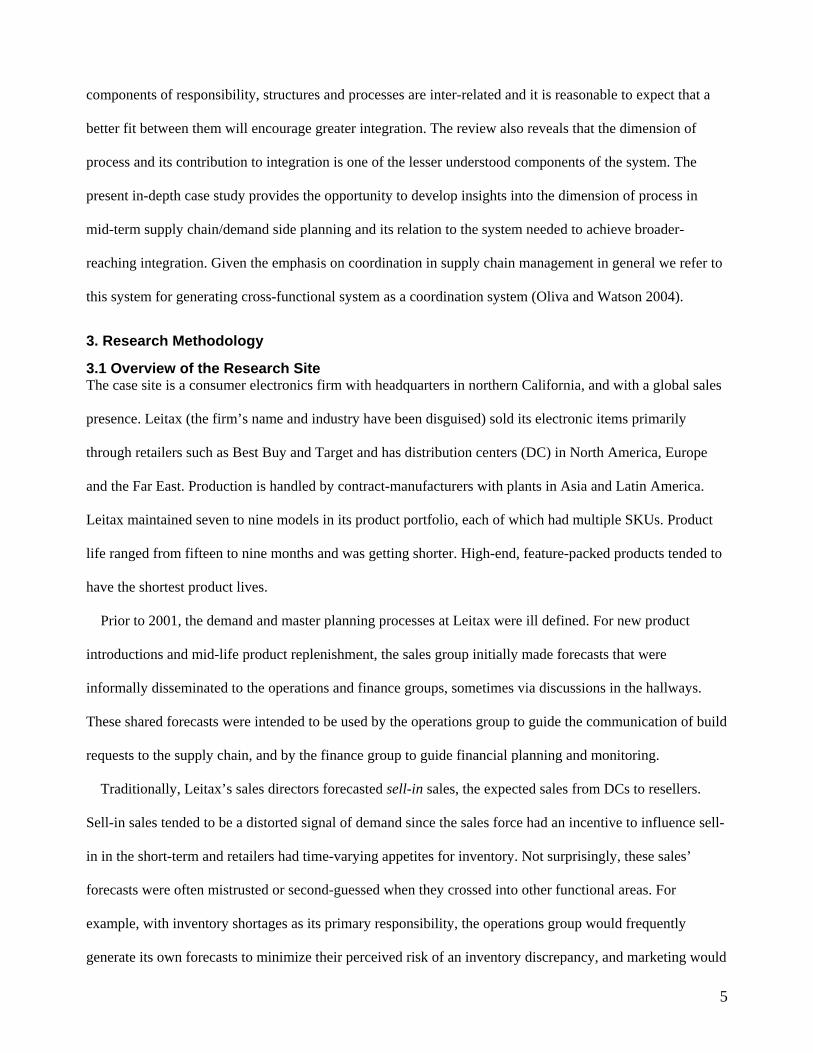
Better forecasts translated into significant operational improvements: inventory turns increased from 12 the
previous year to 26 in Q4 ’03; average on hand inventory decreased from $55M to $23M (see Figure 4); and
excess and obsolescence costs decreased from, on average, $3M for financial years 2000-2002 to practically
zero in financial year 2003.
5. Analysis Having related the changes made by Leitax from the perspective of a coordination system, we can now
examine the resulting insights into the mechanisms that link these features to performance improvements.
5.1 The Role of Integrators As revealed by the examination of the context before Project Redesign, one issue at Leitax was lack of
alignment among its differentiated functions. The coordination system requires specific organizational
devices to promote integration that facilitates decision-making across functions and the general resolution of
ensuing conflicts to the approximate satisfaction of all parties and the general good of the enterprise. From an
organizational perspective, Leitax had recourse to two options for addressing the integration problems that

16
plagued it, (1) reduce the level of differentiation between the functions sufficiently to enable integration to be
achieved through existing approaches, or (2) develop a new coordination approach that could effect better
integration among the differentiated functions. Leitax primarily implemented process changes and
organizational devices that improved integration.
A common organizational arrangement for achieving integration across differentiated functional areas is
the integrating department. Lawrence and Lorsch (1986) found that six factors determine the effectiveness of
such integrating groups. Three of these factors relate to characteristics of the integrating group. Specifically,
integrators tend to be successful to the extent that they (1) are seen as having the most important voice in
cross-functional decisions, (2) are evaluated and rewarded in accordance with the overall performance of
cross functional decision making, and (3) have a departmental structure and orientation midway between
those of the other functions. The DMO had these attributes of a successful integrating department. The DMO
was publicly mandated to improve demand planning. The case study recounts a growing influence of the
DMO over demand and supply planning due, in part, to their competence and experience in managing these
processes. The DMO’s incentives were based on forecast accuracy, which Fowler had realized early on was
in principle a cross-functional goal. The DMO exhibited flexibility and the ability to communicate with both
extremes of the organizational orientation spectrum, as reflected in its ability to take in detail sell-in forecasts
from the SDs and long-term aggregated global demand forecasts from the PPS group.
The other three factors that determine the effectiveness of integrating groups relate to interactions between
integrators and functional specialists. Effective integration is supported when (4) the managers in other
departments feel that they have influenced decisions, (5) this influence is concentrated at the managerial
level where decision-making knowledge is available, and (6) conflicts are confronted rather than avoided
(Lawrence and Lorsch 1986). At Leitax, these factors related both to organizational norms that were actively
generated and maintained by Fowler and the DMO and to features of the S&OP process. Recall that Fowler’s
approach to implementing planning process changes was to generate functional support by promising total
functional involvement in forecasting and planning. The forecasting and planning group consequently
included individuals from different functions who had sufficient knowledge or influence related to

17
forecasting, planning, or execution. As its principal designers and maintainers, Fowler and McMillan ensured
that the S&OP process incorporated these factors as well. A hallmark of the S&OP process was collaborative
engagement, a feature we define as the extent to which functions commit to, and actively participate in,
collaborative activities. This engagement was visible in many areas of the S&OP process, as we discuss in
the following section. A relevant example related to conflict resolution is that, as moderated by Fowler and
McMillan, collaborative engagement in the consensus meetings enabled conflicts over forecasts to be
confronted rather than avoided.
5.2 Coordination System Process Within a decentralized planning context, integration is most straightforwardly operationalized as alignment,
that is, unity in action and purpose in the aggregate and also inter-temporally. In this section, we elucidate the
mechanisms implicit in the S&OP process that facilitate, either directly or through learning, the conditions
for coordinated planning derived from the information processing framework presented in §3.2. Specifically,
we assess how the process supports effective integration by examining its steps: information collection and
assessment; validation; and tactical planning and learning.
Information Collection and Assessment The BAP is both a component of, and a crucial first step in, the S&OP process. That consensus meetings
proved difficult to manage when dissemination of the information package was omitted from the process
strongly suggests that, in part, informational inefficiencies hindered integration between functions. It is also
likely that these inefficiencies negatively affected the quality of individual functional forecasts and plans.
The supply and demand plans and information about the market and competitors contained in the BAP
compensated for the following informational inefficiencies: functions not being acquainted with explicit
strategic plans in terms of the assumptions about assortments, pricing roadmaps, and so forth that they were
expected to support; and information or the interpretation thereof about competitors or the market, these
being private to specific functions. The BAP directly addressed these inefficiencies through the breadth of
relevant content for validation activities, as it provided not only a similar initial starting point with respect to
data, but also an interpretation of some of the data. Recall that the PPS’s assessments of the threat levels of
competitors’ products helped to frame the problem space for functions in a manner that facilitated forecasting

18
and planning.
The manner in which the BAP was generated also fostered integration. Consensus in the S&OP process
was sought in the BAP and consensus forecasting meetings. But consensus is a loaded term. It is a stretch,
for example, to believe that all members believe the forecasts that are generated to be true. But what is true
about the BAP meetings and validation of the strategic plan in the consensus meeting is that all of the
functions have been engaged in developing the strategic plan. In the BAP meetings, the different functions
are engaged in determining, and collecting information relevant to assessing the implications of, the strategic
plan. We do not interpret engagement to mean only that members of the forecasting group and their
represented areas were passive recipients of shared information and interpretations thereof. What we
observed at Leitax was collaborative engagement, an active involvement by the participants in collecting,
validating, and processing information, and in voicing and defending their interpretations, resulting in greater
commitment to the resulting decisions.
Collaborative engagement in information collection and assessment. The collaborative engagement
that characterized this first step of generating the BAP provided two major benefits in terms of its effect on
the quality of the information package available to the functions. First, engagement led to the more complete
collection of information. As more functions became involved and actively engaged in its development, it
became more likely that the BAP would include private information and information required for planning.
Norms against private information and towards cooperative interpretation of public information were thereby
being established and reinforced. Second, in the aggregation step of generating the BAP, engagement implied
that the individual functions found the information accessible. Functional idiosyncrasies in its submission
that would hamper widespread dissemination of information were recognized and addressed here.
Idiosyncrasies in the interpretation and receipt of information were also acknowledged and adjustments made
as needed.
Validation The processes involved in validation influenced the effectiveness of planning at Leitax directly through their
effect on the quality of the rules of inference used to interpret the information package. Honest and complete
19
assessments are crucial to the proper validation of plans. Among the primary biases against which validation
processes needed to mitigate is that of desired outcomes that compromise assessments of plans’ validity. The
forecasting literature documents that this bias is mitigated by separating decision making from forecasting
(Armstrong 2001). The approaches employed in Leitax’s S&OP process to mitigate these biases were of two
types: specific mechanisms within a validation process that promoted focus and quality; and separate and
explicit validation that matched the concerns of each stakeholder.
Mechanisms within validation. Mechanisms that promoted focus and quality included the combination of
multiple forecasts in the consensus forecasting process and focus on sell-through instead of sell-in. It is well
known in the forecasting literature that combining forecasts, even through simple averaging, potentially
improves forecast accuracy (Lawrence et al. 1986). The emphasis on forecasting of sell-through provided a
reality check on sell-in forecasts, and shifted the focus away from sell-in, the sales organization’s incentive
that could compromise forecast accuracy.
Separate and explicit validation. The separate and explicit validation step further improved the quality of
assessments. For example, introducing the practice of ignoring capacity constraints improved forecast
accuracy by separating demand from sales forecasting. The explicit validation approaches employed at
Leitax, moreover, ensured that functions’ individual concerns were considered. The separate but explicit
operations validation, for example, directed the influence of these concerns on plans appropriately so that
desired or undesired outcomes could be planned for rather than inappropriately assumed away. An example
of properly directed validation concerns is the manner in which the feedback from operations and finance
validations prompted changes to the strategic plan in the BAP, and then indirectly to the forecasts, rather than
inappropriately affecting forecasts directly.
Collaborative engagement in validation. The collaborative engagement described in the previous section
was also in evidence in plan validation. It improved the effectiveness of validation by providing mechanisms
within a particular validation approach and also by ensuring explicit, separate and diverse types of validation.
Recall that the sales force and product planning groups were actively engaged in forecasting via the
individual forecasting streams they created. In consensus forecasting meetings, the attending functions were

20
actively engaged in reconciling differences in the forecasting streams. Objections to the proposed consensus
forecast and differences between the subjective forecasts of sales or PPS and the statistical forecast were
frequent topics of discussion. By surfacing the private information (or private interpretation of public
information) that motivated objections, these discussions strengthened the quality of validation. Open
interaction and discussion that elicited from participants the logic used for their inferences served to filter
poor rules that might have been used to arrive at forecasts. Collaborative engagement was also in evidence in
validations that matched the concerns of different functions as the finance group, operations and even the
suppliers were all engaged via the validation of the logistical details of capacity requirements and financial
implications.
Collaborative engagement also fostered alignment with strategic plans. Engagement, such as the
operational planning involved in validation, led to a focus on the strategic plan. Functions’ subsequent
allocation of resources to support the plan reinforced it by generating operational momentum and impeding
the allocation of resources to the generation and pursuit of alternative plans. Engagement also led to more
locally-efficient plans for the functions. Locally-efficient plans, due to the involvement of the individual
functions in validation, possess a certain ease of execution that is important for alignment. Validation of
strategic plans via operational planning undoubtedly provided feedback that suggested specific changes to
facilitate execution by individual functions. Engagement increased the imprint of every function on the
strategic plan and its validation. The resulting plans possessed more explicit and total organizational
ownership, a quality that promotes alignment. Finally, engagement gave rise to the impression among
participants that the other participants would adhere to the plans, again, promoting alignment.
Tactical Planning and Learning in the Consensus Meetings As described in §4, consensus meetings were also planning meetings in the sense that specific tactical
contingencies or needs related to events such as product introduction or end-of-life were discussed.
Consensus meetings, beyond validation and the provision of feedback from validation, afforded the inter-
temporal coordination needed for execution. The frequent, well-attended meetings accommodated timely
dissemination of coordination signals that ensured execution of original or modified plans for new or end-of-

21
life products or mid product life replenishment. The consensus meetings also afforded participants an
opportunity for learning via feedback on process performance. Such feedback was particularly helpful
because it was not simply performance feedback, but could relate performance to specific process changes or
deviations for which participants had been responsible. This kind of constructive feedback, akin to root-cause
analysis, promoted learning by reducing process deviations, whether by voluntary conformance or by the
introduction of constraining mechanisms.
Collaborative engagement in tactical planning and learning. Collaborative engagement ensured that all
parties received the coordinating signals that initiated inter-temporal coordination and performance and
process feedback, which were particularly crucial for single-occurrence events such as new product
introductions and end-of-life situations. Performance and process feedback facilitated identification of
process deviations that required modifications to improve performance. Such feedback to the sales force, for
example, revealed short- and long-term biases in forecasting accuracy. If the sales force had internalized this
feedback but been unable to mitigate the bias, probably due to its short-term orientation, collaborative
engagement implied that a modification was likely needed to the process.
6. Discussion The quality of demand and supply planning can be roughly related to the quality of information used, the
quality of the inferences made from available data (e.g., forecasts and plans), and the organization’s
conformance to the plans that are generated. The Leitax case study reveals an obsession on the part of the
creators of the S&OP process with ensuring consistency in the information flows, quality of decision-
making, validation of the decision-making process, and ability to transform decisions into actionable plans
sufficiently responsive to adjust dynamically to changes in the supply of parts and components or demand for
products. A significant fraction of the reported benefits, however, is not exclusively the result of a logical
and efficient information-processing algorithm. The coordination system (responsibilities, processes, and
structures) generated some organizational alignment, which was improved by the process’s ability to engage
participants. It can be argued that improvements in forecast accuracy and other operating metrics were less
the result of a better forecasting process than of an aligned organization working with unity of purpose to

22
realize those forecasts and plans.
Collaborative engagement brought Leitax more complete and accessible information for the planning
process, sharpened-through-debate rules of inference, and more accurate and validated forecasts.
Engagement fostered by the S&OP process yielded efficient and coordinated functional plans, and strategic
plans that reflected not only the interests of the multiple stakeholders in the organization, but the functional
groups’ accountability for and explicit commitment to adherence. Finally, collaborative engagement opened
the S&OP process itself to scrutiny and continuous revision, enabling the agents charged with executing it to
adjust the process and improve its performance.
Leitax achieved this engagement not by reducing differentiation among the functional groups involved in
demand and supply planning, but by mediating that differentiation through an agency (the DMO) that was
held accountable for the resulting forecast and plans. The S&OP process implemented by Leitax was open,
transparent, and participatory, enabling all participants to influence outcomes, and explicitly confronted
conflicts between groups. Retaining functional differentiation, specifically their incentives, enabled the
participating functional organizations to maintain their focus on stakeholders’ needs. In contrast to strategies
that attempt to align incentives, differentiation at Leitax was accommodated, and used to empower
collaborative engagement towards the end of collective planning. Open debate and explicit accommodation
of conflicting functional goals moved the S&OP process from a coordination and information sharing
process (Dougherty 1992) to a highly integrated collaborative process (Pinto et al. 1993).
The unity of purpose and action, that is, alignment, that resulted from this planning process yields two
important benefits. First, as action plans become credible, accurate statements of organizational intentions,
the organization’s reputation grows in the eyes of customers, suppliers, employees, and investors, affording
powerful leverage through trusted relationships. Second, if the organization is capable of executing according
to stated plans, the door is opened to continuous improvement as stable and predictable processes are the first
requirements for reliably interpreting historical data and making inferences for learning and improvement.
Given the benefits of alignment and resulting buy-in to the developed plan, an organization might be
willing to give up accuracy of information or efficiency of information processing if overall the process
23
affords alignment or conformance to plans. In fact, the DMO had evidence that for the second half of 2003
the statistical forecast was more accurate than the consensus forecast approved by the group. Although doing
so would save the cost of management time consumed in lengthy BAP and consensus forecast meetings,
Fowler was reluctant to streamline the process if it meant eliminating opportunities to engage participants
through confrontation and validation of the forecast and resulting plan. In the event of a major forecasting
error, absent a participatory process, the statistical forecast could be considered suspect and treated with the
same skepticism as the sales forecast had been treated prior to the Project Redesign.
The value of organizational alignment revealed through this study suggests a new dimension in the design
of coordinating systems that pursues, beyond the simple sharing of information and coordination of action,
organizational alignment.
7. Conclusion The purpose of case studies is not to argue for specific solutions but rather develop explanations (Yin 1984).
Still the question of how far an explanation goes to help with a particular range of problems is a fair one. In
terms of whether this is a problem faced by other firms, by breaking down the cause of the poor planning to
three prevalent causes in supply chain management –mistrust of forecasts, functional differentiation, and
poor intertemporal coordination– we are addressing a range of planning dysfunctions that may not show up
as specifically as they do at Leitax but are similarly engendered. We believe, and conversations with
management from diverse industries have confirmed, that these dynamics are not only prevalent in industry
but are also persistent. Similarly, when we examine the S&OP process and coordination system that were
implemented at Leitax, we are not trying to generalize a solution, but rather generate an explanation of why it
worked; thus our development of a coordination system, our abstraction of an information processing
framework for planning, and our discussion of engagement. Since these ideas (coordination system,
information processing framework, and engagement) are based on much broader theories and frameworks,
we expect the insights developed from them to be generalizable and fruitful for extension in other settings
requiring such cross-function integration. In general the evidence for generalizability comes from the
analysis of case site and the general nature of the theory used and generated (Meredith 1998).

24
Our findings have implications for practitioners and researchers. For practitioners, the Leitax case is, first
of all, a proof-of-concept that coordinating systems are capable of integrating both the information
requirements and advantages of simultaneous demand and supply management while retaining the
organizational differentiation required for different stakeholders to serve their constituencies. Furthermore, a
consensus planning system, with all its embedded advantages for buy-in and integration, was shown to be
capable of making prompt and responsive adjustments to plans in a dynamic and challenging supply chain
environment. Finally, the details of the coordinating system (responsibilities, structures, and processes) put in
place by Leitax make it clear that more is required to achieve true integration than the implementation of an
information sharing tool and the efficient information flows that result. For researchers in the supply chain
management area, the case illustrates the organizational and behavioral dimensions of coordination systems,
dimensions that, to our knowledge, have not been explicitly addressed before. The coordination system is
more than the definition of responsibilities, processes, and structures to bring together multiple functions and
organizations; it is also the explicit consideration of the social and organizational dimensions of the process
by which alignment is achieved. The case also shows the potentially powerful benefits of combining the field
of organizational behavior, which has a long tradition of recognizing the behavioral aspects of organizational
interactions, with operations management, which seeks to deepen its recognition of behavioral dynamics.
Recognition of behavioral dynamics within operations management can improve our understanding of the
mechanisms whereby processes and systems effect more efficient operations, which, in turn, can empower
the field to provide more actionable and effective process and system recommendations.
Bibliography Al-Mashari, M., A. Al-Mudimigh, M. Zairi. 2003. Enterprise resource planning: A taxonomy of critical
factors. Eur. J. Oper. Res. 146(2) 352-364. Anand, K.S., H. Mendelson. 1997. Information and organization for horizontal multimarket coordination.
Management Sci. 43(12) 1609-1627. Armstrong, J.S. (ed.). 2001. Principles of Forecasting: A handbook for Researchers and Practitioners. Kluwer
Academic Publisher, Boston. Ashby, W.R. 1956. An Introduction to Cybernetics. Champman and Hall, London. Barratt, M. 2004. Understanding the meaning of collaboration in the supply chain. Supply Chain Manag. 9(1)
30-42. Bower, P. 2005. 12 most common threats to sales and operations planning process. J. Bus. Forecast. 24(3) 4-
25
14. Chen, F. 2005. Salesforce incentives, market Information and production/inventory planning. Management
Sci. 51(1) 60-75. Christopher, M. 1998. Logistics and Supply Chain Management: Strategies for reducing costs and improving
services. Prentice-Hall, London. Crittenden, V.L., L.R. Gardiner, A. Stam. 1993. Reducing conflict between marketing and manufacturing.
Ind. Market. Manag. 22(4) 299-309. Dougherty, D. 1992. Interpretive barriers to successful product innovation in large firms. Organ. Sci. 3(2)
179-202. Eisenhardt, K.M. 1989. Building theories form case study research. Acad. Manage. Rev. 14(4) 532-550. Ellinger, A.E. 2000. Improving marketing/logistics cross-functional collaboration in the supply chain. Ind.
Market. Manag. 29(1) 85-96. Fawcett, S.E., G.M. Magnan. 2002. The rhetoric and reality of supply chain integration. Int. J. Phys. Dist.
32(5) 339-361. Funk, J.L. 1995. Just-in-time manufacturing and logistical complexity: A contingency model. Int. J. Oper.
Prod. Man. 15(5) 60-71. Glaser, B.G., A.L. Strauss. 1967. The Discovery of Grounded Theory: Strategies for Qualitative Research.
Wiedenfeld and Nicholson, London. Gonik, J. 1978. Tie salesmen's bonuses to their forecasts. Harvard Bus. Rev. 56(3) 116-123. Griffin, A., J.R. Hauser. 1992. Patterns of communication among marketing, engineering and manufacturing:
A comparison between two new product teams. Management Sci. 38(3) 360-373. Griffin, A., J.R. Hauser. 1996. Integrating R&D and marketing: A review and analysis of the literature. J.
Prod. Innovat. Manag. 13(3) 191-215. Hammond, J. 1994. Barilla (A). Harvard Business School, Harvard Business School Case, 694-046. Boston. Kahn, K.B. 1996. Interdepartmental integration: A definition and implications for product development
performance. J. Prod. Innovat. Manag. 13(2) 137-151. Kahn, K.B., J.T. Mentzer. 1996. Logistics and interdepartmental integration. Int. J. Phys. Dist. 26(8) 6-14. Kahn, K.B., J.T. Mentzer. 1998. Marketing's integration with other departments. J. Bus. Res. 42(1) 53-62. Kouvelis, P., M.A. Lariviere. 2000. Decentralizing cross-functional decisions: Coordination through internal
markets. Management Sci. 46(8) 1049-1058. Lapide, L. 2004a. Sales and operations planning Part I: The process. J. Bus. Forecast. 23(3) 17-19. Lapide, L. 2004b. Sales and operations planning Part II: Enabling technology. J. Bus. Forecast. 23(4) 18-20. Lapide, L. 2005a. An S&OP Maturity Model. J. Bus. Forecast. 24(3) 15-20. Lapide, L. 2005b. Sales and operations planning Part III: A diagnostic model. J. Bus. Forecast. 24(1) 13-16. Lawrence, M.J., R.H. Edmundson, M.J. O'Connor. 1986. The accuracy of combining judgmental and
statistical forecasts. Management Sci. 32(12) 1521-1532. Lawrence, P.R., J.W. Lorsch. 1986. Organization and Environment: Managing Differentiation and
Integration. Harvard Business School Press, Boston. Lorsch, J.W., S.I. Allen. 1973. Managing Diversity and Interdependence: An Organizational Study of
Multidivisional Firms. Harvard Business School Press, Boston. Malhotra, M.K., S. Sharma. 2002. Spanning the continuum between marketing and operations. J. Oper.
Manag. 20(3) 209-219. Mallik, S., P.T. Harker. 2004. Coordinating supply chains with competition: Capacity allocation in
semiconductor manufacturing. Eur. J. Oper. Res. 159(2) 330-347.

26
Malone, T.W., K. Crowston. 1994. The interdisciplinary study of coordination. ACM Computing Surveys 26(1) 87-119.
Meredith, J. 1998. Building operations management throry through case and field research. J. Oper. Manag. 16 441-454.
Miles, M., A. Huberman. 1984. Qualitative Data Analysis. Sage, Newbury Park, CA. O'Leary-Kelly, S.W., B.E. Flores. 2002. The integration of manufacturing and marketing/sales decisions:
impact on organizational performance. J. Oper. Manag. 20(3) 221-240. Oliva, R., N. Watson. 2004. What drives supply chain behavior? Harvard Bus. Sch. Working Knowledge,
June 7, 2004. Available from http://hbswk.hbs.edu/item.jhtml?id=4170&t=bizhistory. Pinto, M.B., J.K. Pinto, J.E. Prescott. 1993. Antecedents and consequences of project team cross-functional
cooperation. Management Sci. 39(10) 1281-1297. Porteus, E.L., S. Whang. 1991. On manufacturing marketing incentives. Management Sci. 37(9) 1166-1181. Raman, A., N. Watson. 2004. Managing global supply chains. In Quelch, J. A., R. Deshpande (eds.), The
Global Market: Developing a Strategy to Manage Across Borders, Jossey-Bass, San Francisco, CA, pp. xx-xx.
Ruekert, R.W., O.C. Walker. 1987. Marketing interaction with other functional units: A conceptual framework and empirical evidence. J. Marketing 51(1) 1-19.
Shapiro, B.P. 1977. Can marketing and manufacturing co-exist? Harvard Bus. Rev. 55(5) 104-114. Simon, H.A., A. Newell. 1972. Human Problem Solving. Prentice-Hall, Englewood Cliffs, N.J. Skjoett-Larsen, T., C. Thernoe, C. Andresen. 2003. Supply chain collaboration: Theoretical perspectives and
empirical evidence. Int. J. Phys. Dist. 33(6) 531-549. Stank, T.P., P.J. Daugherty, A.E. Ellinger. 1999. Marketing/Logistics interaction and firm performance. Int.
J. Logistics Man. 10(1) 11-24. Stank, T.P., S.B. Keller, D.J. Closs. 2001. Performance benefits of supply chain logistical integration.
Transport. J. 41(2-3) 32-46. Stonebraker, P.W., R. Afifi. 2004. Towards a contingency theory of supply chains. Manage. Decis. 42(9)
1131-1144. Troyer, L., J. Smith, S. Marshall, E. Yaniv, S. Tayur, M. Barkman, A. Kaya, Y. Liu. 2005. Improving asset
management and order fulfillment at Deere & Company's C&CE division. Interfaces 35(1) 76-87. Van Dierdonck, R., J.G. Miller. 1980. Designing production planning and control systems. J. Oper. Manag.
1(1) 37-46. Van Landeghem, H., H. Vanmaele. 2002. Robust planning: A new paradigm for demand chain planning. J.
Oper. Manag. 20(6) 769-783. Yano, C.A., S.M. Gilbert. 2004. Coordinated pricing and production/procurement decision: A review. In
Chakravarty, J. E. (ed.), Managing Business Interfaces: Marketing, Engineering, and Manufacturing Perspectives, Springer, New York, pp. 39-xx.
Yin, R. 1984. Case Study Research. Sage, Beverly Hills, CA.

27
Figure 1. Initial Situation
Operationsinfo
Financeinfo
Financeforecast
Operationsforecast
.
.
.
.
.
.
Salesinfo
Salesforecast
Salesplanning
Financeplanning
Operationsplanning
.
.
.
Figure 2. Sales and Operations Planning Process
Gap-fillingActivities
InformationCollection and
Sharing
AggregateValidation
Financial andOperationalValidation
FunctionalValidation
Forecast AccuracyAssessment
BAP FunctionalForecasts
ConsensusForecast
Financial Forecast & Supplier Commitments
Assumptions Changes
ForecastFeedback
ForecastFeedback
Figure 3. Forecast Accuracy Performance
0%
20%
40%
60%
80%
100%
Dec-Feb 2002 Mar-May 2002 Jun-Aug 2002 Sep-Nov 2002 Dec-Feb 2003 Mar-May 2003 Jun-Aug 2003 Sep-Nov 2003
Acc
urac
y
Goal
Sell-thorugh
Sell-in
Project RedesignGo-Live
28
Figure 4. Inventory Turns Performance
$0
$20
$40
$60
$80
$100
$120
0
5
10
15
20
25
Q4 '01 Q1 '02 Q2 '02 Q3 '02 Q4 '02 Q1 '03 Q2 '03 Q3 '03 Q4 '03 Q1 '04 Q2 '04
Endi
ng In
vent
ory
(Mill
ions
)
Inve
ntor
y Tu
rnsProject Redesign
Go-live
EndingInventory
InventoryTurns