crop report
DESCRIPTION
Crop Report 2010-2011TRANSCRIPT
ISSN: 1554-9089
World Agricultural Supply and Demand Estimates
United States Department of Agriculture Office of the Chief Economist
Agricultural Marketing Service Farm Service Agency
Economic Research Service Foreign Agricultural Service
WASDE - 492 Approved by the World Agricultural Outlook Board March 10, 2011 WHEAT: U.S. wheat ending stocks for 2010/11 are projected higher this month on reduced export prospects. Projected exports are lowered 25 million bushels with increased world supplies of high quality wheat, particularly in Australia, and a slower-than-expected pace of U.S. shipments heading into the final quarter of the wheat marketing year. By-class changes include lower projected exports for Hard Red Spring, White, and durum wheat, partly offset by small increases for Hard Red Winter and Soft Red Winter wheat. The marketing-year average price received by producers is projected at $5.60 to $5.80 per bushel, unchanged from last month. Global 2010/11 wheat supplies are projected 1.9 million tons higher reflecting higher production. Argentina production is raised 1.0 million tons based on higher reported yields. Australia production is raised 1.0 million tons with higher yields in Western Australia where wheat quality was not hurt by harvest rains as in the east. Other production changes include a 0.5-million-ton reduction for EU-27 with a smaller crop reported for Denmark and a 0.6-million-ton increase for Saudi Arabia on an upward revision to area. Global wheat trade is projected lower partly reflecting reduced import prospects for a number of smaller markets as high prices trim demand. The largest import reduction, however, is for Russia where imports are lowered 1.5 million tons. Despite last year’s drought, Russia appears to be meeting its wheat needs as the government’s export ban helps maintain supplies for domestic users. With lower imports by Russia, Ukraine exports are lowered 1.5 million tons. Ukraine’s export restrictions have also disrupted trade with non-FSU countries. Exports are lowered 0.5 million tons for EU-27 on tighter supplies and the rising value of the Euro. Although exports are unchanged for the Australia October-September marketing year, exports are raised 1.0 million tons for the 2010/11 July-June international trade year increasing expected competition for U.S. wheat exports over the next few months. Global 2010/11 wheat consumption is projected lower with the biggest change being a 1.5-million-ton reduction in expected wheat feeding for Russia. With increased global production and reduced usage, world ending stocks for 2010/11 are projected 4.1 million tons higher. COARSE GRAINS: The U.S. feed grain balance sheet for 2010/11 is nearly unchanged this month. Projections for corn, sorghum, and oats supplies, usage, and ending stocks are all unchanged. Barley exports are lowered 2 million bushels reflecting the slow pace of shipments and sales to date. The projected marketing-year average farm price for corn is narrowed 10 cents on both ends of the range to $5.15 to $5.65 per bushel. Farm price projections for sorghum and barley are lowered slightly and the oats farm price projection is raised slightly, all reflecting reported prices to date.

WASDE-492-2
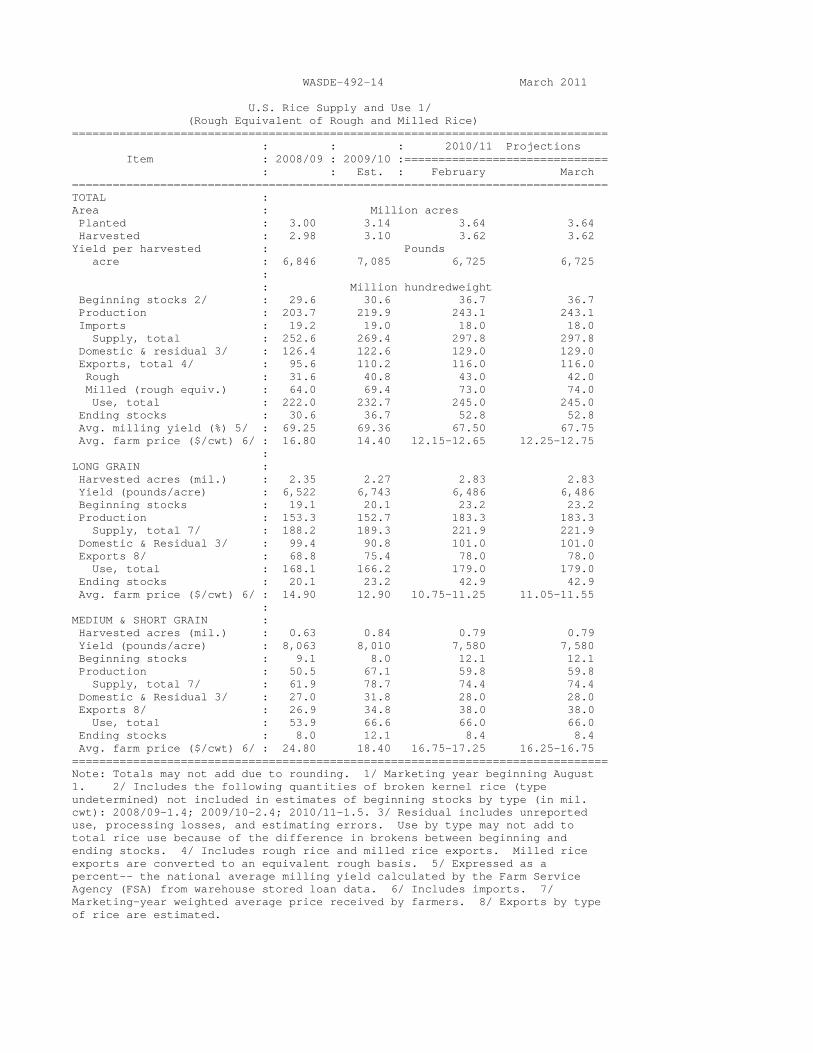
Global coarse grain supplies for 2010/11 are projected 2.5 million tons lower this month with lower corn beginning stocks and reduced corn, barley, sorghum, and oats production. Global corn beginning stocks are lowered 0.6 million tons with upward revisions to Brazil exports and India feeding in 2009/10. Global 2010/11 corn production is reduced 0.5 million tons as lower production in Mexico and India is partially offset by higher production in Brazil. Brazil corn production for 2010/11 is raised 2.0 million tons reflecting higher reported area and yields in the summer crop and expectations for increased area for the winter crop with government planting dates extended for crop insurance and loan programs. Mexico corn production is reduced 2.0 million tons as the unusual early February freeze destroyed standing corn crops across much of the northwest winter corn region, which normally accounts for about one-fourth of the country’s total corn production. Replanting is expected to offset some of the loss, but seasonally high temperatures in the coming months limit the growing season window. Global 2010/11 sorghum and barley production are each lowered 0.5 million tons and oats production is lowered 0.3 million tons. Lower sorghum output for India more than offsets an increase for Australia. Lower barley and oats output for Australia account for most of the reduction in world production for these coarse grains. Global 2010/11 coarse grain imports are raised this month as increases for corn and sorghum more than offset a reduction for barley. Corn imports are raised 1.1 million tons for Mexico with the lower production outlook. Corn imports are raised 1.0 million tons for EU-27 on stronger expected feeding. A 0.5-million-ton reduction for Russia corn imports is partly offsetting. Sorghum imports are raised for EU-27 and barley imports are lowered for Russia, Saudi Arabia, and China. Increased corn feeding in EU-27 is more than offset by reductions in feeding in Russia and lower food, seed, and industrial use in India and Mexico. Projected global corn ending stocks are raised slightly. RICE: No changes are made on the supply side of the U.S. 2010/11 rice supply and use balance sheet. On the use side, domestic and residual use and total exports are unchanged from a month ago; however, the rough rice export forecast is lowered 1.0 million cwt, which is offset by an increase in the combined milled and brown export forecast (rough-equivalent basis). Long-grain and combined medium- and short-grain rice exports are forecast at 78.0 million cwt and 38.0 million, respectively, unchanged from the previous month. All rice ending stocks are projected at 52.8 million cwt, unchanged from last month, and the largest stocks since 1985/86. Long-grain rice stocks are projected at 42.9 million cwt, and combined medium- and short-grain rice stocks at 8.4 million, both unchanged from a month ago. The 2010/11 average milling rate is revised to 67.75 percent, up 0.25 points from last month. The average milling rate is determined from updated Farm Service Agency warehouse stored loan data for long-, medium-, and short-grain rice. The 2010/11 long-grain season-average price is projected at $11.05 to $11.55 per cwt, up 30 cents on each end of the range from last month. The combined medium- and short-grain price is projected at $16.25 to $16.75 per cwt, down 50 cents on each end of the range. The all rice season-average price is forecast at $12.25 to $12.75 per cwt, up 10 cents on both ends of the range. The price projections are based on the National Agricultural Statistics Service reported prices through mid-February and expected prices the remainder of the marketing year.
WASDE-492-3
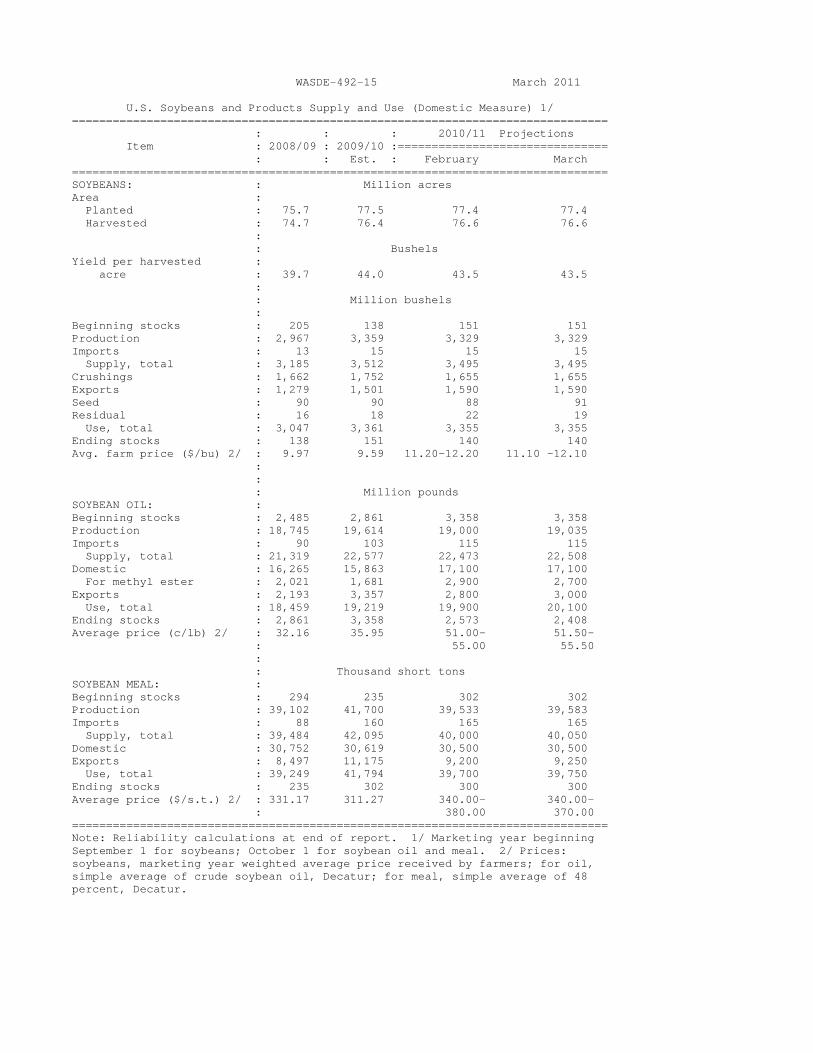
Global 2010/11 projections of rice production, consumption, and exports are lowered from a month ago, and ending stocks are raised. The decrease in the global production forecast, still a record at 451.5 million tons, is due entirely to a decrease in the rice crop in India, which is partially offset by increases for Argentina and Brazil. India’s rice crop is forecast at 94.5 million tons, down 500,000 tons from last month due to an expected decrease in average yield. Drier than normal weather in the eastern and northern rice growing regions is expected to lower Rabi yields. The increases in Argentina and Brazil are due to an expected increase in harvested area. Global consumption is lowered 5.3 million tons to 447.0 million, still a record, primarily due to reductions in India (-4.0 million) and China (-0.5 million). Conversely, global ending stocks are raised 4.9 million tons to 98.8 million attributed mostly to increases for India, China, Bangladesh, and Burma. India’s 2010/11 ending stocks are raised 3.6 million tons to 21.6 million based on recently received information on government-held stocks. China’s 2010/11 ending stocks are raised nearly 1.0 million tons based on information from the Agricultural Counselor in Beijing. Global 2010/11 exports are lowered nearly 0.5 million tons, due mostly to reductions in Burma, China, and India. OILSEEDS: U.S. soybean supply and use projections for 2010/11 are mostly unchanged from last month. A higher soybean meal extraction rate is offset by a small increase in soybean meal exports, leaving the projected soybean crush unchanged. Soybean oil production is increased due to a higher soybean oil extraction rate. Soybean oil used for biodiesel for 2010/11 is projected at 2.7 billion pounds, down 200 million from last month due to lower-than-expected production through January. Soybean oil exports are increased 200 million pounds to 3.0 billion reflecting continued strong export shipments and sales. Soybean oil stocks are projected at 2.4 billion pounds, down 165 million from last month. If realized, soybean oil ending stocks would be the lowest in 6 years. The U.S. season-average soybean price range for 2010/11 is projected at $11.10 to $12.10 per bushel, down 10 cents on both ends of the range. Soybean oil prices are forecast at 51.5 to 55.5 cents per pound, up 0.5 cents on both ends. Soybean meal prices are forecast at $340 to $370 per short ton, down 10 dollars on the high end. Global oilseed production for 2010/11 is projected at 444.2 million tons, up 2.4 million tons from last month. Foreign production, projected at 343.7 million tons, accounts for all of the change. Brazil soybean production is forecast at a record 70.0 million tons, up 1.5 million tons from last month due to higher projected yields. Soybean production is also raised for China. Global sunflowerseed production is raised 0.3 million tons due to higher estimates for China and EU-27. Global cottonseed production is reduced with lower production in China, India, and Uzbekistan only partly offset by increases for Australia and Brazil. Global oilseed supplies, crush, and ending stocks are projected higher this month. Soybean crush is projected higher for Brazil and India, and sunflowerseed crush is raised for China and EU-27. Higher soybean stocks for Brazil and Argentina are only partly offset by reductions for China, Canada, and India. Higher rapeseed stocks are projected for EU-27, Australia, and Turkey. Global protein meal production, consumption, and stocks are all projected higher this month.
WASDE-492-4
SUGAR: Projected U.S. sugar supply for fiscal year 2010/11 is decreased 163,000 short tons, raw value, from last month. Cane sugar production in Florida is reduced 60,000 tons, based on processor forecasts. Imports from Mexico are decreased 110,000 tons, in line with Mexico=s lower production and export forecasts. Use is unchanged. Ending stocks of 1.185 million tons are 10.4 percent of use. For Mexico, 2010/11 sugar production is decreased 100,000 metric tons, raw value, based on indications that recent freeze damage reduced production potential. Exports are decreased 100,000 tons. LIVESTOCK, POULTRY, AND DAIRY: The forecast for 2011 red meat and poultry production is raised from last month, reflecting increased production of beef, pork, broilers, and turkeys. Fed cattle slaughter will reflect expected strength in feedlot placements during early 2011 and relatively large dairy cow slaughter in the first part of 2011 will also contribute to higher beef production. However, the effects of increased cattle slaughter will be partly mitigated by lower expected carcass weights. Pork production is increased from last month as carcass weights thus far in the first quarter are well above last year. Broiler and turkey production is forecast higher in the first half of 2011. The broiler production increase largely reflects relatively heavy bird weights but the increase in turkey production forecast reflects higher increases in poult placements as well as increased bird weights. The egg production forecast is raised as the table egg type laying flock has been increasing. Estimates of 2010 poultry and egg production are adjusted to reflect data revisions. The forecast for beef exports for 2011 is raised from last month on strength in exports to Asia. The beef import forecast is reduced as supplies in several exporting countries are expected to remain tight and a relatively weak U.S. dollar is expected to constrain shipments. The pork and poultry export forecasts for 2011 are unchanged from last month. Trade estimates for 2010 reflect import and export data for December. Despite the higher production forecasts, prices for livestock and poultry are raised from last month. Robust exports and improving domestic demand in the face of relatively tight meat supplies are expected to support higher price forecasts for cattle, hogs, broilers, and turkeys. Egg prices in the first quarter are forecast lower due to recent price declines. The milk production forecast for 2011 is reduced from last month. Relatively high milk prices and increased supplies of replacement heifers are expected to encourage further increases in the cow herd through much of the year, but the rate of increase in milk per cow is forecast slower than last month. Exports are forecast higher as global nonfat dry milk and cheese demand remains strong with tight supplies in competitor markets expected through the first half of 2011. Estimates of 2010 milk production are adjusted to reflect data revisions. Dairy product prices are forecast higher this month on strong early year prices. Strong international demand and improving domestic demand will support prices for most products. Currently tight butter stocks are also helping support butter prices. Class III and Class IV price forecasts are raised to reflect higher product prices. The all milk price is forecast to average $18.10 to $18.70 per cwt for 2011.

WASDE-492-5
COTTON: The U.S. 2010/11 cotton supply and demand estimates are unchanged from last month. The forecast range of 80 to 83 cents per pound for the average price received by producers is narrowed 1 cent on each end. The world 2010/11 supply and demand estimates include marginally lower production and ending stocks relative to last month. World production is reduced 300,000 bales as decreases for India and China are mostly offset by increases for Australia and Brazil. World consumption is virtually unchanged. World trade is raised slightly, as lower production in China is expected to increase import demand. Approved by the Secretary of Agriculture and the Chairperson of the World Agricultural Outlook Board, Gerald A. Bange, (202) 720-6030. This report was prepared by the Interagency Commodity Estimates Committees.
APPROVED BY:
KARIS T. GUTTER
ACTING SECRETARY OF AGRICULTURE
WASDE-492-6
INTERAGENCY COMMODITY ESTIMATES COMMITTEES
Note: The World Agricultural Outlook Board reviews and approves the World Agricultural Supply and Demand Estimates (WASDE) report. The Board’s analysts chair the Interagency Commodity Estimates Committees (ICECs) that prepare the monthly report.
Wheat: Jerry Norton, ICEC Chair, WAOB, E-mail: [email protected] Gary Vocke, ERS; Teresa McKeivier, FAS; William Chambers, FSA. Rice: Andrew C. Aaronson, ICEC Chair, WAOB, E-mail: [email protected] Nathan Childs, ERS; Debbie Rubas, FAS; Mark Simone, FSA. Feed Grains: Jerry Norton, ICEC Chair, WAOB, E-mail: [email protected] Thomas Capehart, ERS; Richard O=Meara, FAS; Pete Riley, FSA. Oilseeds: Keith Menzie, ICEC Chair, WAOB, E-mail: [email protected] Mark Ash, ERS; Bill George, FAS; Max Fisher, FSA. Cotton: Carol Skelly, ICEC Chair, WAOB, E-mail: [email protected] Darryl Earnest, AMS; Leslie Meyer, ERS; James Johnson, FAS; Eugene Rosera, FSA. Sugar: John Love, ICEC Chair, WAOB, E-mail: [email protected] Stephen Haley, ERS; Ron Lord, FAS; Barbara Fecso, FSA. Meat Animals: Shayle Shagam, ICEC Chair, WAOB, E-mail: [email protected] Sherry Wise, AMS; Kenneth Mathews, ERS; Claire Mezoughem, FAS; Dale Leuck, FSA. Poultry: Shayle Shagam, ICEC Chair, WAOB, E-mail: [email protected] Larry Haller, AMS; David Harvey, ERS; Anneke Gustafson, FAS; Milton Madison, FSA. Dairy: Shayle Shagam, ICEC Chair, WAOB, E-mail: [email protected] Jerry Cessna, AMS; Roger Hoskin, ERS; Paul Kiendl, FAS; Milton Madison, FSA.
In 2011, the WASDE report will be released on Apr. 8, May 11, Jun. 9, Jul. 12, Aug. 11, Sep. 12, Oct. 12, Nov. 9, Dec. 9.
WASDE-492-7
T A B L E OF C O N T E N T S
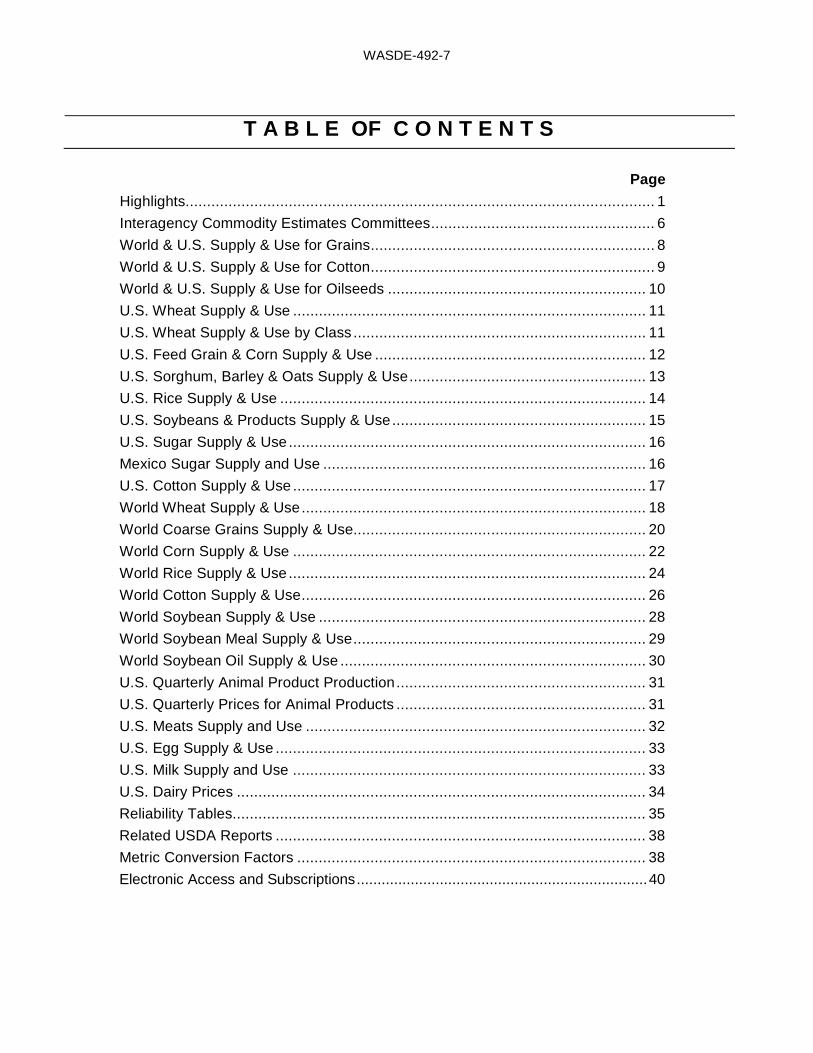
Page Highlights............................................................................................................. 1 Interagency Commodity Estimates Committees .................................................... 6 World & U.S. Supply & Use for Grains .................................................................. 8 World & U.S. Supply & Use for Cotton .................................................................. 9 World & U.S. Supply & Use for Oilseeds ............................................................ 10 U.S. Wheat Supply & Use .................................................................................. 11 U.S. Wheat Supply & Use by Class .................................................................... 11 U.S. Feed Grain & Corn Supply & Use ............................................................... 12 U.S. Sorghum, Barley & Oats Supply & Use ....................................................... 13 U.S. Rice Supply & Use ..................................................................................... 14 U.S. Soybeans & Products Supply & Use ........................................................... 15 U.S. Sugar Supply & Use ................................................................................... 16 Mexico Sugar Supply and Use ........................................................................... 16 U.S. Cotton Supply & Use .................................................................................. 17 World Wheat Supply & Use ................................................................................ 18 World Coarse Grains Supply & Use.................................................................... 20 World Corn Supply & Use .................................................................................. 22 World Rice Supply & Use ................................................................................... 24 World Cotton Supply & Use ................................................................................ 26 World Soybean Supply & Use ............................................................................ 28 World Soybean Meal Supply & Use .................................................................... 29 World Soybean Oil Supply & Use ....................................................................... 30 U.S. Quarterly Animal Product Production .......................................................... 31 U.S. Quarterly Prices for Animal Products .......................................................... 31 U.S. Meats Supply and Use ............................................................................... 32 U.S. Egg Supply & Use ...................................................................................... 33 U.S. Milk Supply and Use .................................................................................. 33 U.S. Dairy Prices ............................................................................................... 34 Reliability Tables................................................................................................ 35 Related USDA Reports ...................................................................................... 38 Metric Conversion Factors ................................................................................. 38 Electronic Access and Subscriptions ...................................................................... 40
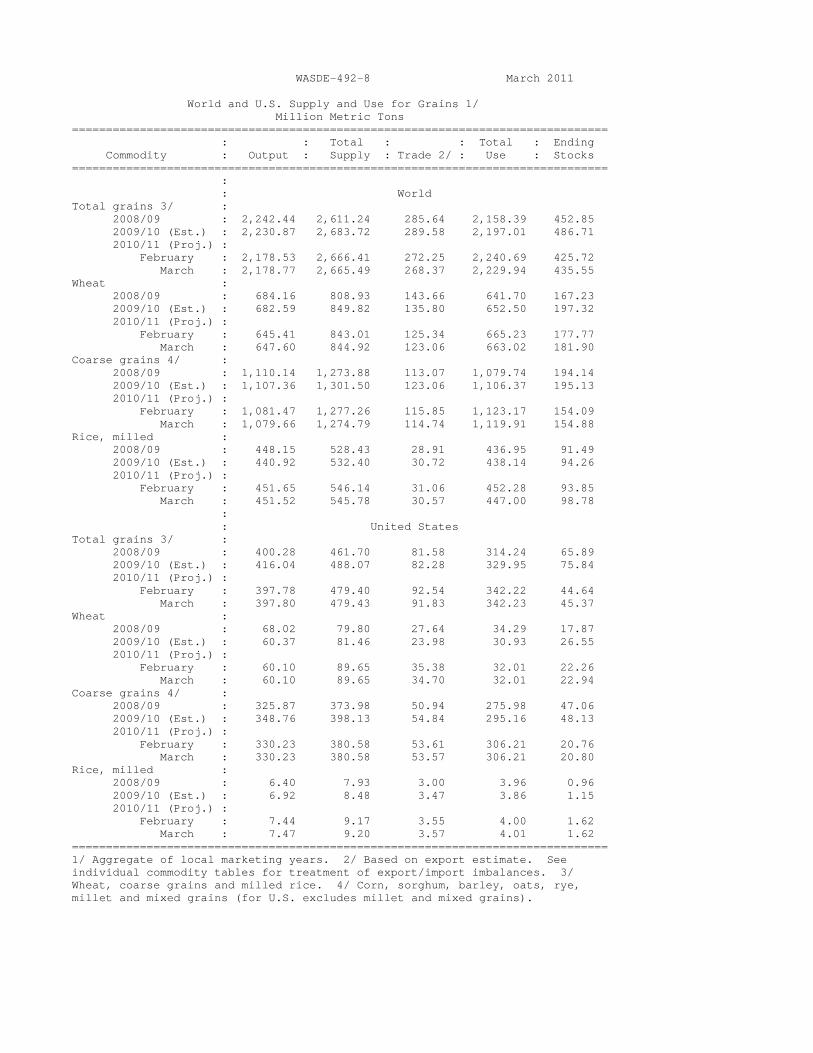
WASDE-492-8 March 2011 World and U.S. Supply and Use for Grains 1/ Million Metric Tons =============================================================================== : : Total : : Total : Ending Commodity : Output : Supply : Trade 2/ : Use : Stocks =============================================================================== : : World Total grains 3/ : 2008/09 : 2,242.44 2,611.24 285.64 2,158.39 452.85 2009/10 (Est.) : 2,230.87 2,683.72 289.58 2,197.01 486.71 2010/11 (Proj.) : February : 2,178.53 2,666.41 272.25 2,240.69 425.72 March : 2,178.77 2,665.49 268.37 2,229.94 435.55 Wheat : 2008/09 : 684.16 808.93 143.66 641.70 167.23 2009/10 (Est.) : 682.59 849.82 135.80 652.50 197.32 2010/11 (Proj.) : February : 645.41 843.01 125.34 665.23 177.77 March : 647.60 844.92 123.06 663.02 181.90 Coarse grains 4/ : 2008/09 : 1,110.14 1,273.88 113.07 1,079.74 194.14 2009/10 (Est.) : 1,107.36 1,301.50 123.06 1,106.37 195.13 2010/11 (Proj.) : February : 1,081.47 1,277.26 115.85 1,123.17 154.09 March : 1,079.66 1,274.79 114.74 1,119.91 154.88 Rice, milled : 2008/09 : 448.15 528.43 28.91 436.95 91.49 2009/10 (Est.) : 440.92 532.40 30.72 438.14 94.26 2010/11 (Proj.) : February : 451.65 546.14 31.06 452.28 93.85 March : 451.52 545.78 30.57 447.00 98.78 : : United States Total grains 3/ : 2008/09 : 400.28 461.70 81.58 314.24 65.89 2009/10 (Est.) : 416.04 488.07 82.28 329.95 75.84 2010/11 (Proj.) : February : 397.78 479.40 92.54 342.22 44.64 March : 397.80 479.43 91.83 342.23 45.37 Wheat : 2008/09 : 68.02 79.80 27.64 34.29 17.87 2009/10 (Est.) : 60.37 81.46 23.98 30.93 26.55 2010/11 (Proj.) : February : 60.10 89.65 35.38 32.01 22.26 March : 60.10 89.65 34.70 32.01 22.94 Coarse grains 4/ : 2008/09 : 325.87 373.98 50.94 275.98 47.06 2009/10 (Est.) : 348.76 398.13 54.84 295.16 48.13 2010/11 (Proj.) : February : 330.23 380.58 53.61 306.21 20.76 March : 330.23 380.58 53.57 306.21 20.80 Rice, milled : 2008/09 : 6.40 7.93 3.00 3.96 0.96 2009/10 (Est.) : 6.92 8.48 3.47 3.86 1.15 2010/11 (Proj.) : February : 7.44 9.17 3.55 4.00 1.62 March : 7.47 9.20 3.57 4.01 1.62 =============================================================================== 1/ Aggregate of local marketing years. 2/ Based on export estimate. See individual commodity tables for treatment of export/import imbalances. 3/ Wheat, coarse grains and milled rice. 4/ Corn, sorghum, barley, oats, rye, millet and mixed grains (for U.S. excludes millet and mixed grains).
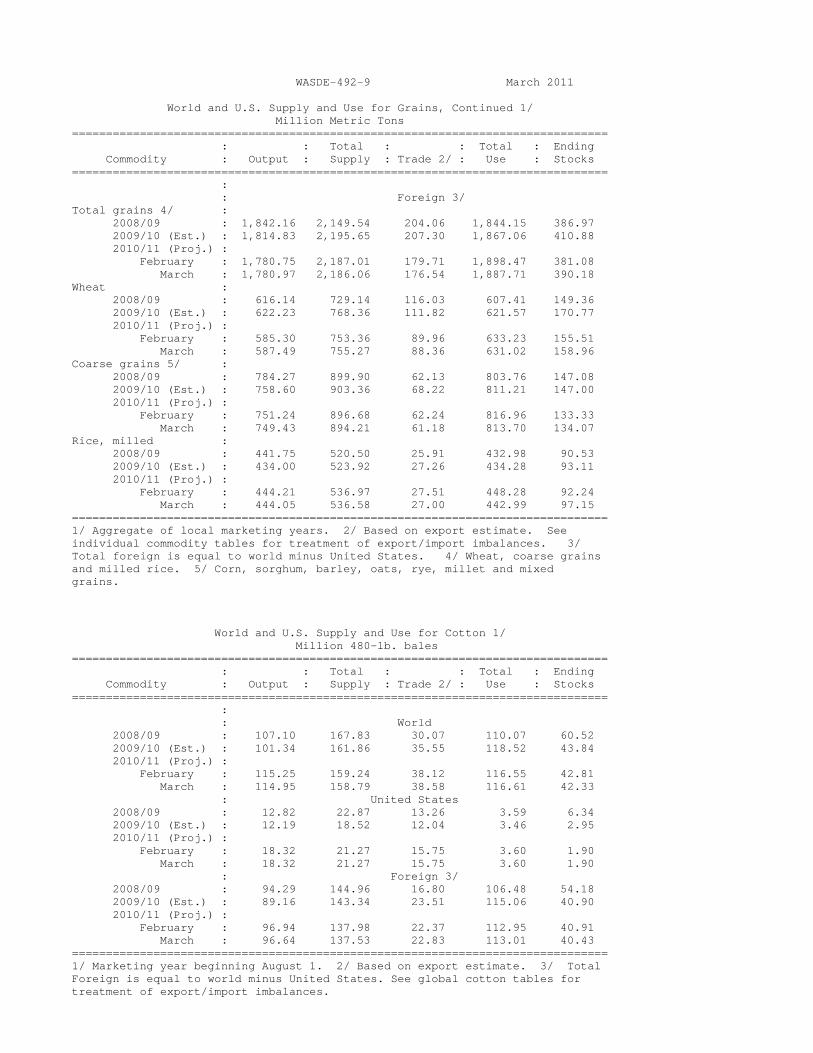
WASDE-492-9 March 2011 World and U.S. Supply and Use for Grains, Continued 1/ Million Metric Tons =============================================================================== : : Total : : Total : Ending Commodity : Output : Supply : Trade 2/ : Use : Stocks =============================================================================== : : Foreign 3/ Total grains 4/ : 2008/09 : 1,842.16 2,149.54 204.06 1,844.15 386.97 2009/10 (Est.) : 1,814.83 2,195.65 207.30 1,867.06 410.88 2010/11 (Proj.) : February : 1,780.75 2,187.01 179.71 1,898.47 381.08 March : 1,780.97 2,186.06 176.54 1,887.71 390.18 Wheat : 2008/09 : 616.14 729.14 116.03 607.41 149.36 2009/10 (Est.) : 622.23 768.36 111.82 621.57 170.77 2010/11 (Proj.) : February : 585.30 753.36 89.96 633.23 155.51 March : 587.49 755.27 88.36 631.02 158.96 Coarse grains 5/ : 2008/09 : 784.27 899.90 62.13 803.76 147.08 2009/10 (Est.) : 758.60 903.36 68.22 811.21 147.00 2010/11 (Proj.) : February : 751.24 896.68 62.24 816.96 133.33 March : 749.43 894.21 61.18 813.70 134.07 Rice, milled : 2008/09 : 441.75 520.50 25.91 432.98 90.53 2009/10 (Est.) : 434.00 523.92 27.26 434.28 93.11 2010/11 (Proj.) : February : 444.21 536.97 27.51 448.28 92.24 March : 444.05 536.58 27.00 442.99 97.15 =============================================================================== 1/ Aggregate of local marketing years. 2/ Based on export estimate. See individual commodity tables for treatment of export/import imbalances. 3/ Total foreign is equal to world minus United States. 4/ Wheat, coarse grains and milled rice. 5/ Corn, sorghum, barley, oats, rye, millet and mixed grains. World and U.S. Supply and Use for Cotton 1/ Million 480-lb. bales =============================================================================== : : Total : : Total : Ending Commodity : Output : Supply : Trade 2/ : Use : Stocks =============================================================================== : : World 2008/09 : 107.10 167.83 30.07 110.07 60.52 2009/10 (Est.) : 101.34 161.86 35.55 118.52 43.84 2010/11 (Proj.) : February : 115.25 159.24 38.12 116.55 42.81 March : 114.95 158.79 38.58 116.61 42.33 : United States 2008/09 : 12.82 22.87 13.26 3.59 6.34 2009/10 (Est.) : 12.19 18.52 12.04 3.46 2.95 2010/11 (Proj.) : February : 18.32 21.27 15.75 3.60 1.90 March : 18.32 21.27 15.75 3.60 1.90 : Foreign 3/ 2008/09 : 94.29 144.96 16.80 106.48 54.18 2009/10 (Est.) : 89.16 143.34 23.51 115.06 40.90 2010/11 (Proj.) : February : 96.94 137.98 22.37 112.95 40.91 March : 96.64 137.53 22.83 113.01 40.43 =============================================================================== 1/ Marketing year beginning August 1. 2/ Based on export estimate. 3/ Total Foreign is equal to world minus United States. See global cotton tables for treatment of export/import imbalances.

WASDE-492-10 March 2011 World and U.S. Supply and Use for Oilseeds 1/ (Million Metric Tons) =============================================================================== : : Total : : Total : Ending Commodity : Output : Supply : Trade : Use 2/ : Stocks =============================================================================== : : World Oilseeds : 2008/09 : 396.32 456.48 94.06 338.36 55.02 2009/10 (Est.) : 441.64 496.66 108.06 357.51 70.52 2010/11 (Proj.) : February : 441.78 513.44 113.60 376.42 67.88 March : 444.17 514.69 113.12 377.86 68.07 Oilmeals : 2008/09 : 228.68 236.36 69.21 227.90 6.13 2009/10 (Est.) : 243.77 249.90 72.08 238.34 7.25 2010/11 (Proj.) : February : 258.38 265.62 76.87 254.76 7.50 March : 259.50 266.75 77.81 255.32 7.75 Vegetable Oils : 2008/09 : 133.48 144.91 55.85 130.30 13.17 2009/10 (Est.) : 140.08 153.24 57.91 138.48 12.40 2010/11 (Proj.) : February : 145.97 158.25 60.06 146.83 9.30 March : 146.37 158.76 60.54 146.92 9.51 : : United States Oilseeds : 2008/09 : 89.20 97.41 35.69 49.34 5.62 2009/10 (Est.) : 98.90 105.59 41.77 51.45 5.55 2010/11 (Proj.) : February : 100.47 106.97 44.33 49.47 5.23 March : 100.47 106.94 44.25 49.46 5.23 Oilmeals : 2008/09 : 37.72 39.86 7.94 31.67 0.25 2009/10 (Est.) : 40.05 41.64 10.32 30.98 0.34 2010/11 (Proj.) : February : 38.37 40.62 8.58 31.71 0.33 March : 38.41 40.66 8.52 31.82 0.33 Vegetable Oils : 2008/09 : 9.67 14.36 1.46 11.17 1.74 2009/10 (Est.) : 10.05 15.12 1.95 11.22 1.96 2010/11 (Proj.) : February : 9.87 15.15 1.63 11.98 1.55 March : 9.89 15.12 1.84 11.80 1.48 : : Foreign 3/ Oilseeds : 2008/09 : 307.12 359.07 58.37 289.01 49.40 2009/10 (Est.) : 342.74 391.07 66.29 306.06 64.97 2010/11 (Proj.) : February : 341.32 406.47 69.27 326.95 62.65 March : 343.70 407.75 68.86 328.40 62.84 Oilmeals : 2008/09 : 190.96 196.50 61.27 196.22 5.89 2009/10 (Est.) : 203.73 208.27 61.76 207.36 6.91 2010/11 (Proj.) : February : 220.01 225.00 68.29 223.05 7.17 March : 221.09 226.08 69.29 223.51 7.42 Vegetable Oils : 2008/09 : 123.81 130.54 54.40 119.14 11.43 2009/10 (Est.) : 130.03 138.12 55.96 127.26 10.44 2010/11 (Proj.) : February : 136.10 143.10 58.43 134.85 7.76 March : 136.48 143.65 58.70 135.11 8.03 =============================================================================== 1/ Aggregate of local marketing years with Brazil and Argentina on an Oct.-Sept. year. 2/ Crush only for oilseeds. 3/ Total foreign is equal to world minus United States.
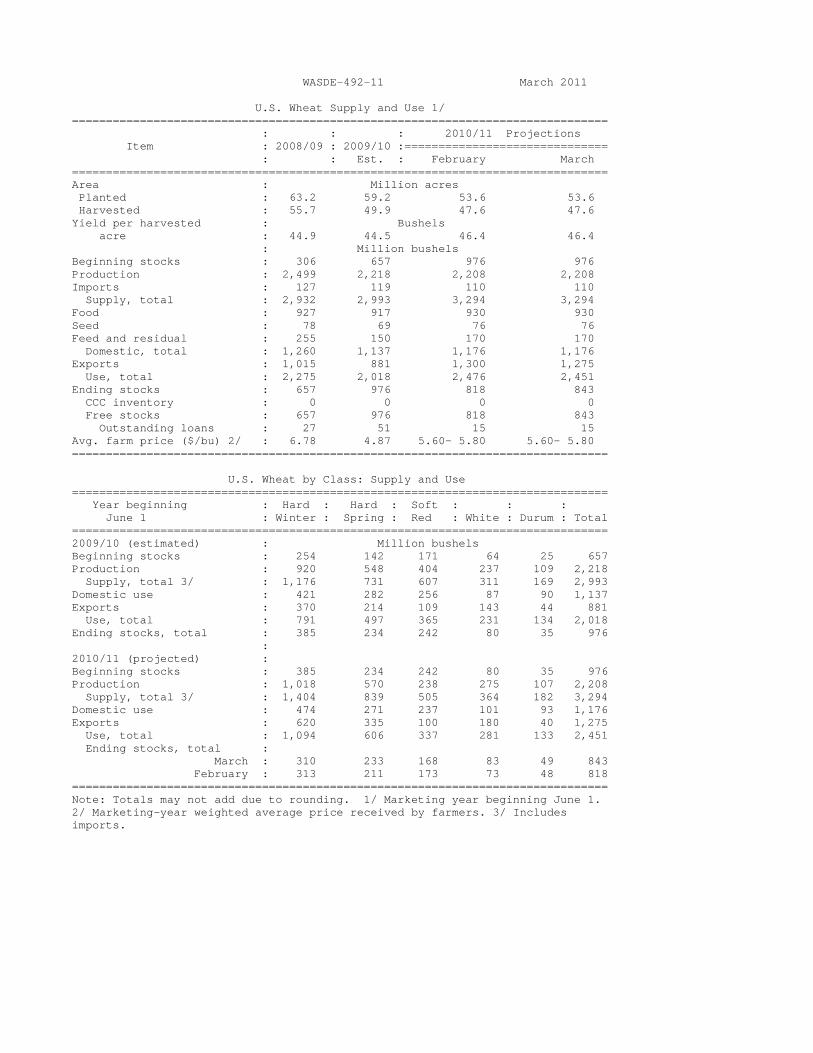
WASDE-492-11 March 2011 U.S. Wheat Supply and Use 1/ =============================================================================== : : : 2010/11 Projections Item : 2008/09 : 2009/10 :============================== : : Est. : February March =============================================================================== Area : Million acres Planted : 63.2 59.2 53.6 53.6 Harvested : 55.7 49.9 47.6 47.6 Yield per harvested : Bushels acre : 44.9 44.5 46.4 46.4 : Million bushels Beginning stocks : 306 657 976 976 Production : 2,499 2,218 2,208 2,208 Imports : 127 119 110 110 Supply, total : 2,932 2,993 3,294 3,294 Food : 927 917 930 930 Seed : 78 69 76 76 Feed and residual : 255 150 170 170 Domestic, total : 1,260 1,137 1,176 1,176 Exports : 1,015 881 1,300 1,275 Use, total : 2,275 2,018 2,476 2,451 Ending stocks : 657 976 818 843 CCC inventory : 0 0 0 0 Free stocks : 657 976 818 843 Outstanding loans : 27 51 15 15 Avg. farm price ($/bu) 2/ : 6.78 4.87 5.60- 5.80 5.60- 5.80 =============================================================================== U.S. Wheat by Class: Supply and Use =============================================================================== Year beginning : Hard : Hard : Soft : : : June 1 : Winter : Spring : Red : White : Durum : Total =============================================================================== 2009/10 (estimated) : Million bushels Beginning stocks : 254 142 171 64 25 657 Production : 920 548 404 237 109 2,218 Supply, total 3/ : 1,176 731 607 311 169 2,993 Domestic use : 421 282 256 87 90 1,137 Exports : 370 214 109 143 44 881 Use, total : 791 497 365 231 134 2,018 Ending stocks, total : 385 234 242 80 35 976 : 2010/11 (projected) : Beginning stocks : 385 234 242 80 35 976 Production : 1,018 570 238 275 107 2,208 Supply, total 3/ : 1,404 839 505 364 182 3,294 Domestic use : 474 271 237 101 93 1,176 Exports : 620 335 100 180 40 1,275 Use, total : 1,094 606 337 281 133 2,451 Ending stocks, total : March : 310 233 168 83 49 843 February : 313 211 173 73 48 818 =============================================================================== Note: Totals may not add due to rounding. 1/ Marketing year beginning June 1. 2/ Marketing-year weighted average price received by farmers. 3/ Includes imports.
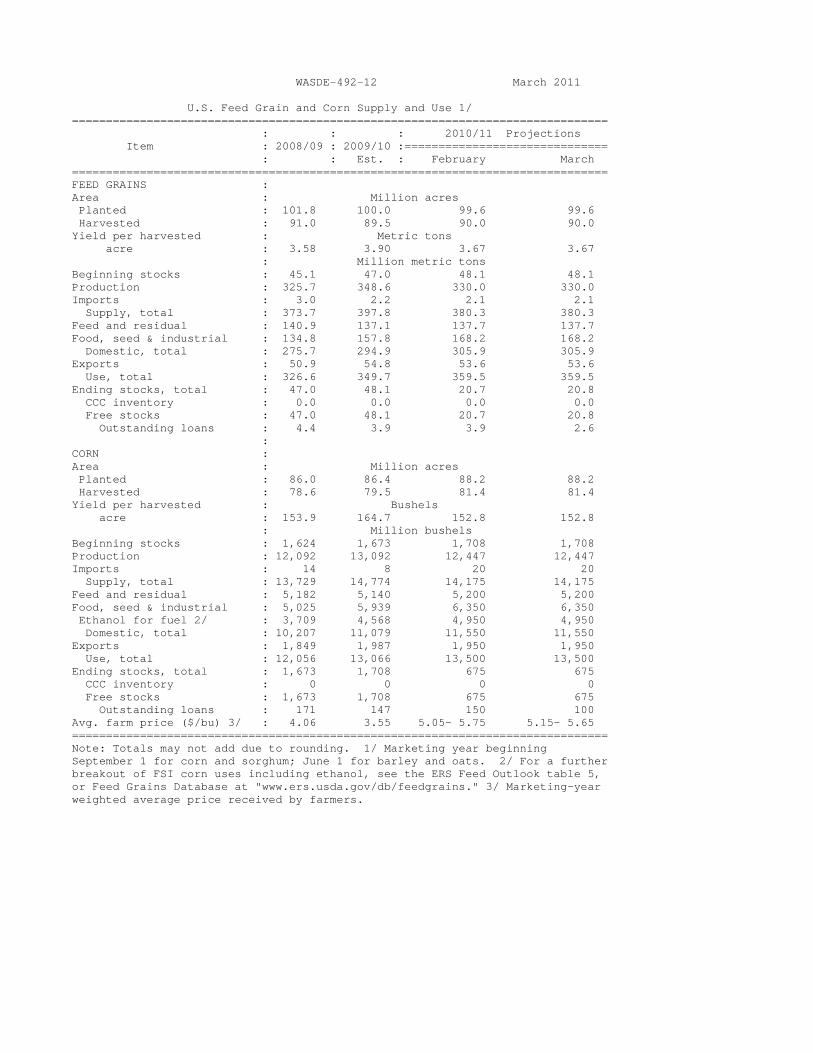
WASDE-492-12 March 2011 U.S. Feed Grain and Corn Supply and Use 1/ =============================================================================== : : : 2010/11 Projections Item : 2008/09 : 2009/10 :============================== : : Est. : February March =============================================================================== FEED GRAINS : Area : Million acres Planted : 101.8 100.0 99.6 99.6 Harvested : 91.0 89.5 90.0 90.0 Yield per harvested : Metric tons acre : 3.58 3.90 3.67 3.67 : Million metric tons Beginning stocks : 45.1 47.0 48.1 48.1 Production : 325.7 348.6 330.0 330.0 Imports : 3.0 2.2 2.1 2.1 Supply, total : 373.7 397.8 380.3 380.3 Feed and residual : 140.9 137.1 137.7 137.7 Food, seed & industrial : 134.8 157.8 168.2 168.2 Domestic, total : 275.7 294.9 305.9 305.9 Exports : 50.9 54.8 53.6 53.6 Use, total : 326.6 349.7 359.5 359.5 Ending stocks, total : 47.0 48.1 20.7 20.8 CCC inventory : 0.0 0.0 0.0 0.0 Free stocks : 47.0 48.1 20.7 20.8 Outstanding loans : 4.4 3.9 3.9 2.6 : CORN : Area : Million acres Planted : 86.0 86.4 88.2 88.2 Harvested : 78.6 79.5 81.4 81.4 Yield per harvested : Bushels acre : 153.9 164.7 152.8 152.8 : Million bushels Beginning stocks : 1,624 1,673 1,708 1,708 Production : 12,092 13,092 12,447 12,447 Imports : 14 8 20 20 Supply, total : 13,729 14,774 14,175 14,175 Feed and residual : 5,182 5,140 5,200 5,200 Food, seed & industrial : 5,025 5,939 6,350 6,350 Ethanol for fuel 2/ : 3,709 4,568 4,950 4,950 Domestic, total : 10,207 11,079 11,550 11,550 Exports : 1,849 1,987 1,950 1,950 Use, total : 12,056 13,066 13,500 13,500 Ending stocks, total : 1,673 1,708 675 675 CCC inventory : 0 0 0 0 Free stocks : 1,673 1,708 675 675 Outstanding loans : 171 147 150 100 Avg. farm price ($/bu) 3/ : 4.06 3.55 5.05- 5.75 5.15- 5.65 =============================================================================== Note: Totals may not add due to rounding. 1/ Marketing year beginning September 1 for corn and sorghum; June 1 for barley and oats. 2/ For a further breakout of FSI corn uses including ethanol, see the ERS Feed Outlook table 5, or Feed Grains Database at "www.ers.usda.gov/db/feedgrains." 3/ Marketing-year weighted average price received by farmers.
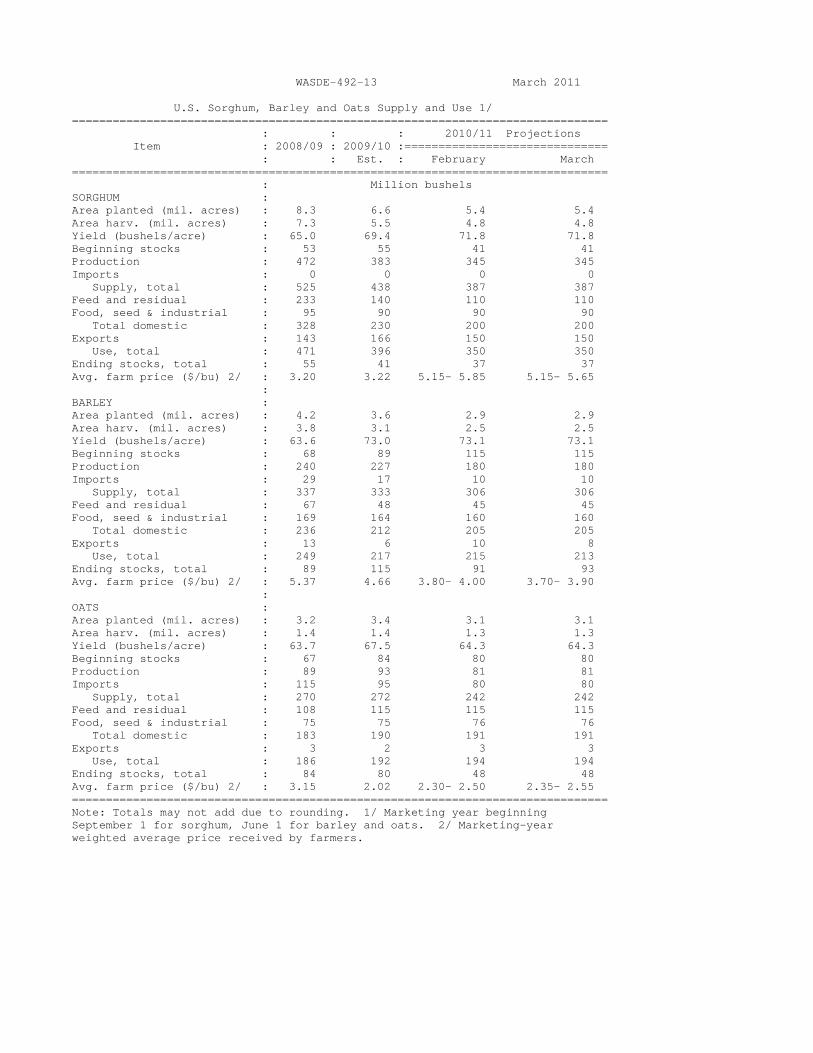
WASDE-492-13 March 2011 U.S. Sorghum, Barley and Oats Supply and Use 1/ =============================================================================== : : : 2010/11 Projections Item : 2008/09 : 2009/10 :============================== : : Est. : February March =============================================================================== : Million bushels SORGHUM : Area planted (mil. acres) : 8.3 6.6 5.4 5.4 Area harv. (mil. acres) : 7.3 5.5 4.8 4.8 Yield (bushels/acre) : 65.0 69.4 71.8 71.8 Beginning stocks : 53 55 41 41 Production : 472 383 345 345 Imports : 0 0 0 0 Supply, total : 525 438 387 387 Feed and residual : 233 140 110 110 Food, seed & industrial : 95 90 90 90 Total domestic : 328 230 200 200 Exports : 143 166 150 150 Use, total : 471 396 350 350 Ending stocks, total : 55 41 37 37 Avg. farm price ($/bu) 2/ : 3.20 3.22 5.15- 5.85 5.15- 5.65 : BARLEY : Area planted (mil. acres) : 4.2 3.6 2.9 2.9 Area harv. (mil. acres) : 3.8 3.1 2.5 2.5 Yield (bushels/acre) : 63.6 73.0 73.1 73.1 Beginning stocks : 68 89 115 115 Production : 240 227 180 180 Imports : 29 17 10 10 Supply, total : 337 333 306 306 Feed and residual : 67 48 45 45 Food, seed & industrial : 169 164 160 160 Total domestic : 236 212 205 205 Exports : 13 6 10 8 Use, total : 249 217 215 213 Ending stocks, total : 89 115 91 93 Avg. farm price ($/bu) 2/ : 5.37 4.66 3.80- 4.00 3.70- 3.90 : OATS : Area planted (mil. acres) : 3.2 3.4 3.1 3.1 Area harv. (mil. acres) : 1.4 1.4 1.3 1.3 Yield (bushels/acre) : 63.7 67.5 64.3 64.3 Beginning stocks : 67 84 80 80 Production : 89 93 81 81 Imports : 115 95 80 80 Supply, total : 270 272 242 242 Feed and residual : 108 115 115 115 Food, seed & industrial : 75 75 76 76 Total domestic : 183 190 191 191 Exports : 3 2 3 3 Use, total : 186 192 194 194 Ending stocks, total : 84 80 48 48 Avg. farm price ($/bu) 2/ : 3.15 2.02 2.30- 2.50 2.35- 2.55 =============================================================================== Note: Totals may not add due to rounding. 1/ Marketing year beginning September 1 for sorghum, June 1 for barley and oats. 2/ Marketing-year weighted average price received by farmers.
WASDE-492-14 March 2011 U.S. Rice Supply and Use 1/ (Rough Equivalent of Rough and Milled Rice) =============================================================================== : : : 2010/11 Projections Item : 2008/09 : 2009/10 :============================== : : Est. : February March =============================================================================== TOTAL : Area : Million acres Planted : 3.00 3.14 3.64 3.64 Harvested : 2.98 3.10 3.62 3.62 Yield per harvested : Pounds acre : 6,846 7,085 6,725 6,725 : : Million hundredweight Beginning stocks 2/ : 29.6 30.6 36.7 36.7 Production : 203.7 219.9 243.1 243.1 Imports : 19.2 19.0 18.0 18.0 Supply, total : 252.6 269.4 297.8 297.8 Domestic & residual 3/ : 126.4 122.6 129.0 129.0 Exports, total 4/ : 95.6 110.2 116.0 116.0 Rough : 31.6 40.8 43.0 42.0 Milled (rough equiv.) : 64.0 69.4 73.0 74.0 Use, total : 222.0 232.7 245.0 245.0 Ending stocks : 30.6 36.7 52.8 52.8 Avg. milling yield (%) 5/ : 69.25 69.36 67.50 67.75 Avg. farm price ($/cwt) 6/ : 16.80 14.40 12.15-12.65 12.25-12.75 : LONG GRAIN : Harvested acres (mil.) : 2.35 2.27 2.83 2.83 Yield (pounds/acre) : 6,522 6,743 6,486 6,486 Beginning stocks : 19.1 20.1 23.2 23.2 Production : 153.3 152.7 183.3 183.3 Supply, total 7/ : 188.2 189.3 221.9 221.9 Domestic & Residual 3/ : 99.4 90.8 101.0 101.0 Exports 8/ : 68.8 75.4 78.0 78.0 Use, total : 168.1 166.2 179.0 179.0 Ending stocks : 20.1 23.2 42.9 42.9 Avg. farm price ($/cwt) 6/ : 14.90 12.90 10.75-11.25 11.05-11.55 : MEDIUM & SHORT GRAIN : Harvested acres (mil.) : 0.63 0.84 0.79 0.79 Yield (pounds/acre) : 8,063 8,010 7,580 7,580 Beginning stocks : 9.1 8.0 12.1 12.1 Production : 50.5 67.1 59.8 59.8 Supply, total 7/ : 61.9 78.7 74.4 74.4 Domestic & Residual 3/ : 27.0 31.8 28.0 28.0 Exports 8/ : 26.9 34.8 38.0 38.0 Use, total : 53.9 66.6 66.0 66.0 Ending stocks : 8.0 12.1 8.4 8.4 Avg. farm price ($/cwt) 6/ : 24.80 18.40 16.75-17.25 16.25-16.75 =============================================================================== Note: Totals may not add due to rounding. 1/ Marketing year beginning August 1. 2/ Includes the following quantities of broken kernel rice (type undetermined) not included in estimates of beginning stocks by type (in mil. cwt): 2008/09-1.4; 2009/10-2.4; 2010/11-1.5. 3/ Residual includes unreported use, processing losses, and estimating errors. Use by type may not add to total rice use because of the difference in brokens between beginning and ending stocks. 4/ Includes rough rice and milled rice exports. Milled rice exports are converted to an equivalent rough basis. 5/ Expressed as a percent-- the national average milling yield calculated by the Farm Service Agency (FSA) from warehouse stored loan data. 6/ Includes imports. 7/ Marketing-year weighted average price received by farmers. 8/ Exports by type of rice are estimated.
WASDE-492-15 March 2011 U.S. Soybeans and Products Supply and Use (Domestic Measure) 1/ =============================================================================== : : : 2010/11 Projections Item : 2008/09 : 2009/10 :=============================== : : Est. : February March =============================================================================== SOYBEANS: : Million acres Area : Planted : 75.7 77.5 77.4 77.4 Harvested : 74.7 76.4 76.6 76.6 : : Bushels Yield per harvested : acre : 39.7 44.0 43.5 43.5 : : Million bushels : Beginning stocks : 205 138 151 151 Production : 2,967 3,359 3,329 3,329 Imports : 13 15 15 15 Supply, total : 3,185 3,512 3,495 3,495 Crushings : 1,662 1,752 1,655 1,655 Exports : 1,279 1,501 1,590 1,590 Seed : 90 90 88 91 Residual : 16 18 22 19 Use, total : 3,047 3,361 3,355 3,355 Ending stocks : 138 151 140 140 Avg. farm price ($/bu) 2/ : 9.97 9.59 11.20-12.20 11.10 -12.10 : : : Million pounds SOYBEAN OIL: : Beginning stocks : 2,485 2,861 3,358 3,358 Production : 18,745 19,614 19,000 19,035 Imports : 90 103 115 115 Supply, total : 21,319 22,577 22,473 22,508 Domestic : 16,265 15,863 17,100 17,100 For methyl ester : 2,021 1,681 2,900 2,700 Exports : 2,193 3,357 2,800 3,000 Use, total : 18,459 19,219 19,900 20,100 Ending stocks : 2,861 3,358 2,573 2,408 Average price (c/lb) 2/ : 32.16 35.95 51.00- 51.50- : 55.00 55.50 : : Thousand short tons SOYBEAN MEAL: : Beginning stocks : 294 235 302 302 Production : 39,102 41,700 39,533 39,583 Imports : 88 160 165 165 Supply, total : 39,484 42,095 40,000 40,050 Domestic : 30,752 30,619 30,500 30,500 Exports : 8,497 11,175 9,200 9,250 Use, total : 39,249 41,794 39,700 39,750 Ending stocks : 235 302 300 300 Average price ($/s.t.) 2/ : 331.17 311.27 340.00- 340.00- : 380.00 370.00 =============================================================================== Note: Reliability calculations at end of report. 1/ Marketing year beginning September 1 for soybeans; October 1 for soybean oil and meal. 2/ Prices: soybeans, marketing year weighted average price received by farmers; for oil, simple average of crude soybean oil, Decatur; for meal, simple average of 48 percent, Decatur.

WASDE-492-16 March 2011 U.S. Sugar Supply and Use 1/ ====================================================================== : : : 2010/11 Projection Item : 2008/09 : 2009/10 :====================== : : Est. : February March ====================================================================== : 1,000 short tons, raw value : Beginning stocks : 1,664 1,534 1,503 1,510 Production 2/ : 7,532 7,975 8,010 7,950 Beet sugar : 4,214 4,575 4,800 4,800 Cane sugar : 3,318 3,400 3,210 3,150 Florida : 1,577 1,646 1,500 1,440 Hawaii : 192 161 170 170 Louisiana : 1,397 1,481 1,400 1,400 Texas : 152 112 140 140 Imports : 3,082 3,318 3,245 3,135 TRQ 3/ : 1,370 1,854 1,371 1,371 Other program 4/ : 308 450 375 375 Other 5/ : 1,404 1,014 1,499 1,389 Mexico : 1,402 807 1,459 1,349 Total supply : 12,278 12,827 12,758 12,595 : Exports : 136 211 225 225 Deliveries : 10,608 11,106 11,185 11,185 Food 6/ : 10,442 10,870 11,000 11,000 Other 7/ : 166 236 185 185 Miscellaneous : 0 0 0 0 Total use : 10,744 11,317 11,410 11,410 Ending stocks : 1,534 1,510 1,348 1,185 : Stocks to use ratio : 14.3 13.3 11.8 10.4 ====================================================================== 1/ Fiscal years beginning Oct 1. Includes Puerto Rico. Historical data are from FSA, "Sweetener Market Data" except imports (U.S. Customs Service, Census Bureau). 2/ Production projections for 2010/11 are based on Crop Production, trend recovery rates, and processor projections where appropriate. 3/ For 2010/11, includes shortfall of 110,000 tons. 4/ Includes sugar under the re-export and polyhydric alcohol programs. 5/ For 2008/09, other high-tier (0) and other (0). For 2009/10, other high-tier (207) and other (0). For 2010/11, other high-tier (40) and other (0). 6/Combines SMD deliveries for domestic human food use and SMD miscellaneous uses. 7/ Transfers to sugar-containing products for reexport, and for nonedible alcohol and feed. Mexico Sugar Supply and Use and High Fructose Corn Syrup Imports 1/ ========================================================================== : Supply : Use : Fiscal :====================================================: Ending year : Beginning : Production: Imports : Domestic :Exports: stocks : stocks : : : 2/ : : ========================================================================== 1,000 metric tons, raw value Sugar 2009/10 est. Feb 624 5,115 861 4,890 737 973 Mar 624 5,115 861 4,890 737 973 2010/11 proj. Feb 973 5,650 290 4,629 1,332 952 Mar 973 5,550 290 4,629 1,232 952 ========================================================================== 1/ U.S. HFCS exports to Mexico (metric tons, dry-weight basis): Oct-Sep 2009/10 = 927,203; Oct-Dec 2009 = 208,980; Oct-Dec 2010 = 244,122. Footnote source: U.S. Census Bureau. 2/Includes domestic consumption, Mexico's products export program (IMMEX), and any residual statistical discrepancies.

WASDE-492-17 March 2011 U. S. Cotton Supply and Use 1/ =============================================================================== : : : 2010/11 Projections Item : 2008/09 : 2009/10 :=============================== : : Est. : February March =============================================================================== : Million acres Area : Planted : 9.47 9.15 10.97 10.97 Harvested : 7.57 7.53 10.71 10.71 : : Pounds Yield per harvested : acre : 813 777 821 821 : : Million 480 pound bales : Beginning stocks 2/ : 10.05 6.34 2.95 2.95 Production : 12.82 12.19 18.32 18.32 Imports : 0.00 0.00 0.01 0.01 Supply, total : 22.87 18.53 21.27 21.27 Domestic use : 3.59 3.46 3.60 3.60 Exports : 13.26 12.04 15.75 15.75 Use, total : 16.85 15.50 19.35 19.35 Unaccounted 3/ : -0.32 0.08 0.02 0.02 Ending stocks : 6.34 2.95 1.90 1.90 : Avg. farm price 4/ : 47.8 62.9 79.0-84.0 80.0-83.0 =============================================================================== Note: Reliability calculations at end of report. 1/ Upland and extra-long staple; marketing year beginning August 1. Totals may not add due to rounding. 2/ Based on Bureau of Census data. 3/ Reflects the difference between the previous season's supply less total use and ending stocks based on Bureau of Census data. 4/ Cents per pound for upland cotton. ===============================================================================
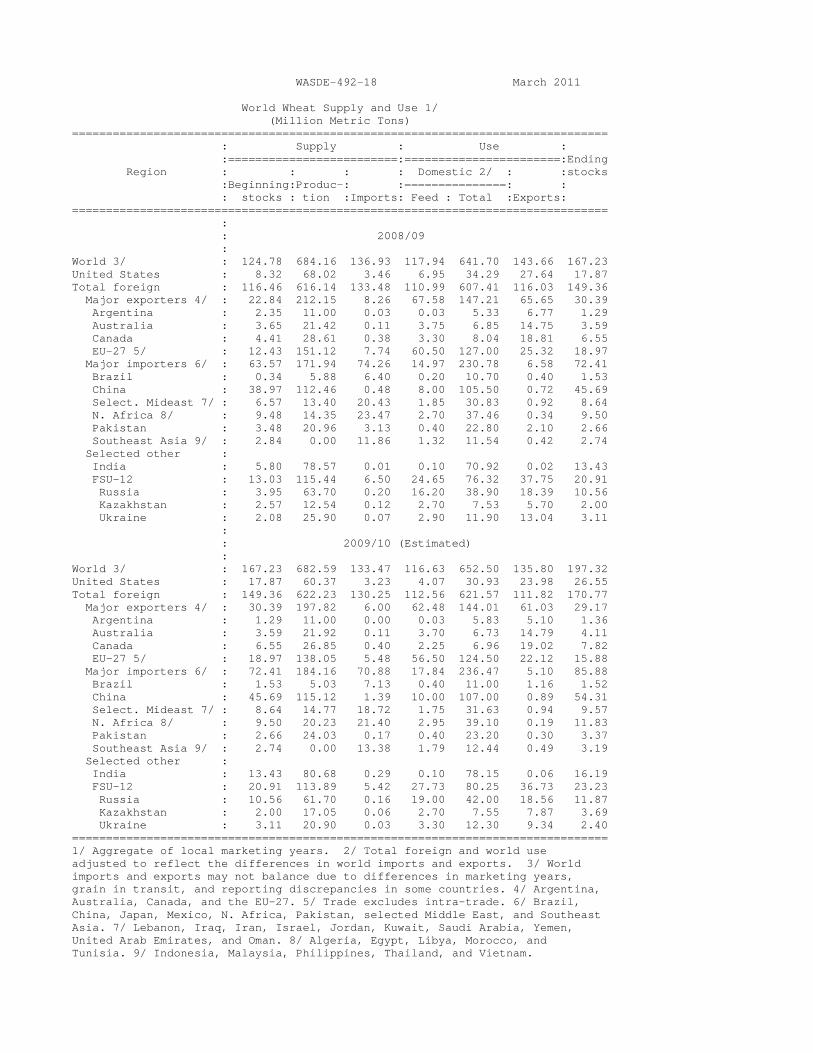
WASDE-492-18 March 2011 World Wheat Supply and Use 1/ (Million Metric Tons) =============================================================================== : Supply : Use : :=========================:=======================:Ending Region : : : : Domestic 2/ : :stocks :Beginning:Produc-: :===============: : : stocks : tion :Imports: Feed : Total :Exports: =============================================================================== : : 2008/09 : World 3/ : 124.78 684.16 136.93 117.94 641.70 143.66 167.23 United States : 8.32 68.02 3.46 6.95 34.29 27.64 17.87 Total foreign : 116.46 616.14 133.48 110.99 607.41 116.03 149.36 Major exporters 4/ : 22.84 212.15 8.26 67.58 147.21 65.65 30.39 Argentina : 2.35 11.00 0.03 0.03 5.33 6.77 1.29 Australia : 3.65 21.42 0.11 3.75 6.85 14.75 3.59 Canada : 4.41 28.61 0.38 3.30 8.04 18.81 6.55 EU-27 5/ : 12.43 151.12 7.74 60.50 127.00 25.32 18.97 Major importers 6/ : 63.57 171.94 74.26 14.97 230.78 6.58 72.41 Brazil : 0.34 5.88 6.40 0.20 10.70 0.40 1.53 China : 38.97 112.46 0.48 8.00 105.50 0.72 45.69 Select. Mideast 7/ : 6.57 13.40 20.43 1.85 30.83 0.92 8.64 N. Africa 8/ : 9.48 14.35 23.47 2.70 37.46 0.34 9.50 Pakistan : 3.48 20.96 3.13 0.40 22.80 2.10 2.66 Southeast Asia 9/ : 2.84 0.00 11.86 1.32 11.54 0.42 2.74 Selected other : India : 5.80 78.57 0.01 0.10 70.92 0.02 13.43 FSU-12 : 13.03 115.44 6.50 24.65 76.32 37.75 20.91 Russia : 3.95 63.70 0.20 16.20 38.90 18.39 10.56 Kazakhstan : 2.57 12.54 0.12 2.70 7.53 5.70 2.00 Ukraine : 2.08 25.90 0.07 2.90 11.90 13.04 3.11 : : 2009/10 (Estimated) : World 3/ : 167.23 682.59 133.47 116.63 652.50 135.80 197.32 United States : 17.87 60.37 3.23 4.07 30.93 23.98 26.55 Total foreign : 149.36 622.23 130.25 112.56 621.57 111.82 170.77 Major exporters 4/ : 30.39 197.82 6.00 62.48 144.01 61.03 29.17 Argentina : 1.29 11.00 0.00 0.03 5.83 5.10 1.36 Australia : 3.59 21.92 0.11 3.70 6.73 14.79 4.11 Canada : 6.55 26.85 0.40 2.25 6.96 19.02 7.82 EU-27 5/ : 18.97 138.05 5.48 56.50 124.50 22.12 15.88 Major importers 6/ : 72.41 184.16 70.88 17.84 236.47 5.10 85.88 Brazil : 1.53 5.03 7.13 0.40 11.00 1.16 1.52 China : 45.69 115.12 1.39 10.00 107.00 0.89 54.31 Select. Mideast 7/ : 8.64 14.77 18.72 1.75 31.63 0.94 9.57 N. Africa 8/ : 9.50 20.23 21.40 2.95 39.10 0.19 11.83 Pakistan : 2.66 24.03 0.17 0.40 23.20 0.30 3.37 Southeast Asia 9/ : 2.74 0.00 13.38 1.79 12.44 0.49 3.19 Selected other : India : 13.43 80.68 0.29 0.10 78.15 0.06 16.19 FSU-12 : 20.91 113.89 5.42 27.73 80.25 36.73 23.23 Russia : 10.56 61.70 0.16 19.00 42.00 18.56 11.87 Kazakhstan : 2.00 17.05 0.06 2.70 7.55 7.87 3.69 Ukraine : 3.11 20.90 0.03 3.30 12.30 9.34 2.40 =============================================================================== 1/ Aggregate of local marketing years. 2/ Total foreign and world use adjusted to reflect the differences in world imports and exports. 3/ World imports and exports may not balance due to differences in marketing years, grain in transit, and reporting discrepancies in some countries. 4/ Argentina, Australia, Canada, and the EU-27. 5/ Trade excludes intra-trade. 6/ Brazil, China, Japan, Mexico, N. Africa, Pakistan, selected Middle East, and Southeast Asia. 7/ Lebanon, Iraq, Iran, Israel, Jordan, Kuwait, Saudi Arabia, Yemen, United Arab Emirates, and Oman. 8/ Algeria, Egypt, Libya, Morocco, and Tunisia. 9/ Indonesia, Malaysia, Philippines, Thailand, and Vietnam.
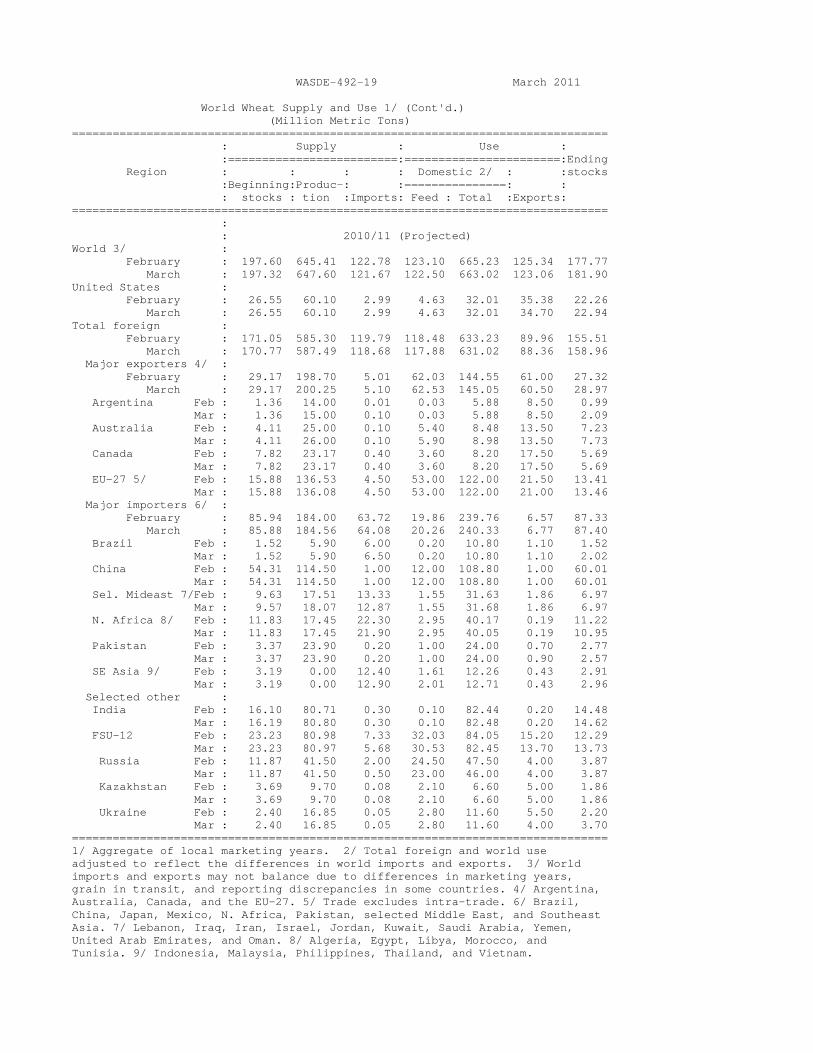
WASDE-492-19 March 2011 World Wheat Supply and Use 1/ (Cont'd.) (Million Metric Tons) =============================================================================== : Supply : Use : :=========================:=======================:Ending Region : : : : Domestic 2/ : :stocks :Beginning:Produc-: :===============: : : stocks : tion :Imports: Feed : Total :Exports: =============================================================================== : : 2010/11 (Projected) World 3/ : February : 197.60 645.41 122.78 123.10 665.23 125.34 177.77 March : 197.32 647.60 121.67 122.50 663.02 123.06 181.90 United States : February : 26.55 60.10 2.99 4.63 32.01 35.38 22.26 March : 26.55 60.10 2.99 4.63 32.01 34.70 22.94 Total foreign : February : 171.05 585.30 119.79 118.48 633.23 89.96 155.51 March : 170.77 587.49 118.68 117.88 631.02 88.36 158.96 Major exporters 4/ : February : 29.17 198.70 5.01 62.03 144.55 61.00 27.32 March : 29.17 200.25 5.10 62.53 145.05 60.50 28.97 Argentina Feb : 1.36 14.00 0.01 0.03 5.88 8.50 0.99 Mar : 1.36 15.00 0.10 0.03 5.88 8.50 2.09 Australia Feb : 4.11 25.00 0.10 5.40 8.48 13.50 7.23 Mar : 4.11 26.00 0.10 5.90 8.98 13.50 7.73 Canada Feb : 7.82 23.17 0.40 3.60 8.20 17.50 5.69 Mar : 7.82 23.17 0.40 3.60 8.20 17.50 5.69 EU-27 5/ Feb : 15.88 136.53 4.50 53.00 122.00 21.50 13.41 Mar : 15.88 136.08 4.50 53.00 122.00 21.00 13.46 Major importers 6/ : February : 85.94 184.00 63.72 19.86 239.76 6.57 87.33 March : 85.88 184.56 64.08 20.26 240.33 6.77 87.40 Brazil Feb : 1.52 5.90 6.00 0.20 10.80 1.10 1.52 Mar : 1.52 5.90 6.50 0.20 10.80 1.10 2.02 China Feb : 54.31 114.50 1.00 12.00 108.80 1.00 60.01 Mar : 54.31 114.50 1.00 12.00 108.80 1.00 60.01 Sel. Mideast 7/Feb : 9.63 17.51 13.33 1.55 31.63 1.86 6.97 Mar : 9.57 18.07 12.87 1.55 31.68 1.86 6.97 N. Africa 8/ Feb : 11.83 17.45 22.30 2.95 40.17 0.19 11.22 Mar : 11.83 17.45 21.90 2.95 40.05 0.19 10.95 Pakistan Feb : 3.37 23.90 0.20 1.00 24.00 0.70 2.77 Mar : 3.37 23.90 0.20 1.00 24.00 0.90 2.57 SE Asia 9/ Feb : 3.19 0.00 12.40 1.61 12.26 0.43 2.91 Mar : 3.19 0.00 12.90 2.01 12.71 0.43 2.96 Selected other : India Feb : 16.10 80.71 0.30 0.10 82.44 0.20 14.48 Mar : 16.19 80.80 0.30 0.10 82.48 0.20 14.62 FSU-12 Feb : 23.23 80.98 7.33 32.03 84.05 15.20 12.29 Mar : 23.23 80.97 5.68 30.53 82.45 13.70 13.73 Russia Feb : 11.87 41.50 2.00 24.50 47.50 4.00 3.87 Mar : 11.87 41.50 0.50 23.00 46.00 4.00 3.87 Kazakhstan Feb : 3.69 9.70 0.08 2.10 6.60 5.00 1.86 Mar : 3.69 9.70 0.08 2.10 6.60 5.00 1.86 Ukraine Feb : 2.40 16.85 0.05 2.80 11.60 5.50 2.20 Mar : 2.40 16.85 0.05 2.80 11.60 4.00 3.70 =============================================================================== 1/ Aggregate of local marketing years. 2/ Total foreign and world use adjusted to reflect the differences in world imports and exports. 3/ World imports and exports may not balance due to differences in marketing years, grain in transit, and reporting discrepancies in some countries. 4/ Argentina, Australia, Canada, and the EU-27. 5/ Trade excludes intra-trade. 6/ Brazil, China, Japan, Mexico, N. Africa, Pakistan, selected Middle East, and Southeast Asia. 7/ Lebanon, Iraq, Iran, Israel, Jordan, Kuwait, Saudi Arabia, Yemen, United Arab Emirates, and Oman. 8/ Algeria, Egypt, Libya, Morocco, and Tunisia. 9/ Indonesia, Malaysia, Philippines, Thailand, and Vietnam.
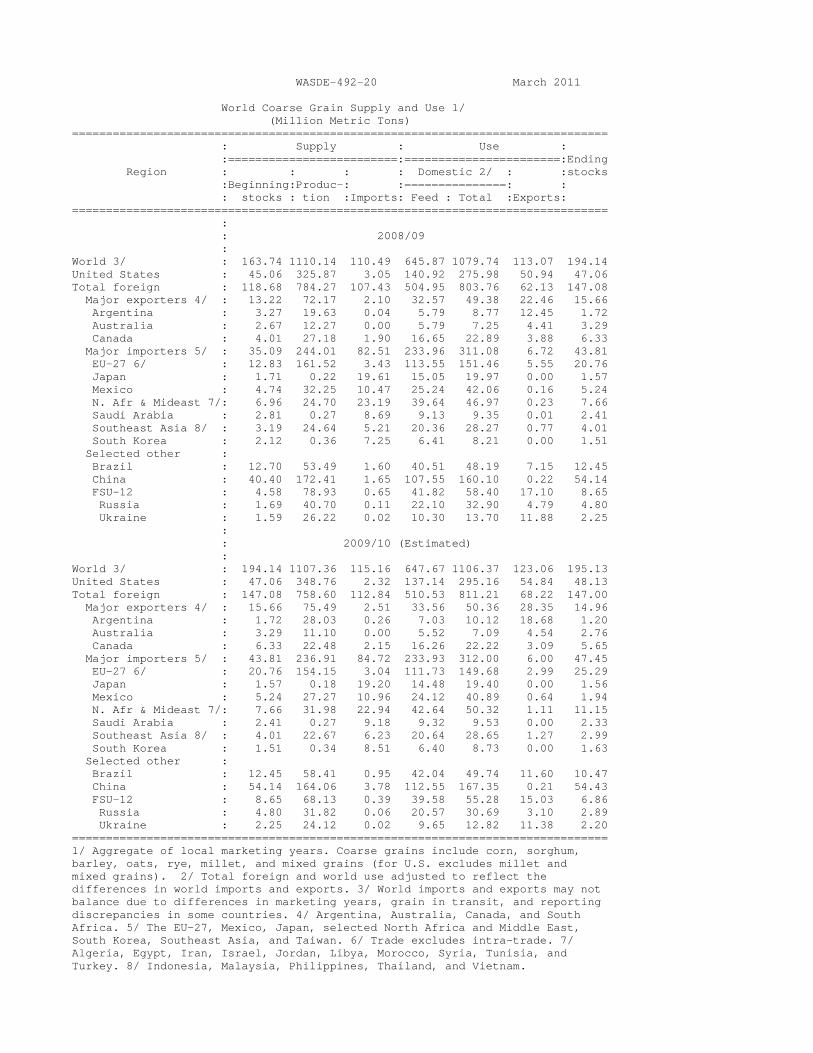
WASDE-492-20 March 2011 World Coarse Grain Supply and Use 1/ (Million Metric Tons) =============================================================================== : Supply : Use : :=========================:=======================:Ending Region : : : : Domestic 2/ : :stocks :Beginning:Produc-: :===============: : : stocks : tion :Imports: Feed : Total :Exports: =============================================================================== : : 2008/09 : World 3/ : 163.74 1110.14 110.49 645.87 1079.74 113.07 194.14 United States : 45.06 325.87 3.05 140.92 275.98 50.94 47.06 Total foreign : 118.68 784.27 107.43 504.95 803.76 62.13 147.08 Major exporters 4/ : 13.22 72.17 2.10 32.57 49.38 22.46 15.66 Argentina : 3.27 19.63 0.04 5.79 8.77 12.45 1.72 Australia : 2.67 12.27 0.00 5.79 7.25 4.41 3.29 Canada : 4.01 27.18 1.90 16.65 22.89 3.88 6.33 Major importers 5/ : 35.09 244.01 82.51 233.96 311.08 6.72 43.81 EU-27 6/ : 12.83 161.52 3.43 113.55 151.46 5.55 20.76 Japan : 1.71 0.22 19.61 15.05 19.97 0.00 1.57 Mexico : 4.74 32.25 10.47 25.24 42.06 0.16 5.24 N. Afr & Mideast 7/: 6.96 24.70 23.19 39.64 46.97 0.23 7.66 Saudi Arabia : 2.81 0.27 8.69 9.13 9.35 0.01 2.41 Southeast Asia 8/ : 3.19 24.64 5.21 20.36 28.27 0.77 4.01 South Korea : 2.12 0.36 7.25 6.41 8.21 0.00 1.51 Selected other : Brazil : 12.70 53.49 1.60 40.51 48.19 7.15 12.45 China : 40.40 172.41 1.65 107.55 160.10 0.22 54.14 FSU-12 : 4.58 78.93 0.65 41.82 58.40 17.10 8.65 Russia : 1.69 40.70 0.11 22.10 32.90 4.79 4.80 Ukraine : 1.59 26.22 0.02 10.30 13.70 11.88 2.25 : : 2009/10 (Estimated) : World 3/ : 194.14 1107.36 115.16 647.67 1106.37 123.06 195.13 United States : 47.06 348.76 2.32 137.14 295.16 54.84 48.13 Total foreign : 147.08 758.60 112.84 510.53 811.21 68.22 147.00 Major exporters 4/ : 15.66 75.49 2.51 33.56 50.36 28.35 14.96 Argentina : 1.72 28.03 0.26 7.03 10.12 18.68 1.20 Australia : 3.29 11.10 0.00 5.52 7.09 4.54 2.76 Canada : 6.33 22.48 2.15 16.26 22.22 3.09 5.65 Major importers 5/ : 43.81 236.91 84.72 233.93 312.00 6.00 47.45 EU-27 6/ : 20.76 154.15 3.04 111.73 149.68 2.99 25.29 Japan : 1.57 0.18 19.20 14.48 19.40 0.00 1.56 Mexico : 5.24 27.27 10.96 24.12 40.89 0.64 1.94 N. Afr & Mideast 7/: 7.66 31.98 22.94 42.64 50.32 1.11 11.15 Saudi Arabia : 2.41 0.27 9.18 9.32 9.53 0.00 2.33 Southeast Asia 8/ : 4.01 22.67 6.23 20.64 28.65 1.27 2.99 South Korea : 1.51 0.34 8.51 6.40 8.73 0.00 1.63 Selected other : Brazil : 12.45 58.41 0.95 42.04 49.74 11.60 10.47 China : 54.14 164.06 3.78 112.55 167.35 0.21 54.43 FSU-12 : 8.65 68.13 0.39 39.58 55.28 15.03 6.86 Russia : 4.80 31.82 0.06 20.57 30.69 3.10 2.89 Ukraine : 2.25 24.12 0.02 9.65 12.82 11.38 2.20 =============================================================================== 1/ Aggregate of local marketing years. Coarse grains include corn, sorghum, barley, oats, rye, millet, and mixed grains (for U.S. excludes millet and mixed grains). 2/ Total foreign and world use adjusted to reflect the differences in world imports and exports. 3/ World imports and exports may not balance due to differences in marketing years, grain in transit, and reporting discrepancies in some countries. 4/ Argentina, Australia, Canada, and South Africa. 5/ The EU-27, Mexico, Japan, selected North Africa and Middle East, South Korea, Southeast Asia, and Taiwan. 6/ Trade excludes intra-trade. 7/ Algeria, Egypt, Iran, Israel, Jordan, Libya, Morocco, Syria, Tunisia, and Turkey. 8/ Indonesia, Malaysia, Philippines, Thailand, and Vietnam.
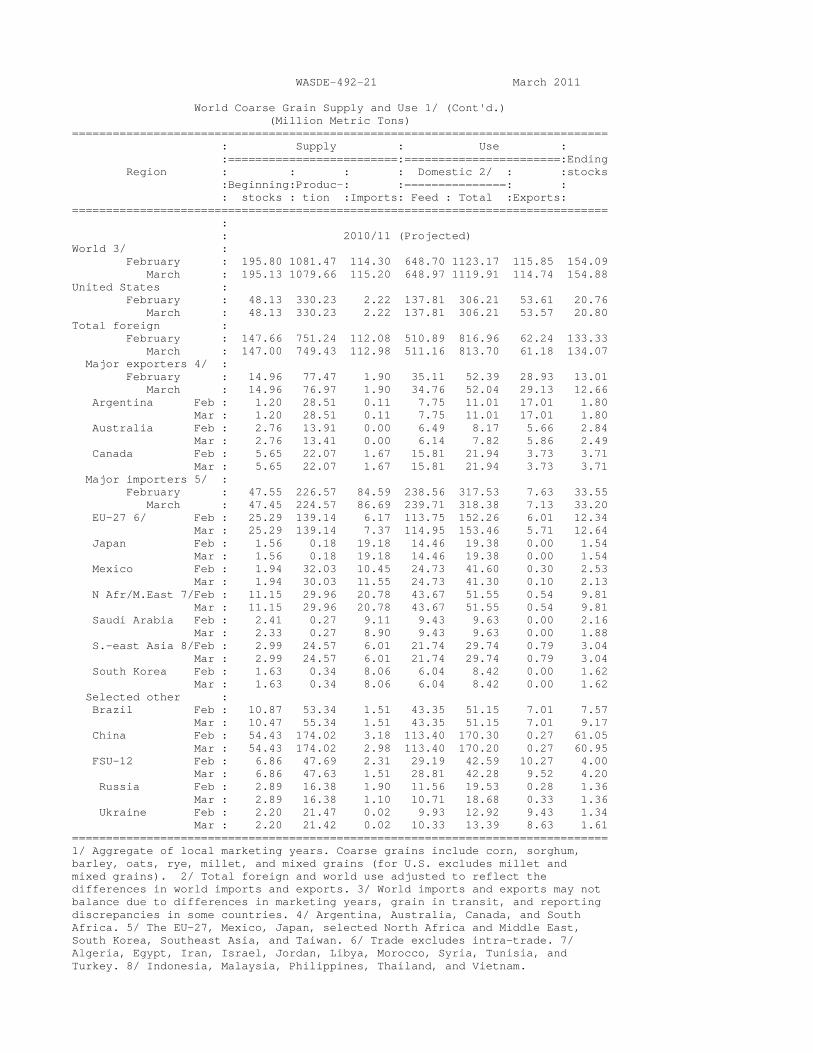
WASDE-492-21 March 2011 World Coarse Grain Supply and Use 1/ (Cont'd.) (Million Metric Tons) =============================================================================== : Supply : Use : :=========================:=======================:Ending Region : : : : Domestic 2/ : :stocks :Beginning:Produc-: :===============: : : stocks : tion :Imports: Feed : Total :Exports: =============================================================================== : : 2010/11 (Projected) World 3/ : February : 195.80 1081.47 114.30 648.70 1123.17 115.85 154.09 March : 195.13 1079.66 115.20 648.97 1119.91 114.74 154.88 United States : February : 48.13 330.23 2.22 137.81 306.21 53.61 20.76 March : 48.13 330.23 2.22 137.81 306.21 53.57 20.80 Total foreign : February : 147.66 751.24 112.08 510.89 816.96 62.24 133.33 March : 147.00 749.43 112.98 511.16 813.70 61.18 134.07 Major exporters 4/ : February : 14.96 77.47 1.90 35.11 52.39 28.93 13.01 March : 14.96 76.97 1.90 34.76 52.04 29.13 12.66 Argentina Feb : 1.20 28.51 0.11 7.75 11.01 17.01 1.80 Mar : 1.20 28.51 0.11 7.75 11.01 17.01 1.80 Australia Feb : 2.76 13.91 0.00 6.49 8.17 5.66 2.84 Mar : 2.76 13.41 0.00 6.14 7.82 5.86 2.49 Canada Feb : 5.65 22.07 1.67 15.81 21.94 3.73 3.71 Mar : 5.65 22.07 1.67 15.81 21.94 3.73 3.71 Major importers 5/ : February : 47.55 226.57 84.59 238.56 317.53 7.63 33.55 March : 47.45 224.57 86.69 239.71 318.38 7.13 33.20 EU-27 6/ Feb : 25.29 139.14 6.17 113.75 152.26 6.01 12.34 Mar : 25.29 139.14 7.37 114.95 153.46 5.71 12.64 Japan Feb : 1.56 0.18 19.18 14.46 19.38 0.00 1.54 Mar : 1.56 0.18 19.18 14.46 19.38 0.00 1.54 Mexico Feb : 1.94 32.03 10.45 24.73 41.60 0.30 2.53 Mar : 1.94 30.03 11.55 24.73 41.30 0.10 2.13 N Afr/M.East 7/Feb : 11.15 29.96 20.78 43.67 51.55 0.54 9.81 Mar : 11.15 29.96 20.78 43.67 51.55 0.54 9.81 Saudi Arabia Feb : 2.41 0.27 9.11 9.43 9.63 0.00 2.16 Mar : 2.33 0.27 8.90 9.43 9.63 0.00 1.88 S.-east Asia 8/Feb : 2.99 24.57 6.01 21.74 29.74 0.79 3.04 Mar : 2.99 24.57 6.01 21.74 29.74 0.79 3.04 South Korea Feb : 1.63 0.34 8.06 6.04 8.42 0.00 1.62 Mar : 1.63 0.34 8.06 6.04 8.42 0.00 1.62 Selected other : Brazil Feb : 10.87 53.34 1.51 43.35 51.15 7.01 7.57 Mar : 10.47 55.34 1.51 43.35 51.15 7.01 9.17 China Feb : 54.43 174.02 3.18 113.40 170.30 0.27 61.05 Mar : 54.43 174.02 2.98 113.40 170.20 0.27 60.95 FSU-12 Feb : 6.86 47.69 2.31 29.19 42.59 10.27 4.00 Mar : 6.86 47.63 1.51 28.81 42.28 9.52 4.20 Russia Feb : 2.89 16.38 1.90 11.56 19.53 0.28 1.36 Mar : 2.89 16.38 1.10 10.71 18.68 0.33 1.36 Ukraine Feb : 2.20 21.47 0.02 9.93 12.92 9.43 1.34 Mar : 2.20 21.42 0.02 10.33 13.39 8.63 1.61 =============================================================================== 1/ Aggregate of local marketing years. Coarse grains include corn, sorghum, barley, oats, rye, millet, and mixed grains (for U.S. excludes millet and mixed grains). 2/ Total foreign and world use adjusted to reflect the differences in world imports and exports. 3/ World imports and exports may not balance due to differences in marketing years, grain in transit, and reporting discrepancies in some countries. 4/ Argentina, Australia, Canada, and South Africa. 5/ The EU-27, Mexico, Japan, selected North Africa and Middle East, South Korea, Southeast Asia, and Taiwan. 6/ Trade excludes intra-trade. 7/ Algeria, Egypt, Iran, Israel, Jordan, Libya, Morocco, Syria, Tunisia, and Turkey. 8/ Indonesia, Malaysia, Philippines, Thailand, and Vietnam.
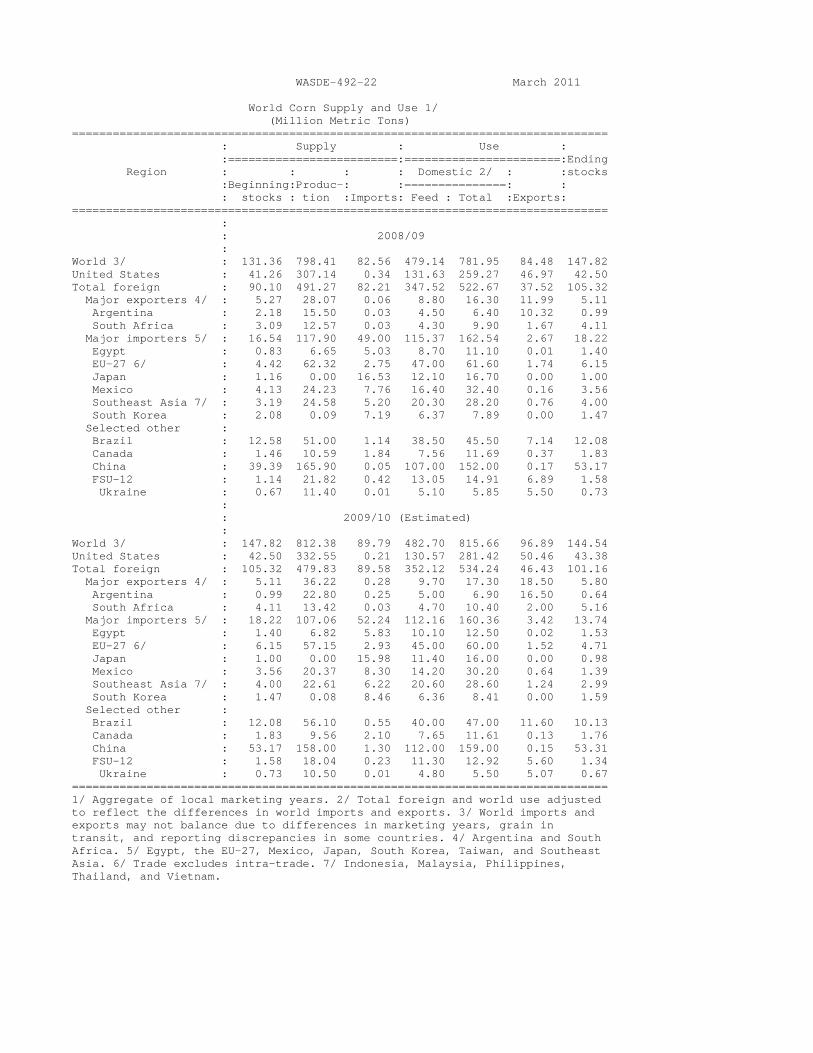
WASDE-492-22 March 2011 World Corn Supply and Use 1/ (Million Metric Tons) =============================================================================== : Supply : Use : :=========================:=======================:Ending Region : : : : Domestic 2/ : :stocks :Beginning:Produc-: :===============: : : stocks : tion :Imports: Feed : Total :Exports: =============================================================================== : : 2008/09 : World 3/ : 131.36 798.41 82.56 479.14 781.95 84.48 147.82 United States : 41.26 307.14 0.34 131.63 259.27 46.97 42.50 Total foreign : 90.10 491.27 82.21 347.52 522.67 37.52 105.32 Major exporters 4/ : 5.27 28.07 0.06 8.80 16.30 11.99 5.11 Argentina : 2.18 15.50 0.03 4.50 6.40 10.32 0.99 South Africa : 3.09 12.57 0.03 4.30 9.90 1.67 4.11 Major importers 5/ : 16.54 117.90 49.00 115.37 162.54 2.67 18.22 Egypt : 0.83 6.65 5.03 8.70 11.10 0.01 1.40 EU-27 6/ : 4.42 62.32 2.75 47.00 61.60 1.74 6.15 Japan : 1.16 0.00 16.53 12.10 16.70 0.00 1.00 Mexico : 4.13 24.23 7.76 16.40 32.40 0.16 3.56 Southeast Asia 7/ : 3.19 24.58 5.20 20.30 28.20 0.76 4.00 South Korea : 2.08 0.09 7.19 6.37 7.89 0.00 1.47 Selected other : Brazil : 12.58 51.00 1.14 38.50 45.50 7.14 12.08 Canada : 1.46 10.59 1.84 7.56 11.69 0.37 1.83 China : 39.39 165.90 0.05 107.00 152.00 0.17 53.17 FSU-12 : 1.14 21.82 0.42 13.05 14.91 6.89 1.58 Ukraine : 0.67 11.40 0.01 5.10 5.85 5.50 0.73 : : 2009/10 (Estimated) : World 3/ : 147.82 812.38 89.79 482.70 815.66 96.89 144.54 United States : 42.50 332.55 0.21 130.57 281.42 50.46 43.38 Total foreign : 105.32 479.83 89.58 352.12 534.24 46.43 101.16 Major exporters 4/ : 5.11 36.22 0.28 9.70 17.30 18.50 5.80 Argentina : 0.99 22.80 0.25 5.00 6.90 16.50 0.64 South Africa : 4.11 13.42 0.03 4.70 10.40 2.00 5.16 Major importers 5/ : 18.22 107.06 52.24 112.16 160.36 3.42 13.74 Egypt : 1.40 6.82 5.83 10.10 12.50 0.02 1.53 EU-27 6/ : 6.15 57.15 2.93 45.00 60.00 1.52 4.71 Japan : 1.00 0.00 15.98 11.40 16.00 0.00 0.98 Mexico : 3.56 20.37 8.30 14.20 30.20 0.64 1.39 Southeast Asia 7/ : 4.00 22.61 6.22 20.60 28.60 1.24 2.99 South Korea : 1.47 0.08 8.46 6.36 8.41 0.00 1.59 Selected other : Brazil : 12.08 56.10 0.55 40.00 47.00 11.60 10.13 Canada : 1.83 9.56 2.10 7.65 11.61 0.13 1.76 China : 53.17 158.00 1.30 112.00 159.00 0.15 53.31 FSU-12 : 1.58 18.04 0.23 11.30 12.92 5.60 1.34 Ukraine : 0.73 10.50 0.01 4.80 5.50 5.07 0.67 =============================================================================== 1/ Aggregate of local marketing years. 2/ Total foreign and world use adjusted to reflect the differences in world imports and exports. 3/ World imports and exports may not balance due to differences in marketing years, grain in transit, and reporting discrepancies in some countries. 4/ Argentina and South Africa. 5/ Egypt, the EU-27, Mexico, Japan, South Korea, Taiwan, and Southeast Asia. 6/ Trade excludes intra-trade. 7/ Indonesia, Malaysia, Philippines, Thailand, and Vietnam.
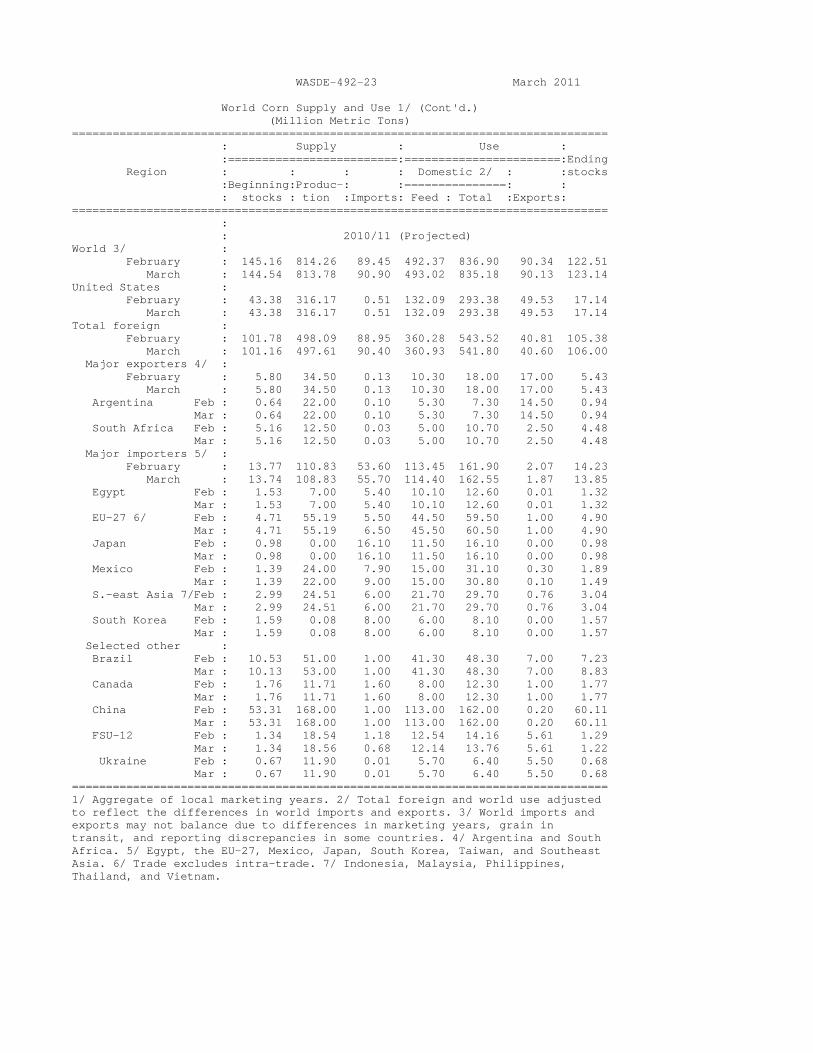
WASDE-492-23 March 2011 World Corn Supply and Use 1/ (Cont'd.) (Million Metric Tons) =============================================================================== : Supply : Use : :=========================:=======================:Ending Region : : : : Domestic 2/ : :stocks :Beginning:Produc-: :===============: : : stocks : tion :Imports: Feed : Total :Exports: =============================================================================== : : 2010/11 (Projected) World 3/ : February : 145.16 814.26 89.45 492.37 836.90 90.34 122.51 March : 144.54 813.78 90.90 493.02 835.18 90.13 123.14 United States : February : 43.38 316.17 0.51 132.09 293.38 49.53 17.14 March : 43.38 316.17 0.51 132.09 293.38 49.53 17.14 Total foreign : February : 101.78 498.09 88.95 360.28 543.52 40.81 105.38 March : 101.16 497.61 90.40 360.93 541.80 40.60 106.00 Major exporters 4/ : February : 5.80 34.50 0.13 10.30 18.00 17.00 5.43 March : 5.80 34.50 0.13 10.30 18.00 17.00 5.43 Argentina Feb : 0.64 22.00 0.10 5.30 7.30 14.50 0.94 Mar : 0.64 22.00 0.10 5.30 7.30 14.50 0.94 South Africa Feb : 5.16 12.50 0.03 5.00 10.70 2.50 4.48 Mar : 5.16 12.50 0.03 5.00 10.70 2.50 4.48 Major importers 5/ : February : 13.77 110.83 53.60 113.45 161.90 2.07 14.23 March : 13.74 108.83 55.70 114.40 162.55 1.87 13.85 Egypt Feb : 1.53 7.00 5.40 10.10 12.60 0.01 1.32 Mar : 1.53 7.00 5.40 10.10 12.60 0.01 1.32 EU-27 6/ Feb : 4.71 55.19 5.50 44.50 59.50 1.00 4.90 Mar : 4.71 55.19 6.50 45.50 60.50 1.00 4.90 Japan Feb : 0.98 0.00 16.10 11.50 16.10 0.00 0.98 Mar : 0.98 0.00 16.10 11.50 16.10 0.00 0.98 Mexico Feb : 1.39 24.00 7.90 15.00 31.10 0.30 1.89 Mar : 1.39 22.00 9.00 15.00 30.80 0.10 1.49 S.-east Asia 7/Feb : 2.99 24.51 6.00 21.70 29.70 0.76 3.04 Mar : 2.99 24.51 6.00 21.70 29.70 0.76 3.04 South Korea Feb : 1.59 0.08 8.00 6.00 8.10 0.00 1.57 Mar : 1.59 0.08 8.00 6.00 8.10 0.00 1.57 Selected other : Brazil Feb : 10.53 51.00 1.00 41.30 48.30 7.00 7.23 Mar : 10.13 53.00 1.00 41.30 48.30 7.00 8.83 Canada Feb : 1.76 11.71 1.60 8.00 12.30 1.00 1.77 Mar : 1.76 11.71 1.60 8.00 12.30 1.00 1.77 China Feb : 53.31 168.00 1.00 113.00 162.00 0.20 60.11 Mar : 53.31 168.00 1.00 113.00 162.00 0.20 60.11 FSU-12 Feb : 1.34 18.54 1.18 12.54 14.16 5.61 1.29 Mar : 1.34 18.56 0.68 12.14 13.76 5.61 1.22 Ukraine Feb : 0.67 11.90 0.01 5.70 6.40 5.50 0.68 Mar : 0.67 11.90 0.01 5.70 6.40 5.50 0.68 =============================================================================== 1/ Aggregate of local marketing years. 2/ Total foreign and world use adjusted to reflect the differences in world imports and exports. 3/ World imports and exports may not balance due to differences in marketing years, grain in transit, and reporting discrepancies in some countries. 4/ Argentina and South Africa. 5/ Egypt, the EU-27, Mexico, Japan, South Korea, Taiwan, and Southeast Asia. 6/ Trade excludes intra-trade. 7/ Indonesia, Malaysia, Philippines, Thailand, and Vietnam.

WASDE-492-24 March 2011 World Rice Supply and Use (Milled Basis) 1/ (Million Metric Tons) =============================================================================== : Supply : Use : :=========================:===================: Ending Region : : : : : : stocks :Beginning:Produc-: : Total 2/: : : stocks : tion :Imports: Domestic: Exports : =============================================================================== : : 2008/09 World 3/ : 80.28 448.15 27.19 436.95 28.91 91.49 United States : 0.92 6.40 0.61 3.96 3.00 0.96 Total foreign : 79.37 441.75 26.58 432.98 25.91 90.53 Major exporters 4/ : 18.43 150.32 0.80 123.08 19.52 26.95 India : 13.00 99.18 0.00 91.09 2.09 19.00 Pakistan : 0.70 6.90 0.00 3.49 2.91 1.20 Thailand : 2.71 19.85 0.30 9.50 8.57 4.79 Vietnam : 2.02 24.39 0.50 19.00 5.95 1.96 Major importers 5/ : 14.09 64.49 11.53 73.94 0.74 15.44 Brazil : 0.64 8.57 0.68 8.40 0.57 0.91 EU-27 6/ : 1.13 1.62 1.34 2.93 0.14 1.02 Indonesia : 5.61 38.31 0.25 37.10 0.01 7.06 Nigeria : 0.77 3.20 1.75 5.15 0.00 0.57 Philippines : 4.42 10.76 2.60 13.10 0.00 4.67 Sel. Mideast 7/ : 1.43 1.67 3.73 5.65 0.02 1.16 Selected other : Burma : 0.59 10.15 0.00 9.65 1.05 0.04 C. Amer & Carib 8/ : 0.40 1.51 1.35 2.96 0.00 0.31 China : 38.02 134.33 0.34 133.00 0.78 38.90 Egypt : 0.69 4.40 0.02 4.00 0.55 0.56 Japan : 2.56 8.03 0.66 8.33 0.20 2.72 Mexico : 0.19 0.16 0.59 0.76 0.01 0.17 South Korea : 0.69 4.84 0.25 4.79 0.00 1.00 : : 2009/10 (Estimated) World 3/ : 91.49 440.92 27.92 438.14 30.72 94.26 United States : 0.96 6.92 0.60 3.86 3.47 1.15 Total foreign : 90.53 434.00 27.31 434.28 27.26 93.11 Major exporters 4/ : 26.95 141.17 0.70 117.78 21.63 29.40 India : 19.00 89.13 0.00 85.73 1.90 20.50 Pakistan : 1.20 6.80 0.00 2.90 4.00 1.10 Thailand : 4.79 20.26 0.30 10.00 9.00 6.35 Vietnam : 1.96 24.98 0.40 19.15 6.73 1.46 Major importers 5/ : 15.44 61.65 11.66 75.25 0.65 12.85 Brazil : 0.91 7.66 0.73 8.40 0.40 0.49 EU-27 6/ : 1.02 2.00 1.24 3.00 0.23 1.03 Indonesia : 7.06 36.37 1.15 38.00 0.00 6.58 Nigeria : 0.57 3.40 1.75 5.25 0.00 0.47 Philippines : 4.67 9.77 2.20 13.30 0.00 3.35 Sel. Mideast 7/ : 1.16 2.07 3.33 5.66 0.02 0.88 Selected other : Burma : 0.04 10.60 0.00 9.86 0.45 0.34 C. Amer & Carib 8/ : 0.31 1.63 1.46 3.04 0.00 0.35 China : 38.90 136.57 0.37 134.32 0.62 40.90 Egypt : 0.56 4.30 0.01 3.67 0.70 0.50 Japan : 2.72 7.71 0.67 8.20 0.20 2.69 Mexico : 0.17 0.18 0.61 0.78 0.01 0.17 South Korea : 1.00 4.92 0.31 4.76 0.01 1.45 =============================================================================== 1/ Aggregate of local marketing years. 2/ Total foreign and world use adjusted to reflect the differences in world imports and exports. Total domestic includes both domestic use and unreported disappearance. 3/ World imports and exports may not balance due to differences in some countries. 4/ India, Pakistan, Thailand, and Vietnam. 5/ Brazil, Indonesia, Hong Kong, Cote d'Ivoire, Nigeria, Philippines, selected Middle East, and the EU-27. 6/ Trade excludes intra-trade. 7/ Selected Middle East includes Iran, Iraq, and Saudi Arabia. 8/ Central American and Caribbean countries.

WASDE-492-25 March 2011 World Rice Supply and Use (Milled Basis) 1/ (Cont'd.) (Million Metric Tons) =============================================================================== : Supply : Use : :=========================:===================: Ending Region : : : : : : stocks :Beginning:Produc-: : Total 2/: : : stocks : tion :Imports: Domestic: Exports : =============================================================================== : : 2010/11 (Projected) World 3/ : February : 94.49 451.65 29.79 452.28 31.06 93.85 March : 94.26 451.52 30.03 447.00 30.57 98.78 United States : February : 1.15 7.44 0.57 4.00 3.55 1.62 March : 1.15 7.47 0.57 4.01 3.57 1.62 Total foreign : February : 93.33 444.21 29.22 448.28 27.51 92.24 March : 93.11 444.05 29.46 442.99 27.00 97.15 Major exporters 4/ : February : 29.40 145.33 0.90 127.70 20.95 26.99 March : 29.40 144.83 0.90 123.50 21.05 30.59 India Feb : 20.50 95.00 0.00 95.00 2.50 18.00 Mar : 20.50 94.50 0.00 91.00 2.40 21.60 Pakistan Feb : 1.10 5.00 0.00 3.00 2.65 0.45 Mar : 1.10 5.00 0.00 3.00 2.65 0.45 Thailand Feb : 6.35 20.35 0.30 10.20 10.00 6.80 Mar : 6.35 20.35 0.30 10.20 10.00 6.80 Vietnam Feb : 1.46 24.98 0.60 19.50 5.80 1.74 Mar : 1.46 24.98 0.60 19.30 6.00 1.74 Major importers 5/ : February : 13.09 64.50 12.27 76.56 0.80 12.49 March : 12.85 64.70 12.09 76.53 0.80 12.31 Brazil Feb : 0.70 8.50 0.65 8.50 0.60 0.75 Mar : 0.49 8.70 0.50 8.45 0.60 0.64 EU-27 6/ Feb : 1.03 2.02 1.35 3.05 0.18 1.17 Mar : 1.03 2.02 1.35 3.05 0.18 1.17 Indonesia Feb : 6.58 37.50 1.75 38.85 0.00 6.98 Mar : 6.58 37.50 1.75 38.85 0.00 6.98 Nigeria Feb : 0.47 3.60 1.90 5.50 0.00 0.47 Mar : 0.47 3.60 1.90 5.50 0.00 0.47 Philippines Feb : 3.35 10.35 1.86 13.33 0.00 2.23 Mar : 3.35 10.35 1.86 13.33 0.00 2.23 Sel. Mideast 7/Feb : 0.92 2.13 3.45 5.65 0.02 0.83 Mar : 0.88 2.13 3.42 5.67 0.02 0.75 Selected other : Burma Feb : 0.34 10.50 0.00 10.10 0.50 0.24 Mar : 0.34 10.50 0.00 10.10 0.20 0.54 C. Am & Car. 8/Feb : 0.35 1.69 1.49 3.15 0.00 0.37 Mar : 0.35 1.69 1.49 3.15 0.00 0.37 China Feb : 40.85 139.30 0.33 136.50 0.90 43.08 Mar : 40.90 139.30 0.40 136.00 0.60 44.00 Egypt Feb : 0.50 3.10 0.02 3.40 0.04 0.18 Mar : 0.50 3.10 0.02 3.40 0.04 0.18 Japan Feb : 2.69 7.72 0.70 8.13 0.20 2.79 Mar : 2.69 7.72 0.70 8.13 0.20 2.79 Mexico Feb : 0.17 0.15 0.66 0.82 0.01 0.15 Mar : 0.17 0.15 0.66 0.82 0.01 0.15 South Korea Feb : 1.45 4.30 0.33 4.80 0.01 1.28 Mar : 1.45 4.30 0.33 4.80 0.01 1.28 =============================================================================== 1/ Aggregate of local marketing years. 2/ Total foreign and world use adjusted to reflect the differences in world imports and exports. Total domestic includes both domestic use and unreported disappearance. 3/ World imports and exports may not balance due to differences in some countries. 4/ India, Pakistan, Thailand, and Vietnam. 5/ Brazil, Indonesia, Hong Kong, Cote d'Ivoire, Nigeria, Philippines, selected Middle East, the EU-27. 6/ Trade excludes intra-trade. 7/ Selected Middle East includes Iran, Iraq, and Saudi Arabia. 8/ Central American and Caribbean countries.

WASDE-492-26 March 2011 World Cotton Supply and Use 1/ (Million 480-pound bales) ================================================================================ : Supply : Use : : Region :=========================:================: Loss : Ending :Beginning:Produc-:Imports:Domestic:Exports: 2/ : stocks : stocks : tion : : : : : ================================================================================ : : 2008/09 : World : 60.73 107.10 30.14 110.07 30.07 -2.68 60.52 United States : 10.05 12.82 3/ 3.59 13.26 -0.32 6.34 Total foreign : 50.68 94.29 30.14 106.48 16.80 -2.36 54.18 Major exporters 4/ : 17.75 42.32 1.54 26.83 13.88 -0.21 21.13 Central Asia 5/ : 2.34 7.08 0.01 1.60 4.45 0.00 3.37 Afr. Fr. Zone 6/ : 0.67 2.41 3/ 0.19 2.15 0.00 0.75 S. Hemis. 7/ : 8.33 8.68 0.31 5.52 4.60 -0.23 7.43 Australia : 0.63 1.50 3/ 0.05 1.20 -0.10 0.98 Brazil : 6.25 5.48 0.05 4.20 2.74 -0.15 4.99 India : 5.63 22.60 0.80 17.75 2.36 0.00 8.92 Major importers 8/ : 30.99 49.21 26.16 75.36 1.88 -2.15 31.27 Mexico : 0.93 0.57 1.32 1.85 0.18 0.03 0.76 China : 20.50 36.70 7.00 44.00 0.08 -2.25 22.37 EU-27 9/ : 0.67 1.23 0.97 1.14 1.02 0.05 0.66 Turkey : 1.95 1.93 2.92 5.10 0.14 -0.09 1.65 Pakistan : 4.47 8.70 1.92 11.25 0.36 0.03 3.46 Indonesia : 0.39 0.03 2.00 2.00 0.02 0.05 0.35 Thailand : 0.32 3/ 1.60 1.60 0.01 0.03 0.29 Bangladesh : 0.62 0.04 3.80 3.75 0.00 0.01 0.70 Vietnam : 0.25 0.01 1.25 1.25 0.00 0.00 0.26 : : 2009/10 (Estimated) : World : 60.52 101.34 35.98 118.52 35.55 -0.07 43.84 United States : 6.34 12.19 3/ 3.46 12.04 0.08 2.95 Total foreign : 54.18 89.16 35.98 115.06 23.51 -0.15 40.90 Major exporters 4/ : 21.13 41.84 1.52 28.86 20.12 -0.26 15.77 Central Asia 5/ : 3.37 5.99 3/ 1.70 5.86 0.00 1.81 Afr. Fr. Zone 6/ : 0.75 2.22 3/ 0.18 2.27 0.00 0.52 S. Hemis. 7/ : 7.43 9.20 0.37 5.66 4.90 -0.28 6.72 Australia : 0.98 1.78 3/ 0.04 2.12 -0.15 0.75 Brazil : 4.99 5.45 0.15 4.40 1.99 -0.15 4.35 India : 8.92 23.00 0.60 19.65 6.55 0.00 6.32 Major importers 8/ : 31.27 44.88 31.85 82.04 2.24 0.11 23.62 Mexico : 0.76 0.42 1.39 1.90 0.08 0.03 0.58 China : 22.37 32.00 10.90 50.00 0.02 0.00 15.25 EU-27 9/ : 0.66 1.01 0.94 1.03 1.06 0.05 0.47 Turkey : 1.65 1.75 4.39 5.80 0.15 -0.08 1.93 Pakistan : 3.46 9.60 1.50 10.90 0.70 0.03 2.93 Indonesia : 0.35 0.03 2.10 2.05 0.02 0.05 0.36 Thailand : 0.29 3/ 1.81 1.78 0.01 0.03 0.29 Bangladesh : 0.70 0.05 3.80 3.80 0.00 0.01 0.74 Vietnam : 0.26 0.02 1.69 1.60 0.00 0.00 0.37 ================================================================================ 1/ Marketing year beginning August 1. Totals may not add exactly and trade may not balance due to rounding and other factors. 2/ Generally reflects cotton lost or destroyed in the marketing channel; for Australia, Brazil, China, and the United States, reflects the difference between implicit stocks based on supply less total use and indicated ending stocks. 3/ Less than 5,000 bales. 4/ Includes Egypt and Syria in addition to the countries and regions listed. 5/ Azerbaijan, Kazakhstan, Kyrgyzstan, Tajikistan, Turkmenistan, and Uzbekistan. 6/ Benin, Burkino Faso, Cameroon, Central African Republic, Chad, Cote d'Ivoire, Mali, Niger, Senegal, and Togo. 7/ Argentina, Australia, Brazil, Paraguay, South Africa, Tanzania, and Zimbabwe. 8/ In addition to the countries and regions listed, includes Hong Kong, Japan, Russia, South Korea, and Taiwan. 9/ Includes intra-EU trade.
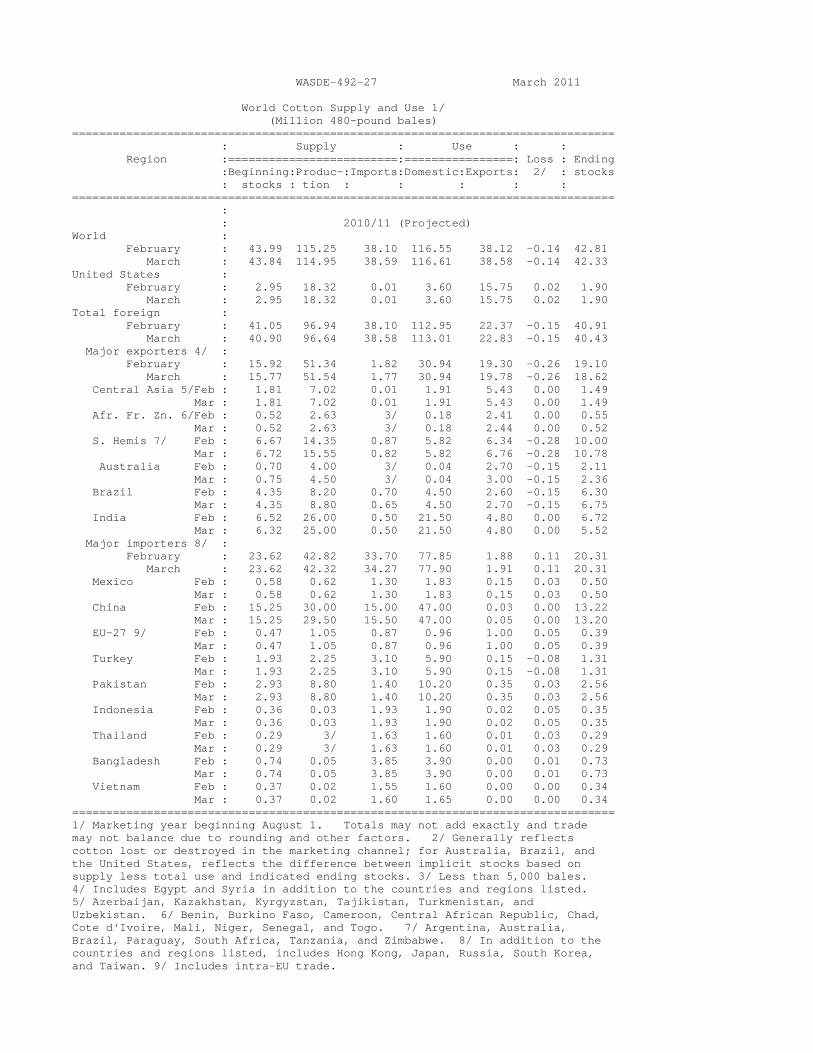
WASDE-492-27 March 2011 World Cotton Supply and Use 1/ (Million 480-pound bales) ================================================================================ : Supply : Use : : Region :=========================:================: Loss : Ending :Beginning:Produc-:Imports:Domestic:Exports: 2/ : stocks : stocks : tion : : : : : ================================================================================ : : 2010/11 (Projected) World : February : 43.99 115.25 38.10 116.55 38.12 -0.14 42.81 March : 43.84 114.95 38.59 116.61 38.58 -0.14 42.33 United States : February : 2.95 18.32 0.01 3.60 15.75 0.02 1.90 March : 2.95 18.32 0.01 3.60 15.75 0.02 1.90 Total foreign : February : 41.05 96.94 38.10 112.95 22.37 -0.15 40.91 March : 40.90 96.64 38.58 113.01 22.83 -0.15 40.43 Major exporters 4/ : February : 15.92 51.34 1.82 30.94 19.30 -0.26 19.10 March : 15.77 51.54 1.77 30.94 19.78 -0.26 18.62 Central Asia 5/Feb : 1.81 7.02 0.01 1.91 5.43 0.00 1.49 Mar : 1.81 7.02 0.01 1.91 5.43 0.00 1.49 Afr. Fr. Zn. 6/Feb : 0.52 2.63 3/ 0.18 2.41 0.00 0.55 Mar : 0.52 2.63 3/ 0.18 2.44 0.00 0.52 S. Hemis 7/ Feb : 6.67 14.35 0.87 5.82 6.34 -0.28 10.00 Mar : 6.72 15.55 0.82 5.82 6.76 -0.28 10.78 Australia Feb : 0.70 4.00 3/ 0.04 2.70 -0.15 2.11 Mar : 0.75 4.50 3/ 0.04 3.00 -0.15 2.36 Brazil Feb : 4.35 8.20 0.70 4.50 2.60 -0.15 6.30 Mar : 4.35 8.80 0.65 4.50 2.70 -0.15 6.75 India Feb : 6.52 26.00 0.50 21.50 4.80 0.00 6.72 Mar : 6.32 25.00 0.50 21.50 4.80 0.00 5.52 Major importers 8/ : February : 23.62 42.82 33.70 77.85 1.88 0.11 20.31 March : 23.62 42.32 34.27 77.90 1.91 0.11 20.31 Mexico Feb : 0.58 0.62 1.30 1.83 0.15 0.03 0.50 Mar : 0.58 0.62 1.30 1.83 0.15 0.03 0.50 China Feb : 15.25 30.00 15.00 47.00 0.03 0.00 13.22 Mar : 15.25 29.50 15.50 47.00 0.05 0.00 13.20 EU-27 9/ Feb : 0.47 1.05 0.87 0.96 1.00 0.05 0.39 Mar : 0.47 1.05 0.87 0.96 1.00 0.05 0.39 Turkey Feb : 1.93 2.25 3.10 5.90 0.15 -0.08 1.31 Mar : 1.93 2.25 3.10 5.90 0.15 -0.08 1.31 Pakistan Feb : 2.93 8.80 1.40 10.20 0.35 0.03 2.56 Mar : 2.93 8.80 1.40 10.20 0.35 0.03 2.56 Indonesia Feb : 0.36 0.03 1.93 1.90 0.02 0.05 0.35 Mar : 0.36 0.03 1.93 1.90 0.02 0.05 0.35 Thailand Feb : 0.29 3/ 1.63 1.60 0.01 0.03 0.29 Mar : 0.29 3/ 1.63 1.60 0.01 0.03 0.29 Bangladesh Feb : 0.74 0.05 3.85 3.90 0.00 0.01 0.73 Mar : 0.74 0.05 3.85 3.90 0.00 0.01 0.73 Vietnam Feb : 0.37 0.02 1.55 1.60 0.00 0.00 0.34 Mar : 0.37 0.02 1.60 1.65 0.00 0.00 0.34 ================================================================================ 1/ Marketing year beginning August 1. Totals may not add exactly and trade may not balance due to rounding and other factors. 2/ Generally reflects cotton lost or destroyed in the marketing channel; for Australia, Brazil, and the United States, reflects the difference between implicit stocks based on supply less total use and indicated ending stocks. 3/ Less than 5,000 bales. 4/ Includes Egypt and Syria in addition to the countries and regions listed. 5/ Azerbaijan, Kazakhstan, Kyrgyzstan, Tajikistan, Turkmenistan, and Uzbekistan. 6/ Benin, Burkino Faso, Cameroon, Central African Republic, Chad, Cote d'Ivoire, Mali, Niger, Senegal, and Togo. 7/ Argentina, Australia, Brazil, Paraguay, South Africa, Tanzania, and Zimbabwe. 8/ In addition to the countries and regions listed, includes Hong Kong, Japan, Russia, South Korea, and Taiwan. 9/ Includes intra-EU trade.

WASDE-492-28 March 2011 World Soybean Supply and Use 1/ (Million Metric Tons) =============================================================================== : Supply : Use : :=========================:=======================:Ending Region : : : : : :stocks :Beginning:Produc-: : Domestic : : : stocks : tion :Imports: Crush : Total :Exports: =============================================================================== : : 2008/09 World 2/ : 51.42 211.96 77.18 192.91 221.13 76.85 42.58 United States : 5.58 80.75 0.36 45.23 48.11 34.82 3.76 Total foreign : 45.84 131.22 76.81 147.68 173.02 42.03 38.82 Major exporters 3/ : 40.88 93.80 1.31 64.81 69.42 37.81 28.75 Argentina : 21.76 32.00 1.24 31.24 32.82 5.59 16.59 Brazil : 18.90 57.80 0.04 31.87 34.72 29.99 12.04 Major importers 4/ : 4.11 17.58 64.50 61.66 77.20 0.45 8.54 China : 2.75 15.54 41.10 41.04 51.44 0.40 7.56 EU-27 : 0.81 0.64 13.21 12.86 14.09 0.02 0.56 Japan : 0.27 0.26 3.40 2.50 3.75 0.00 0.18 Mexico : 0.06 0.15 3.33 3.47 3.50 0.00 0.04 : : 2009/10 (Estimated) World 2/ : 42.58 260.27 87.44 209.51 238.55 92.74 59.00 United States : 3.76 91.42 0.40 47.67 50.62 40.85 4.11 Total foreign : 38.82 168.85 87.04 161.84 187.93 51.89 54.89 Major exporters 3/ : 28.75 130.70 0.19 69.49 74.18 47.02 38.45 Argentina : 16.59 54.50 0.00 34.12 35.72 13.09 22.28 Brazil : 12.04 69.00 0.17 33.67 36.57 28.58 16.06 Major importers 4/ : 8.54 17.02 73.76 69.35 85.16 0.24 13.92 China : 7.56 14.98 50.34 48.83 59.43 0.18 13.26 EU-27 : 0.56 0.84 12.61 12.51 13.59 0.04 0.38 Japan : 0.18 0.23 3.40 2.51 3.72 0.00 0.09 Mexico : 0.04 0.11 3.45 3.51 3.55 0.00 0.05 : : 2010/11 (Projected) World 2/ : February : 60.17 256.10 95.87 225.16 255.28 98.65 58.21 March : 59.00 258.40 95.79 226.48 256.60 98.26 58.33 United States : February : 4.11 90.61 0.41 45.04 48.03 43.27 3.82 March : 4.11 90.61 0.41 45.04 48.03 43.27 3.82 Total foreign : February : 56.06 165.49 95.46 180.12 207.25 55.38 54.39 March : 54.89 167.79 95.38 181.44 208.57 54.99 54.51 Major exporters 3/ : February : 38.45 125.50 0.20 75.20 80.03 49.54 34.58 March : 38.45 127.00 0.20 76.00 80.83 49.14 35.68 Argentina Feb : 22.28 49.50 0.00 39.00 40.65 11.60 19.53 Mar : 22.28 49.50 0.00 39.00 40.65 11.00 20.13 Brazil Feb : 16.06 68.50 0.18 34.50 37.50 32.30 14.94 Mar : 16.06 70.00 0.18 35.30 38.30 32.50 15.44 Major importers 4/ : February : 15.13 16.68 82.20 79.60 96.07 0.51 17.43 March : 13.92 17.48 82.20 79.60 96.07 0.36 17.16 China Feb : 14.47 14.40 57.00 57.80 68.85 0.45 16.57 Mar : 13.26 15.20 57.00 57.80 68.85 0.30 16.31 EU-27 Feb : 0.38 1.03 14.00 13.60 14.82 0.03 0.55 Mar : 0.38 1.03 14.00 13.60 14.82 0.03 0.55 Japan Feb : 0.09 0.23 3.45 2.47 3.69 0.00 0.07 Mar : 0.09 0.23 3.45 2.47 3.69 0.00 0.07 Mexico Feb : 0.05 0.11 3.60 3.67 3.71 0.00 0.05 Mar : 0.05 0.11 3.60 3.67 3.71 0.00 0.05 =============================================================================== 1/ Data based on local marketing years except Argentina and Brazil which are adjusted to an October-September year. 2/ World imports and exports may not balance due to differences in local marketing years and to time lags between reported exports and imports. Therefore, world supply may not equal world use. 3/ Argentina, Brazil and Paraguay. 4/ Japan, China, and EU, Mexico, and Southeast Asia (includes Indonesia, Malaysia, Philippines, and Thailand).
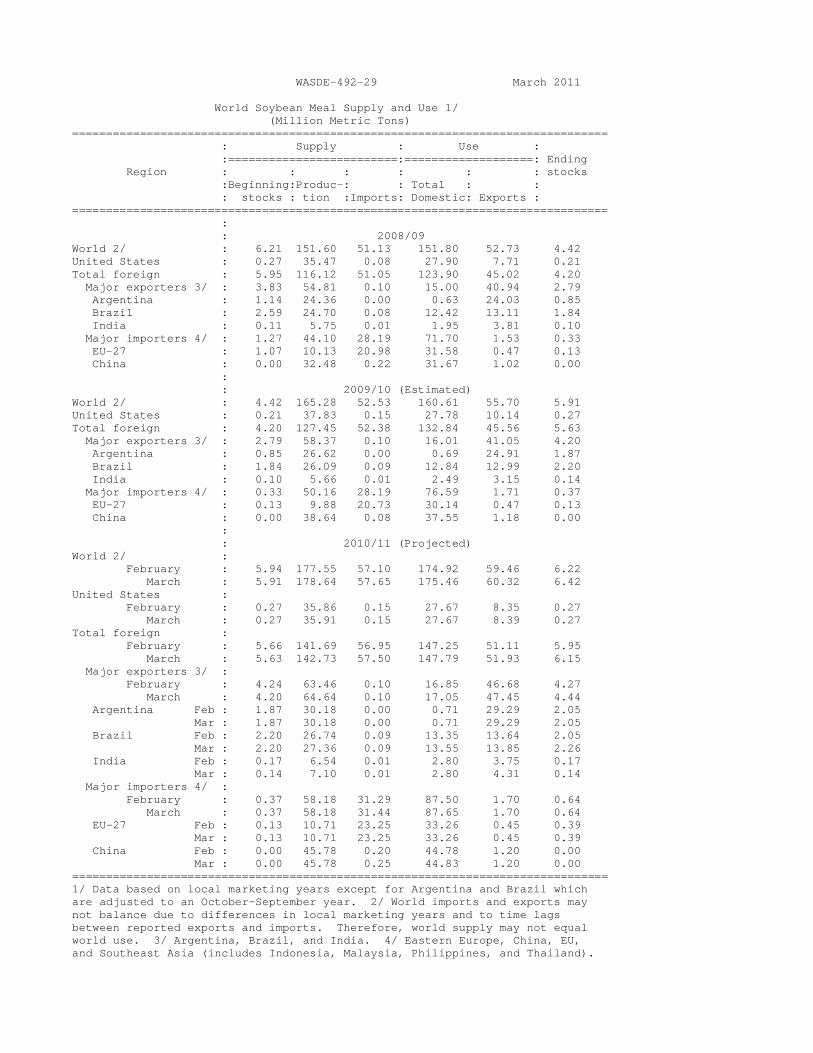
WASDE-492-29 March 2011 World Soybean Meal Supply and Use 1/ (Million Metric Tons) =============================================================================== : Supply : Use : :=========================:===================: Ending Region : : : : : : stocks :Beginning:Produc-: : Total : : : stocks : tion :Imports: Domestic: Exports : =============================================================================== : : 2008/09 World 2/ : 6.21 151.60 51.13 151.80 52.73 4.42 United States : 0.27 35.47 0.08 27.90 7.71 0.21 Total foreign : 5.95 116.12 51.05 123.90 45.02 4.20 Major exporters 3/ : 3.83 54.81 0.10 15.00 40.94 2.79 Argentina : 1.14 24.36 0.00 0.63 24.03 0.85 Brazil : 2.59 24.70 0.08 12.42 13.11 1.84 India : 0.11 5.75 0.01 1.95 3.81 0.10 Major importers 4/ : 1.27 44.10 28.19 71.70 1.53 0.33 EU-27 : 1.07 10.13 20.98 31.58 0.47 0.13 China : 0.00 32.48 0.22 31.67 1.02 0.00 : : 2009/10 (Estimated) World 2/ : 4.42 165.28 52.53 160.61 55.70 5.91 United States : 0.21 37.83 0.15 27.78 10.14 0.27 Total foreign : 4.20 127.45 52.38 132.84 45.56 5.63 Major exporters 3/ : 2.79 58.37 0.10 16.01 41.05 4.20 Argentina : 0.85 26.62 0.00 0.69 24.91 1.87 Brazil : 1.84 26.09 0.09 12.84 12.99 2.20 India : 0.10 5.66 0.01 2.49 3.15 0.14 Major importers 4/ : 0.33 50.16 28.19 76.59 1.71 0.37 EU-27 : 0.13 9.88 20.73 30.14 0.47 0.13 China : 0.00 38.64 0.08 37.55 1.18 0.00 : : 2010/11 (Projected) World 2/ : February : 5.94 177.55 57.10 174.92 59.46 6.22 March : 5.91 178.64 57.65 175.46 60.32 6.42 United States : February : 0.27 35.86 0.15 27.67 8.35 0.27 March : 0.27 35.91 0.15 27.67 8.39 0.27 Total foreign : February : 5.66 141.69 56.95 147.25 51.11 5.95 March : 5.63 142.73 57.50 147.79 51.93 6.15 Major exporters 3/ : February : 4.24 63.46 0.10 16.85 46.68 4.27 March : 4.20 64.64 0.10 17.05 47.45 4.44 Argentina Feb : 1.87 30.18 0.00 0.71 29.29 2.05 Mar : 1.87 30.18 0.00 0.71 29.29 2.05 Brazil Feb : 2.20 26.74 0.09 13.35 13.64 2.05 Mar : 2.20 27.36 0.09 13.55 13.85 2.26 India Feb : 0.17 6.54 0.01 2.80 3.75 0.17 Mar : 0.14 7.10 0.01 2.80 4.31 0.14 Major importers 4/ : February : 0.37 58.18 31.29 87.50 1.70 0.64 March : 0.37 58.18 31.44 87.65 1.70 0.64 EU-27 Feb : 0.13 10.71 23.25 33.26 0.45 0.39 Mar : 0.13 10.71 23.25 33.26 0.45 0.39 China Feb : 0.00 45.78 0.20 44.78 1.20 0.00 Mar : 0.00 45.78 0.25 44.83 1.20 0.00 =============================================================================== 1/ Data based on local marketing years except for Argentina and Brazil which are adjusted to an October-September year. 2/ World imports and exports may not balance due to differences in local marketing years and to time lags between reported exports and imports. Therefore, world supply may not equal world use. 3/ Argentina, Brazil, and India. 4/ Eastern Europe, China, EU, and Southeast Asia (includes Indonesia, Malaysia, Philippines, and Thailand).

WASDE-492-30 March 2011 World Soybean Oil Supply and Use 1/ (Million Metric Tons) =============================================================================== : Supply : Use : :=========================:===================: Ending Region : : : : : : stocks :Beginning:Produc-: : Total : : : stocks : tion :Imports: Domestic: Exports : =============================================================================== : : 2008/09 World 2/ : 3.29 35.74 9.08 36.09 9.10 2.92 United States : 1.13 8.50 0.04 7.38 1.00 1.30 Total foreign : 2.16 27.24 9.04 28.72 8.10 1.62 Major exporters 3/ : 0.90 14.35 0.80 8.50 7.01 0.54 Argentina : 0.30 5.91 0.00 1.43 4.70 0.08 Brazil : 0.39 6.12 0.01 4.30 1.91 0.32 EU-27 : 0.21 2.31 0.79 2.78 0.40 0.14 Major importers 4/ : 0.30 8.60 3.60 11.83 0.09 0.58 China : 0.23 7.31 2.49 9.49 0.08 0.47 India : 0.06 1.29 1.06 2.30 0.00 0.10 Pakistan : 0.01 0.00 0.04 0.05 0.00 0.01 : : 2009/10 (Estimated) World 2/ : 2.92 38.76 8.69 38.25 9.07 3.05 United States : 1.30 8.90 0.05 7.20 1.52 1.52 Total foreign : 1.62 29.87 8.64 31.06 7.54 1.53 Major exporters 3/ : 0.54 15.19 0.58 9.30 6.26 0.75 Argentina : 0.08 6.48 0.00 1.93 4.43 0.20 Brazil : 0.32 6.46 0.04 4.97 1.45 0.39 EU-27 : 0.14 2.25 0.54 2.40 0.38 0.16 Major importers 4/ : 0.58 9.97 3.14 13.28 0.08 0.33 China : 0.47 8.70 1.51 10.44 0.08 0.17 India : 0.10 1.27 1.60 2.81 0.00 0.15 Pakistan : 0.01 0.00 0.03 0.04 0.00 0.00 : : 2010/11 (Projected) World 2/ : February : 3.05 41.87 9.21 41.80 9.57 2.76 March : 3.05 42.13 9.34 42.06 9.81 2.65 United States : February : 1.52 8.62 0.05 7.76 1.27 1.17 March : 1.52 8.63 0.05 7.76 1.36 1.09 Total foreign : February : 1.53 33.26 9.16 34.05 8.30 1.60 March : 1.53 33.50 9.28 34.31 8.45 1.55 Major exporters 3/ : February : 0.78 16.50 0.80 10.10 7.04 0.94 March : 0.75 16.65 0.97 10.37 7.08 0.92 Argentina Feb : 0.20 7.43 0.00 2.27 5.20 0.17 Mar : 0.20 7.43 0.00 2.27 5.10 0.27 Brazil Feb : 0.42 6.62 0.05 5.17 1.54 0.38 Mar : 0.39 6.77 0.02 5.19 1.64 0.35 EU-27 Feb : 0.16 2.45 0.75 2.67 0.30 0.39 Mar : 0.16 2.45 0.95 2.92 0.34 0.30 Major importers 4/ : February : 0.33 11.78 3.34 15.11 0.07 0.27 March : 0.33 11.91 3.04 14.94 0.07 0.27 China Feb : 0.17 10.32 2.00 12.20 0.07 0.22 Mar : 0.17 10.32 2.00 12.20 0.07 0.22 India Feb : 0.15 1.47 1.30 2.87 0.00 0.05 Mar : 0.15 1.59 1.00 2.70 0.00 0.04 Pakistan Feb : 0.00 0.00 0.04 0.04 0.00 0.00 Mar : 0.00 0.00 0.04 0.04 0.00 0.00 =============================================================================== 1/ Data based on local marketing years except for Argentina and Brazil which are adjusted to an October-September year. 2/ World imports and exports may not balance due to differences in local marketing years and to time lags between reported exports and imports. Therefore, world supply may not equal world use. 3/ Argentina, Brazil and EU. 4/ India, China and Pakistan.
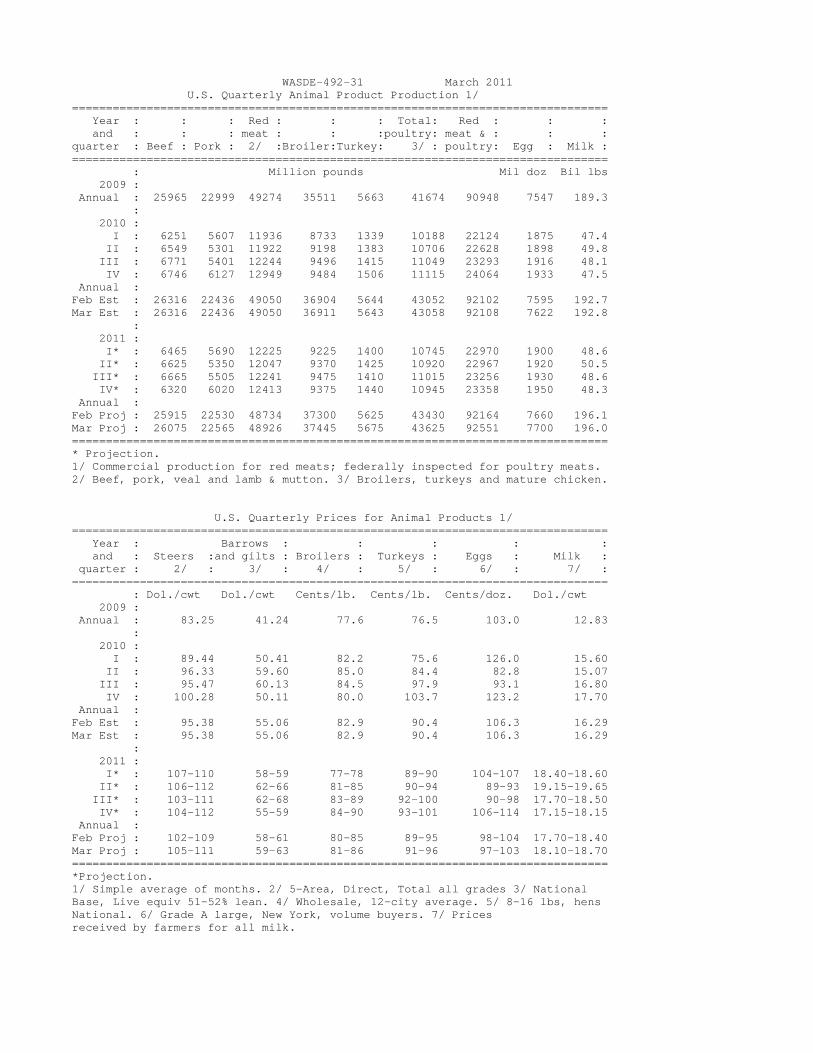
WASDE-492-31 March 2011 U.S. Quarterly Animal Product Production 1/ =============================================================================== Year : : : Red : : : Total: Red : : : and : : : meat : : :poultry: meat & : : : quarter : Beef : Pork : 2/ :Broiler:Turkey: 3/ : poultry: Egg : Milk : =============================================================================== : Million pounds Mil doz Bil lbs 2009 : Annual : 25965 22999 49274 35511 5663 41674 90948 7547 189.3 : 2010 : I : 6251 5607 11936 8733 1339 10188 22124 1875 47.4 II : 6549 5301 11922 9198 1383 10706 22628 1898 49.8 III : 6771 5401 12244 9496 1415 11049 23293 1916 48.1 IV : 6746 6127 12949 9484 1506 11115 24064 1933 47.5 Annual : Feb Est : 26316 22436 49050 36904 5644 43052 92102 7595 192.7 Mar Est : 26316 22436 49050 36911 5643 43058 92108 7622 192.8 : 2011 : I* : 6465 5690 12225 9225 1400 10745 22970 1900 48.6 II* : 6625 5350 12047 9370 1425 10920 22967 1920 50.5 III* : 6665 5505 12241 9475 1410 11015 23256 1930 48.6 IV* : 6320 6020 12413 9375 1440 10945 23358 1950 48.3 Annual : Feb Proj : 25915 22530 48734 37300 5625 43430 92164 7660 196.1 Mar Proj : 26075 22565 48926 37445 5675 43625 92551 7700 196.0 =============================================================================== * Projection. 1/ Commercial production for red meats; federally inspected for poultry meats. 2/ Beef, pork, veal and lamb & mutton. 3/ Broilers, turkeys and mature chicken. U.S. Quarterly Prices for Animal Products 1/ =============================================================================== Year : Barrows : : : : : and : Steers :and gilts : Broilers : Turkeys : Eggs : Milk : quarter : 2/ : 3/ : 4/ : 5/ : 6/ : 7/ : =============================================================================== : Dol./cwt Dol./cwt Cents/lb. Cents/lb. Cents/doz. Dol./cwt 2009 : Annual : 83.25 41.24 77.6 76.5 103.0 12.83 : 2010 : I : 89.44 50.41 82.2 75.6 126.0 15.60 II : 96.33 59.60 85.0 84.4 82.8 15.07 III : 95.47 60.13 84.5 97.9 93.1 16.80 IV : 100.28 50.11 80.0 103.7 123.2 17.70 Annual : Feb Est : 95.38 55.06 82.9 90.4 106.3 16.29 Mar Est : 95.38 55.06 82.9 90.4 106.3 16.29 : 2011 : I* : 107-110 58-59 77-78 89-90 104-107 18.40-18.60 II* : 106-112 62-66 81-85 90-94 89-93 19.15-19.65 III* : 103-111 62-68 83-89 92-100 90-98 17.70-18.50 IV* : 104-112 55-59 84-90 93-101 106-114 17.15-18.15 Annual : Feb Proj : 102-109 58-61 80-85 89-95 98-104 17.70-18.40 Mar Proj : 105-111 59-63 81-86 91-96 97-103 18.10-18.70 =============================================================================== *Projection. 1/ Simple average of months. 2/ 5-Area, Direct, Total all grades 3/ National Base, Live equiv 51-52% lean. 4/ Wholesale, 12-city average. 5/ 8-16 lbs, hens National. 6/ Grade A large, New York, volume buyers. 7/ Prices received by farmers for all milk.
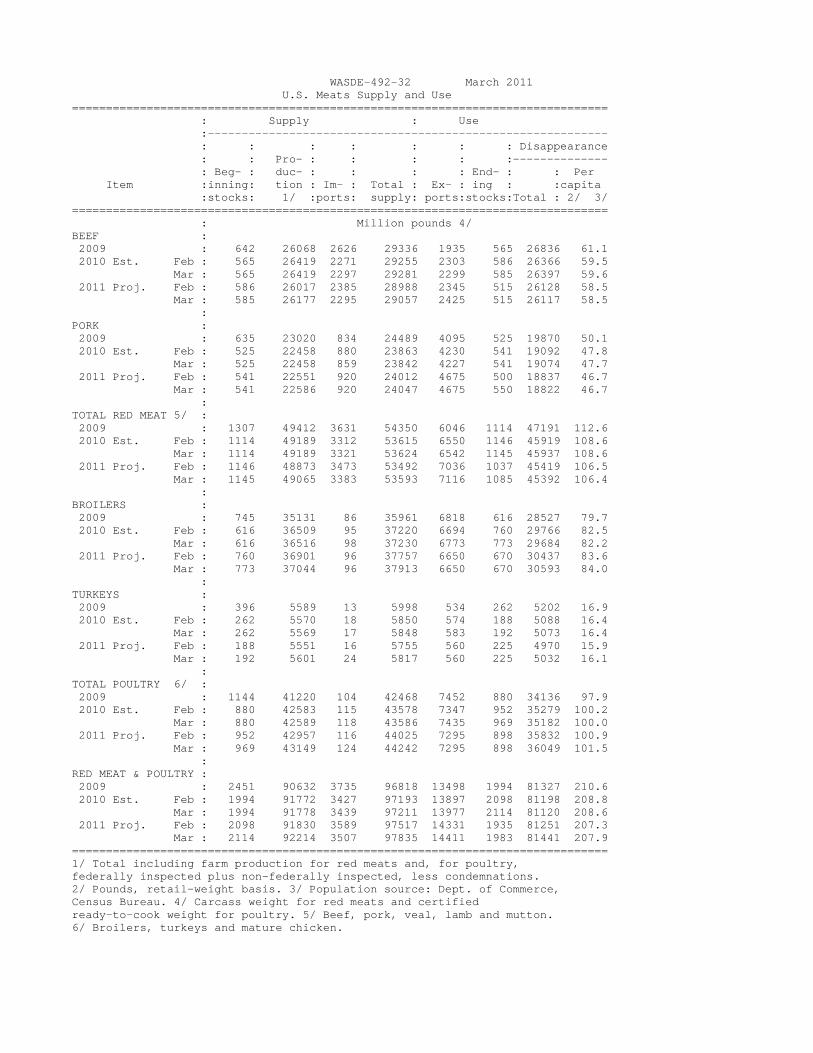
WASDE-492-32 March 2011 U.S. Meats Supply and Use =============================================================================== : Supply : Use :----------------------------------------------------------- : : : : : : : Disappearance : : Pro- : : : : :-------------- : Beg- : duc- : : : : End- : : Per Item :inning: tion : Im- : Total : Ex- : ing : :capita :stocks: 1/ :ports: supply: ports:stocks:Total : 2/ 3/ =============================================================================== : Million pounds 4/ BEEF : 2009 : 642 26068 2626 29336 1935 565 26836 61.1 2010 Est. Feb : 565 26419 2271 29255 2303 586 26366 59.5 Mar : 565 26419 2297 29281 2299 585 26397 59.6 2011 Proj. Feb : 586 26017 2385 28988 2345 515 26128 58.5 Mar : 585 26177 2295 29057 2425 515 26117 58.5 : PORK : 2009 : 635 23020 834 24489 4095 525 19870 50.1 2010 Est. Feb : 525 22458 880 23863 4230 541 19092 47.8 Mar : 525 22458 859 23842 4227 541 19074 47.7 2011 Proj. Feb : 541 22551 920 24012 4675 500 18837 46.7 Mar : 541 22586 920 24047 4675 550 18822 46.7 : TOTAL RED MEAT 5/ : 2009 : 1307 49412 3631 54350 6046 1114 47191 112.6 2010 Est. Feb : 1114 49189 3312 53615 6550 1146 45919 108.6 Mar : 1114 49189 3321 53624 6542 1145 45937 108.6 2011 Proj. Feb : 1146 48873 3473 53492 7036 1037 45419 106.5 Mar : 1145 49065 3383 53593 7116 1085 45392 106.4 : BROILERS : 2009 : 745 35131 86 35961 6818 616 28527 79.7 2010 Est. Feb : 616 36509 95 37220 6694 760 29766 82.5 Mar : 616 36516 98 37230 6773 773 29684 82.2 2011 Proj. Feb : 760 36901 96 37757 6650 670 30437 83.6 Mar : 773 37044 96 37913 6650 670 30593 84.0 : TURKEYS : 2009 : 396 5589 13 5998 534 262 5202 16.9 2010 Est. Feb : 262 5570 18 5850 574 188 5088 16.4 Mar : 262 5569 17 5848 583 192 5073 16.4 2011 Proj. Feb : 188 5551 16 5755 560 225 4970 15.9 Mar : 192 5601 24 5817 560 225 5032 16.1 : TOTAL POULTRY 6/ : 2009 : 1144 41220 104 42468 7452 880 34136 97.9 2010 Est. Feb : 880 42583 115 43578 7347 952 35279 100.2 Mar : 880 42589 118 43586 7435 969 35182 100.0 2011 Proj. Feb : 952 42957 116 44025 7295 898 35832 100.9 Mar : 969 43149 124 44242 7295 898 36049 101.5 : RED MEAT & POULTRY : 2009 : 2451 90632 3735 96818 13498 1994 81327 210.6 2010 Est. Feb : 1994 91772 3427 97193 13897 2098 81198 208.8 Mar : 1994 91778 3439 97211 13977 2114 81120 208.6 2011 Proj. Feb : 2098 91830 3589 97517 14331 1935 81251 207.3 Mar : 2114 92214 3507 97835 14411 1983 81441 207.9 =============================================================================== 1/ Total including farm production for red meats and, for poultry, federally inspected plus non-federally inspected, less condemnations. 2/ Pounds, retail-weight basis. 3/ Population source: Dept. of Commerce, Census Bureau. 4/ Carcass weight for red meats and certified ready-to-cook weight for poultry. 5/ Beef, pork, veal, lamb and mutton. 6/ Broilers, turkeys and mature chicken.
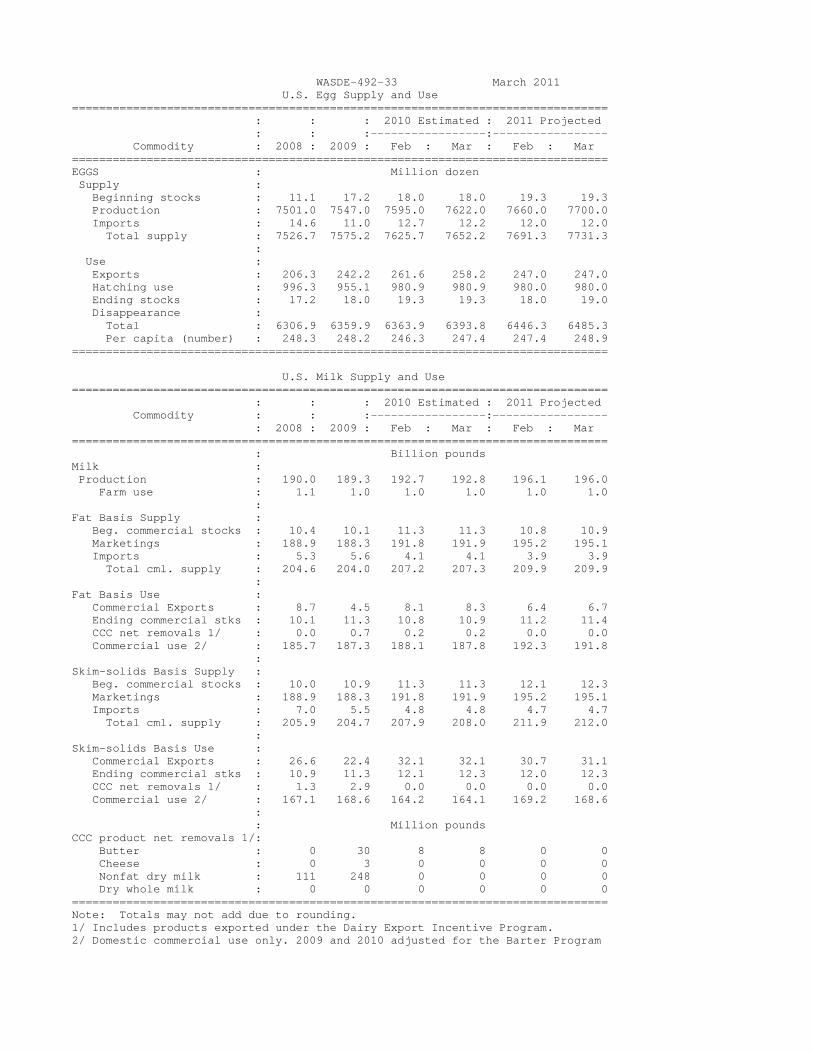
WASDE-492-33 March 2011 U.S. Egg Supply and Use =============================================================================== : : : 2010 Estimated : 2011 Projected : : :-----------------:----------------- Commodity : 2008 : 2009 : Feb : Mar : Feb : Mar =============================================================================== EGGS : Million dozen Supply : Beginning stocks : 11.1 17.2 18.0 18.0 19.3 19.3 Production : 7501.0 7547.0 7595.0 7622.0 7660.0 7700.0 Imports : 14.6 11.0 12.7 12.2 12.0 12.0 Total supply : 7526.7 7575.2 7625.7 7652.2 7691.3 7731.3 : Use : Exports : 206.3 242.2 261.6 258.2 247.0 247.0 Hatching use : 996.3 955.1 980.9 980.9 980.0 980.0 Ending stocks : 17.2 18.0 19.3 19.3 18.0 19.0 Disappearance : Total : 6306.9 6359.9 6363.9 6393.8 6446.3 6485.3 Per capita (number) : 248.3 248.2 246.3 247.4 247.4 248.9 =============================================================================== U.S. Milk Supply and Use =============================================================================== : : : 2010 Estimated : 2011 Projected Commodity : : :-----------------:----------------- : 2008 : 2009 : Feb : Mar : Feb : Mar =============================================================================== : Billion pounds Milk : Production : 190.0 189.3 192.7 192.8 196.1 196.0 Farm use : 1.1 1.0 1.0 1.0 1.0 1.0 : Fat Basis Supply : Beg. commercial stocks : 10.4 10.1 11.3 11.3 10.8 10.9 Marketings : 188.9 188.3 191.8 191.9 195.2 195.1 Imports : 5.3 5.6 4.1 4.1 3.9 3.9 Total cml. supply : 204.6 204.0 207.2 207.3 209.9 209.9 : Fat Basis Use : Commercial Exports : 8.7 4.5 8.1 8.3 6.4 6.7 Ending commercial stks : 10.1 11.3 10.8 10.9 11.2 11.4 CCC net removals 1/ : 0.0 0.7 0.2 0.2 0.0 0.0 Commercial use 2/ : 185.7 187.3 188.1 187.8 192.3 191.8 : Skim-solids Basis Supply : Beg. commercial stocks : 10.0 10.9 11.3 11.3 12.1 12.3 Marketings : 188.9 188.3 191.8 191.9 195.2 195.1 Imports : 7.0 5.5 4.8 4.8 4.7 4.7 Total cml. supply : 205.9 204.7 207.9 208.0 211.9 212.0 : Skim-solids Basis Use : Commercial Exports : 26.6 22.4 32.1 32.1 30.7 31.1 Ending commercial stks : 10.9 11.3 12.1 12.3 12.0 12.3 CCC net removals 1/ : 1.3 2.9 0.0 0.0 0.0 0.0 Commercial use 2/ : 167.1 168.6 164.2 164.1 169.2 168.6 : : Million pounds CCC product net removals 1/: Butter : 0 30 8 8 0 0 Cheese : 0 3 0 0 0 0 Nonfat dry milk : 111 248 0 0 0 0 Dry whole milk : 0 0 0 0 0 0 =============================================================================== Note: Totals may not add due to rounding. 1/ Includes products exported under the Dairy Export Incentive Program. 2/ Domestic commercial use only. 2009 and 2010 adjusted for the Barter Program

WASDE-492-34 March 2011 U.S. Dairy Prices =============================================================================== : : 2010 Estimated : 2011 Projected : : ------------------------:------------------ Commodity : 2008 2009 : Feb : Mar : Feb : Mar =============================================================================== : Dollars per pound : Product Prices 1/ : Cheese : 1.8958 1.2963 1.5226 1.5226 1.640- 1.695- : 1.710 1.755 : Butter : 1.4352 1.2094 1.7020 1.7020 1.710- 1.735- : 1.810 1.825 : Nonfat dry milk : 1.2257 0.9222 1.1687 1.1687 1.345- 1.365- : 1.405 1.415 : Dry whey : 0.2500 0.2584 0.3716 0.3716 0.400- 0.400- : 0.430 0.430 : : Dollars per cwt Milk Prices 2/ : Class III : 17.44 11.36 14.41 14.41 15.80- 16.35- : 16.50 16.95 : Class IV : 14.65 10.89 15.09 15.09 16.70- 16.95- : 17.50 17.65 : All milk 3/ : 18.33 12.83 16.29 16.29 17.70- 18.10- : 18.40 18.70 : =============================================================================== 1/ Simple average of monthly prices calculated by AMS from NASS weekly average dairy product prices for class price computations. 2/ Annual Class III and Class IV prices are the simple averages of monthly minimum Federal order milk prices paid by regulated plants for milk used in the respective classes. All milk price is the simple average of monthly prices received by farmers for milk at average test. 3/ Does not reflect any deductions from producers as authorized by legislation.

WASDE-492-35 March 2011 Note: Tables on pages 35-37 present a 29-year record of the differences between the March projection and the final estimate. Using world wheat production as an example, changes between the March projection and the final estimate have averaged 2.6 million tons (0.5%) ranging from -8.0 to 6.9 million tons. The March projection has been below the estimate 20 times and above 9 times. Reliability of March Projections =============================================================================== :Differences between proj. & final estimate,1981/82-2009/10 1/ Commodity and :============================================================= region : Avg. : Avg. : Difference : Below final : Above final =============================================================================== WHEAT :Percent Million metric tons Number of years Production : World : 0.5 2.6 -8.0 6.9 20 9 U.S. : 0.1 0.0 -0.3 0.1 12 7 Foreign : 0.5 2.6 -8.0 6.9 20 9 Exports : World : 3.2 3.9 -16.9 3.5 24 5 U.S. : 2.7 0.8 -1.5 2.4 16 13 Foreign : 4.2 3.7 -16.0 2.5 22 7 Domestic use : World : 0.7 4.0 -9.4 9.4 12 17 U.S. : 3.0 0.9 -2.4 2.4 12 17 Foreign : 0.7 3.8 -7.9 10.1 16 13 Ending stocks : World : 3.5 4.6 -11.4 9.1 20 9 U.S. : 6.3 1.1 -4.4 2.5 15 14 Foreign : 3.7 4.0 -10.4 9.8 19 9 : COARSE GRAINS 2/ : Production : World : 0.9 8.0 -21.7 10.9 24 5 U.S. : 0.0 0.1 -0.2 1.3 12 7 Foreign : 1.3 8.1 -21.7 10.9 24 5 Exports : World : 3.5 3.7 -8.0 9.9 19 10 U.S. : 6.0 3.1 -6.9 9.1 13 16 Foreign : 5.7 3.1 -10.3 6.7 18 11 Domestic use : World : 0.8 6.6 -17.1 24.2 16 13 U.S. : 2.3 4.3 -17.3 11.5 12 17 Foreign : 0.8 5.5 -14.1 17.5 20 9 Ending stocks : World : 7.3 10.3 -28.2 13.9 24 5 U.S. : 8.9 4.7 -13.8 15.3 17 12 Foreign : 8.8 7.7 -27.0 10.5 25 4 : RICE, milled : Production : World : 1.1 3.8 -13.8 3.4 22 7 U.S. : 0.9 0.1 -0.2 0.2 10 5 Foreign : 1.1 3.8 -13.8 3.3 22 7 Exports : World : 6.2 1.2 -4.6 1.4 23 6 U.S. : 5.4 0.2 -0.5 0.3 15 11 Foreign : 7.1 1.2 -4.4 1.4 22 7 Domestic use : World : 0.8 2.9 -9.8 4.8 21 8 U.S. : 5.0 0.1 -0.4 0.4 11 17 Foreign : 0.8 2.9 -10.0 4.6 21 8 Ending stocks : World : 6.3 3.3 -14.9 4.0 20 9 U.S. : 16.3 0.2 -0.4 0.4 15 13 Foreign : 6.6 3.4 -14.5 3.9 20 9 =============================================================================== 1/ Footnotes at end of table. CONTINUED

WASDE-492-36 March 2011 Reliability of March Projections (Continued) =============================================================================== :Differences between proj. & final estimate,1981/82-2009/10 1/ Commodity and :============================================================= region : Avg. : Avg. : Difference : Below final : Above final =============================================================================== SOYBEANS :Percent Million metric tons Number of years Production : World : 1.9 3.1 -6.4 12.4 17 12 U.S. : 0.9 0.6 -2.5 1.8 12 11 Foreign : 3.1 2.9 -6.4 12.6 17 12 Exports : World : 4.3 2.2 -11.5 9.6 19 9 U.S. : 5.3 1.3 -3.7 3.0 21 8 Foreign : 12.2 2.0 -9.3 9.5 13 16 Domestic use : World : 1.8 2.6 -5.3 11.4 16 13 U.S. : 2.5 1.1 -3.0 2.9 18 10 Foreign : 2.0 2.1 -3.9 12.8 15 14 Ending stocks : World : 11.6 3.1 -6.6 13.9 16 13 U.S. : 22.8 1.7 -2.7 5.4 7 22 Foreign : 12.3 2.4 -6.3 9.7 20 9 : COTTON : Million 480-pound bales Production : World : 1.3 1.2 -5.2 3.0 17 10 U.S. : 0.7 0.1 -0.2 0.3 11 17 Foreign : 1.6 1.2 -5.3 2.9 17 11 Exports : World : 3.1 0.9 -3.1 1.4 14 14 U.S. : 5.1 0.4 -1.3 1.0 12 16 Foreign : 3.9 0.7 -3.6 1.3 17 12 Mill use : World : 1.5 1.3 -6.0 1.3 15 14 U.S. : 2.9 0.2 -0.7 0.6 17 10 Foreign : 2.1 1.6 -5.5 10.0 17 12 Ending stocks : World : 6.9 2.6 -8.4 8.4 17 12 U.S. : 10.6 0.5 -1.2 1.6 10 19 Foreign : 7.6 2.6 -7.8 7.9 19 10 =============================================================================== 1/ Final estimate for 1981/82-2009/10 is defined as the first November estimate following the marketing year. 2/ Includes corn, sorghum, barley, oats, rye, millet, and mixed grain.

WASDE-492-37 March 2011 Reliability of United States March Projections 1/ =============================================================================== :Differences between proj. & final estimate,1981/82-2009/10 2/ Commodity and :============================================================= region : Avg. : Avg. : Difference : Below final : Above final =============================================================================== CORN :Percent Million bushels Number of years Production : 0.0 2 -8 38 1 2 Exports : 6.1 108 -254 284 12 17 Domestic use : 2.3 150 -474 424 13 16 Ending stocks : 10.2 183 -552 713 18 11 : SORGHUM : Production : 0.0 0 0 4 0 2 Exports : 11.3 26 -90 72 18 10 Domestic use : 7.8 33 -178 100 11 18 Ending stocks : 28.0 28 -69 148 13 16 : BARLEY : Production : 0.3 1 -3 11 12 4 Exports : 12.5 6 -20 13 9 18 Domestic use : 4.4 16 -30 70 12 15 Ending stocks : 10.2 15 -53 24 19 10 : OATS : Production : 0.1 0 -2 1 4 3 Exports : 18.7 1 -1 3 5 5 Domestic use : 3.3 11 -26 36 13 16 Ending stocks : 11.0 12 -47 21 17 12 : : Thousand short tons SOYBEAN MEAL : Production : 2.3 785 -2328 1542 22 7 Exports : 7.1 511 -1750 941 24 5 Domestic use : 1.9 512 -1106 2066 21 8 Ending stocks : 27.5 68 -214 208 13 15 : : Million pounds SOYBEAN OIL : Production : 2.2 352 -1173 627 22 7 Exports : 14.4 249 -750 664 17 11 Domestic use : 1.7 238 -685 628 18 11 Ending stocks : 15.1 264 -721 366 17 12 ------------------------------------------------------------------------------- : ANIMAL PROD. 3/ : Million pounds Beef : 2.3 564 -907 1613 18 9 Pork : 2.2 371 -1265 1667 19 8 Broilers : 1.4 322 -675 496 16 11 Turkeys : 2.1 103 -328 171 14 13 : : Million dozen Eggs : 1.1 70 -120 169 16 11 : : Billion pounds Milk : 1.2 1.8 -4.9 5.2 16 11 =============================================================================== 1/ See pages 35 and 36 for record of reliability for U.S. wheat, rice, soybeans, and cotton. 2/ Final estimate for 1981/82-2009/10 is defined as the first November estimate following the marketing year. 3/ Calendar years 1983 thru 2009 for meats, eggs, and milk. Final for animal products is defined as latest annual production estimate published by NASS.
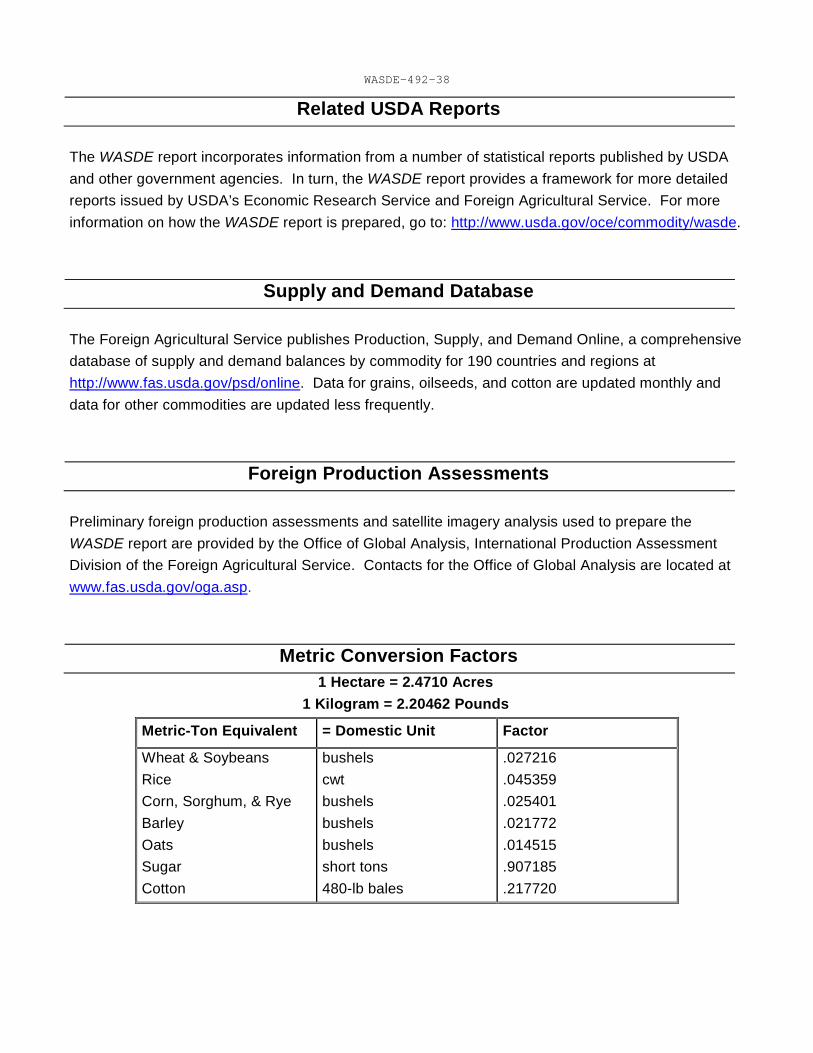
WASDE-492-38
Related USDA Reports
The WASDE report incorporates information from a number of statistical reports published by USDA and other government agencies. In turn, the WASDE report provides a framework for more detailed reports issued by USDA’s Economic Research Service and Foreign Agricultural Service. For more information on how the WASDE report is prepared, go to: http://www.usda.gov/oce/commodity/wasde.
Supply and Demand Database
The Foreign Agricultural Service publishes Production, Supply, and Demand Online, a comprehensive database of supply and demand balances by commodity for 190 countries and regions at http://www.fas.usda.gov/psd/online. Data for grains, oilseeds, and cotton are updated monthly and data for other commodities are updated less frequently.
Foreign Production Assessments
Preliminary foreign production assessments and satellite imagery analysis used to prepare the WASDE report are provided by the Office of Global Analysis, International Production Assessment Division of the Foreign Agricultural Service. Contacts for the Office of Global Analysis are located at www.fas.usda.gov/oga.asp.
Metric Conversion Factors
1 Hectare = 2.4710 Acres 1 Kilogram = 2.20462 Pounds
Metric-Ton Equivalent = Domestic Unit Factor
Wheat & Soybeans Rice Corn, Sorghum, & Rye Barley Oats Sugar Cotton
bushels cwt bushels bushels bushels short tons 480-lb bales
.027216
.045359
.025401
.021772
.014515
.907185
.217720
UNITED STATES DEPARTMENT OF AGRICULTURE WORLD AGRICULTURAL OUTLOOK BOARD WASHINGTON, D.C. 20250-3812 ___________________ OFFICIAL BUSINESS Penalty for Private Use, $300
FIRST-CLASS MAIL POSTAGE & FEES PAID
USDA PERMIT NO. G-289
World Agricultural Supply and Demand Estimates
WASDE- 492 – March 10, 2011 Electronic Subscriptions: Download the WASDE report at http://usda.mannlib.cornell.edu/. Get a free e-mail subscription to the WASDE and other USDA crop reports at http://usda.mannlib.cornell.edu. Select the “Reports by E-Mail” bar to sign up. Print Subscriptions: For print subscriptions, call the National Technical Information Service (NTIS) at 1-800-999-6779 or 703-605-6220.
.The U.S. Department of Agriculture (USDA) prohibits discrimination in all its programs and activities on the basis of race, color, national origin, age, disability, and where applicable, sex, marital status, familial status, parental status, religion, sexual orientation, genetic information, political beliefs, reprisal, or because all or a part of an individual's income is derived from any public assistance program. (Not all prohibited bases apply to all programs.) Persons with disabilities who require alternative means for communication of program information (Braille, large print, audiotape, etc.) should contact USDA's TARGET Center at (202) 720-2600 (voice and TDD). To file a complaint of discrimination write to USDA, Director, Office of Civil Rights, 1400 Independence Avenue, S.W., Washington, D.C. 20250-9410 or call (800) 795-3272 (voice) or (202) 720-6382 (TDD). USDA is an equal opportunity provider and employer.