california crop quality report - uswheat.org
TRANSCRIPT

2021 Hard Red Wheat / Hard White Wheat
California Crop Quality Report
2
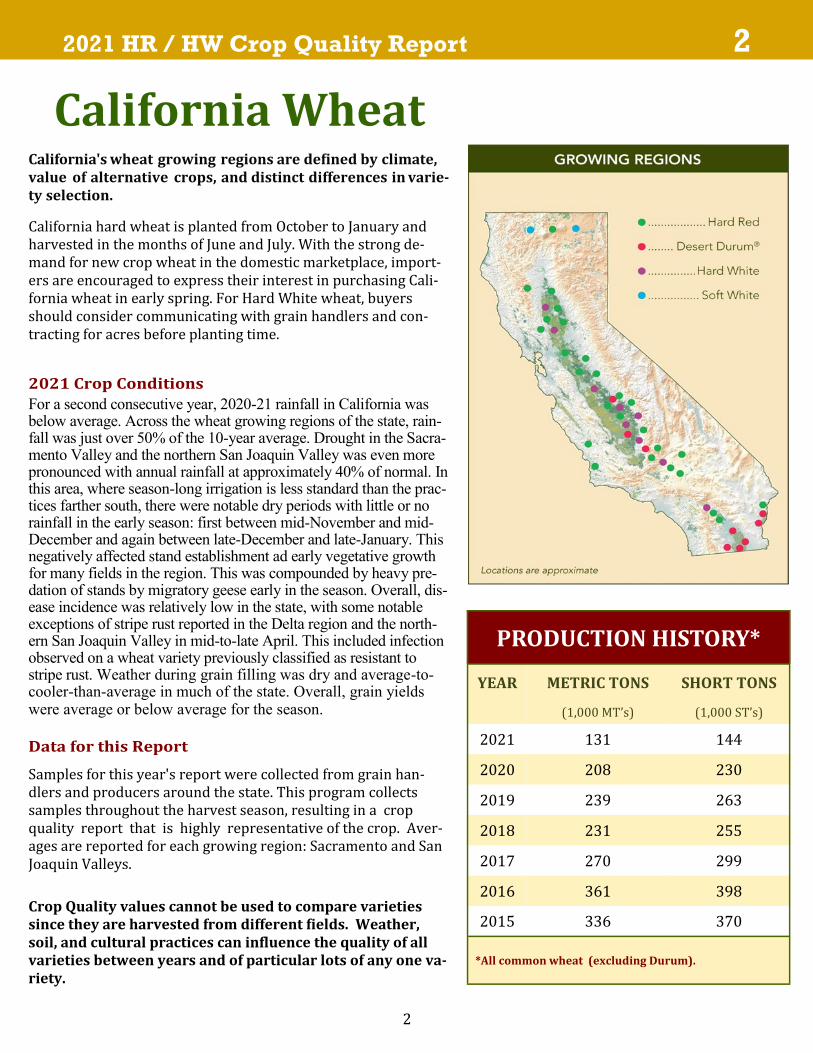
California Wheat California's wheat growing regions are defined by climate, value of alternative crops, and distinct differences in varie-ty selection.
California hard wheat is planted from October to January and harvested in the months of June and July. With the strong de-mand for new crop wheat in the domestic marketplace, import-ers are encouraged to express their interest in purchasing Cali-fornia wheat in early spring. For Hard White wheat, buyers should consider communicating with grain handlers and con-tracting for acres before planting time.
For a second consecutive year, 2020-21 rainfall in California was below average. Across the wheat growing regions of the state, rain-fall was just over 50% of the 10-year average. Drought in the Sacra-mento Valley and the northern San Joaquin Valley was even more pronounced with annual rainfall at approximately 40% of normal. In this area, where season-long irrigation is less standard than the prac-tices farther south, there were notable dry periods with little or no rainfall in the early season: first between mid-November and mid-December and again between late-December and late-January. This negatively affected stand establishment ad early vegetative growth for many fields in the region. This was compounded by heavy pre-dation of stands by migratory geese early in the season. Overall, dis-ease incidence was relatively low in the state, with some notable exceptions of stripe rust reported in the Delta region and the north-ern San Joaquin Valley in mid-to-late April. This included infection observed on a wheat variety previously classified as resistant to stripe rust. Weather during grain filling was dry and average-to-cooler-than-average in much of the state. Overall, grain yields were average or below average for the season.
Samples for this year's report were collected from grain han-dlers and producers around the state. This program collects samples throughout the harvest season, resulting in a crop quality report that is highly representative of the crop. Aver-ages are reported for each growing region: Sacramento and San Joaquin Valleys.
Crop Quality values cannot be used to compare varieties since they are harvested from different fields. Weather, soil, and cultural practices can influence the quality of all varieties between years and of particular lots of any one va-riety.
2021 HR / HW Crop Quality Report 2
PRODUCTION HISTORY*
YEAR METRIC TONS SHORT TONS
(1,000 MT’s) (1,000 ST’s)
2021 131 144
2020 208 230
2019 239 263
2018 231 255
2017 270 299
2016 361 398
2015 336 370
*All common wheat (excluding Durum).
3
2021 HR / HW Crop Quality Report 3
Varietal Descriptions
HARD RED WHEAT
Cal Rojo (HRS) is a widely adapted, high yielding variety for both the San Joaquin and Sacramento Valleys. It is mid-early maturing and receives good scores for grain, milling, and baking quality.
Summit 515 (HRS) is a variant of the variety Summit with two effective genes for stripe rust resistance added by mark-er assisted selection. Summit 515 has very high yield poten-tial in both the San Joaquin and Sacramento Valleys.
WB-9229 (HRS) is adapted to both the San Joaquin and Sac-ramento Valleys. It has medium to high protein and test weight and has excellent milling and baking properties. It is moderately resistant to Septoria and is resistant to the cur-rent races of stripe rust.
WB-Joaquin Oro (HRS) is adapted to the San Joaquin Valley and has high protein and test weight with excellent milling and baking properties, similar to the variety Joaquin. In addi-tion, WB-Joaquin Oro carries two genes for stripe rust re-sistance, one of which is effective against all current races.
SY-Sienna (HRS) is a Hard Red Spring Wheat developed by
Syngenta Seeds, Inc. It has a high yield potential, good pro-
tein and test weight. It is a semi-dwarf, plant height similar
to Redwing expressing very good straw strength, medium to
late maturity, awed, white chaff and strap head type. It has a
good general foliar disease package which includes re-
sistance reaction to current stripe rust races. SY Sienna has
performed well in Syngenta’s trials and in the Variety Test-
ing Program for several years.
AP-Octane (HRS) is AP Octane is a hard red spring wheat
bred and developed by Syngenta Participation AG. AP Octane
was selected for height, maturity, appearance, kernel color,
kernel soundness, disease reaction, and end use quality. AP
Octane is primarily adapted to Sacramento and San Joaquin
Valleys. Stripe Rust: AP Octane has shown above average
tolerance to current races of stripe rust.
WB-9699 (HRS) is a hard red spring variety adapted to the
Southern San Joaquin and Sacramento Valley with excellent
grain yield potential and stripe rust resistance. It has excel-
lent standability. It has been found to have adequate milling
and baking quality aspects and end use quality according to
wheat quality lab testing done previously.
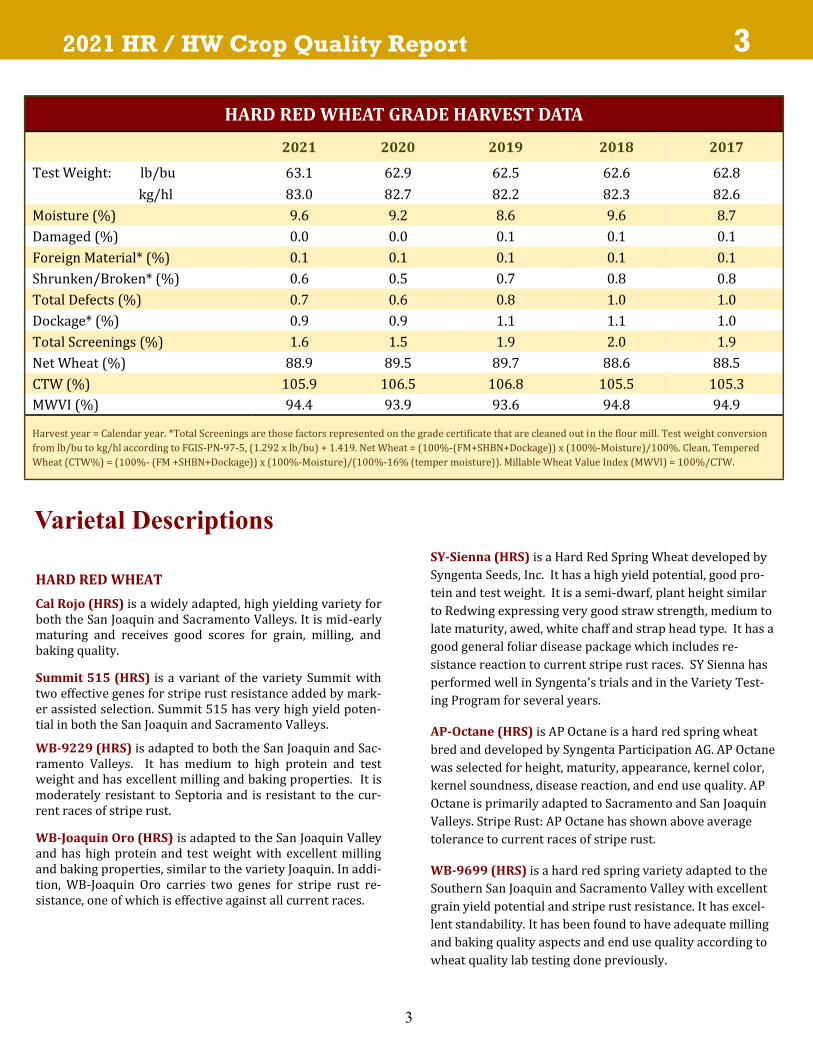
HARD RED WHEAT GRADE HARVEST DATA
2021 2020 2019 2018 2017
Test Weight: lb/bu 62.9 62.5 62.6 62.8 63.1
kg/hl 83.0 82.7 82.2 82.3 82.6
Moisture (%) 9.6 9.2 8.6 9.6 8.7
Damaged (%) 0.0 0.0 0.1 0.1 0.1
Foreign Material* (%) 0.1 0.1 0.1 0.1 0.1
Shrunken/Broken* (%) 0.6 0.5 0.7 0.8 0.8
Total Defects (%) 0.7 0.6 0.8 1.0 1.0
Dockage* (%) 0.9 0.9 1.1 1.1 1.0
Total Screenings (%) 1.6 1.5 1.9 2.0 1.9
Net Wheat (%) 88.9 89.5 89.7 88.6 88.5
CTW (%) 105.9 106.5 106.8 105.5 105.3
MWVI (%) 94.4 93.9 93.6 94.8 94.9
Harvest year = Calendar year. *Total Screenings are those factors represented on the grade certificate that are cleaned out in the flour mill. Test weight conversion
from lb/bu to kg/hl according to FGIS-PN-97-5, (1.292 x lb/bu) + 1.419. Net Wheat = (100%-(FM+SHBN+Dockage)) x (100%-Moisture)/100%. Clean, Tempered
Wheat (CTW%) = (100%- (FM +SHBN+Dockage)) x (100%-Moisture)/(100%-16% (temper moisture)). Millable Wheat Value Index (MWVI) = 100%/CTW.

4
2021 HR / HW Crop Quality Report 4
KERNEL QUALITY DATA
PROTEIN (12% MOISTURE) STATE DISTRIBUTION
TEST WEIGHT (Lbs/bu) STATE DISTRIBUTION
FLOUR QUALITY DATA
1000 Kernel
Protein Ash Falling SKCS Kernel Size Distribution Micro
State and Region (12% moisture) Moisture Number Test Weight Hardness Weight Large Medium Small Sed
% % % SEC lbs/bu Kg/hL Score g % % % CC
HARD RED WINTER WHEAT
Sacramento Valley 11.7 1.48 8.8 329 63.6 83.6 70.1 41.4 85 15 0 52
San Joaquin Valley 12.0 1.49 7.5 358 64.5 84.8 66.6 44.5 91 9 0 46
State Avg. 2021 11.8 1.48 8.2 343 64.1 84.2 68.4 43.0 88 12 0 49
HARD WHITE WHEAT
Sacramento Valley 12.8 1.45 8.6 364 61.5 80.8 81.7 35.7 61 39 0 65
State Avg. 2021 12.8 1.45 8.6 364 61.5 80.8 81.7 35.7 61 39 0 65
Lab Mill Protein Ash Wet Falling
State and Region Yield (14% moisture) Gluten Gluten SRC Water/ 5% Lactic Acid/ Number
% % % Index % GPI 50% Sucrose 5% NA₂CO₃ SEC
HARD RED WINTER WHEAT
Sacramento Valley 67.5 10.6 0.46 97.7 26.5 0.72 65/105 136/83 366
San Joaquin Valley 67.9 11.2 0.45 96.1 30.1 0.73 65/103 134/80 410
State Avg. 2021 67.7 10.9 0.45 96.9 28.3 0.72 65/104 135/82 388
HARD WHITE WHEAT
Sacramento Valley 66.9 11.5 0.50 98.7 32.0 0.66 66/111 133/89 375
State Avg. 2021 66.9 11.5 0.50 98.7 32.0 0.66 66/111 133/89 375

5
2021 HR / HW Crop Quality Report 5
PHYSICAL DOUGH QUALITY
HARD RED WHEAT
2021 AVERAGE FARINOGRAM
HARD WHITE WHEAT
2021 AVERAGE ALVEOGRAM
Farinograph Alveograph
Development W
State and Region Absorption Time Stability MTI P L P/L Joules
% MIN MIN B.U. MM MM Ratio X 10-4
HARD RED WINTER WHEAT
Sacramento Valley 59.2 5.8 13.0 23 93 114 0.82 343
San Joaquin Valley 61.4 6.6 12.9 24 99 115 0.86 358
State Avg. 2021 60.3 6.2 12.9 23 96 114 0.84 350
HARD WHITE WHEAT
Sacramento Valley 62.1 5.7 11.5 24 85 169 0.50 400
State Avg. 2021 62.1 5.7 11.5 24 85 169 0.50 400

6
2021 HR / HW Crop Quality Report 6
Baking Loaf Dough Crumb Crumb Crumb Bread
State and Region Absorption Volume Handling Color Grain Texture Symmetry
% CC (1-10) (1-10) (1-10) (1-10) (1-10)
HARD RED WINTER WHEAT
Sacramento Valley 62.4 920 6.6 7.6 6.5 6.7 6.7
San Joaquin Valley 63.5 924 6.5 8.2 6.0 6.3 6.8
State Avg. 2021 63.0 922 6.6 7.9 6.3 6.5 6.8
HARD WHITE WHEAT
Sacramento Valley 64.5 875 6.0 4.0 5.0 5.0 5.0
State Avg. 2021 64.5 875 6.0 4.0 5.0 5.0 5.0
BAKING QUALITY DATA
BREAD PHOTOS
AP-

7
2021 HR / HW Crop Quality Report 7
2021 HARD RED VARIETY SPECIFIC INFORMATION
AP-Octane Cal Rojo
Joaquin Oro
Summit 515
WHEAT Sacramento
Valley
Sacramento Valley
San Joaquin Valley
Sacramento Valley
San Joaquin Valley
Protein (12% MB) 11.0 12.0 12.4 11.6 12.4 Ash (12% MB) 1.36 1.38 1.54 1.43 1.45 Moisture (%) 9.0 9.0 6.9 9.1 9.0 Falling Number (sec) 300 299 376 282 321 Micro Sedimentation (cc) 43 59 46 47 41
Test Weight lb/bu 63.9 63.0 65.3 64.5 63.9 kg/hl 83.9 82.9 85.8 84.7 84.0
SKCS Hardness Score 65 62 65 69 69 1000 Kernel Weight (g) 41.5 42.5 45.5 44.2 42.8
Kernel Size Distribution Large/Medium/Small 88/12/0 88/12/0 94/6/0 92/8/0 88/12/0
FLOUR Lab Mill Yield (%) 68.0 68.7 68.3 67.4 67.8 Protein (14% MB) 9.8 10.7 11.5 10.3 11.3 Ash (14% MB) 0.44 0.45 0.41 0.41 0.46 Gluten Index 99 99 96 96 95 Wet Gluten (14% MB) 23 25 32 27 30 SRC*: GPI 0.70 0.76 0.71 0.69 0.73 Water/ 50% Sucrose 64/104 60/100 67/103 65/104 65/105 5%LacticAcid/5%NA₂CO₃ 129/80 135/78 135/78 130/84 136/81
ALVEOGRAPH P (mm) 89 72 108 91 92 L (mm) 104 126 114 119 114 P/L ratio 0.86 0.57 0.95 0.76 0.81 W (10-4 Joules) 324 296 386 325 316
MIXOGRAPH Absorption (%) 55.9 56.4 64.5 60.4 61.0 Peak Time (min) 4.1 4.1 3.5 3.7 3.5 Work (%Torque*min) 172.9 172.7 144.1 144.2 147.8 Peak Height (mu) 50 53 55 47 52 M.T. Score (1-8) 5 4 4 3 3
FARINOGRAPH Absorption (%) 55.9 56.4 64.5 60.4 61.0 Peak Time (min) 5.0 6.3 6.3 4.3 5.8 Stability (min) 18.5 12.4 14.0 8.4 9.8 M.T.I. 9.0 23.5 28.0 29.0 31.5
BAKING RESULTS Baking Absorption (%) 60.0 60.5 65.5 62.7 64.3 Bread Volume (cc) 875 930 925 910 900 Crumb Grain & Texture 7.0 8.0 5.5 5.0 5.0 Wheat samples were collected by handlers. Wheat and Flour Protein: Leco Combustion Nitrogen Analyzer Model TruSpec, Lab mill yield: Brabender Quadromat Sr. Mill, modified in 1997; Bread Volume: AACCI Method 10-10B; Test weight conversion from lb/bu to kg/hl according to FGIS PN-97-5, {(1.292 x (lb/bu) + 1.419)}.
8
2021 HR / HW Crop Quality Report 8
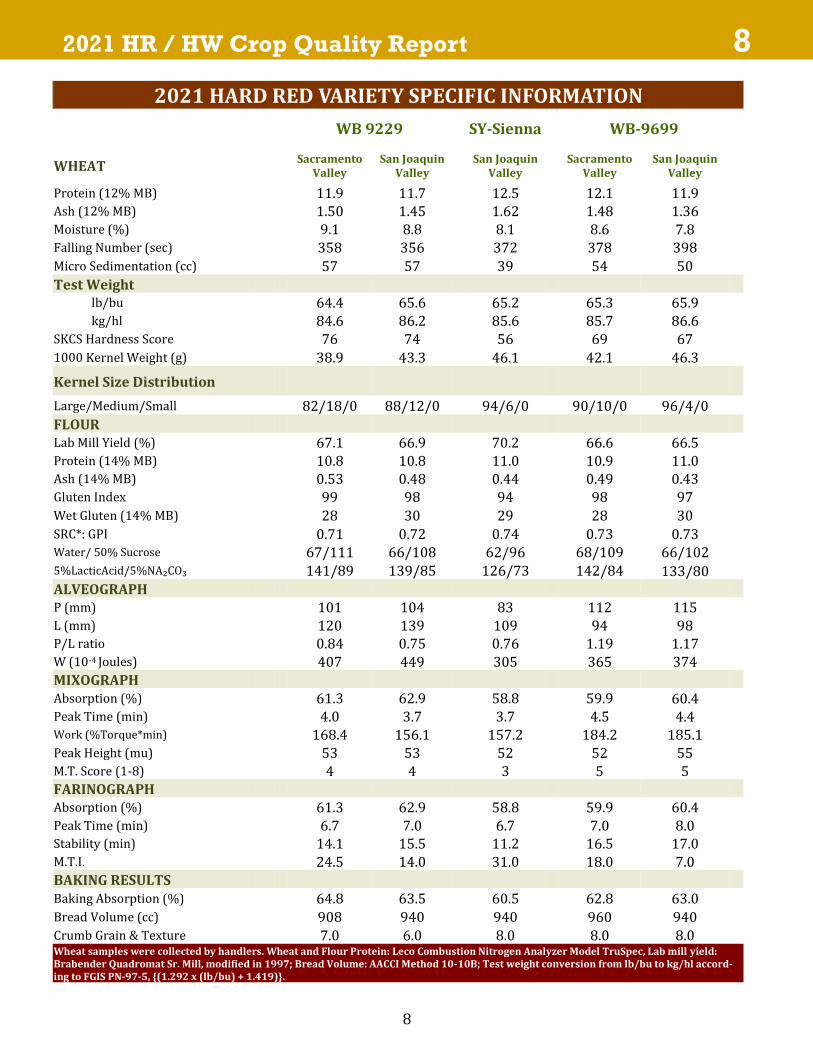
2021 HARD RED VARIETY SPECIFIC INFORMATION
WB 9229
SY-Sienna WB-9699
WHEAT Sacramento
Valley San Joaquin
Valley San Joaquin
Valley
Sacramento Valley
San Joaquin Valley
Protein (12% MB) 11.9 11.7 12.5 12.1 11.9 Ash (12% MB) 1.50 1.45 1.62 1.48 1.36 Moisture (%) 9.1 8.8 8.1 8.6 7.8 Falling Number (sec) 358 356 372 378 398 Micro Sedimentation (cc) 57 57 39 54 50
Test Weight lb/bu 64.4 65.6 65.2 65.3 65.9 kg/hl 84.6 86.2 85.6 85.7 86.6
SKCS Hardness Score 76 74 56 69 67 1000 Kernel Weight (g) 38.9 43.3 46.1 42.1 46.3
Kernel Size Distribution
Large/Medium/Small 82/18/0 88/12/0 94/6/0 90/10/0 96/4/0
FLOUR Lab Mill Yield (%) 67.1 66.9 70.2 66.6 66.5 Protein (14% MB) 10.8 10.8 11.0 10.9 11.0 Ash (14% MB) 0.53 0.48 0.44 0.49 0.43 Gluten Index 99 98 94 98 97 Wet Gluten (14% MB) 28 30 29 28 30 SRC*: GPI 0.71 0.72 0.74 0.73 0.73 Water/ 50% Sucrose 67/111 66/108 62/96 68/109 66/102 5%LacticAcid/5%NA₂CO₃ 141/89 139/85 126/73 142/84 133/80
ALVEOGRAPH P (mm) 101 104 83 112 115 L (mm) 120 139 109 94 98 P/L ratio 0.84 0.75 0.76 1.19 1.17 W (10-4 Joules) 407 449 305 365 374 MIXOGRAPH Absorption (%) 61.3 62.9 58.8 59.9 60.4 Peak Time (min) 4.0 3.7 3.7 4.5 4.4 Work (%Torque*min) 168.4 156.1 157.2 184.2 185.1 Peak Height (mu) 53 53 52 52 55 M.T. Score (1-8) 4 4 3 5 5 FARINOGRAPH Absorption (%) 61.3 62.9 58.8 59.9 60.4 Peak Time (min) 6.7 7.0 6.7 7.0 8.0 Stability (min) 14.1 15.5 11.2 16.5 17.0 M.T.I. 24.5 14.0 31.0 18.0 7.0 BAKING RESULTS Baking Absorption (%) 64.8 63.5 60.5 62.8 63.0 Bread Volume (cc) 908 940 940 960 940 Crumb Grain & Texture 7.0 6.0 8.0 8.0 8.0 Wheat samples were collected by handlers. Wheat and Flour Protein: Leco Combustion Nitrogen Analyzer Model TruSpec, Lab mill yield: Brabender Quadromat Sr. Mill, modified in 1997; Bread Volume: AACCI Method 10-10B; Test weight conversion from lb/bu to kg/hl accord-ing to FGIS PN-97-5, {(1.292 x (lb/bu) + 1.419)}.

9
2021 HR / HW Crop Quality Report 9
2021 HARD WHITE VARIETY SPECIFIC INFORMATION
Patwin 515 HP
WHEAT Sacramento Valley Protein (12% MB) 12.8
Ash (14% MB) 1.45
Moisture (%) 8.7
Falling Number (sec) 364
Micro Sedimentation (cc) 65
Test Weight
lb/bu 62.1
kg/hl 81.7
SKCS Hardness Score 81
1000 Kernel Weight (g) 33.1
Kernel Size Distribution Large/Medium/Small 61/39/0 FLOUR
Lab Mill Yield (%) 66.9
Protein (14% MB) 11.5
Ash (14% MB) 0.50
Gluten Index 99
Wet Gluten (14% MB) 32
SRC*: GPI 0.66
Water/ 50% Sucrose 66/111
5% Lactic Acid/5% NA₂CO₃ 133/89
ALVEOGRAPH
P (mm) 85
L (mm) 169
P/L ratio 0.50
W (10-4 Joules) 400
MIXOGRAPH
Absorption (%) 62.1
Peak Time (min) 3.1 Work (% Torque*min) 132.1
Peak Height (mu) 56
M.T. Score (1-8) 3
FARINOGRAPH
Absorption (%) 62.1
Peak Time (min) 5.7
Stability (min) 11.5
M.T.I. 24.0
BAKING RESULTS
Baking Absorption (%) 64.5
Bread Volume (cc) 875
Crumb Grain & Texture 5 Wheat samples were collected by handlers. Wheat and Flour Protein: Leco Combustion Nitrogen Analyz-er Model TruSpec, Lab mill yield: Brabender Quadromat Sr. Mill, modified in 1997; Bread Volume: AACCI Method 10-10B; Test weight conversion from lb/bu to kg/hl according to FGIS PN-97-5, {(1.292 x (lb/bu) + 1.419)}.
HARD WHITE WHEAT
Patwin 515 HP (HWW) is a Hard White Spring wheat variety created by the introduction of the high grain protein content gene into Patwin-515. Patwin-515HP has similar height and heading as Patwin-515 and Blanca Grande-515, slightly bet-ter yield, and significantly higher grain protein content. Patwin-515HP has outstanding breadmak-ing quality and is immune to stripe rust and tolerant to BYDV and septo-ria tritici blotch. It is the recom-mended for irrigated fields in the Sacramento, San Joaquin and Impe-rial Valleys.
HP
10
2021 HR / HW Crop Quality Report 10
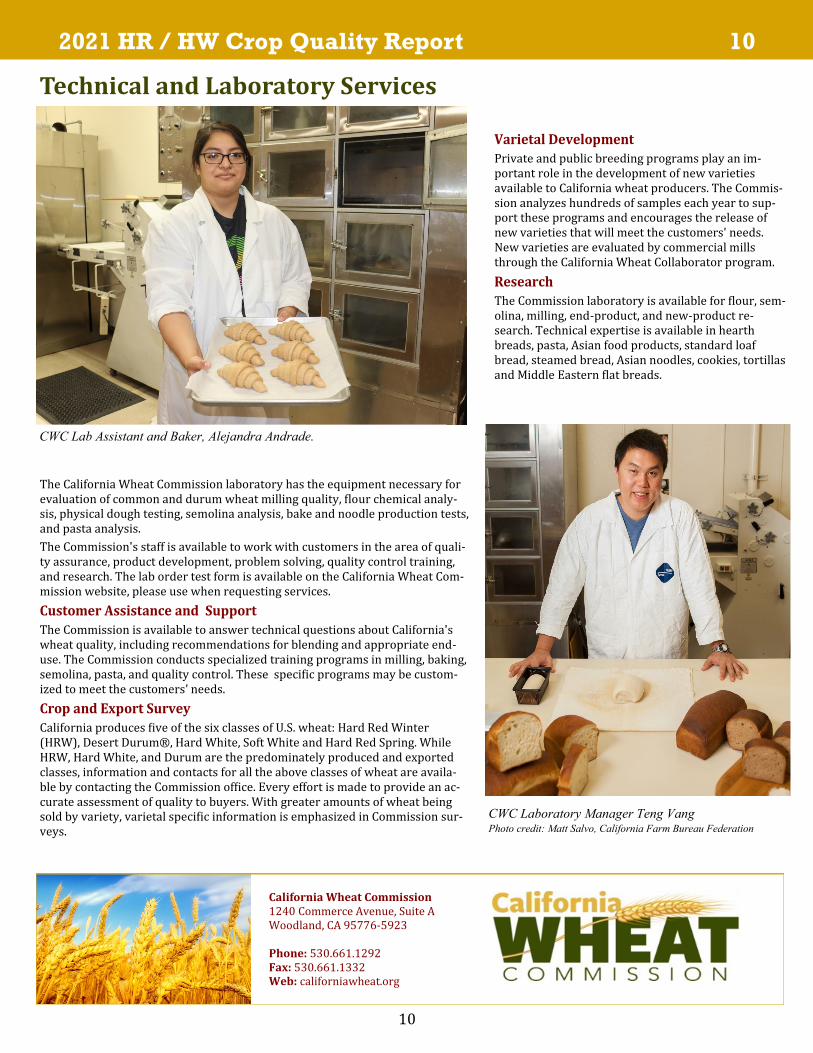
Technical and Laboratory Services
CWC Lab Assistant and Baker, Alejandra Andrade.
Private and public breeding programs play an im-portant role in the development of new varieties available to California wheat producers. The Commis-sion analyzes hundreds of samples each year to sup-port these programs and encourages the release of new varieties that will meet the customers' needs. New varieties are evaluated by commercial mills through the California Wheat Collaborator program.
The Commission laboratory is available for flour, sem-olina, milling, end-product, and new-product re-search. Technical expertise is available in hearth breads, pasta, Asian food products, standard loaf bread, steamed bread, Asian noodles, cookies, tortillas and Middle Eastern flat breads.
The California Wheat Commission laboratory has the equipment necessary for evaluation of common and durum wheat milling quality, flour chemical analy-sis, physical dough testing, semolina analysis, bake and noodle production tests, and pasta analysis.
The Commission's staff is available to work with customers in the area of quali-ty assurance, product development, problem solving, quality control training, and research. The lab order test form is available on the California Wheat Com-mission website, please use when requesting services.
The Commission is available to answer technical questions about California's wheat quality, including recommendations for blending and appropriate end-use. The Commission conducts specialized training programs in milling, baking, semolina, pasta, and quality control. These specific programs may be custom-ized to meet the customers’ needs.
California produces five of the six classes of U.S. wheat: Hard Red Winter (HRW), Desert Durum®, Hard White, Soft White and Hard Red Spring. While HRW, Hard White, and Durum are the predominately produced and exported classes, information and contacts for all the above classes of wheat are availa-ble by contacting the Commission office. Every effort is made to provide an ac-curate assessment of quality to buyers. With greater amounts of wheat being sold by variety, varietal specific information is emphasized in Commission sur-veys.
CWC Laboratory Manager Teng Vang Photo credit: Matt Salvo, California Farm Bureau Federation
California Wheat Commission 1240 Commerce Avenue, Suite A Woodland, CA 95776-5923 Phone: 530.661.1292 Fax: 530.661.1332 Web: californiawheat.org