critical thinking, data analysis and science i ......critical thinking, data analysis and science i....
TRANSCRIPT
CRITICAL THINKING, DATA ANALYSIS AND SCIENCE I. Incorporating Science into the ESOL Classroom Lenore Balliro, Plum Cove Consulting, Gloucester MA Overview This section of the workshop will focus on the practices of inquiry and investigation, two processes that promote language learning and concept development simultaneously. The activity reflects many of the guiding principles and all of the habits of mind described in the Massachusetts Adult Basic Education Science Curriculum Framework, Life Science Strand: curiosity, open mindedness, creativity, wonderment, and confidence. OBJECTIVES After attending this part of the workshop participants will be able to
• explain the similarities between effective science teaching and effective language learning;
• describe an inquiry process activity designed to introduce science concepts and build language structures and vocabulary, and
• brainstorm ideas for adapting the activity, and extension activities, for their own classroom.
RATIONALE Why do science in ESOL classes?
• Learning language around content—providing a context—helps students learn and retain new vocabulary and concepts by building on what they know. Science can provide that content. Doing science is appropriate for multi-level classes, allowing many ways in to learning tasks.
• Doing science is often experiential and hands-on. “While working with,
manipulating, and thinking about things, a student can often understand concepts even without the vocabulary to express the learning.”
Science for English Language Learners, Ann K. Fathman and David T. Crowther, Editors. National Science Teachers Association Press, 2006.
• Science touches on many aspects of ESOL students’ lives: health, nutrition, environmental issues, understanding current events, making informed choices as citizens, workers, and parents.
• Prepare ABE/ESOL learners for future careers in healthcare and STEM. Many
ESOL students will transition to college, so building the language, understanding and curiosity about science early on will create a foundation from which to build.
CURRICULUM Where can you incorporate science into your ESOL curriculum?
• Themed Units on § Health and wellness § Community concerns (pollution, lead paint, etc.) § Food/nutrition Reading, writing, grammar, and structure practice could be incorporated into each unit.
METHODS How can you integrate science in an ESOL curriculum?
§ Use experiential, hands on, multi-sensory approaches. Effective approaches to teaching language are similar to effective approaches to teaching science: they are often experiential, hands-on, multi-sensory, and allow for students to participate according to their levels.
§ Use research. (Web, text sources) to follow up with hands-on activities and to answer student generated questions.
§ Use science museum resources. (Go to museums; invite museum educators into you classrooms.)
§ Consult the resources attached to the ABE Life Science Framework for a variety of practical tools and information.
LEMON ACTIVITY Materials
• A dozen or so fresh lemons • Several small boxes of lemon candies • Markers and colored pencils • Self-adhesive newsprint and markers • Cards and language strips with question starters on them: (who, what, where,
what, what if, how, how come, where, when) Purpose The purpose of this activity is to engage us in an inquiry process designed to introduce science concepts and build language structures and vocabulary for students. Keeping in mind that the habit of mind is curiosity, and the approach is INQUIRY: asking questions to generate language learning and to begin thinking about science content.
Overview/Background to Activity I have found that when students are curious and want their questions answered, they will work harder to use their new language for a specific purpose and will become actively involved to investigate the answers to their questions. They are also more likely to listen with a purpose to better understand explanations given by the instructor or other students.
• In advance, place one lemon and a box of candy on the table at each participant’s place
• Ask students o What did you think when you saw the lemon and lemon candies on the
table? o Did it make you curious? Did you have questions about them?
• Explain: I placed the objects there so you would ask questions. Step by Step Note: Depending on how much students have learned regarding verb tenses, teachers may want to review tenses or ask them to keep the questions in the present tense; later you can change each question to the past tense.
• Explain to students: This activity will help you practice asking questions in English.
• Review Questions words and have them posted around the room: Who, What, When, Where, How, “How come” (slang), Why. If same language class, compare in students’ first language.
• Review punctuation of a question. (Question mark at the end, not beginning of question.)
ASKING THE QUESTIONS
1. Break students up into small groups or pairs depending on size of group. 2. Ask each group to choose a recorder. 3. Give each group sheets of newsprint and marker. 4. Instruct each group to ask at least ten questions, but as many questions as they
can about the lemon. Explain that it is fine if they make mistakes because they are going to practice correcting the grammar together anyway.
5. Model a couple of questions together: What color is it? What does it taste like? 6. Give participants 20 minutes to generate questions. (Modify this amount of time
depending on the level of your students. 7. Recorder writes questions on newsprint. 8. When everyone is done, hang one sheet at a time up on the board/front of room. 9. Allow students to make corrections on the questions according to the
grammar/structure points you want to focus on. If students miss an error, simply point to it and see of they can self correct.
10. Make corrections in another color marker. Let students copy the questions into their notebooks, if you have time.
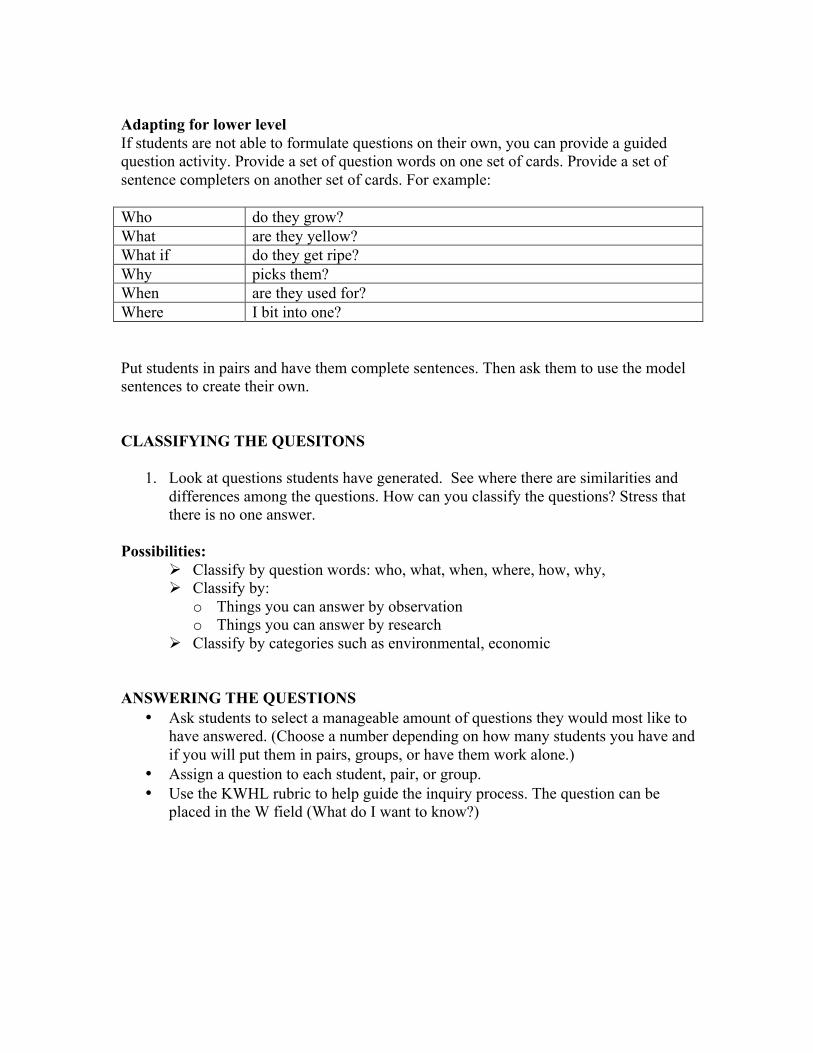
Adapting for lower level If students are not able to formulate questions on their own, you can provide a guided question activity. Provide a set of question words on one set of cards. Provide a set of sentence completers on another set of cards. For example: Who do they grow? What are they yellow? What if do they get ripe? Why picks them? When are they used for? Where I bit into one? Put students in pairs and have them complete sentences. Then ask them to use the model sentences to create their own. CLASSIFYING THE QUESITONS
1. Look at questions students have generated. See where there are similarities and differences among the questions. How can you classify the questions? Stress that there is no one answer.
Possibilities:
Ø Classify by question words: who, what, when, where, how, why, Ø Classify by:
o Things you can answer by observation o Things you can answer by research
Ø Classify by categories such as environmental, economic
ANSWERING THE QUESTIONS
• Ask students to select a manageable amount of questions they would most like to have answered. (Choose a number depending on how many students you have and if you will put them in pairs, groups, or have them work alone.)
• Assign a question to each student, pair, or group. • Use the KWHL rubric to help guide the inquiry process. The question can be
placed in the W field (What do I want to know?)
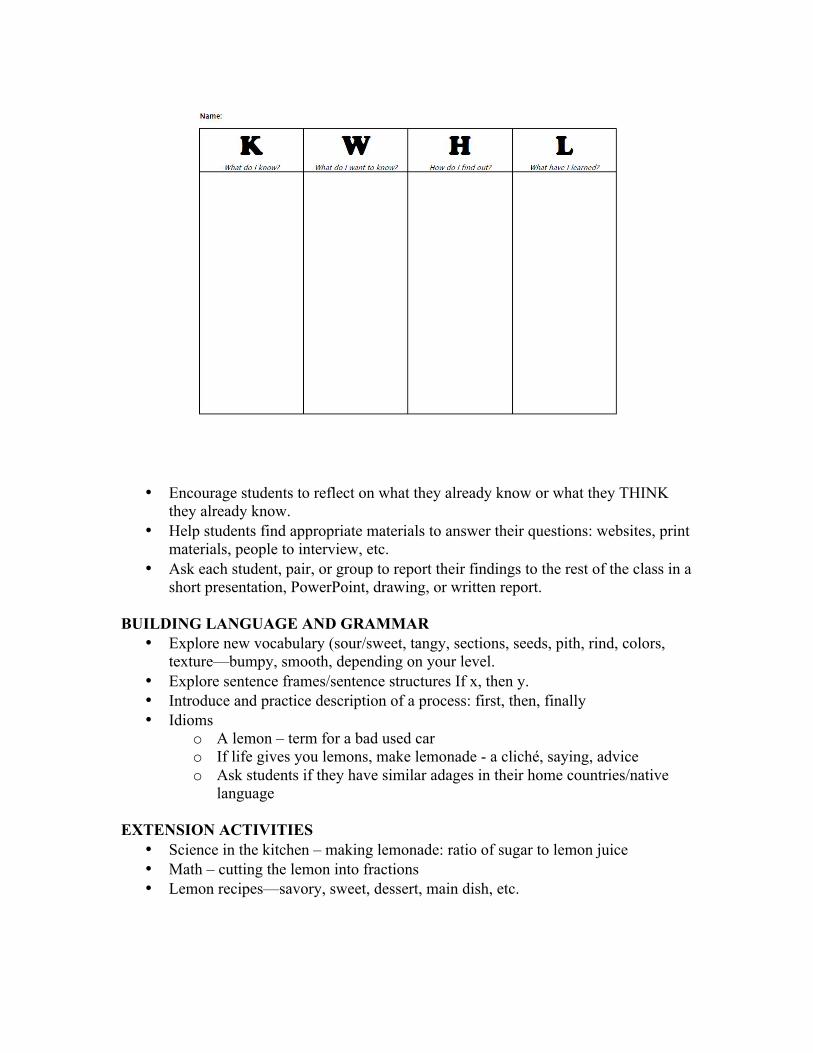
• Encourage students to reflect on what they already know or what they THINK they already know.
• Help students find appropriate materials to answer their questions: websites, print materials, people to interview, etc.
• Ask each student, pair, or group to report their findings to the rest of the class in a short presentation, PowerPoint, drawing, or written report.
BUILDING LANGUAGE AND GRAMMAR
• Explore new vocabulary (sour/sweet, tangy, sections, seeds, pith, rind, colors, texture—bumpy, smooth, depending on your level.
• Explore sentence frames/sentence structures If x, then y. • Introduce and practice description of a process: first, then, finally • Idioms
o A lemon – term for a bad used car o If life gives you lemons, make lemonade - a cliché, saying, advice o Ask students if they have similar adages in their home countries/native
language EXTENSION ACTIVITIES
• Science in the kitchen – making lemonade: ratio of sugar to lemon juice • Math – cutting the lemon into fractions • Lemon recipes—savory, sweet, dessert, main dish, etc.
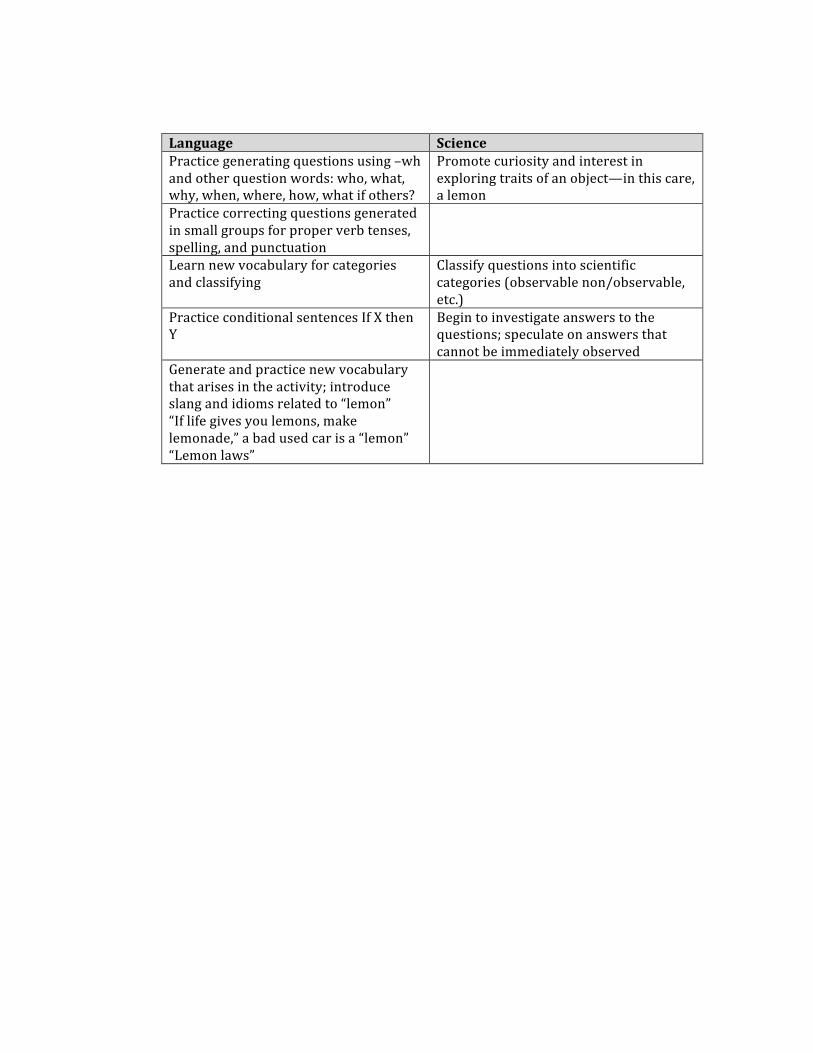
Language Science Practice generating questions using –wh and other question words: who, what, why, when, where, how, what if others?
Promote curiosity and interest in exploring traits of an object—in this care, a lemon
Practice correcting questions generated in small groups for proper verb tenses, spelling, and punctuation
Learn new vocabulary for categories and classifying
Classify questions into scientific categories (observable non/observable, etc.)
Practice conditional sentences If X then Y
Begin to investigate answers to the questions; speculate on answers that cannot be immediately observed
Generate and practice new vocabulary that arises in the activity; introduce slang and idioms related to “lemon” “If life gives you lemons, make lemonade,” a bad used car is a “lemon” “Lemon laws”
II. The Rice Project: One Community, One Grain of Rice, One Person Understanding Statistics, Data Analysis, Measurement, Fractions, and Ratio and Proportion Using Data and Rice Aliza Ansell, Holyoke Adult Learning Center Project Overview and Summary:
We live in a data driven world which regularly impacts our lives. Yet our adult education students often lack the fundamental skills to read, interpret, form opinions about, and reach conclusions based on the data represented in graphs, pie charts, and statistical information. The goal of this lesson is to give participants the opportunity to connect with data about their community in a unique and tangible way—to make the intangible tangible. The Rice Project is intended to engage students in hands-on activities to create models of community data using rice. Student will explore and engage in “critical thinking and analysis” after measuring, touching, and creating representational models from government data. This lesson will unlock the wonder and meaning behind numbers to help students build the critical thinking and math skills necessary to make connections to information in a personal and meaningful way. By harvesting and accessing local population data, students will have the opportunity to explore questions such as: How do shifting ethnicities impact a community? Why do demographics shift over time and what are the implications of those shifts? How, in turn, does this affect ecological systems, governance and municipal systems such as schools, water, public utilities, pollution control, health and wellness services, other public infrastructures, governing bodies, and the overall structure and make-up of a community? Additionally, these techniques are transferable. They can be used to represent and analyze data from any field of study, from history to biology to math, and so on. In this lesson students will learn and practice data representation and data analysis skills. Through working with the lesson data, by creating bar graphs and charts, using fractions, measurement, and ratio and proportion related to the data, students will build the foundational and mathematical skills that are the underpinnings of data analysis.
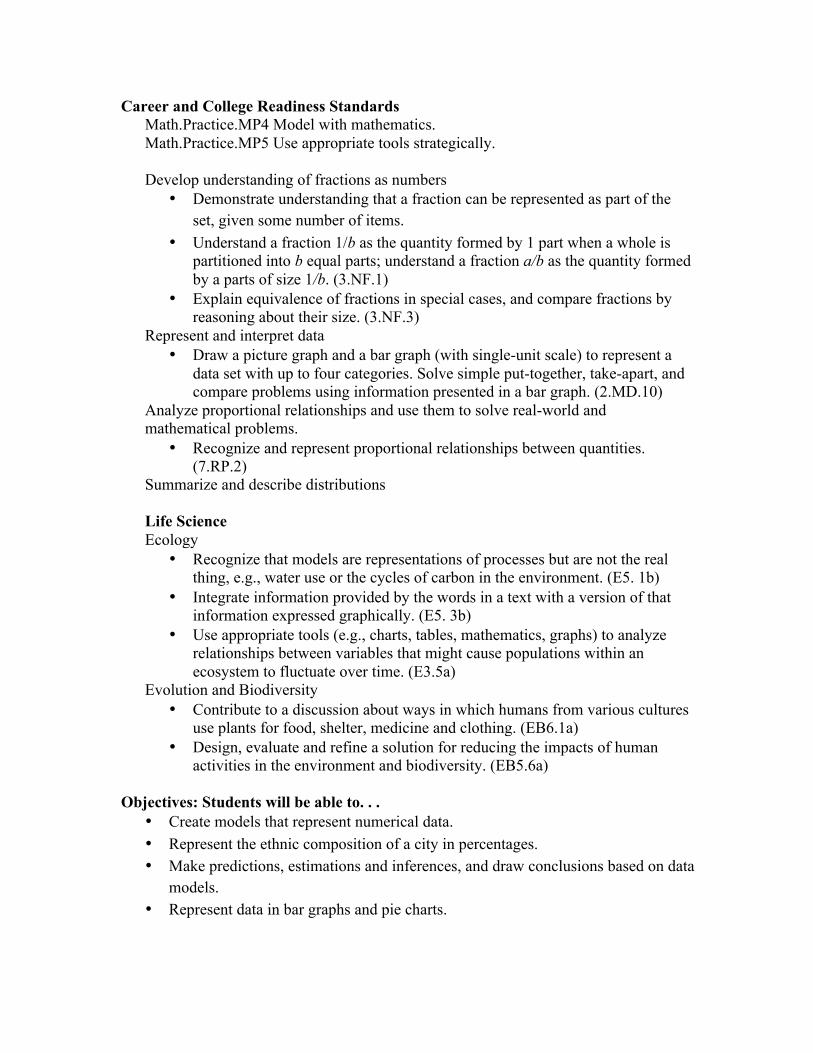
Career and College Readiness Standards Math.Practice.MP4 Model with mathematics. Math.Practice.MP5 Use appropriate tools strategically. Develop understanding of fractions as numbers
• Demonstrate understanding that a fraction can be represented as part of the set, given some number of items.
• Understand a fraction 1/b as the quantity formed by 1 part when a whole is partitioned into b equal parts; understand a fraction a/b as the quantity formed by a parts of size 1/b. (3.NF.1)
• Explain equivalence of fractions in special cases, and compare fractions by reasoning about their size. (3.NF.3)
Represent and interpret data • Draw a picture graph and a bar graph (with single-unit scale) to represent a
data set with up to four categories. Solve simple put-together, take-apart, and compare problems using information presented in a bar graph. (2.MD.10)
Analyze proportional relationships and use them to solve real-world and mathematical problems.
• Recognize and represent proportional relationships between quantities. (7.RP.2)
Summarize and describe distributions Life Science Ecology
• Recognize that models are representations of processes but are not the real thing, e.g., water use or the cycles of carbon in the environment. (E5. 1b)
• Integrate information provided by the words in a text with a version of that information expressed graphically. (E5. 3b)
• Use appropriate tools (e.g., charts, tables, mathematics, graphs) to analyze relationships between variables that might cause populations within an ecosystem to fluctuate over time. (E3.5a)
Evolution and Biodiversity • Contribute to a discussion about ways in which humans from various cultures
use plants for food, shelter, medicine and clothing. (EB6.1a) • Design, evaluate and refine a solution for reducing the impacts of human
activities in the environment and biodiversity. (EB5.6a)
Objectives: Students will be able to. . . • Create models that represent numerical data. • Represent the ethnic composition of a city in percentages. • Make predictions, estimations and inferences, and draw conclusions based on data
models. • Represent data in bar graphs and pie charts.
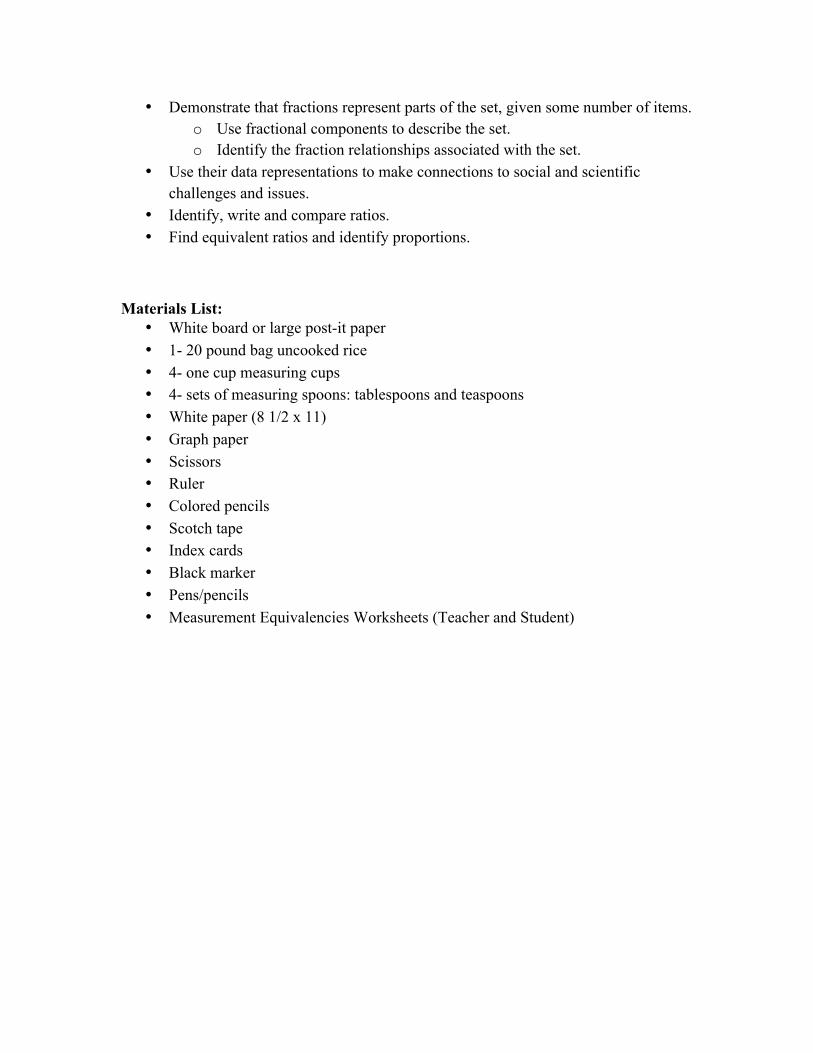
• Demonstrate that fractions represent parts of the set, given some number of items. o Use fractional components to describe the set. o Identify the fraction relationships associated with the set.
• Use their data representations to make connections to social and scientific challenges and issues.
• Identify, write and compare ratios. • Find equivalent ratios and identify proportions.
Materials List:
• White board or large post-it paper • 1- 20 pound bag uncooked rice • 4- one cup measuring cups • 4- sets of measuring spoons: tablespoons and teaspoons • White paper (8 1/2 x 11) • Graph paper • Scissors • Ruler • Colored pencils • Scotch tape • Index cards • Black marker • Pens/pencils • Measurement Equivalencies Worksheets (Teacher and Student)
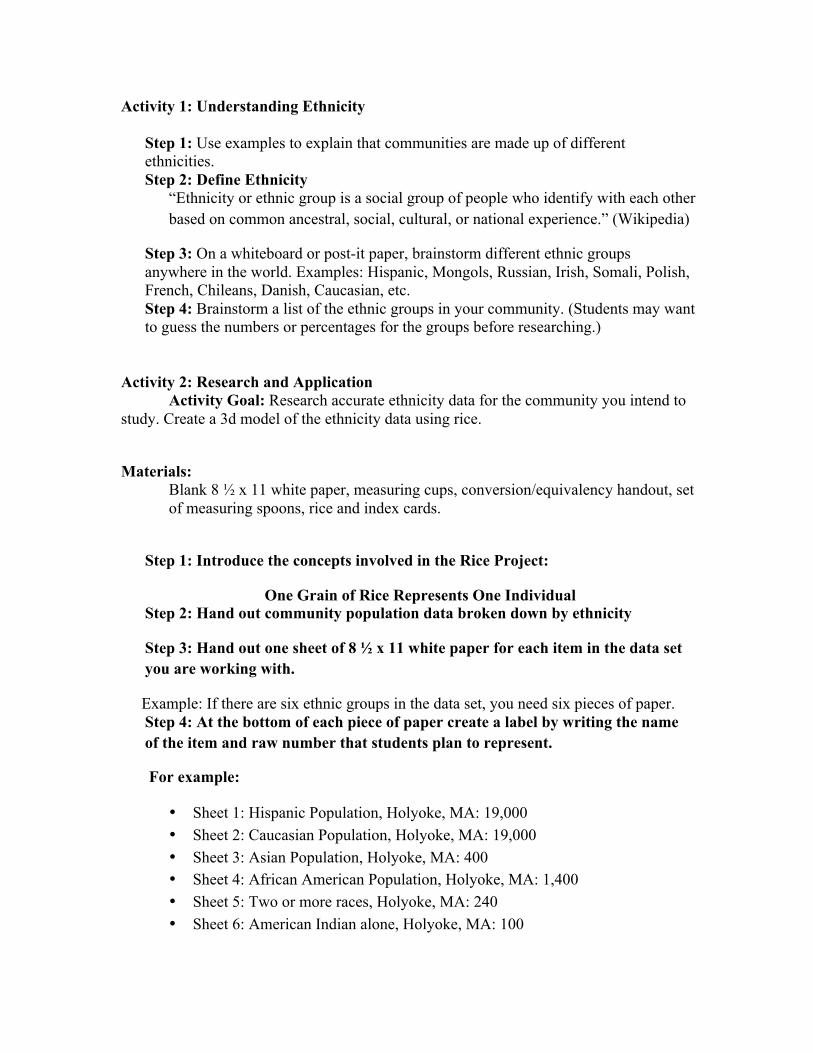
Activity 1: Understanding Ethnicity Step 1: Use examples to explain that communities are made up of different ethnicities. Step 2: Define Ethnicity
“Ethnicity or ethnic group is a social group of people who identify with each other based on common ancestral, social, cultural, or national experience.” (Wikipedia)
Step 3: On a whiteboard or post-it paper, brainstorm different ethnic groups anywhere in the world. Examples: Hispanic, Mongols, Russian, Irish, Somali, Polish, French, Chileans, Danish, Caucasian, etc. Step 4: Brainstorm a list of the ethnic groups in your community. (Students may want to guess the numbers or percentages for the groups before researching.)
Activity 2: Research and Application
Activity Goal: Research accurate ethnicity data for the community you intend to study. Create a 3d model of the ethnicity data using rice.
Materials:
Blank 8 ½ x 11 white paper, measuring cups, conversion/equivalency handout, set of measuring spoons, rice and index cards.
Step 1: Introduce the concepts involved in the Rice Project:
One Grain of Rice Represents One Individual Step 2: Hand out community population data broken down by ethnicity
Step 3: Hand out one sheet of 8 ½ x 11 white paper for each item in the data set you are working with.
Example: If there are six ethnic groups in the data set, you need six pieces of paper. Step 4: At the bottom of each piece of paper create a label by writing the name of the item and raw number that students plan to represent.
For example:
• Sheet 1: Hispanic Population, Holyoke, MA: 19,000 • Sheet 2: Caucasian Population, Holyoke, MA: 19,000 • Sheet 3: Asian Population, Holyoke, MA: 400 • Sheet 4: African American Population, Holyoke, MA: 1,400 • Sheet 5: Two or more races, Holyoke, MA: 240 • Sheet 6: American Indian alone, Holyoke, MA: 100
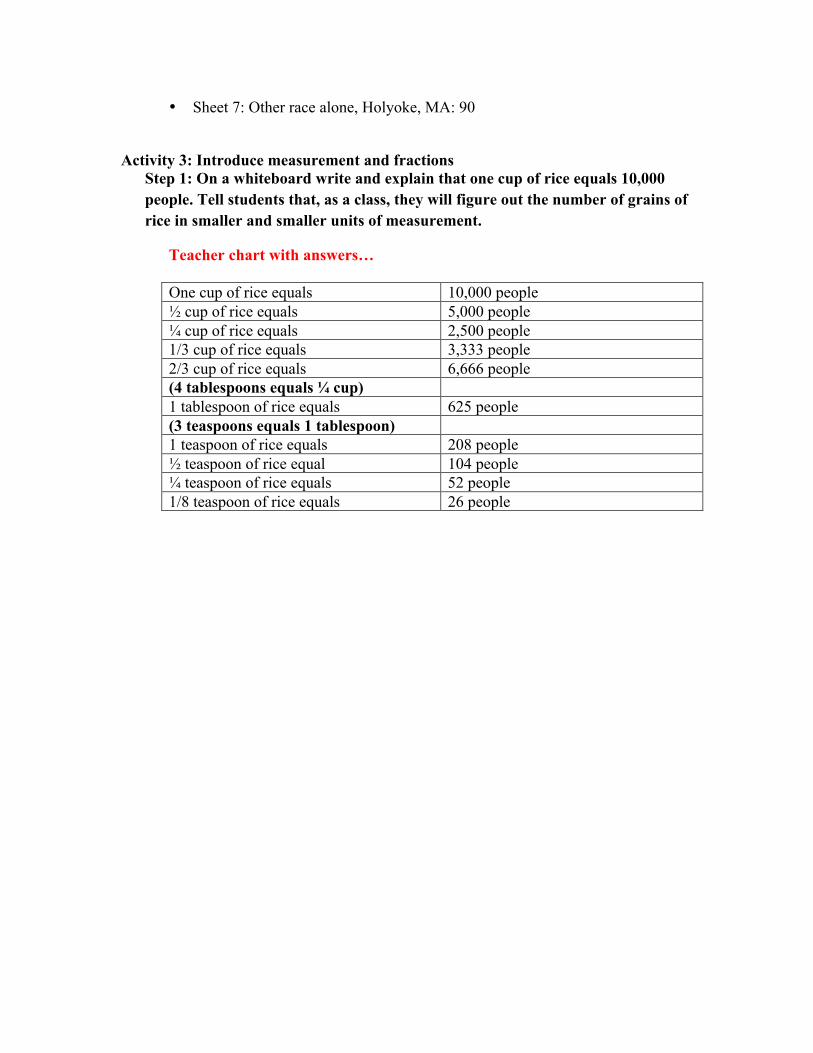
• Sheet 7: Other race alone, Holyoke, MA: 90
Activity 3: Introduce measurement and fractions
Step 1: On a whiteboard write and explain that one cup of rice equals 10,000 people. Tell students that, as a class, they will figure out the number of grains of rice in smaller and smaller units of measurement.
Teacher chart with answers… One cup of rice equals 10,000 people ½ cup of rice equals 5,000 people ¼ cup of rice equals 2,500 people 1/3 cup of rice equals 3,333 people 2/3 cup of rice equals 6,666 people (4 tablespoons equals ¼ cup) 1 tablespoon of rice equals 625 people (3 teaspoons equals 1 tablespoon) 1 teaspoon of rice equals 208 people ½ teaspoon of rice equal 104 people ¼ teaspoon of rice equals 52 people 1/8 teaspoon of rice equals 26 people
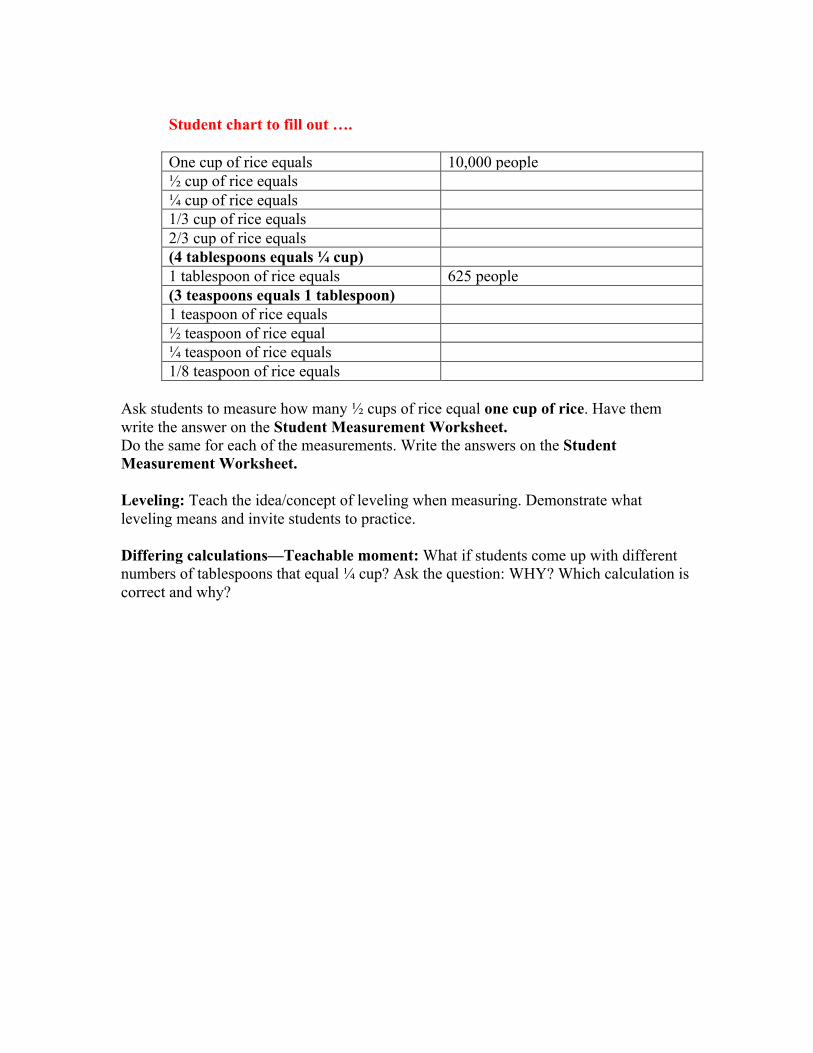
Student chart to fill out …. One cup of rice equals 10,000 people ½ cup of rice equals ¼ cup of rice equals 1/3 cup of rice equals 2/3 cup of rice equals (4 tablespoons equals ¼ cup) 1 tablespoon of rice equals 625 people (3 teaspoons equals 1 tablespoon) 1 teaspoon of rice equals ½ teaspoon of rice equal ¼ teaspoon of rice equals 1/8 teaspoon of rice equals
Ask students to measure how many ½ cups of rice equal one cup of rice. Have them write the answer on the Student Measurement Worksheet. Do the same for each of the measurements. Write the answers on the Student Measurement Worksheet. Leveling: Teach the idea/concept of leveling when measuring. Demonstrate what leveling means and invite students to practice. Differing calculations—Teachable moment: What if students come up with different numbers of tablespoons that equal ¼ cup? Ask the question: WHY? Which calculation is correct and why?

Rounding up the data: For this project, I rounded up the data to make it easier to measure and represent. (See
below). You may want to do the same depending on your data set. Actual Data Verses Rounded Up Data: • Hispanic Population in Holyoke: round to nearest thousand: 19,000: 18,916
(47.4%) • Caucasian Population: round to nearest thousand: 19,000: 18,790 (47.1%) • Asian Population in Holyoke: round to nearest hundred: 400: 383 (1.0%) • African American Population in Holyoke: round to nearest hundred: 1,400:
1,367 (3.4%) • Two or more races: round to nearest 10: 240: 242 (0.6%) • American Indian alone: round to nearest hundred: 100: 107 (0.3%) • Other race alone: round to nearest 10: 90: 92 (0.2%)
Activity 4: Data Analysis and Interpretation Once the data models are created with rice, students are invited to interpret the data and draw meaning from the activity. Questions for Discussion: For all questions, encourage student to explain their reasoning.
• Describe what you see when you look at the data models. Which mounds of rice were similar? Which were different?
• Can you use any math words to describe the relationships you see? • What conclusions would you draw from the data? What does it tell you? Why do
you think that? • What inferences can you make from data? Please explain your thinking. • What predictions can you make? Why? • How does what you see compare to what you thought before creating the models? • Invite students to summarize the activity. What do they think it was about? Can
they think of other areas where a similar technique would help them understand numbers?
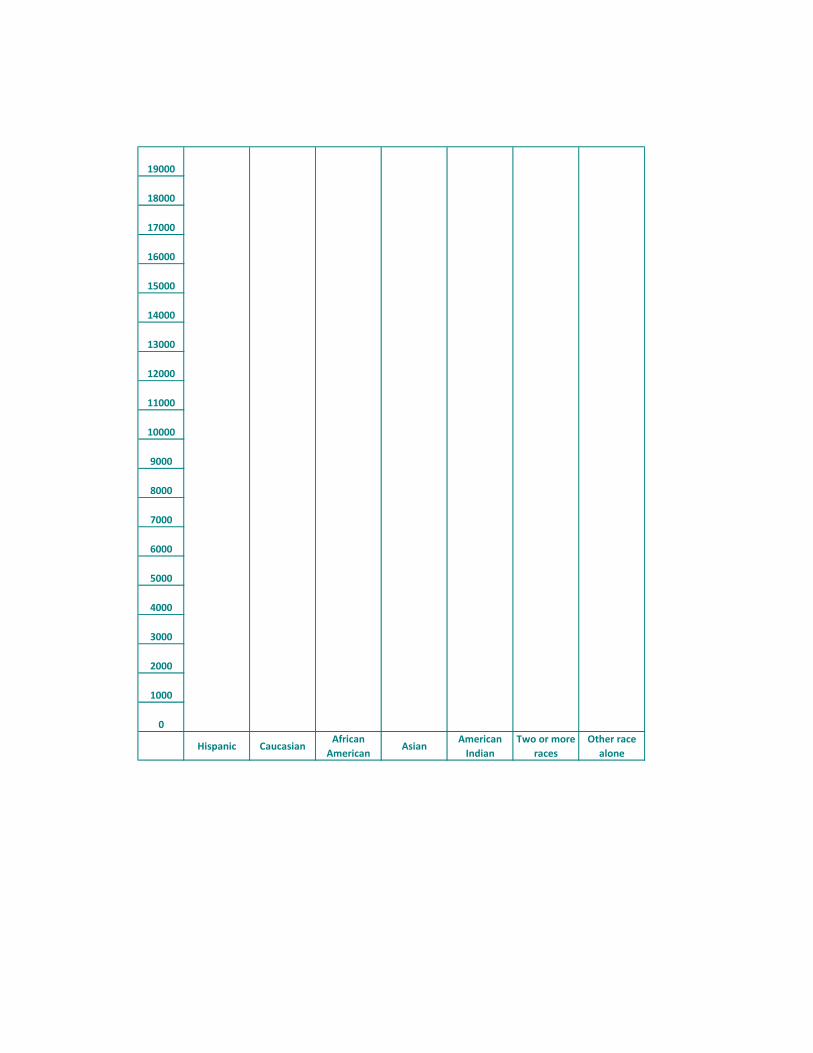
Activity 5: Representing the Data with Graphs
Bar graph:
After students create and analyze the data using rice and discuss the critical thinking questions about their findings, they can turn their three-dimensional data into 2-D bar graphs. This exercise helps students understand that data can be represented in multiple formats, but each format still describes the same information.
Materials:
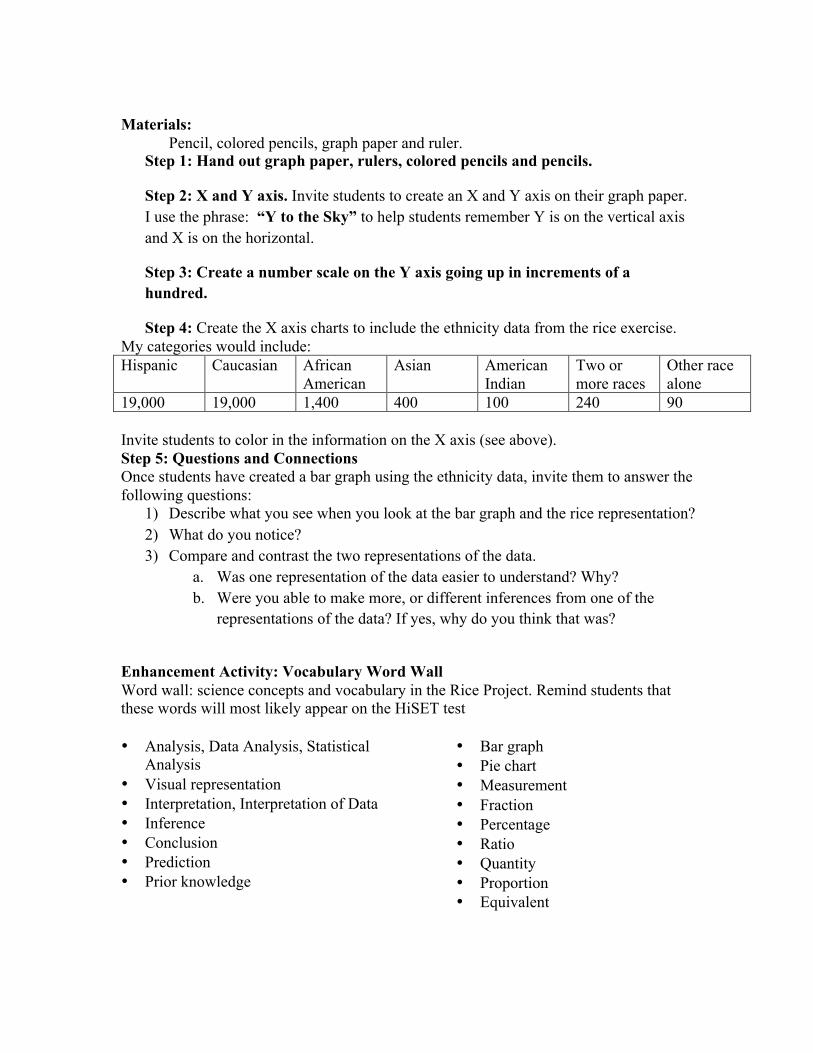
Pencil, colored pencils, graph paper and ruler. Step 1: Hand out graph paper, rulers, colored pencils and pencils.
Step 2: X and Y axis. Invite students to create an X and Y axis on their graph paper. I use the phrase: “Y to the Sky” to help students remember Y is on the vertical axis and X is on the horizontal.
Step 3: Create a number scale on the Y axis going up in increments of a hundred.
Step 4: Create the X axis charts to include the ethnicity data from the rice exercise. My categories would include: Hispanic Caucasian African
American Asian American
Indian Two or more races
Other race alone
19,000 19,000 1,400 400 100 240 90 Invite students to color in the information on the X axis (see above). Step 5: Questions and Connections Once students have created a bar graph using the ethnicity data, invite them to answer the following questions:
1) Describe what you see when you look at the bar graph and the rice representation? 2) What do you notice? 3) Compare and contrast the two representations of the data.
a. Was one representation of the data easier to understand? Why? b. Were you able to make more, or different inferences from one of the
representations of the data? If yes, why do you think that was?
Enhancement Activity: Vocabulary Word Wall Word wall: science concepts and vocabulary in the Rice Project. Remind students that these words will most likely appear on the HiSET test • Analysis, Data Analysis, Statistical
Analysis • Visual representation • Interpretation, Interpretation of Data • Inference • Conclusion • Prediction • Prior knowledge
• Bar graph • Pie chart • Measurement • Fraction • Percentage • Ratio • Quantity • Proportion • Equivalent
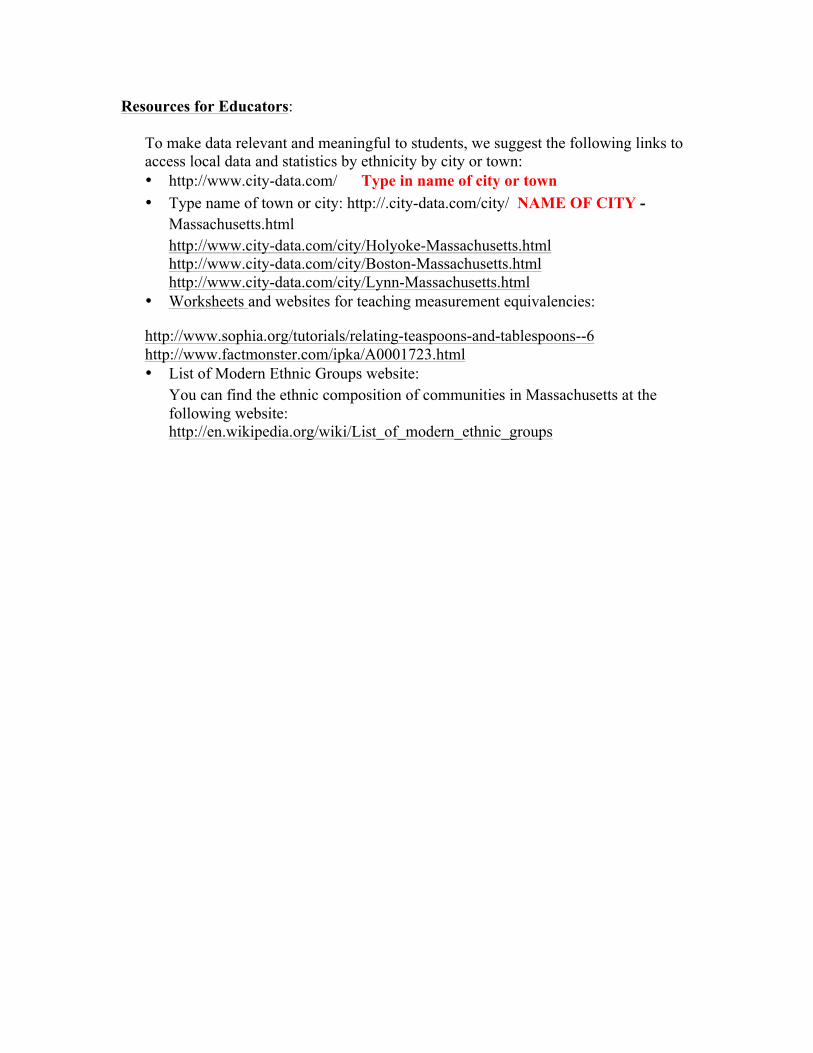
Resources for Educators:
To make data relevant and meaningful to students, we suggest the following links to access local data and statistics by ethnicity by city or town: • http://www.city-data.com/ Type in name of city or town • Type name of town or city: http://.city-data.com/city/ NAME OF CITY -
Massachusetts.html http://www.city-data.com/city/Holyoke-Massachusetts.html http://www.city-data.com/city/Boston-Massachusetts.html http://www.city-data.com/city/Lynn-Massachusetts.html
• Worksheets and websites for teaching measurement equivalencies:
http://www.sophia.org/tutorials/relating-teaspoons-and-tablespoons--6 http://www.factmonster.com/ipka/A0001723.html • List of Modern Ethnic Groups website:
You can find the ethnic composition of communities in Massachusetts at the following website: http://en.wikipedia.org/wiki/List_of_modern_ethnic_groups
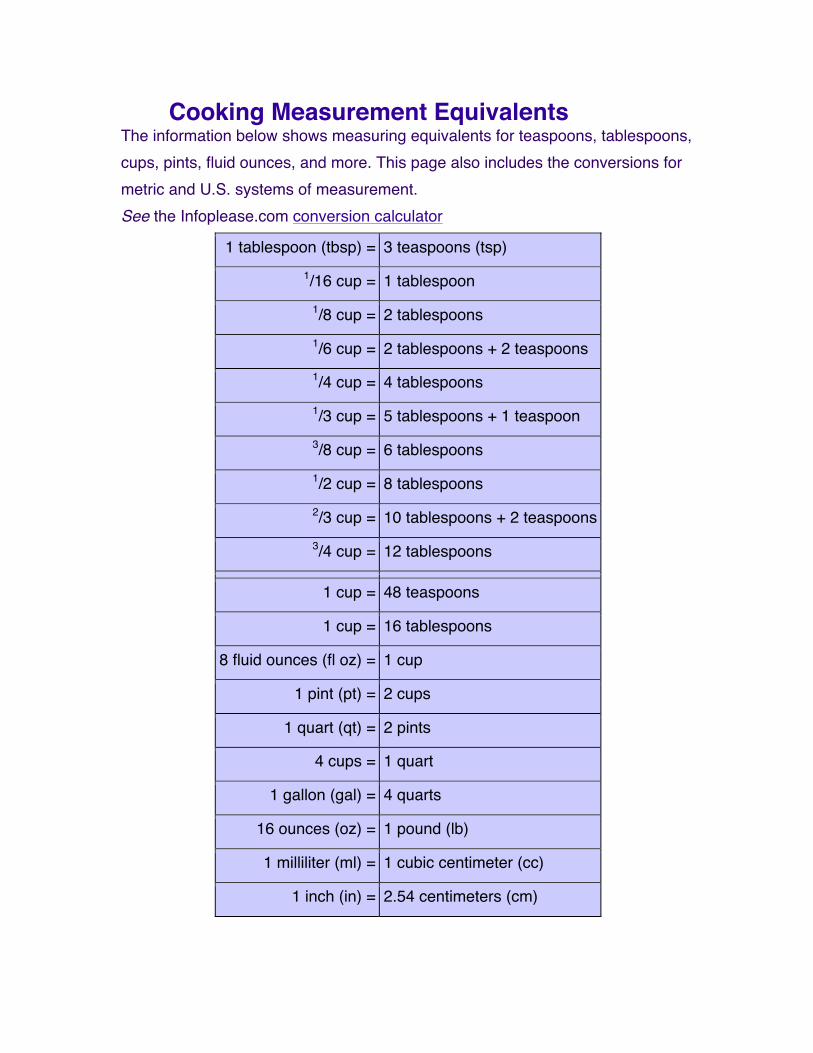
Cooking Measurement Equivalents The information below shows measuring equivalents for teaspoons, tablespoons, cups, pints, fluid ounces, and more. This page also includes the conversions for metric and U.S. systems of measurement. See the Infoplease.com conversion calculator
1 tablespoon (tbsp) = 3 teaspoons (tsp) 1/16 cup = 1 tablespoon
1/8 cup = 2 tablespoons 1/6 cup = 2 tablespoons + 2 teaspoons 1/4 cup = 4 tablespoons 1/3 cup = 5 tablespoons + 1 teaspoon 3/8 cup = 6 tablespoons 1/2 cup = 8 tablespoons 2/3 cup = 10 tablespoons + 2 teaspoons 3/4 cup = 12 tablespoons
1 cup = 48 teaspoons
1 cup = 16 tablespoons
8 fluid ounces (fl oz) = 1 cup
1 pint (pt) = 2 cups
1 quart (qt) = 2 pints
4 cups = 1 quart
1 gallon (gal) = 4 quarts
16 ounces (oz) = 1 pound (lb)
1 milliliter (ml) = 1 cubic centimeter (cc)
1 inch (in) = 2.54 centimeters (cm)
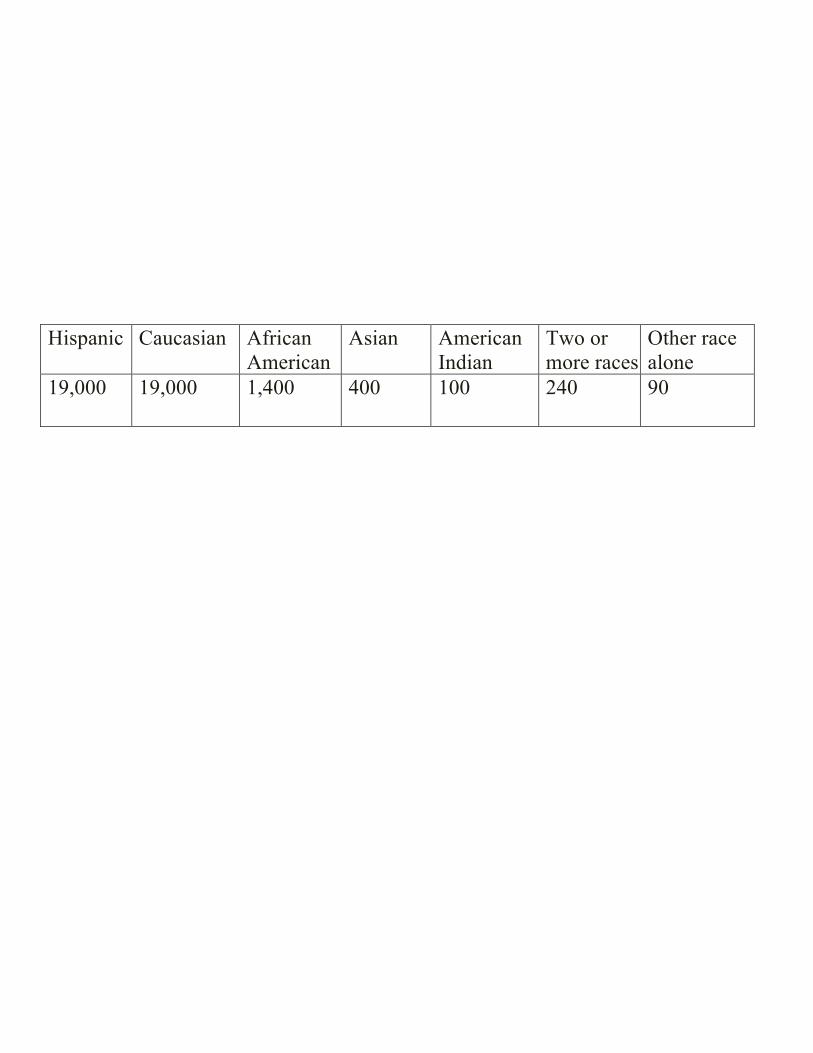
Hispanic Caucasian African American
Asian American Indian
Two or more races
Other race alone
19,000 19,000 1,400 400 100 240 90
19000
18000
17000
16000
15000
14000
13000
12000
11000
10000
9000
8000
7000
6000
5000
4000
3000
2000
1000
0
Hispanic CaucasianAfrican
AmericanAsian
American Indian
Two or more races
Other race alone
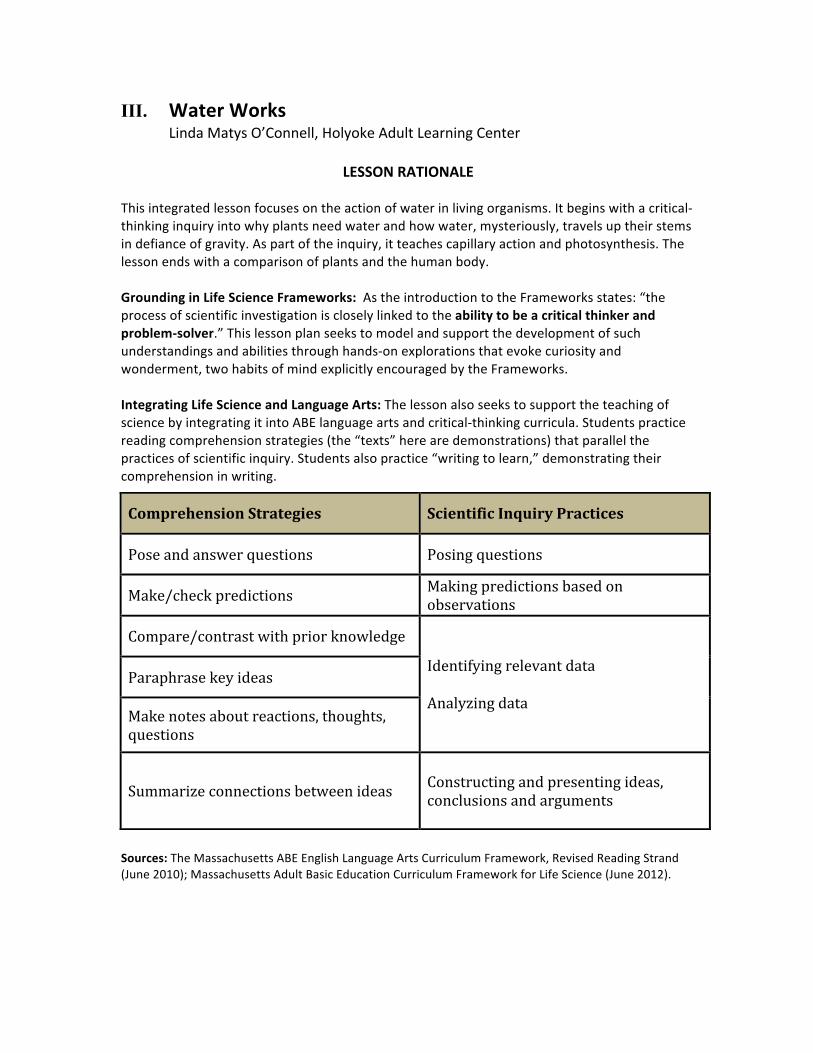
III. Water Works Linda Matys O’Connell, Holyoke Adult Learning Center
LESSON RATIONALE
This integrated lesson focuses on the action of water in living organisms. It begins with a critical-‐thinking inquiry into why plants need water and how water, mysteriously, travels up their stems in defiance of gravity. As part of the inquiry, it teaches capillary action and photosynthesis. The lesson ends with a comparison of plants and the human body. Grounding in Life Science Frameworks: As the introduction to the Frameworks states: “the process of scientific investigation is closely linked to the ability to be a critical thinker and problem-‐solver.” This lesson plan seeks to model and support the development of such understandings and abilities through hands-‐on explorations that evoke curiosity and wonderment, two habits of mind explicitly encouraged by the Frameworks. Integrating Life Science and Language Arts: The lesson also seeks to support the teaching of science by integrating it into ABE language arts and critical-‐thinking curricula. Students practice reading comprehension strategies (the “texts” here are demonstrations) that parallel the practices of scientific inquiry. Students also practice “writing to learn,” demonstrating their comprehension in writing.
Sources: The Massachusetts ABE English Language Arts Curriculum Framework, Revised Reading Strand (June 2010); Massachusetts Adult Basic Education Curriculum Framework for Life Science (June 2012).
Comprehension Strategies Scientific Inquiry Practices
Pose and answer questions Posing questions
Make/check predictions Making predictions based on observations
Compare/contrast with prior knowledge
Identifying relevant data Analyzing data
Paraphrase key ideas
Make notes about reactions, thoughts, questions
Summarize connections between ideas
Constructing and presenting ideas, conclusions and arguments
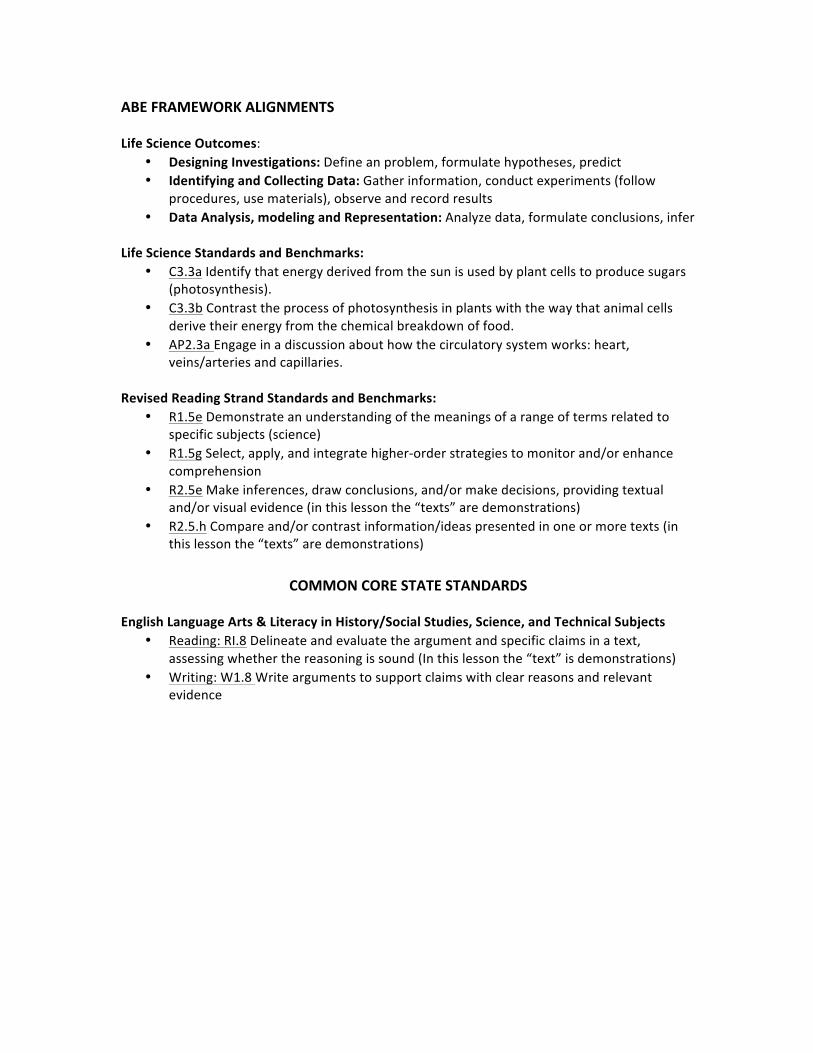
ABE FRAMEWORK ALIGNMENTS Life Science Outcomes:
• Designing Investigations: Define an problem, formulate hypotheses, predict • Identifying and Collecting Data: Gather information, conduct experiments (follow
procedures, use materials), observe and record results • Data Analysis, modeling and Representation: Analyze data, formulate conclusions, infer
Life Science Standards and Benchmarks:
• C3.3a Identify that energy derived from the sun is used by plant cells to produce sugars (photosynthesis).
• C3.3b Contrast the process of photosynthesis in plants with the way that animal cells derive their energy from the chemical breakdown of food.
• AP2.3a Engage in a discussion about how the circulatory system works: heart, veins/arteries and capillaries.
Revised Reading Strand Standards and Benchmarks:
• R1.5e Demonstrate an understanding of the meanings of a range of terms related to specific subjects (science)
• R1.5g Select, apply, and integrate higher-‐order strategies to monitor and/or enhance comprehension
• R2.5e Make inferences, draw conclusions, and/or make decisions, providing textual and/or visual evidence (in this lesson the “texts” are demonstrations)
• R2.5.h Compare and/or contrast information/ideas presented in one or more texts (in this lesson the “texts” are demonstrations)
COMMON CORE STATE STANDARDS
English Language Arts & Literacy in History/Social Studies, Science, and Technical Subjects
• Reading: RI.8 Delineate and evaluate the argument and specific claims in a text, assessing whether the reasoning is sound (In this lesson the “text” is demonstrations)
• Writing: W1.8 Write arguments to support claims with clear reasons and relevant evidence
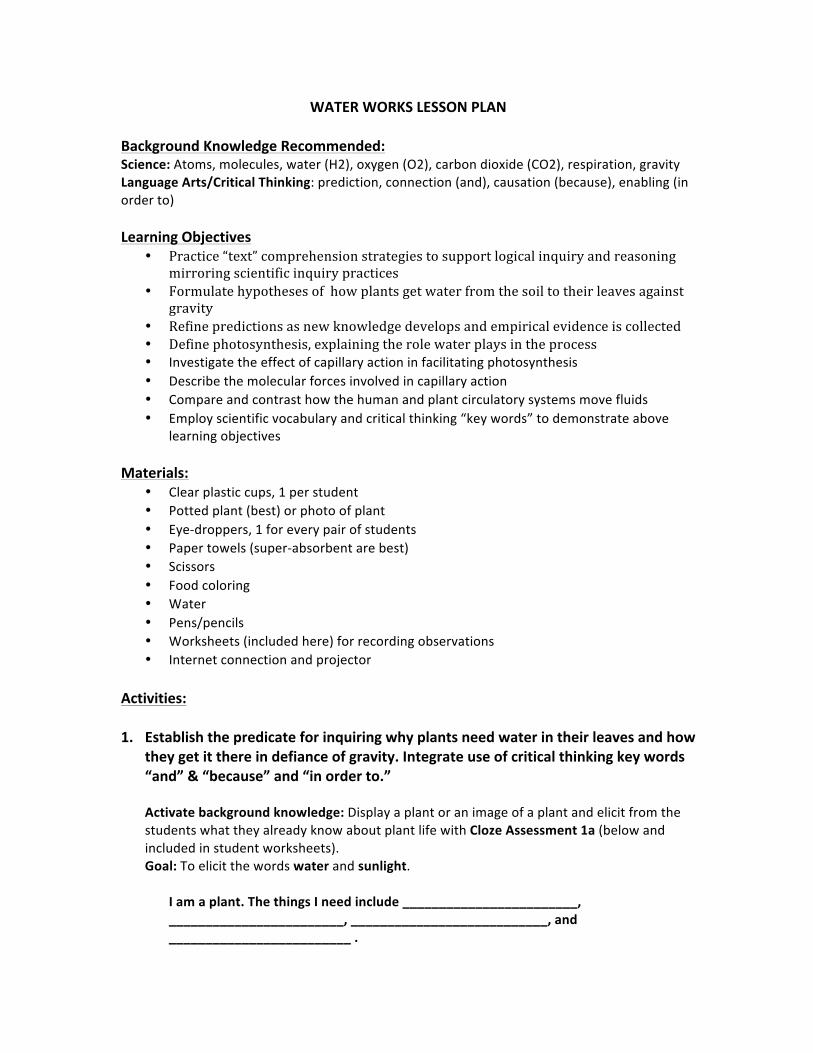
WATER WORKS LESSON PLAN
Background Knowledge Recommended: Science: Atoms, molecules, water (H2), oxygen (O2), carbon dioxide (CO2), respiration, gravity Language Arts/Critical Thinking: prediction, connection (and), causation (because), enabling (in order to)
Learning Objectives
• Practice “text” comprehension strategies to support logical inquiry and reasoning mirroring scientific inquiry practices
• Formulate hypotheses of how plants get water from the soil to their leaves against gravity
• Refine predictions as new knowledge develops and empirical evidence is collected • Define photosynthesis, explaining the role water plays in the process • Investigate the effect of capillary action in facilitating photosynthesis • Describe the molecular forces involved in capillary action • Compare and contrast how the human and plant circulatory systems move fluids • Employ scientific vocabulary and critical thinking “key words” to demonstrate above
learning objectives
Materials: • Clear plastic cups, 1 per student • Potted plant (best) or photo of plant • Eye-‐droppers, 1 for every pair of students • Paper towels (super-‐absorbent are best) • Scissors • Food coloring • Water • Pens/pencils • Worksheets (included here) for recording observations • Internet connection and projector
Activities: 1. Establish the predicate for inquiring why plants need water in their leaves and how
they get it there in defiance of gravity. Integrate use of critical thinking key words “and” & “because” and “in order to.” Activate background knowledge: Display a plant or an image of a plant and elicit from the students what they already know about plant life with Cloze Assessment 1a (below and included in student worksheets). Goal: To elicit the words water and sunlight.
I am a plant. The things I need include ________________________, ________________________, ___________________________, and _________________________ .
Ask each student to fill in the blanks with as many things as s/he can think of, then group-‐ share and display all non-‐duplicative responses.
Check for understanding and make cause-‐and-‐effect explicit with the help of this critical thinking prompt, Cloze Assessment 1b 1a (below and included in student worksheets). Goal: To establish knowledge of the connection between water and life. Plants need water because___________________________________________________________________.
Ask each student to complete the sentence in h/er/is own words, as long as the concept is correct. If they stop at something like “because I’ll wilt/dry up if I don’t have it,” take the inquiry one step further by asking: “So, what happens if you dry up?” Elicit: The plant will die.
2. Now that you’ve established that plants will die without water, lead your students through the next inquiry, working up to the revelation that plants need water for photosynthesis, which produces the “food” on which they live. Pose the questions: “Why will plants die without water? “What exactly do they use it for?”
The answer is beyond the limit of most students’ background knowledge. That’s where the teacher and guided inquiry come in.
Draw: Sketch a plant on the board as the students tell you the parts of the plant. Roots, stem, leaves Pose the question: What does each part do?
They’ll probably be stumped by the leaves. Tell them you’ll park that question for later. Pose the next logical question: A plant drinks water through its roots, but it doesn’t have a mouth to eat food. So how does it eat! Finally, the answer we’ve all been waiting for . . . Play Video explaining photosynthetic process for obtaining nourishment from water and carbon dioxide: PBS LearningMedia http://mass.pbslearningmedia.org/resource/tdc02.sci.life.stru.photosynth/photosynthesis/ Debrief: Yes, unlike humans, plants make their own food using water by a process called photosynthesis.
• Point out the root photo-‐ meaning light in photosynthesis. • The chloroplasts do the work. • Go back to your sketch and draw the chloroplasts on the leaves.
Assessment: Each student completes Cloze Assessment 2 (below and included in student worksheets).
Plants use ________________ , sunlight, and carbon dioxide to make their own food. The food-‐making process is called _________________________________. It takes place chloroplasts in the plant’s __________. Photosynthesis produces _______________________________, which is the food for the plant. Photosynthesis also releases _____________ into the air.
3. Now that students understand that a plant needs water for photosynthesis, lead them to the next logical inquiry: How does the water get from the roots to the leaves, defying gravity? Students will explore the process of capillary action through hands-‐on using “text” comprehension strategies, linked to scientific inquiry practices, on visual and kinesthetic experiences. Step 1: “Heavy” water Distribute to student pairs: 2 clear plastic cups, 2 paper towels, an eye-‐dropper Fill 1 cup ¼ full with water: Students fill in sink or pass pitchers Observe and ask:. Is this water in motion? Not moving up the sides of the cup? Pose the question: Then how does it move up though the plant’s stem?
Invite the students to hypothesize Step 2: Cohesion Introduce demo: The purpose of this demonstration is to observe a property of water that will help explain how water can flow upward. Explain what you’ll do: Using the eye-‐dropper one partner will place one drop of water on the back of the other partner’s hand Make predictions: What do you think will happen? Will the water run off the hand? Students gather observation data and record in writing on grid (included in worksheets):
Water will stay in a drop and not run off if the drop is small enough. Have students reduce the amount of water they drop until they see this effect.
Pose the question: Why does this drop effect happen? Allow students to hypothesize Explain:
Molecules of water are naturally attracted to each other (it’s called cohesion.).Their attraction for each other is strongest on the surface of a liquid so it holds the drop together (the phenomenon is called surface tension). Note: Surface tension can be overcome if there’s too much water.
Step 3: Capillary Action Pairs Conduct Demo: Cut a long 2-‐inch strip of paper towel. Twist like a rope and staple the ends so it doesn’t untwist. Put a couple drops of food coloring in one cup. Put one end of the paper towel in each cup. Make a prediction: What will happen when you dip the paper towel in the water? Students gather observation data and record in writing on grid (included in worksheets): What does happen?
Water will move quickly up the paper towel. Comment on the result and pose the question: The water seems to be defying gravity Why does this happen?.
Let students hypothesize. If they say the paper towel is “absorbing” the water. Ask how it does that? Refer them back to what they know about the attraction between water molecules. Give a kinesthetic hint: Have student pairs imagine themselves as two water molecules. Have them hold hands (have scarves for the touch-‐averse) to represent the attractive force between them. Instruct the pairs that one student is to take three steps forward and the other is to do whatever s/he has to do not to break the bond between them. What happens? Gather observation data and record in writing: When one student moves, the other moves in the same direction.
Apply this observation: So, what might be happening with the molecules of water in your paper towel?
They are sticking together like the students because of the forces attracting them to each other.
ASK THE BIG QUESTION: But, why are the molecules in moving up the paper towel in the first place?
Let students hypothesize. They’ll probably be stumped. Give a visual/kinesthetic hint: Ask one pair of student “molecules” to volunteer to help you in front of the class. Tell the students you represent the paper towel molecule. Have the water molecule students join one hand. Tell them not to resist you. Now take with one water molecule’s free hand and pull gently until both students move toward you. Gather observation data and record in writing: What happens?
Both the water molecule students move in the direction that you’re pulling. Apply this data/draw conclusion: So, based on this hint, what’s making the water molecules move up in your paper towel?
The first molecules is attracted (it’s called adhesion) to the paper towel and is being pulled toward it. The other water molecule is being pulled along.
Explain: OK, teacher, spell out the phenomenon called capillary action Water molecules are attracted not only to each other but also to other molecules they touch, like those in the fibers of a paper towel or a plant stem. If the adhesive force is stronger than the cohesive force within the water the water will be pulled along. Capillary action happens in very small tubes or spaces. This phenomenon is called capillary action.
Debrief: Go back to your sketch and draw arrows of movement of water from roots, up stem to leaves, having students summarize as you go. Real-‐life demonstration: Play time-‐lapse video showing the effect of capillary action in plant. http://www.youtube.com/watch?v=y-‐h_qGhgtno Assessment: Students complete Cloze Assessment 3 (below and included in worksheets). Plants make their own ___________ by a process called photosynthesis. Three things plants use for photosynthesis are _____________________, carbon dioxide, and _________________________. Plants take in water through their ____________________. They need to get the water to their leaves because _________________________________________________________________________________________________________.
Explain how plants get water from their roots to their leaves. Give as much detail as you can. ____________________________________________________________________________________________________________________________________________________________________________________________________________________________________________________________________________________________________________________________________________________________________________________________________________________________________________________________________________________________________________________________________________________________________________________________________________________________________________________________________________________
4. Finish lesson with general discussion of plant nutrition and circulation systems compared/contrasted with human body nutrition and circulation systems. Prompts for a general comparative discussion:
• How do we get food? How do we process food? • How do the nutrients from food get into our bodies? • Compare and contrast: So, we don’t need to bring water up from our
toes, but we do need to move fluid around our bodies. We move the blood, which is mostly water, in the circulatory system.
• What makes the blood move around the circulatory system? Unlike plants, we use a pump to move fluids.
• Show diagram of human circulatory system: Suggestion: body art photo at: http://woordup.com/2012/05/24/circulatory-‐system-‐body-‐art
• The smallest tubes in the circulatory system are called capillaries. Water Works Worksheets
Cloze Assessment 1a Fill in the blanks with as many things as you can think of. The order doesn’t matter.
I am a plant. The things I need include ________________________,
________________________, ___________________________, and
_________________________ .
Cloze Assessment 1b. Complete the sentence below in your own words to make a correct statement. Everyone will use different words.
Plants need water
because___________________________________________________________________
_____________________________________________________________________
_______________________
_____________________________________________________________________
_______________________
_____________________________________________________________________
_______________________.
Cloze Assessment 2 Fill in the blanks below to create true statements. Plants use ________________ , sunlight, and carbon dioxide to make their own food. The
food-‐making process is called _________________________________. It takes place
chloroplasts in the plant’s __________. Photosynthesis produces
_______________________________, which is the food for the plant. Photosynthesis also
releases _____________ into the air.
Assessment 3
A, Plants make their own ___________ by a process called photosynthesis. Three things plants
use for photosynthesis are _____________________, carbon dioxide, and
_________________________. Plants take in water through their ____________________. They
need to get water to their leaves because
______________________________________________________________________________
___________________________.
B. Explain how plants get water from their roots to their leaves. Give as much detail as you can.
______________________________________________________________________________
______________________________________________________________________________
______________________________________________________________________________
______________________________________________________________________________
______________________________________________________________________________
______________________________________________________________________________
______________________________________________________________________________
______________________________________________________________________________
____________________________________________________________
Water Works Experiment Observation Grid
WHAT YOU DID WHAT YOU OBSERVED
WATER WORKS NOTES
Vocabulary and Definitions:
What we knew: atoms, molecules, cells, respiration, water, oxygen (O), water (H2O), carbon dioxide (CO2) What we learned:
photosynthesis
chloroplasts
cohesion
adhesion
capillary action
OTHER NOTES:
Glossary
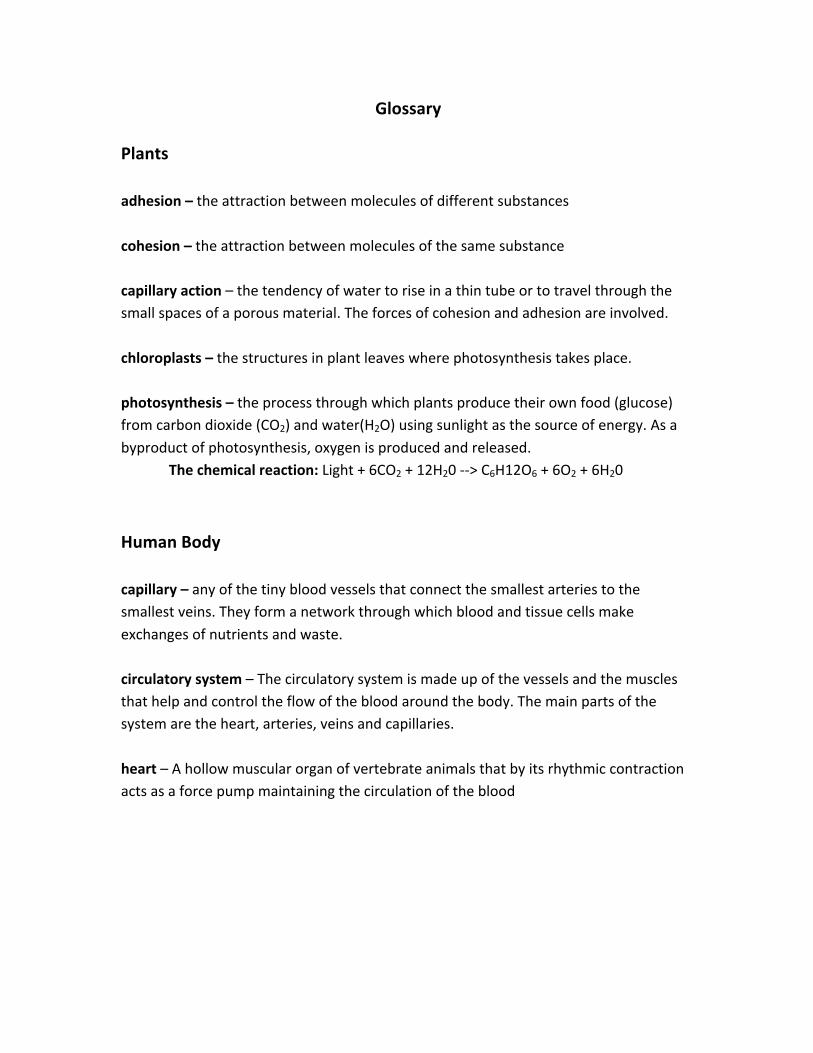
Plants adhesion – the attraction between molecules of different substances cohesion – the attraction between molecules of the same substance capillary action – the tendency of water to rise in a thin tube or to travel through the small spaces of a porous material. The forces of cohesion and adhesion are involved. chloroplasts – the structures in plant leaves where photosynthesis takes place. photosynthesis – the process through which plants produce their own food (glucose) from carbon dioxide (CO2) and water(H2O) using sunlight as the source of energy. As a byproduct of photosynthesis, oxygen is produced and released.
The chemical reaction: Light + 6CO2 + 12H20 -‐-‐> C6H12O6 + 6O2 + 6H20 Human Body capillary – any of the tiny blood vessels that connect the smallest arteries to the smallest veins. They form a network through which blood and tissue cells make exchanges of nutrients and waste. circulatory system – The circulatory system is made up of the vessels and the muscles that help and control the flow of the blood around the body. The main parts of the system are the heart, arteries, veins and capillaries. heart – A hollow muscular organ of vertebrate animals that by its rhythmic contraction acts as a force pump maintaining the circulation of the blood
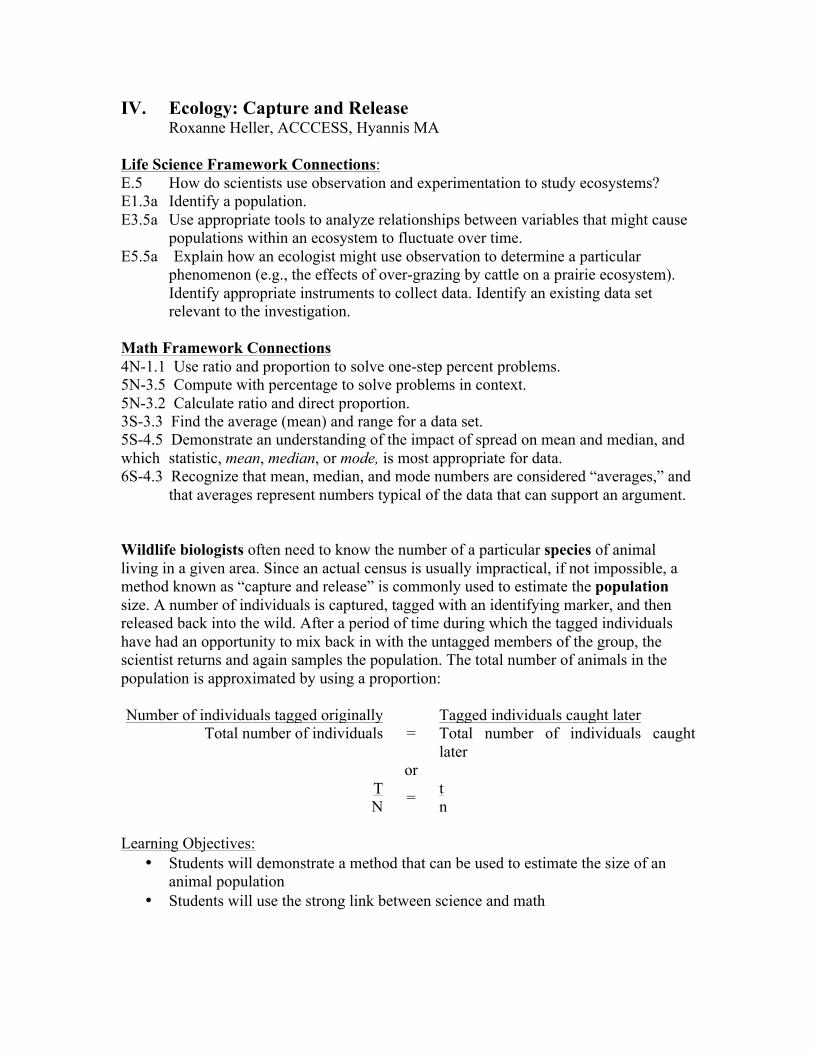
IV. Ecology: Capture and Release Roxanne Heller, ACCCESS, Hyannis MA
Life Science Framework Connections: E.5 How do scientists use observation and experimentation to study ecosystems? E1.3a Identify a population. E3.5a Use appropriate tools to analyze relationships between variables that might cause
populations within an ecosystem to fluctuate over time. E5.5a Explain how an ecologist might use observation to determine a particular phenomenon (e.g., the effects of over-grazing by cattle on a prairie ecosystem). Identify appropriate instruments to collect data. Identify an existing data set relevant to the investigation. Math Framework Connections 4N-1.1 Use ratio and proportion to solve one-step percent problems. 5N-3.5 Compute with percentage to solve problems in context. 5N-3.2 Calculate ratio and direct proportion. 3S-3.3 Find the average (mean) and range for a data set. 5S-4.5 Demonstrate an understanding of the impact of spread on mean and median, and which statistic, mean, median, or mode, is most appropriate for data. 6S-4.3 Recognize that mean, median, and mode numbers are considered “averages,” and that averages represent numbers typical of the data that can support an argument. Wildlife biologists often need to know the number of a particular species of animal living in a given area. Since an actual census is usually impractical, if not impossible, a method known as “capture and release” is commonly used to estimate the population size. A number of individuals is captured, tagged with an identifying marker, and then released back into the wild. After a period of time during which the tagged individuals have had an opportunity to mix back in with the untagged members of the group, the scientist returns and again samples the population. The total number of animals in the population is approximated by using a proportion: Number of individuals tagged originally
= Tagged individuals caught later
Total number of individuals Total number of individuals caught later
or T = t N n
Learning Objectives:
• Students will demonstrate a method that can be used to estimate the size of an animal population
• Students will use the strong link between science and math
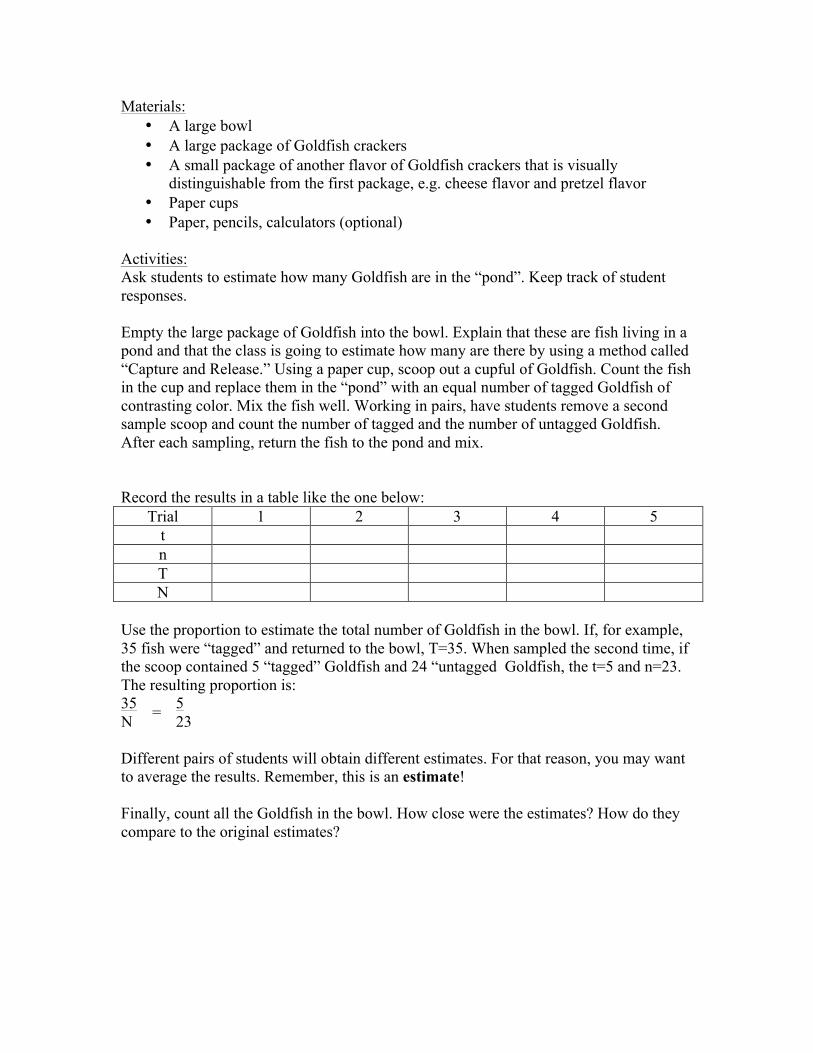
Materials: • A large bowl • A large package of Goldfish crackers • A small package of another flavor of Goldfish crackers that is visually
distinguishable from the first package, e.g. cheese flavor and pretzel flavor • Paper cups • Paper, pencils, calculators (optional)
Activities: Ask students to estimate how many Goldfish are in the “pond”. Keep track of student responses. Empty the large package of Goldfish into the bowl. Explain that these are fish living in a pond and that the class is going to estimate how many are there by using a method called “Capture and Release.” Using a paper cup, scoop out a cupful of Goldfish. Count the fish in the cup and replace them in the “pond” with an equal number of tagged Goldfish of contrasting color. Mix the fish well. Working in pairs, have students remove a second sample scoop and count the number of tagged and the number of untagged Goldfish. After each sampling, return the fish to the pond and mix. Record the results in a table like the one below:
Trial 1 2 3 4 5 t n T N
Use the proportion to estimate the total number of Goldfish in the bowl. If, for example, 35 fish were “tagged” and returned to the bowl, T=35. When sampled the second time, if the scoop contained 5 “tagged” Goldfish and 24 “untagged Goldfish, the t=5 and n=23. The resulting proportion is: 35 = 5 N 23 Different pairs of students will obtain different estimates. For that reason, you may want to average the results. Remember, this is an estimate! Finally, count all the Goldfish in the bowl. How close were the estimates? How do they compare to the original estimates?
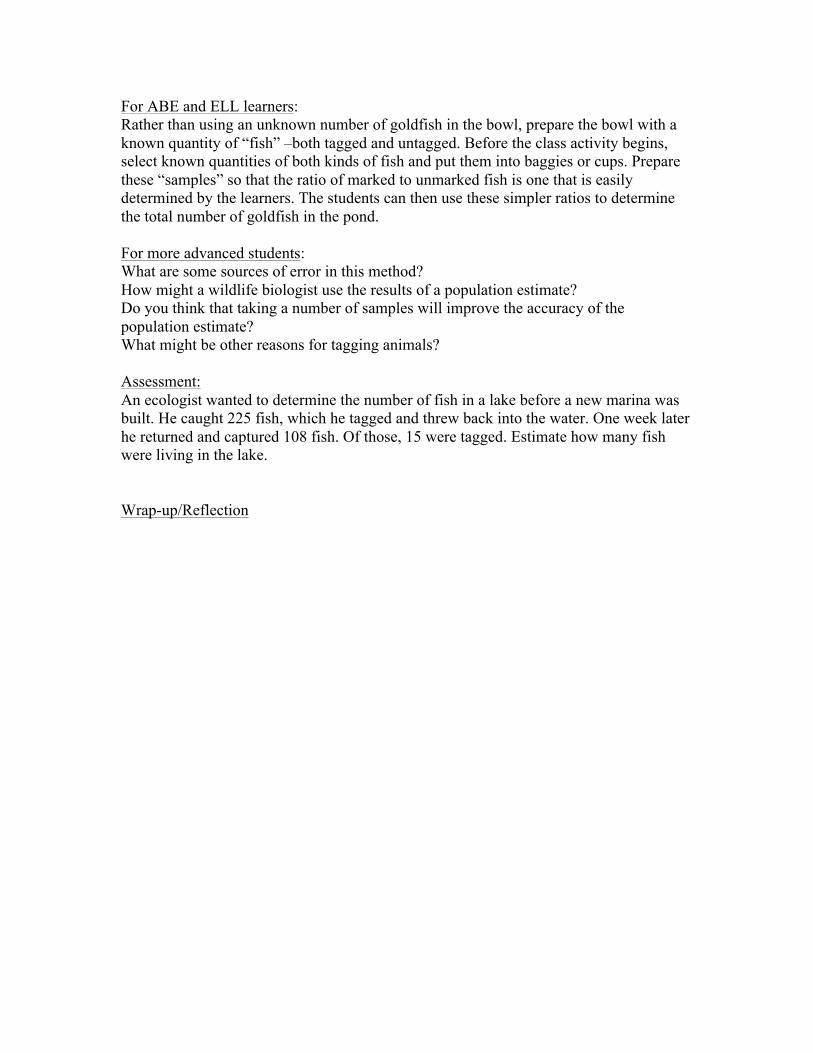
For ABE and ELL learners: Rather than using an unknown number of goldfish in the bowl, prepare the bowl with a known quantity of “fish” –both tagged and untagged. Before the class activity begins, select known quantities of both kinds of fish and put them into baggies or cups. Prepare these “samples” so that the ratio of marked to unmarked fish is one that is easily determined by the learners. The students can then use these simpler ratios to determine the total number of goldfish in the pond. For more advanced students: What are some sources of error in this method? How might a wildlife biologist use the results of a population estimate? Do you think that taking a number of samples will improve the accuracy of the population estimate? What might be other reasons for tagging animals? Assessment: An ecologist wanted to determine the number of fish in a lake before a new marina was built. He caught 225 fish, which he tagged and threw back into the water. One week later he returned and captured 108 fish. Of those, 15 were tagged. Estimate how many fish were living in the lake. Wrap-up/Reflection