criminal victimization of new york state residents, 1974-77 · u.s. department of justlce bureau of...
TRANSCRIPT

u.s. Department of Justice
Bureau of Justice Statistics
= "'it
Criminal Victimization .of New York State Residents
Percent distribution of crimes, 1977 .
I

Bureau of Justice Statistics Reports
Single copies are available at no charge Irom the National Criminal Justice Relerence Service, Box 6000, Rockville, Md. 20850. Multiple copies are lor sale by the':Superlntendent 01 Documents, U.S. Governmel1t Printing Office, Washington, D.C. 20402.
National Crime Survey: Criminal IlIctlmlzation In the United States (annual):
Summary Findings of 1977-78 Changes in Crime and of Trends Since 1973, NCJ-6136E1
A Description of Trends from 1973 to 1977. NCJc59898
1978 (final report). NCJ-664BO 1977, NCJ-53725 1976, NCJ-49543 1975, NCJ-44593 1974, NCJ-39467 1973, NCJ-34732
The Cost of Negligence: Losses from Preventable Household Burglaries, NCJ-53527
InUmate Vlctlmll: A Study 6f Violence AmCing Friends and Relatives, NCJ-62319
Crime and Seascmallty, NCJ-64B1B Criminal Victimization of New York State
Residents, 1974-77, NCJ-664Bl Criminal Vlctlmlzatlon Surveys In 13
American cities (summary report, 1 vol.), NCJ-18471 Boston, NCJ-34B1B Buffalo, NCJ-34B20 Cli1Iclnnatl, NCJ-34819 Houston, NCJ-34821 Miami, NCJ-34B22 Milwaukee, NCJ-34B23 Minneapolis, NCJ-34B24 New Orleans, NCJ-34B25 Oakland, NCJ-34B26 Pittsburgh, NCJ-34B27 San Diego, NCJ-34B2B San Francisco, NCJ-34629 Washington, D.C., NCJ-34830
Public Altitudes About Crime (13 vols.): Boston, NCJ-46235 Buffalo, NCJ-46236 Cincinnati, NCJ-46237 Houston, NCJ-46238 Miami, NCJ-46239 Mllwauke .. , NCJ-46240 Minneap'illls, NCJ-46241 New Orleans, NCJ-46242 Oakland, NCJ-46243 Pittsburgh, NCJ-46244 San Diego, NCJ-46245 San Francisco, NCJ-46246 Washington, D.C., NCJ-46247
Criminal Vlcllmlzatlon Surveys In Chlcagtl, Detro!!, Los Angeles, New York, and Philadelphia: A Comparison of 1972 and 1974 Findings, NCJ-36360
Criminal Victimization Surveys In the Nation's Five Largest Cilles: National Crime Panel Surveys in Chicago, Detroit, Los Angeles, New York, and Philadelphia, 1972, NCJ-16909
Criminal Victimization Surveys In Eight American Cilles: A Comparison of 1971/72 and 1974175 Findings-National Crime Surveys in Atlanta, Baltimore, Cleveland, Dallas, Denver, Newark, Portland, and St. Louis, NCJ-36361
Crimes and Victims: A Report on the Day ton/ San Jose Pilot Survey of Victimization, NCJ-013314
Indicators 01 Crime and Criminal Justice: Quantitative Studies, NCJ-62349
Applications of the National Crime Survey Victimization and Attitude Data:
Public Opinion About crime: The Attitudes of Victims and Nonvictims In SEllected Cities, NCJ-41336 .
Local Victim Suroleys: A Review of the Issues, NCJ-39973
The Police and Public Opinion: An Analysis of Vlctinlization and Attitude Data Irom 13 American Cities, NCJ-42018
An Introduction to the National Crime Survey, NCJ-43732
Compensating Victims 01 Violent Crime: Potential Costs and Coverage of a National Program, NCJ-433B7
Crime Against Persons In Urban, Suburban, and Rural Areas; A Comparative Analysis of Victimlzatfon Rates, NCJ-53551
Rape Victimization In 26 American Cities, NCJ-5587B
Criminal Victimization In Urban Schools, NCJ-56396
National Prisoner Statistics: Capital Punishment (annualj:
197B, NCJ-59897 1979 advance report, NCJ- 67705
Prisoners In Stale and Federallnslitutions on December 31: 1978, NCJ-64671 1979 advance report, NCJ-66522
Census 01 State Correctional Facilities, 1974 advance report, NCJ-25642
Profile 01 State Prison Inmates: Sociodemographic Findings from the 1974 Survey of Inmates of State Correctional Facilities, NCJ-5B257
Census 01 Prisoners In State Correctional Facilities, 1973, NCJ-34729
Census of .Jalls and Survey 01 Jail Inmates, 1978, preliminary report, NCJ-55172
Profile 01 Inmates 01 Local Jails: Soclodemographic Findings from the 197B Survey of Inmates of Loca.! Jails, NCJ-65412
The N~tion's Jails: A report on the census of jails from the 1972 Survey of Inmates of Local Jails, NCJ-19067
Survey allnmates of local Jails, 1972, advance report, NCJ-13313
Uniform Parole Reports: Parole In the United States (annual):
1978, NCJ-58722 1976and 1977, NCJ-49702
Characterls!lcs 01 the Parole Population, 197B, NCJ-66479
A National Survey 01 Parole-Related Legislation Enacted During the 1979 Legislative Session, NCJ-6421B
Children In Custody: Juvenile Detention and Correctional Facility Census 1977 advance report:
Census of Public Juvenile Facilities, NCJ-60967
Cens.us of Private Juvenile Facilities, NCJ·60968
1975 (final report), NCJ-5B139 1974, NCJ-57946 1973, NCJ-44777 1971, NCJ-13403
Myths and Realities About Crime: A Nontechnical Presentation of Selected Information from the National Prisoner Statistics Program and the National Crime Survey, NCJ-46249
State and Local Probation and Parole Systems, NCJ-41335
State and Lotal Prosecution and Civil Attorney Systems, NCJ-41334
National Survey 01 Court Organization: 1977 Supplemer,t to State Judicial Systems,
NCJ-40022 1975 Supplement to State Judicial Systems,
NCJ-29433 1971 (futl report), NCJ-11427
State Court Model Statistical Dictionary, NCJ-62320
State Court Caseload Statistics: The State of the Art, NCJ,,46934 Ann ual Report, 1975, NCJ-51885 Annual Report, 1976, NCJ-56599
A Cross-City Comparison 01 Felony Case Processing, NCJ-55171
Trends In Expenditure and Employment Data lor the Criminal Justice System, 1971-77 (annual), NCJ-57463
Expenditure and Employment Data lor the Criminal Justice System (annual) 1978 Summary Report, NCJ-66483 1978 final report, NCJ-664B2 1977 final report, NCJ-53206
Dictionary of Criminal Justice Data Terminology: Terms and Definitions Proposed for Interstate and National Dala Collection and Exchange, NCJ-36747
Criminal Justice Agencies In the U.S.: Summary Report of the Natlond Criminal Justice Agency List, NCJ-65560
Criminal Justice Agencies In Region 1: Conn., Maine, Mass., N.H., R I., VI., NCJ-17930
2: N,J .. N.Y .. NCJ-17931 3: Del., D.C., Md., Pa., Va., W.Va., NCJ-17932 4: Ala., Ga., Fla., Ky., Miss" N.C., S.C" Tenn" NCJ-17933
5: III., Ind .. Mirh., Minn., Ohio, Wis" NGJ-17934 .
6: Ark., La., N.Mex., Okla., Tex., NCJ-17935 7: Iowa, Kans., Mo ,Nebr .. NCJ-17936 8: Colo., Mont., N,Dak" S.Dak" Utah, Wyo,. NCJ-17937
9: Ariz., Calil., Hawaii, Nev., NCJ-15151 10: Alaska, Idaho, Oreg., Wflsh .. NCJ-1793B
Utilization of Criminal Justice Statistics Project:
Sourcebook of Criminal Justice Statistics 1979 (annual). NCJ-59679
Public Opinion Regarding Crime, Criminat Justice, and Related Topics, NCJ-17419
New Directions in Processing of Juvenile Offenders: The Denver Model. NCJ-17 420
Who Gets Detained? An Empirical Analysis of the Pre-Adjudicatory Detention of Juveniles in Denver. NC,J-17417
Juvenile Dispositions: Social and Legal Factors Related to the Processing of Denver Delinquency Cases, NCJ-17418
Olfender-Based Transaction Statislics: New Directions in Data Collection and Reporting, NCJ-296.16
Sentencing of California Felony Offenders, NCJ-29646
The Judicial processing of Assault and Burglary Offenders in Selected California Counties, NC,t-29644
Pre-Adjudicatory Detention in Three Juvenile Courts, NCJ-34730
Delinquency Disposilions: An Empirical Analysis of Processing Decisions in Three Juvenile Courts. NCJ-34734
The Patterns and Distribution of Assaull Incident Characteristics Among Social Areas, NCJ-40025
Patterns of Robbery Characteristics and Their Occurrence Among Social Areas, NCJ-40026
Crime-Specific Analysis: The Characteristics of Burglary Incidents,
NCJ-42093 An Empirical Examinaticr] of Burglary
Offender Characteristics. NCJ-43131 An Empirical Examination of Burglary
Offenders and Offense Characteristics, NCJ-42476
Sources of National Criminal Justice Statistics: An Annotated Bibliography. NCJ-45006
Federal Criminal SentenCing: Perspectives 01 Analysis and a Design for Research, NCJ-33683
Varlations!n Federal Criminal Sentences: A Statistical Assessment at the National Level, NCJ-33684
Federal Sentencing Patterns: A Study of Geographical Variations, NCJ-33685
Predicting Sentences In Federal Courts: The Feasibility 01 a Nalional Sentencing Policy. NCJ-33686

U.S. Department of Justlce Bureau of Justice Statistics
Criminal Victimization (1~f New York State Residents 1974-77
A National Crime Survey Report NCJ-66481, SD-NCS-S-1, June 1980
For sale by the Superintendent of Documents, U.S. Government Printing Oftlce, Washington, D.C. 20402
• !.

I
U.S. DEPARTMENT OF JUSTICE Bureau of Justice Statistics
Benjamin H. Renshaw, III Acting Director
Acknowledgements. This report was written by J. Frederick Shenk, Crime Statistics Analysis Staff, Bureau of the Census, under the supervision of Adolfo L. Paez; statistical assistance was provided by Siretta L. Kelly. tn the Bureau or' Justice Statistics, general supervision was supplied by Charles R. Kindermann, assisted by Patsy A. Klaus. Collection and processing of National Crime Survey data is conducted by the Bureau of the Census; at present, the program is under the general supervision of Evan H. Davey, Demographic Surveys Division, assisted by Robert N. Tinari and Robert L. Goodson. The report was reviewed for technical matters in the Statistical Methods Division, under the supervision of Margar~t E. Schooley Hill, assisted by Thomas F. Moore and Lawrence W. Altmayer.

Preface
The crime st.atistics and selected analytical findings presented in this report derive from a household survey conducted under the National Crime Survey (NCS) program. Based on a continuing survey of a representative national sample of households, the program was created to assess the character and extent of selected forms of criminal victimization. The survey was designed and conducted for the National Criminal Justice Information and Statistics Service, Law Enforcement Assistance Administration (succeeded by the Bureau of Justice Statistics) by the U.S. Bureau of the Census. This publication contains data about selected crimes of violence and theft sustained by residents of New York State during 1974-77. It is one of a series of reports that will be issued periodically about victimizations experienced by persons living in some of the Nation's large States.
The NCS focuses on certain criminal offenses, whether completed or attempted, that are of major concern to the general publi.c and law enforcement authorities. For individuals, these offenses are rape, robbery, assault, and personal larceny; and for households, burglary, household larceny, and motor vehicle theft. In addition to measuring the extent to which such crimes occur, the survey permits examination of the characteristics of victims and the circumstances surrounding the criminal acts, exploring, as appropriate, such matters as the relationship between victim and offender, characteristics of offenders, victim self-protection, extent of victim injuries, economic consequences to the victims, time and place of occurrence, use of weapons, whether the police were notified, and, if not, reasons advanced for not informing them.
Although the program has a general objective of d.eveloping insights into the impact of selected crimes upon victims, it is anticipated that the scope of the survey will be modified periodically so as to address other topics in the field of criminal justice. In addition, continuing methodological studies are expected to yield refinements in survey questionnaires and procedures.
The statistical information in this report is based on the New York State portion of the NCS sample. From 1974 through 1977, that segment of the sample yielded interviews with the occupants of about 13,500 housing units per year. Approximately 45 percent of all units where interviews took place were within those parts of the New York City standard metropolitan statistical area (SMSA) that include New York, Kings-Richmond, Bronx, and Queens. An additional 20 percent of the observations were in the Nassau-Rockland-Suffolk-Westchester sector of the SMSA.
Although appropriate for producing State-level estimates of crime, the sample was not suitable, because of its size and design, for generating comparable information for smaller jurisdictions within New York State, such as counties or cities. However, victimization survey data for two central cities within the State (New York City and Buffalo) became available in the mid-1970's, based on surveys conducted independently of the continuous national survey and with substantially different methodologies. Reports based on those and other city surveys are listed inside the front cover of this publication.
NCS results in this report reflect the victimization experience of New York State residents age 12 and over, irrespective of where the crimes occurred. Eliminated from consideration were crimes experienced by State resident~ outside the United States. Because the information was gathered through personal interviews with persons living in the State, crimes against nonresidents (such as tourists, interstate commuters, and foreign visitors) were outside the scope of this report.
For crimes against persons, NCS results are based on either of two units of measure-victimizations or incidents. A victimization is a specific criminal act as it affects a single victim. An incident is a specific criminal act involving one or more victims. For reasons discussed in the Technical Notes (Appendix ly), the number of personal victimizations is somewhat greater than that of the personal incidents. As applied to crimes against households, however, the terms "victimization" and "incident" are synonymous.
All statistical data in this report are estimates subject to both sampling and nonsampling error. Information obtained from sample surveys rather than complete censuses usually is affected by sampling error. Nonsampling error consists of any other kinds of mistakes, such as those resulting from faulty collection or processing; these errors can be expected to occur in the course of any large-scale data collection effort. As part of a discussion of the reliability of estimates, these sources of error are discussed more fully in Appendix III. It should be noted' at the outset, however, that with respect to the effect of sampling error, estimate variations can be determined rather precisely. In the Selected Findings section of this report, categorical statements involving comparisons have met statistical tests that the differences are equivalent to or greater than two standard errors, or, in other words, that the chances are at least 95 out of 100 that each difference described did not result solely from sampling variability; qualified statements of comparison have met significance tests that the differences are within the range of 1.6 to 2 standard errors, or that there is a likelihood equal to at least 90 (but less than 95) out of 100 that the difference noted did not result solely from sampling variability. These conditional statements are characterized by use of the term "some indication" or other equivalent phrase.

-~--
'The 71 data tables in Appendix I of this report display statistics that formed the basis for the selected findings. The three appendixes that follow contain materials to facilitate furt.her analyses and other uses of the data. Appendix II contains a facsimile of the survey que3tionnaire. Appendix III has standard error tables and guidelines for their use. The latter appendix also includes technical information concerning sample design, estimation ,procedures, and sources of nonsampling error. Appendix IV consists of a series of technical notes, covering topics discussed in the selected findings and designed as guides to the interpretation of survey results.
Attempts to compare NCS results with data collected from police agencies by the Federal Bureau of Investigation and published annually in its report, Crime in the United States. Uniform Crime Reports, are inappropriate because of substantial differences in coverage between this survey and police statistics. A major difference arises from the fact that police statistics on the incidence of crime are derived principally from reports that persons
ii
make to the police, whereas NCS data include crimes not reported to the police, as well as those that are reported. As indicated, survey results reflect the experiences of New York residents, even though some of the crimes took' place outside the State, and the data exclude criminal acts committed within the State against nonresidents. On the other hand, State-level police statistics on crime include offenses reported by victims, irrespective of their State or country of residence, to law enforcement units operating within the various New York jurisdictions and exclude crimes experienced by New Yorkers outside their State. Personal crimes covered by the NCS relate only to persons age 12 and over, whereas police statistics count crimes against persons of any age. Furthermore, the survey does not measure some offenses, e.g., homicide, kidnaping, commercia! burglary or robbery, white-r.ollar. crimes, and commercial larceny (shoplifting and employee theft), that are included in police statistics, and the counting and classifying rules for the two programs are not fully compatible.

.\
Contents Preface, i The National Crime Survey,
Crimes against persons, 2 Crimes against households, 3
Selected findings, 5 Victim characteristics, 5
Sex, age, race, and ethnicity, 5 Marital status, 6 Educational attainment, 6 Annual family income, 6 Occupational status, 7 Household size and tenure, 7
Offender characteristics in personal crimes of violence, 8 Strangers or nonstrangers, 8 . Sex, age, and race, 8
Crime characteristics, 9 Time of occurrence, 9 Placl~ of occurrence, 9 Number of offenders, 10 Use of weapons, 10 Victim self-protection, 10 Physical injury to victims, 10 Economic losses, II Worktime lost, II
Reporting crimes to the police, 12 Rates of reporting, 12 Reasons for not reporting, 12
Appendix I Survey data tables, 13
Appendix II Survey instrument, 61
Appendix III Sur.vey methodology and staQdard errors, 70
Source of.¢ata,. 70 Estimation procedure, 70 Series victimizations, 72 Reliability of estimates, 72 Applicatioh and computation of standard errors, 73
Appendix IV Technical notes, 75
Gemmil,75 Victim characteristics, 75 Victim-offender relationship in personal crimes
of violence, 75 Offender characteristics in personal crimes
of violence, 76 Number of victims, 76 Time of occurrence, 76 Place of occurrence, 76 Number of offenders in personal crimes
of violence, 76 . Use of weapons, 76 Victim self-protection, 77 Physical injury to victims, 77 Economic losses, 77 Time lost from work, 77 Reporting victimizations to police, 77
Glossary, 78
Charts A. Percent distribution of victimization, by sector and
type of crime, 1977 4 B. Victimization rates, 1974- 7~ average, 4 C. Crimes of violence. Victimization rates for persons
age 12 and over, by selected characteristics of victims, 1974-1977 average, 4
D. Percent of victimizations reported to the police, 1974-1977 average, 11
iii

The National Crime Survey
The National Crime Survey was designed to develop information not otherwise available on the nature of crime and its impact on society by means of victimization surveys of the general population. Based on a representative sampling of households, the survey elicits information about experiences, if any, with selected crimes of violence and theft, including events that were reported to the police as well as those that were not. By focusing on the victim, the perwn likely to be most aware of details concerning criminal events, the survey generates a variety of data, including information on the effect of such acts and on the circumstances under which they occurred.
As one of the most ambitious efforts yet undertaken for filling some of the gaps in crime data, the NCS is providing the criminal justice community new insights into crime and its victims, complementing other data resources used for planning, evaluation, and analysis. The survey covers many crimes that, for a variety of reasons, are never brought to police attention. It furnishes a means for developing victim profiles and, for identifiable sectors of society, yields information for assessing the relative incidence of victimization. The NCS distinguishes between stranger-to-stranger and domestic violence and between armed and strong-arm assaults and robberies. It is tallying some of the costs of crime in terms of injury or economic loss sustained and providing greater undt!rstanding as to why certain criminal acts are not reported to police authorities. The survey is also furnishing the data necessary for developing indicators sensitive to fluctuations in the level of crime and for comparing the crime situation between two or more types of localities.
The NCS program is not without limitations, however. Although furnishing information on crimes that are of major interest to the general public, it cannot measure all criminal activity, as a number of crimes are not amenable to examination through survey techniques. The survey has proved successful' in estimating crimes with specific victims who understand what happened to them and how it happened and who are willing to report what they know. More specifically, the survey has demonstrated an adequacy for measuring rape, robbery, assault, burglary, personal and household larceny, and motor vehicle theft. Murder and kidnaping are not covered. The so-called
victimless crimes, such as drunkenness, drugabuse,l;lnd prostitution, also are excluded, as are crimes for which it is difficult to identify knowledgeable respondents. Crimes of which the victim may not be aware also cannot be measured effectively. Buying stolen property may fall into this category, as may some instances of fraud and embezzlement. Attempted crimes of many types probably are underrecorded for this reason. Events in which the victim has shown a willingness to participate in illegal activity, such as certain forms of gambling, also are excluded. Finally, businesses and other institutions are precluded from coverage.
The success of any victimization survey is highly contingent on the degree I)f cooperation that the interviewers receive from respondents. During the 1976-77 period, the New York State portion of the NCS yielded completed interviews for 97 percent of the occupants of housing units contacted by Census Bureau interviewers.
Data from the NCS and other victimization surveys are subject to limitations imposed by victim recall, i.e., the ability of respondents to remember incidents befalling them or their households, and by the phenomenon of telescoping, that is, the tendency of ,some respondents to recount incidents occurring outside (usually before) the referenced time frame. Under the' NCS, this tendency is minimized by using a bounding technique, whereby the first interview serves as a benchmark, and summary records of each successive interview aid in avoiding duplicative reporting of criminal victimization experiences; information from the initial interview is not incorporated into the survey results.
Another of the issues related in part to victim reca~l ability involves the so-called series victimizations. Each series consists of three or more criminal events similar, if not identical, in nature and incurred by persons unable to identify separately the details of each nct, or, in some cases, to recount accurately the total number of such acts. Because of this, no attempt is made to collect information on the specific month, or months, of occurrence of series victimizations; instead, such data are attributed to the season, or seasons, of occurrence. Had it been feasible to make a precise tally of crimes that occurred in series, certain rates of victimization would have been somewhat higher. Because of the inability of victims to furnish details concerning individual incidents, however, it would not have been possible to analyze the characteristics and effects of these crimes, thus, the data on series crimes are excluded from the report. Approximately 431,000 series victimizations against New York residents or households, each encompassing at least three separate but undifferentiated events, were estimated to have occurred during a 4-year period commencing with the spring of 1974.
-.,.-,.--
Crimes against persons
Crimes against persons have been divided into two general types: crimes of violence and crimes of theft. I Personal crimes of violence (rape, personal robbery, and assault) all bring the victim into direct contact with the offe'1der. Personal crimes of theft mayor may not involve contact between the victim and offender.
Rape, the most serious and least common of Nesmeasured crimes, is carnal knowledge through the use of force or the threat of force, excluding statutory rape (without force). Both completed and attempted acts are included, and cases of either homosexual or heterosexual rape are counted.
Personal robbery is a crime in which the object is to take property from a person by for.ce or the threat of force. The force employed may be u weapon (armed robbery) or physical power (strong-arm robbery). In eith~r instance, the victim is. placed in p~ysical danger, and physical injury can result. The distinction between robbery with injury and robbery without injury turns solely on whether the victim sustained. any injury, no matter how minor. The distinction between a completed robbery and an attempted robbery centers on whether the victim sustained any loss 0f cash or property. For example, an incideQt might br; classified as an attempted robbery simply because the victin) was not carrying anything of value. when held up at gunpoint. Attempted robberies, however, can be quite serious and can result in severe physical injury to the victim.
The classic image of a robber is that of a masked offender armed with a hanf!r,un and operating against lone pedestrians on a city street at night. Robbery can, of course, occur anywhere, on the street or in t,he home, and at any time. It may be an encounter as dramatic as the one described, or it may involve being pinned briefly to a schrJolyard fence by one classmate while another classmate takes the victim's lunch money.
Assaults are crimes in which the object is to do physical harm to the victim. The conventional forms of assault are "aggravated" and "simple." An assault carried out with a weapon is considered to be an aggravated assault, irrespective of the degree of injury, if any. An assault carried out without a weapon is also an aggravated assault if the .att~\ck results in serious injury. Simple assault occurs when the injury, if any, is minor and .no weapon is used. Within the general category of assault are incidents with results. no more serious than a minor bruise and incidents that bring the victim near death-but only near, because death 'would turn the crime into homicide.
lDelinftions of the measured crimes do not necessarily conform to any Federal or State statutes, which vary considerably. They are, however, compatible with conventional usage and with the, definitions used by·the Federal Bureau of Investigation in its annual. ptiblication Crime in the United States. Uniform Crime Reports. Succinct and precise definitions of the crimes and other terms used in the National Crime Survey reports appear in the glossary at the end of this report.
2
Attempted assaults differ from completed assaults in that in the latter the victim is actually physically attacked and may incur bodily injury .. An attempted assault could be the result of bad aim with a gun or it could be a verbal threat to harm the victim. It is difficult to categorize attempted assault as either aggravated or simple because it is conjectural how much injury, if any, the vi,ctim would have sustaim~d had the assault been carried out. In some instances, there may have been no intent to carry out the crime. Not all threats of harm are issued in earnest; a verbal threat or a menacing gesture may have been all the offender intended. The intent of the offender obviously cannot be measured by a victimization survey. For the NeS, attempted assault with a weapon has been classified as . aggravated assault; attempted assault without a weapon has been considered simple assault.
Although the most fearsome form of assault is the brutal, senseless attack by an unknown assailant, it is also the least common. Much more common is an incident in which the victim is involved in a minor scuffle or a domestic spat. There is reason to believe that incidents of assault stemming from domestic quarrels are underreported in victimization surveys because some victims do not consider such events crimes or are reluctant to implicate family members or relatives, who in some instances may be present during the interview.
Personal crimes of theft (i.e., personal larceny) involve the theft of cash or property by stealth. Such crimes may or may not bring the victim into direct contact with the offender. Personal larceny with contact encompasses pun:e snatching, attempted purse snatching, and pocket picking. Personal larceny without contact entails the theft by stealth of numerous kinds of items, which need not be strictly personal in nature. It is distinguished from household larceny solely by place of occurrence. Whereas the latter transpires only in the home or its immediate environs, the former can take place at any other location. Examples of personal larceny without contact include the theft of a briefcase or umbrella frDm a restaurant, a portable radio from the beach, clothing from an automobile parked in a shopping center, a bicycle from a schoolground, food from a shopping cart in front of a supermarket, etc. Lack of force is a major identifying element in personal larceny. Should, for example, a woman become aware of an attempt to snatch her purse and resist, and should the offender then use force, the crime would be classified as robbery.
In any criminal incident involving crimes against persons, more than one criminal act can take place. A rape may be associated with a robbery, for example. In classifying the survey-measured crimes, each criminal incident has been counted only once, by the most serious act that took place during the incident, ranked in accordance with the seriousness classification system used by the Federal Bureau of Investigation. The order of seriousness for crimes against persons is: rape, robbery, assault, and larceny. Conseque.ntly, if a person were both robbed and assaulted, the event would be classified as

\.
robbery; if the victim suffered physical harm, the crime would be categorized as robbery ';!lith injury.
Crimes against households All three of the measured crimes against households
burglary, .household larceny, and motor vehicle theft.are crimes that do not involve personal confrontation. If there were such confrontation, the crime would be a personal crime, not a household crime, and the vktim no longer would be the household itself, but the member of the household involved in the confrontation: For example, if members of the household surprised a burglar in their home and then were threatened or harmed by the intruder, the act would be classified as assault. If the intruder were to demand or take ~ash and/or property from the household members, the event would classify as robbery.
The most serious crime against households is burglary, the illegal or attempted entry of a structure. The assumption is that the purpose of the entry was to commit a crime, usually theft, but no additional offense need take place for the act to be classified as burglary. The entry may be by force, such as picking a lock, breaking a window, or slashing a screen, or it may be through an unlocked door or an open window. As long as the person
entering had no legal right to be present in the structure, Ii burglary has occurred. Furthermore, the structure need nol be the house itself for a household burglary to take place. Illegal entry of a garage, shed, or any other structure on the premises also constitutes household 'burglary,,"n fact, burglary does not necessarily have to occur on the premises. If the breaking and entering occurred in a hotel or in a vacation residence, it would still be classified as a burglary for the household whose membeu' or members were involved.
As mentioned earlier, household larceny occurs when cash or property is removed from the home or its immediate vicinity by stealth. For a household larceny to occur within the home itself, the thief must be someone with EL right to be there, such as a maid, a delivery person, or a guest. If the person has no right to be there, the crime is a burglary. Household larceny can consist of the theft of jewelry, clothes, lawn furniture, garden hoses, silvf,:rware, etc.
The theft or unauthorized use of motor vehicles, commonly regarded as a specialized form of household larceny, is treated separately in the NCS. Completed as well as attempted acts involving automobiles, trucks, motorcycles, and other vehicles legally entitled to use public streets, are included.
3

4
Chart A. Percent distribution of lIictimizations, by sector and type of crime, 19n
Rape
'-Personal larceny
Assault ~ Personal crimes
o Household crimes
2.692 million victimizations
Chart B. Victimization rates, 1974-n average
Crimes of violence
Personal larceny
Burglary
Household larceny
Motor vehicle
theft
o 40
Personal crimes
Household crimes
80 120 160
Rate per 1 ,000
200 240
Chart C. Crimes of violence: Victimization rates for persons age 12 and over, by selected characteristics of victims, 1974-n average
OVerall violent victimization
Rate per 1,000
100
80 f-
60 I-
40 i"'
16 - 19
Black Men
White
Less Divorced, than Separated $3,000 Unemployed
Employed $25,000 or more
rate, 1974-77: -... --- - - -- -- - ------ ---- ,~------ - ---- -----25.6 20
o
- Women
65+
I Sex Age
NOTE: The differences between rates within categories are statistically significant. Rate differences between categories mayor may not be significant.
·Umited to persons age 16 and over.
Race
Married
Marital status
Victim characteristics
Annual family income
Employment status·

Selected findings The National Crime Survey (NCS) determined that an
estimated 2.7 million victimizations, including both completed and attempted offenses, were incurred by residents of New York State in 1977. Rape, personal robbery, and assault-the most serious of the measured offenses because they involved confrontation bet.ween victim and offender and the threat or act of violencemade up 16 pe<f~nt of the crimes. as shown in Table I (Appendix I). Personal and household larceny, the least serious crimes measured by the NCS, accounted for most of the total (64 percent). The remaining 20 percent of the crimes included motor vehicle thefts and household burglaries. The relative occurrence of these crimes is gauged by means of a statistic known as the victimization rate, which is derived from estimates of the number of victimizations divided by the number of potential victims. The rates for personal crimes are expressed on the basis of the number of victimizations per 1,000 population age 12 and over, and those for household crimes are based on victimizations per 1,000 households. For the population at large, Table 2 displays the victimization rate for each category of crime, as well as for detailed subcategories.
Unlike the frequency counts and percent distributions in Table 1, the victimization rates and percents in all succeeding tables are averaged for the 1974-77 period. In addition, Table 2 presents victimization rates for personal and household crimes for each of the 4 years covered by the survey, and Table 62 depicts yearly police reporting rates. All of the selected findings, however, are derived from estimated averages for the 4 years.
The first section of these selected findings highlights information on the characteristics of victims of personal and household crimes, developed from data Tables 3-18. In the interest of br~vity, the data tables were not fully exploited in preparing these findings, and much of the discussion is confined to general, or summary, crime categories. Individuals wishing to perform more detailed analysis on the topics covered in this section are referred to the Technical Notes (Appendix'IV) for guidance in the interpretation of survey results.
Victim characteristics During the 1974-1977 period, the incidence of personal
crimes of violence (rape, robbery, and assault) against New York State residents was substantially higher among males, persons age 12-24, blacks, and (with less certainty) the poor and the unemployed. Younger persons also were relatively more gl.lsceptible to personal crimes of theft, along with individuals with at least some college training,
members of families with an annual income of $25,000 or more, whites (compared with blacks), and non-Hispanics (compared with Hispanics). '
In regard to NCS household offenses, housing units headed -by person~ age 12-19 had the highest burglary rate, although the evidence of a difference between this and the next older age group was not conclusive, and blacks were burglarized relatively more often than whites. Larceny rates indicated that members of the lowest income group were less susceptible than any other income group. Also, households headed by whites (compared with blacks) or non-Hispanics (compared with Hispanics) were relatively more likely targets for larceny, as were households with more than three members. Motor vehicle theft rates revealed few relationships to household characteristics.
Sex, age, race l and ethnlclty (Tables 3·7 and 12·14)
On average for the 1974-77 period, males living in the State of New York were far more likely than their female counterparts to have been robbed (13 vs. 6 per 1,000) or assaulted (22 vs. II per 1,000). Rape was the least frequent of the major NCS-measured violent offenses, involving an average of I person in every 1,000 for the 4-year period. In regard to the two personal crimes of theft, males also were more susceptible to larceny without contact, but women had a higher rate for larceny with contact, that is, of attempted or completed purse snatchings or pocket pickings.
For personal crimes of violence, New York residents age 50 and over averaged the lowest victimization rate (12 per 1,000). The relatively low violent crime rate for this older age category principally stemmed from an ar.sault rate lower than for any other age group (5 per 1,000). There was no meaningful pattern for robbery rates classified by victim age .. Age, however, was associated with the incidence of personal crimes of tlfeft, in that persons in the eldest age class, 65 and over, recorded the lowest rate, and persons age 50-64 the second-lowest one.
Paralleling yea1'ly NCS findings since 1973 for the Nation as a whole, the comparatively low crime rates among the elderly may be attributable to a number of factors, among them the possibility that senior citizens avoid threatening situations or places because of a fear of crime.2 Attitudinal data gathered under the NCS program during the mid-1970's showed that elderly residents of central cities across the United States (including New York City and Buffalo) had limited or changed their activities because of a fe~r of crime more so than younger persons. In the 1974 attitude survey in New York City, some two-thirds of all respondents age 65 and over, compared with 48 percent of younger persons, said they
lAs indicated in the technical pote on victim characteristics (Appendix. IV), the victimization rate is a highly generalized measure of the occurrence of crime. Because of their method of calculation, the: rates are not refined to the extent that they should be construed to represent precise measures of risk for specific individuals.
5

had modified their lifestyles because of a fear of crime. An identical survey taken in Buffalo a year earlier yielded figures of 49 and 40 percent for the respective groups.J
Whereas relatively low rates for crimes of violence and theft were associated with senior-age residents, no single age group had the highest rate for either category of crime. In generallhough, persons age 12-24 averaged a far higher overall violent crime rate than their older counterparts (43 vs. 19 per 1,000), and also sustained crimes of theft at a greater rate (\05 vs. 60 per 1,(00).
Over the 4-year period, blacks averaged a higher violent crime rate than whites, whereas whites had a higher theft crime rate. The difference for violent crimes chiefly was attributable to the relatively high level of personal robbery inflicted on blacks; the assault rates for the1two racial groups did not differ significantly, The overall personal theft rate for whites, and more specifically, the rate for larcenies without contact, exceeded that for blacks, although there was some jndication that blacks were victimized by personal larcenies with contact at a higher rate than whites.
Consideration of victim sex in conjunctioll with victim race revealed that the burden of violent crime was carried by black males, who were victimized at a rate higher than black women or whites of either sex. The difference between the overa)!. violent crime rate was chiefly the result of an extraordinarily high robbery rate among black men-one that was, for instance, three times that for white males. The robbery rate for white women was the lowest of the four sex-race groups, and they also sustained violent crime at the lowest overall rate, although the difference was statistically less certain when compared with the rate for black women. White males were victimized by personal larceny without contact relatively more often than each of the three other groups.
Calculated from the standpoint of ethnicity, the rates indicated that persons of Hispanic ancestry were victimized by robbery at a higher rate than non-Hispanics (16 \Is. 7 per 1,000); conversely, the latter sustained relativeiy more crimes of theft, principally of the noncontact variety.
Turning to the NCS-measured household crimes, agestructured victimization rates reflected a relatively low level of burglary, larceny, and motor vehicle theft against the elderly. In fact, among age groups for which there was reliable data these householders averaged the lowest rates for the three household crimes. Households headed by young persons (age 12-19) had the highest burglary rate, although the evidence of a difference between the two youngest groups was not conclusive. The sizable burglary rate for these young persons was based on a disproportionately high rate of unlawful entry without force, a rate that was at least three times as large as for any other age
JSee Myths and Realities about CrimI! (Washington, D.C.: U.S. Government Printing Office, 1978), pp. 20-21 and Buffalo: Public Attitudes about Crime (Washington, D.C.: U.S. Government Printing Office, 1979). Figures cited for New York City are based on lI.npublished Bureau of the Census data.
6
group. Unlike burglary, rates for household larceny and motor vehicle theft did not peak for any specific age group .. In general, however, the rates for each of the residential property crimes declined as the age of head of household increased, although apparent differences were not necessarily significant.
Although there was no difference between the rate at which households headea by whites or blacks experienced motor vehicle thefts, race was related to the probability of burglary or household larceny. Black households were more likely to be burglarized by forcible entry than white ones, and, less certainly, by burglary as a whole. Compared with black households, white ones sustained larceny at a higher rate, with the bulk of the difference ce~tering on the less-t~an-$50 range. Relative to their ,Hispanic counterparts, household's headed by nonHispanics clearly experienced larcenies at a higher rate; however, burglary and motor vehicle theft rates for the two groups did not differ.
Marital status (Table 8)
Higher rates were indicated for violent crimes as a whole (and for robbery or assault considered separately) for persons never married and for those divorced or separated, as compared with married or widowed individuals. Although there was no real difference between the overall violent crime rate or the assault rate for persons in the never married and divorced/separated categories, the latter had the highest robbery rate of the four marital status groups. The widowed population had the lowest overall rate for both crimes of violence and crimes of theft.
Educational attainment (Table 10)
Grouping of versons age 25 and over on the basis of the number of years of schooling completed indicated that the two categories with post-secondary education, in comparison to those without, had the greater likelihood of being victimized by personal crimes of theft. On the other hand, violent crime rates as a whole were not clearly related to levels of educational attainment. It should be noted that the educational variable was confined to a population group whose members had for the most part completed their formal education. This procedure excluded persons age 12-24, who, as indicated previously, experienced a disproportionate share of personal victimization.
Annual family Income (Tables 9 and 15)
Members of families in the lowest annual income category (less than $3,000 per year) experienced violent

crimes at the highest average rate, although the difference with respect to the rate for the next income group was not conclusive. In an interesting contrast, members of families f.;:arning less than $10,000 per year were twice as likely to be robbed as those earning $10,000 or more (13 vs. 6 per 1,000), whereas members of the wealthiest families, those with an income of $25,000 or more, were the most vulnerable of the six gn.mps examined to personal crimes of theft. There was little real difference between assault rates for any of the income categories, except that members of the poorest group recorded the highest incidence of assault.
Household crime rates calculated on the basis of annual family income were somewhat more clear cut. Thus, households in the second lowest income group experienced larceny at a rate lower than those for each of the three highest income groups. In addition, households with incomes less than. $3,000 sustained motor vehicle thefts at a rate lower than any other income group except households in the $3,000-$7,499 category, albeit perhaps attributable to limited ownership. For burglary, there were no significant rate differences between income groups.
Occupational status (Table 11)
Among persons age 16 and over who were participants in the civilian labor force, there was some indication that those classified as unemployed had an overall violent crime rate higher than that for employed persons. However, the corresponding rate difference for personal crimes of theft lacked statistical significance. Such also was the case for violent and theft crime rates associated with the various labor force nonparticipant categories. Even though there were scattered rate differences among these groups, no general pattern was apparent for either crimes of violence or theft.
Household size and tenure (Tables 16·18)
Victimization rates for two of three household crimes revealed a substantial relationship to the number of persons living in the household. Those with four or five members, as well as those with six or more persons, experienced the highest larceny rates, although the rates for these two groups did not differ significantly, whereas one-member units had the lowest rate and two-person units had the next lowest. The smallest-sized residences also incurred motor vehicle thefts at the lowest rate, a finding that most likely reflects a lower ownership count for these households. The distribution of burglary rates indicated little if any relationship to number of household members, although there was some indication that the smallest household-size category sustained this crime at a lower rate than homes in the largest one. .
Burglary or motor vehicle theft rates did not differ significantly for homeowners compared with renters, but homeowners experienced relatively more household· larcenies than renters. Furthermore, it was clear that owner-occupied residences were more likely to be victimized by larceny than by burglary, whereas rented dwellings were more apt to be victimized by burglary than larceny.
The relationship between dwelling size, as measured by the number of household units within the structure, and victimization by each of the three household crimes generally was not significant in spite of appearances to the contrary. In addition, no statistical significance was attached to the apparently high incidence of burglary and larceny against residences other than housing units, such as boarding houses. However, proneness to either larceny or burglary was related to dwelling size. That is, singlefamily homes were more likely victims of larceny than burglary. While dwellings containing two, three to four, or five to nine units experienced burglary and larceny at about the same relative levels, the largest structures, those with 10 or more units, were victimized by burglary at a higher rate than by larceny.
7

Offender characteristics in personal crimes of violence
Most crimes against New York State residents were committed by persons not related or known to the victim (strangers) rather than persons acquainted with or related to the victim (nonstrangers). Victimization by strangers was relatively more frequent for men than for women. Besides being strangers, most offenders, whether working alone or with other offenders, were identified as males. Whites were blamed for a relatively larger number of single-offender violent crimes than were blacks, but the two races shared blame for approximately the same proportion of multiple-offender crimes. Offenders were most likely to victimize persons of like age, but crimes in·, volving two or more lawbreakers were characterized by a much higher proportion of offenders under age 21 than those involving single offenders.
Strangers or nonstrangers (Tables 19·23)
Offenses committed by strangers accounted for about three-quarters of all personal crimes of violence and ranged from 67 percent of assaults to 93 percent of personal robberies. For violent crimes as a group, this resulted i,n a rate of 19.6 victimizations per 1,000 persons age 12 and over, compared with a rate of 5.9 per 1,000 for those perpetrated by persons known to the victims, such as acquaintances, friends, or relatives. The stranger-tostranger rates of victimization were higher as well for 'assaults or robberies considered separately.
Examination of the distributions of stranger and nonstranger crime by victim characteristics disclosed few meaningful patterns. For crimes of violence as a whole, male victims clearly were more liable than female victims to have been victimized by strangers. Widowed persons, against whom 96 out of 100 victimizations were committed by strangers, were the most likely of the marital status victims to incur victimization by unknown persons. Otherwise, the proportions of stranger-to-stranger violent crime associated with the various victim income or racial groups revealed no meaningful differences, and, although a few significant differences existed between those proportions recorded for the victim age groups, there w.as no apparent consistent relationship between victim age and relative likelihood of victimization by strangers.
Sex, age, and race (Table", 24·31)
Whether single- or multiple-offender crimes, the large majority of violent personal crimes were committed by males. Females were thought to be the offender in only 11
8
--\~--- -- -- ----'\
percent of single-offender crimes and a nondiffering proportion of multiple-offender crimes, although they shared blame with males in committing a small additional proportion of the latter offenses.
In two-thirds of all single-offender violent victimizations the offender was suspected to have been over age 20, and in most of the remainder, age 12 to 20. Adults comprised the largest share of lone offenders committing a~sault, but there was no real difference between the proportion of robberies committed by the two age groups. About 70 percent of all single-offender rapes were committed by persons age 21 and over.
In contrast to single-offender crimes, those involving two or more lawbreakers were characterized by a much higher proportion of offenders under age 21 (48 percent). Although a much lower proportion of adult offenders appeared to be involved in the latter crimes, as compared with their involvement in single-offender crimes, there was a substantial proportion of cases with offenders of mixed ages. The relatively higher frequency of youth involvement (as compared with older offenders) in multiple-offender crimes of violence applied to robbery or assault considered separately.
Consideration of the age of victims in conjunction with the age of offenders disclosed that the largest proportion of multiple-offender crimes against victims age 12-19 were committed by young offenders (age 12-20), and there was some indication of a similar pattern for singleoffender crimes. By contrast., the largest proportion of violent crime by single offenders against persons age 20 and over was attributed to older offenders (72 vs. 24 percent). However, there was no statistical difference between the proportion of multiple-offender crime committed against these older victims by offenders of the younger compared with the older age range (about 35 percent).
With respect to the racial identity of offenders as perceived by victims, the data indicated that about 56 percent of single-offender violent crimes were committed by whites, 37 percent by blacks, and the remainder by members of other races or by persons of unknown race. Among specific crimes, the largest proportion (64 percent) of rqbberies was committed by blacks, whereas whites inflicted relatively more assaults (67 percent). Rape victims identified their offenders as white or black in proportions that were not significantly different.
Perpetrators of I1lUltiple-offender violent crimes were thought to have been exclusively white or exclusively black in about the same proportion of victir.1izations, whereas multi-racial groups or members of other races were blamed for lesser proportions of these crimes. Considering two of the violent crimes separately. however, the distribution of races for multiple-offender crimes differed: The highest proportion of robberies was ascribed to black offenders, but there was no significant difference between the proportions of assaults attributed to whites and blacks;
Crime characterlstlcl The succeeding sections highlight key characteristics of
the offenses measured by the National Crime Survey. These characteristics may be grouped into two overall categories, namely the circumstances under which the violations occurred (such as time and place of occurrence, number of offenders, victim self-protective measures, and offender weapon use) and the impact of the crime on the, victim, iilcluding physical injury, economic loss, and work time loss. As will be seen, the circumstances under which crimes occ,urred and their impact varied appreciably with the type of offense and the population group examined. For reasons discussed fully in the Technical Notes (Appendix IV), some of the characteristics examined with respect to crimes against persons are based on incident data and others on victimization data. Among the violent personal crimes, victimizations outnumbered incidents by about 16 percent, mainly because some 10 percent of the cases were committed against two or more victims (Tables 32 and 33). Of the three crimes of violence, assault was relatively less likely than personal robbery or rape to have been committed against a single victim.
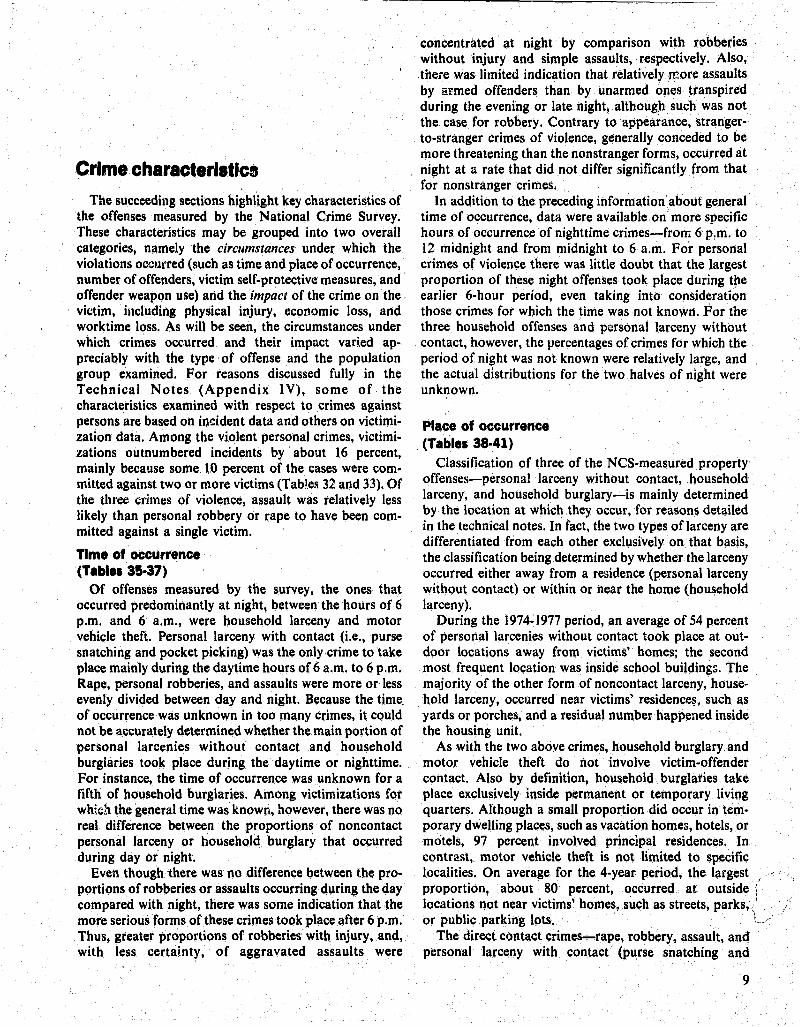
Tim. of occurrence (Tables 35·37)
Of offenses measured by the survey, the ones that occurred predominantly at night, between the hours of 6 p.m. and 6 a.m., were household larceny and motor vehicle theft. Personal larceny with contact (Le., purse snatching and pocket picking) was the only crime to take place mainly during the daytime hours of 6 a.m. to 6 p.m. Rape, personal robberies, and assaults were more or less evenly divided between day and night. Because the time. of occurrence was unknown in too many crimes, it could not be accurately determined whether the main portion of personal larcenies without contact and household burgiaries took place during the daytime or nighttime. For instance, the time of occurrence was unknown for a fifth of household burglaries. Among victimizations for which the general time was known, however, there was no real difference between the proportions of noncontact personal larceny or household burglary that occurred during day or night.
Even though there was no difference between the proportions of robberies or assaults occurring during the day compared with night, there was some indication that the more serious forms of these crimes took place after 6 p.m. Thus, greater proportions of robberies with injury, and, with less certainty, of aggravated assaults were
concentrated at night . by comparison with robbedes without injury and simple assaults, respectively. Also, there was limited indication that relatively. more assaults by armed offenders than by unarmed ones transpired during the evening or late night, although such was not the case for robbery. Contrary to appearance, strangerto-stranger crimes of violence, generally conceded to be more threatening than the nonstranger forms, occurred .at night at a rate that did not differ significantly from that for nonstranger crimes.
In addition to the preceding information about general time of occurrence, data were available on more specific hours of occurrence of nighttime crimes-from 6 p.m. to 12 midnight and from midnight to 6 a.m. For personal crimes of violence there was little doubt that the largest proportion of these night offenses took place during t~e earlier 6-hour period, even taking into consideration those crimes for which the time was not known. For the three household offenses and personal larceny without contact, however, the percentages of crimes for which the period of night was not known were relatively large, and the actual distributions for the two halves of night were unknown.
Place of occurrence (Tables 38·41)
Classification of three of the NCS~measured property offenses-personal larceny without contact, household larceny, and household burglary-is mainly determined by the location at which they occur, for reasons detailed in the technical notes. In fact, the two types of larceny are differentiated from each other exclusively on that basis, thec1assification being determined by whether the larceny occurred either away from a residence (personal larceny without contact) or within or near the home (household larceny).
During the 1974-1977 period, an average of 54 percent of personal larcenies without contact took place at outdoor locations away from victims' homes; the second most frequent location was inside school bUilding:;. The majority of the other form of non contact larceny, household larceny, occurred near victims' residence~, such as yards or porches, and a residual number happened inside the housing unit.
As with the two above crimes, household burglary and motor vehicle theft do not involve victim-offender contact. Also by definition, household burglaries take place exclusively inside permanent or temporary living quarters. Although a small proportion did occur in temporary dwelling places, such as vacation homes, hotels, or motels, 97 percent involved principal residences. In contrast, motor vehicle theft is not limited to specific localities. On average for the 4-year period, the largest proportion, about 80 percent,occurred at outside ( locations not near victims' homes, such as streets, parks, ( or public parking lots.
The direct contact crimes-rape, robbery, assault, and personal larceny with contact (purse snatching and

, pocket picking)-are not limited to prescribed places of , occurrence either. RO,bbery was the most likely of the
three violent crimes to have taken place in the streets, although the difference relative to rape was less substantial. The largest proportion of both robberies and assaults occurr~d at these as compared with other locations, whereas there was no difference between the proportion of' personal larcenies with contact that occurred inside nonresidential buildings or in the streets.
There were no significant differences between the kinds of locations utilized by armed or unarmed offenders for' either robberies or assaults. In regard to robberies, for instance,' about 65 percent of offenders of each type committed t'he crime at 'outdoor locations not near victims' dwellings.
Number of offenders (Table 42)
As previously stated, about 90 percent of measured incidents of violent personal crillle were committed against lone victim!). A smaller majority of violent incidents (59 percent) involved lone offenders as well, but there were notable differences concerning single-versus multiple-offender counts for robbery and assault incidents. Whereas assault was more likely to have been committed by offenders acting alone, the converse was true for robbery. However, robbery with injury was no more likely than robbery without injury to have involved multiple offenders,nor was aggravated assault compared with simple assault.
Use of weapons (Tables 43·44)
As already suggested, an important issue addressed by the survey was whether or n()t offenders were armed. If one or more weapons were, utilized, the victim identified each weapon type. Overall, offenders used weapons in 41 percent of violent incidents. Robberies were relatively more likely to have involved weapons (52 percent) than were assaults (35 percent); the apparently low count of weapons use by rapists was not statistically different from either of these proportions. However, a larger proportion of victims attacked by strangers were confronted
J,. with weapons (45 percent) than those victimized by non strangers (28 percent). Firearms. were used, less frequently in armed violent incidents (20 percent) than knives (40 percent), and there was some suggestion that they were utiliied less often than weapons classified as "other," such as clubs or bottles (33 percent). While the latter two figures were not statistically different, there weremeaningfut contrasts between the two categories when the type of crime was considered. For robbery, offenders used knives relatively more frequently than other weapons, but there was some indication that a larger proportion of aggravated assaults with injury were carried out with these other weapons than with knives. For aggravated assaults without injury, there was no apparent difference in the relative frequenci.es of use of these two weapon types.
IO
Victim self-protection (Table 45-48)
Victims used self-protective measures in a majority of all personal crimes of violence, but that was not the case for personal robberies considered separately. In f!let, victims were relatively less likely to defend them~~ives during the course of robberies (43 percent) than d:i1ring rapes (76 percent) or assaults (69 percent); the apparent difference between the latter ,two proportions was not significant. Overall for crimes of violence, there was some indication that victims were more likely to defend themselves when the offender was a nonstranger than a stranger. "
Examination of race, sex, and age groups for differences in the rate of use of self-protective measures in the course of violent crimes revealed no variation according to sex and only one firm diffe .. ence between two ofthe five age groups; the seeming downward trend with age was not statistically significant. However, whites reported using self-protective measures in proportionally more crimes (64 percent) than did blacks (48 percent), and the difference chiefly was the result of behavior adopted during robberies.
Relative to each of the other five active forms of selfprotection (i.e. excluding nonviolent resistance), there was some tendency for physical force to have been' the. most frequent type utilized. Firearms and knives were used least often by victims in general. While the type of self-protective measure adopted did not vary significantly with race, men invoked physical force proportionally more often than women, who were relatively more apt to try to find help or frighten off the offender.
Physical injury to victims (Tables 49-53)
Victims suffered physical injury in 3 out of every IO personal robbery and assault victimizations. (Whether the crime was completed or not, all rape victims were, classified by the NeS as injured.) Appearances to the contrary, there were no differences in the proportions of injury-producing robberies or assaults against men and women, or against blacks and whites, and few variations by age or income. However, the likelihood of victimsustained injury was greater for nonstranger r()bberies than stranger-to-stranger ones, but this was not repeated for assault.
In some 14 percent of crimes of violence the victims had medical expenses. This, proportion did npt vary significantly whether the offenses were sustained by whites or blacks, or whetheor the crimes involved strangers or nonstrangers. Of the victimizations that led to medical costs, the expenses were more or less evenly divided between the ranges of less than $50, $50-$249, and $250' and more.
Among th()se crimes in which victims were injured, 7 in every 10 involved individuals who had some form of health insurance coverage or were eligible for public medical services. Protection of these general varieties was secured in relatively the same proportions by blacks and

whites and by persons in differing income groupsi In approximately a tenth of all violent offenses, the
victims received hospital care as a result of victimization. While there was no real difference between the rates of hospitalization for the two races, the five age categories, or victims of strangers compared with victims of nOl1strangers, females were more apt than males to receive hospital treatment.
Economic losses (Tables 54·59)
Many of the NCS offenses sustained by individuals or households from 1974 through 1977 resulted in economic loss as measured by theft and/or property damage. For instance, 79 out of 100 personal crimes ~]Od 92 out of 100 household crimes involved such losses. Rape and assault were the only two crimes for which more than half of the victimizations did not result in direct economic loss. 0'0 the other hand, economic loss was sustained in 73 percerit of personal robberies and 95 percent .pf personal larcenies. In the larger proportion of five of the measured crimes, economic losses originated from theft rather than property damage; such was the case for personal robbery or larceny, as well as for each of the three household crimes. By definition there are no theft losses associated . with assault, and the proportion of rape cases involving damage losses was too small to provide reliable data.
About 36 percent of all personal crimes, whether violent or larcenous, and half of all household crimes resulted in theft and/ or ~amage losses of more than $50. A large proportion of motor vehicle theft losses, of course, were in the highest range-some two-thirds resulted in losses of $250 or more. Also, about half of forcible entry burglaries produced economic losses of this amount or more, compared with only 22 percent of unlawful entries without force. Blacks incurred relatively higher economic losses from household crimes than whites (i.e., relatively more crimes valued at $50 or more), principally because of a larger proportion of high-value losses from burglary. But for personal crimes as a whole, there was no meaningful difference by race in the relative number of cases in this loss range.
In addition to being a costly crime, motor vehicle theft was the one most likely to involve complete recovery of theft loss, full recovery having been achieved in some 49 percent of these crimes. In contrast, for the large majority of personal and household crimes there was no loss recovery: Such was the case in roughly 8 of every 10 personal robberies and personal or household larcenies. In general, however, there was at least some or full recompense in a higher proportion of household (26 percent) than personal crimes (20 percent). Comparing white and black victims, there were no meaningful differences in the relative distributions of unrecovered theft losses for either personal or household crimes as a whole.
Losses were replaced by insurance in about two-fifths of personal or household crimes involving theft. Economic losses originating from burglary·,' acrime for which a majority of the losses were valued at $100 or more, were most likely among the household crimes to be recouped solely through insurance. In comparison, losses from household larceny, the majority of which were valued at less than $50, were the most likely of the three household crimes to be recovered by methods not involving insurance compensation.
Worktime lost (Tables 60·61)
Loss of time from work by the victim or another household member occurred as a result of relatively few personal or household victimizations-only about I in 20. As an outgrowth of the three personal crimes of violence considered as a group, worktime was lost in about one-tenth of all cases. For specific crimes, however, the proportions ranged from 25 percent of robberies with injury to about 6 percent of simple assaults. For the household crimes, absence from work was least likely to be an I!;ffect of larceny and most likely of motor vehicle theft, a product perhaps of the inconvenience caused by the loss of transportation.
Among those personal or household crimes that resulted in work nonattendance for victims or other
: household members. approximately half the cases were of I day or more duration. For violent crimes as a group. 7
'out of 10 cases resulted in a day or more of loss, and in 33 percent. 6 or more days were missed.
Chart D. Percent of victimizations reported to the police, 1974-77 average
Rape
Robbery
1 Assault
Personal . larceny
Burglary
Household larceny
Motor vehicle theft
10 20 30 40 50 60 70 80 90 100
Percent reported
II

Rei)ortlng 'crimes to the pollee The rates of reporting violent personal or household
cdmes to the police (51 and 47 percent, respectively) were higher than for personal crimes of theft (28 percent), but did not differ from one another. The proportion of crimes communicated to police officials did not vary appreciably by victim or household characteristic except that persons age 12-19 reported fewer personal crimes of theft than all but possibly one other age group, and homeowners were more likely than renters to give an account to police of household burglaries or larcenies. With one exception, the proportion of household crimes called to police attention rose with the value of the property taken.
Persons who were victimized during the period under study but failed to report the offense, either personal or household, most often stated that nothing could have been done by the police, as there was no proof.
Rates of reporting fTables 62.70) .
On average duringthe 1974-1977 period, about lout of 3 personal crimes occurring to New York State residents were made known to the police. This relatively low percentage resulted mainly from a low reporting rate for personal larcenies (28 percent), a crime which comprised some three-fourths of all personal victimizations. On the contrary, about half of all violent crimes were reported to police officials. However, significance could not be attached to the seemingly different reporting rates for the three major violent crimes-rape, robbery, or assaultconsidered separately~
The overall proportion of rep.0rted household crimes also was reduced by the reporting rate for larceny, only about a third of which were communicated to the police. Otherwise, approximately S5 percent of all household burglaries and 71 percent of motor vehicle thefts came to police attention, and, understandably, motor vehicle theft was the most· likely of the household offenses to have
. been reported to the. police. In general, men and women reported crimes of violence
or of theft at non differing rates, although there. was some indication that women were more likely than men to report personal robberies, chiefly because of a willingness to report a substantially higher proportion of robberies
(I without injury. . The proportions of crimes made known to the police by
12
whites compared with blacks and Hispanics contrasted with non-Hispanics did not differ statistically. For crimes of violence or of theft as a whole, as well as for robbery or assault considered separately, there were no meaningful reporting rate differences for either of the two racial or ethnic groups. In regard to the reporting rates for blacks and whites within the household sector, the same findings prevailed.
In like manner, there was no pattern to the few differences between the rates at which crimes of violence were reported to the police by victims of differing age cohorts. However, theft crime victims age 12-19 reported relatively fewer crimes than any other age group, although the rate difference between the youngest and eldest was less persuasive. Violent or theft crime reporting rates for the elderly (age 6S and over) did not differ statistically from those for other adult age categories. . There were, however, reporting dissimilarities between
persons who owned or were purchasing their dwe!lings compared with those renting. Owners were substantially more likely than their counterparts to report residential larcenies and burglaries, the latter including both forcible and attempted forcible entries, but not unlawful entries without force. On the contrary, there was no difference between the rates at which these two groups reported motor vehicle thefts.
Also evident was a relationship between value of the stolen property and proportion of crimes reported. For the population in general, the proportion of household crimes that came to police attention, with the exception of the apparent difference between the less-than-$1O and the $10-$49 categories, rose with the value of the property taken. Thus, while only 24 percent of household crimes in which the loss was valued at $10-$49 were reported to law enforcement officials, 85 percent of those valued at $250 or more were made known.
On the other hand, analysis of the household crime reporting rates for the various income groups revealed no significant differences in the percentages of burglaries, larcenies, or motor vehicle thefts which were reported.
Reasons for not reporting (Table 71)
Crime victims who did not report their victimizations to police officials were asked to indicate why they did not report. The two most common reasons for not reporting personal or household crimes to the police were, first, that nothing could have been done and, second, that the offense was not important enough to warrant police attention. Within both the personal and household sectors, those two explanations made up more than hillf the total. The least frequent response for each sector was fear of reprisal. " .,
;.
.I

Appendix I
Survey data tables The 71 statistical data tables in this section of the re
port contain results of the National Crime Survey for calendar years 1974-77 for residents of New York State. The tables are grouped along topical lines, generally paralleling the sequence of discussion in the "Selected Findings." All statistical data generated by the survey are estimates that vary in their degree of reliability and are subject to variance, or sampling error, stemming from the fact' that they were derived from surveys rather than complete enumerations. Constraints on interpretation and other uses of the data, as well as guidelines for determining their reliability, are set forth in Appendix III. As a general rule, however, estimates based on zero or about 10 or fewer sample cases have been considered unreliable. Such estimates, qualified by footnotes to the data tables, were not used for analytical purposes in this report. A minimum estimate of 14,000, as well as rates or percentages based on such a figure, was considered reliable.
Victimization rate tables 2 through i8 parenthetically display the average size of each group for which a rate was computed. As with the rates, these control figures are estimates, reflecting estimation adjustments based on independent population estimates. All population, victimization, and incident estimates provided on the data tables are 4-year averages except those on Table I, which
. are for 1977 only, and those on Tables 2 and 62, which are for each of the ·1 years individually.
'Subject matters covered by the data tables are described in the paragraphs below.
General. Table I displays the number and percent distribution of victimizations, whereas Table 2 shows rates of victimiza~ion for 1974 through 1977 as well as the 4-year average. Each table covers all measured crimes,
, pro ken out to the maximum extent possible insofar as the • forms, or subcategories, of each offense are concerned.
.'" Victim characteristics, Tables 3-18. These contain vic.'limization rate figures for ~rimes against persons (3-11) ! ilpd househ9~ds, (12-18). ,
.• ~. Offender characteristics In personal crimes of violence, ,tables 19-31. Five tables (19-23) relate to victim-offender , relationship; the first of these is a rate table, wherea~ the
others are percentage distribution tables reflecting victim characteristics for stranger-to-stranger violent crimes. Of the remaining tables (24-31), six present demographic information on offenders only and two others have such data on both victims and offenders; a basic distinction is
made in these eight tables between single- a'!(l multipleoffender victimization,s.
Crime characteristics, Tables 32-61. The first of th~ tables illustrates the distinction between victimizations and incidents, as the terms relate to crimes against persons. Table 33 displays data on the number of victims per incident, whereas 34 gives incident levels for personal crimes of violence broken out by victim-offender relationship. Topical areas covered by the remaining tables include; time 'of occurrence (35-37); place of occurrence (38-41); number of offenders (42); use of weapons (43-44); victim self-protection (45-48); physical injury to victims (49-53); economic losses (54-59); and time lost from work (60-61). As applicable, the tables cover crimes against persons or households. When the data were compatible in terms of subject matter and variable categories, both sectors were included on a table.
Reporting of victimizations to the. police, Tables 62-71. Information is displayed on the extent of reporting and on reasons for failure to report. The first table in this series provides police reporting rates for 1974 through 1977 and the averaged 4-year rate. All other tables depict averaged data only. Certain tables display data on both the household and personal sectors.
The following is a complete list of table titles.
Gene,al Personal and household crimes
I. Number and percent distribution of victimizations, by sector and type of crime, 1977, 15
2. Victimization rates for persons age 12 and over, by type of crime, 1974-77 average and by year, 16
Victim cha,acterici Personal crimes 3. Victimization rates for persons age 12 and over, by type oi crime and sex
of victims, 1974·77 average, 17 4, Victimization rates for persons age 12 and over, by type of crime and ale
of v,ictims, 1974·77 average, i 8 5. Victimization rates for persons age 12 and over, by type of crime and
race of victims, 1974·77 average, 19 6. Victimization rates for persons age 12 and over, by type of crime and sex
and rac~ of victims, 1974-77 average, 20 7, Victimization rates for persons age 12 and over, by type of crime and
ethnicity of victims, 1974·77 average, 21 8. Victimization rates for persons age 12 and over, by type of crime and
marital status of victims, 1974·77 average, 22 9. Victimization rates for persons age 12 and over, by type of crime and
annual family income of victims, 1974·77 average, 23 10. Victimization rates for persons age 25 and over, by If:vel of educational attainment and type of crime, 1974-77 average, 23 ,II. Victimization rates for persons age 16 and over, by participation in the civilia1!Jabor force, employment status, and type of crime, 1974·77 average, 24 ' -Household crimes 12. Victimization rates, by type of crime and race of head of household, 1974·77 average, 24 13. Victimization rates, by type of crime and ethnicity of head of household, 1974·77 average, 25 14. Victimization rates" by type of crime and ale of head of household, 1974·77 average, 25 15. Victimization rates, by type of crime and annual family income, 1974-77 average, 26 16, Victimization rates, by type of crime and number of persons in household. 1974-71 average, 26 17. Victimization rates, by type of crime. form oftenure. and race of head of household, 1974-77 average, 27 '!
18. Victimization rates, by type of crime and number of units in structure occupied by household. 1974·77 average, 27 Personal crimes of violence 19. Personal crimes of violence: Number of victimizations and victimization rates for persons age 14 and over, by type of crime and victim-ofTender relationship, 1974-77 average, 28
13

~ ----
20. Pe~nt of victimizations involvinlltrangers, by age of victims and ·type of crime, 1974-77 average, 28 .. 21. Percent of victimizations involvinl strangers, by sex and race of victims and type of crime, 1974-77 average, 29 22. Percent of victimizations involving strangers, by marital status of victims and type of crime, 1974-77 aVCrl!!", 29 23. Percent of victimizations involving strangers~ by annual family income of victims and type of crime, 1974-77 a'verage, 30 . 24 .. Percent distribution of single-offender victimizations, by type of crime and perceived sex of offender, 1974-77 averale, 30 25. Percent distribution of single-offender victimizations, by type of crime and perceiv~d age of offender, 1974-71' average, 31 . 26. Percent distribution of single-offen,ier victimizations, by type of crime and perceived ~ace of offender, 1974-77 average, 31 . 27. Percent distribution of single-offen,iler victimizations, by. age of victims and perceived age of offender, 1974-7" average, 32 28. Percent distribution of multiple-ol.Tender victimizations, by type of crime. and perceived sex of offenderslli 1974-77 averale, 32 29. Percent distribution of multiple-oncnder victimzations, by type of crime and perceived age of offenders, 1974-:.17 average, 33 30~ Percent distribution of multiple-offender victimizations, by type of crime and perceived race of offend~f1i, 1974-.17 average, 33 31. Percent distribution of multiple-clffender victimizations, by age of victims and perceived age of offenders, 1974-77 averale, 34
Crime ch.r.cterici Personal crimes
14
32. Number of incidents and victimizations and ratio of incidents to victimizations, by type of crime, 1974-77 Rverage, 34 Personal crimes of violence 33: Percent distribution of incidents, by victim-offender relationship, type of crime, and number of victims, 1974-77 averag". 3S Personal crimes of violence " 34. Number and percent distribution of incidents, by type of crime and victim-offender relationship, 19'74· 7'1 averagfl, 36 Personal and household crimes 35. Percent distribution of incidents, by type of crime and time of occurrence, 1974-77 average, 37 Personal robbery and assault by armed or unarmed offenders 36. Percent distribution of incidents, by type of crime and offender and time of occurrence, 1974-77 average, 38 Personal crimes of violence 37. Percent distribution of incidents, by victim-offender relationship, type of crime, and time of occurrence, 1974-.17 average, 38 Selected personal and household crimes 38. Percent distribution of incidents, by type of crime and place of occurrence, 1974-77 averale, 39 Personal robbery and assault by armed or unarmed offenders 39. Percent distribution of incid~nts, by type of crime and offender and place of oCeurrence, 1974-77 average, 39 Larcenies no/ involving victim-offender con/act 40, Percent distribution of incidents, by type of crime and place of occurrence, 1974-77 average, 40 41. Percent di&tributio",Rf inciden!s, by type of crime, place of occurrence, and value of theft 1055;',,19')4-77 average, 40 Personal crimes of violence 42. Percent distribution of incidents, by type of crime and number of offenders, 1974-77 average, 41 43. Percent of incidents in which offenders used weapons, by type of crime and victim-offender relationship, 1974-77 average, 41 44. Percent distribution of types of weapons used in incidents by armed offenders, by type of crime and type of weapon, 1974-.17 average, 42 45. Percent of victimizations in which victims took self-protective measures, by type of crime and victim-offender relationship, 1974-77 average, 42 46. Percent of victimizations in which victims took self-protective measures, by characteristics of victims and type of crime. 1974-77 average, 43
47. Percent distribuiion of self-protective measures employed by victims, by type of measure and type of crime, 1974·77 average, 43 48. Percent distribution of self-protective measures employed by victims, by selected characteristics of victims, 1974-77 average, 44 Personal robbery and assault 49. Percent of victimizations in which victims sustained physical injury, by selected characteristics of victims and type of crime, 1974-77 average, 44 Personal crimes of violence so. Percent of victimizations in which victims incurred medical expenses, by selected characteristic;s of victims and type of crime, 1974-.17 average, 45 5 I. Percent distribution of victimizations in which victims incurred medical expenses, by type of crime and amount of expenses, 1914-.17 average, 45 52. Percent of victimizations in which injured victims had health insurance coverage or were. eligible for public medical services, by selected characteristics of victims, 1974-77 average, 46 5J. Percent of victimiations in which victims received hospital care, by sei=cted characteristics of victims, 1974-77 average, 46 Personal and household crimes 54. Percent of victimizations resulting in economic loss, by type of crime and type of loss, 1974-77 average, 47 55. Percent distribution of victimizations resulting in economic loss, by race of victims, type of crime, and value of loss, 1974-77 average, 48 Selected personal crimes 56. Percent distribution of victimizations resulting in theft loss, by race of vi.ctims, type of crime, and value of loss, .1974-77 jlvcrage, 49 Personal and household crimes 57. Percent distribution of victimizations resulting in theft loss, by race of victims, type of crime, and proportion of loss recovered, 1974-77 average, 50 58. Percent distribution of victimizations in which theft losses were recovered, by type of crime and method of recovery of loss, '974:n~ver.age, 51 ' Household crimes 59. Percent distribution of victimizations resulting in theft toss, by value of loss and type of crime, 1974-77 average, 51 Personal and household crimes 60. Percent of victimizations resulting in loss of time from work, by type of crime, 1974-77 average, 52 61. Percent distribution of victimizations resulting in loss of time from work, by type of crime and number of days iost, 1974-77 average, 53
Reportlnl to the poilce 62. Percent of victimizations reported to the police, by type of crime, 1974-77 average and by year, 54
Personal crimes 63. Percent oflliclimizations reported to the police, by type of crime and sex of victims, 19·1,~·i7 average, 55 64. Percent or victimizations reported to the police, by type of crime and race of victims, 1974-77 average, 56 65. Percent of victimizations reported to the police, by type of crime and ethnicity of victims, 1974-77 average, 57 66. Percent of victimizations reported to thc police, by type of crime and age of victims, 1974-77 average, 57 Household crimes 67. Percent' of victimizations reported to the police, by type of crime and race of head of household, 1974-77 average, 58 68. Percent of victimizations reported to the police, by type of crime and form of tenure, 1974-77 average, 58 69. Percent of victimiztions reported to the police, by type of crime and annual family income, 1974-77 average, 59 70. Percent of victimizations reported to the police, by value of loss and type of crime, 1974-77 average, 59 Personal and household crimes 71. Percent distribution of reasons for not reporting victimizations to the police, by type of crime, 1974-77 average, 60

-til
Table 1. Persorlal and household crimes: Number and percent distribution of victimizations, by lector and type of crime, 1977
Percent of crimes Sector and type of cdme Number within sector
All crimes 2,692,800
Personal sector 1,662,100 100.0 Crimes of violence " 419,800 25.3
Rape 17,900 1.1 Completed rape '6,400 0.4 Attempted rape '11 ,600 0.7
Robbery 136,600 8.2 Robbery with injury 56,900 3.4
From serious assault 33,100 2.0 From minor assault 23,700 1.4
Hobbery without injury 79,800 4.8 Assault 265,300 16.0
Aggravated assault 100,400 6.0 With injury 39,900 2.4 Attempted assault with weapon 60,500 3.6
Simple assault 164,900 9.9 With injury 34,500 2.1 Attempted assault without weapon 130,400 7.8
Crimes of theft 1,242,300 74.7 Personal larceny with contact 76,400 4.6
Purse snatching 25,500 1.5 Completed purse snatching '12,200 0.7 Attempted purse snatching '13,300 0.8
Pocltet picking 51,000 3.1 Personal larceny without contact 1,165,900 70.1
Total population age 12 and over 14,646,100
Ho\;.~ehold sector 1,030,71)0 100.0 Burglary 437,800 42.5
Forcible entry 147,600 14.3 Unlawful entry without force 190,000 18.4 Attempted forcible entry 100,200 9.7
Household larceny 467,500 45.4 Less than $50 249,400 24.2 $50 or more 169,200 16.4 Amount not available . 21,800 2.1 Attempted larceny 27,100 2.6
t·lotor vehicle theft 125,400 12.2 Completed theft 82',600 8.0 Attempted theft 42,800 4.2
Total number of households 6,551,400
Percent of all crimes
100.0
61..7 15.6 0.7 0.2 0.'4 5.1 2.1 1.2 0.9 3.0 9.9 3.7 1.5 2.2 6.1 1..3 4.8
46.1 2.8 0.9 0.5 0.5 1.9
43.3
38.3 16.3 5.5 7.1 3.7
17.4 9.3 6.3 0.8 1.0 4.7 3.1 1.6
NOTE: Detail may not add to total shown because of rounding. Percent distribution based on un rounded figures. Rel'resents not applicable.
lEstimat~, based on about 10 or fewer sample cases, is statistically unreliable.

-0\
T-* 2. Penonal.nd houc3hold crt .... : Vlctlmlzallon r.t. for penon .... 12 Md over, by type of crime, 1874-77 ........ nd by YHr
Type of crime 1974-77 avel"al',c 1974
Personal sector Crimes of violence 25.6 22.5
Rape 0.9 10.9 Robbery 8.9 7.9
Robbery with injury 2.8 2.8 From serious assault 1.'6 1.7 From minor assault 1.2 1.1
Robbci'Y without injury 6.1 5.1 Assault 15.8 13.7
Aggravated assault 6.3 6.8 With injury 2:6 3.3 Attempted assault with weapon 3.8 3.5
Simple assault 9.5 6.9 With irjury 2.f 1.5 Attempted assault without weapon 6.9 5.5
Crimes of theft 72.7 64.2 Personal larceny with contact 5.5 4.7
Purse snatching 1.9 1.1 Pocket picking 3.6 3.6
Personal larceny without contact 67.2 59.5
Total population'age 12 and over 14,599,600 14,478,100
Household sector Burglary 62.7 63.4
Forcible entry 22.4 24.2 Unlawful entry without force 27.7 28.2 Attempted forcible entry 12.6 I !.I
Household larceny 61.8 52.6 Less than $50 35.0 30.4
-c' • '$50 or .more 20.4 16.4 ": Amount not available 1.9 1.0
Attempted larceny 4.4 4.8 Motor vehicle theft 17.9 17.5
Completed theft 1l.S 9.4 Attempted theft 6.4 8.2
, Total number of households 6,488,600 6,348,200
NOTE: Detail may not add to total shown because of rounding •• IEstimate, based on about 10 or {ewer sample cases, is statistically unreliab~e.
"" -,
1975 1976 1977
26.0 25.0 28.7 10.8 10.5 1.2 9.6 8.7 9.3 2.0 2.5 3.9 1.1 1.2 2.3 0.9 1.3 1.6 7.6 6.2 5.4
15.6 15.8 18.1 6.0 5.7 6.9 1.9 2.3 2.7 4.0 3.4 4.1 9.6 10.1 1l.3 3.8 2.8 2.4 5.8 7.4 8.9
70.3 71.4 84.8 5.5 6.8 5.2 2.3 2.5 1.7 3.2 4.3 3.5
64.8 64.6 79.6
14,595,400 14,67": 400 14,646,100
63.6 57.0 66.8 20.7 22.3 22.5 29.2 24.4 29.0 13.7 10.2 15.3 64.1 58.9 71.4 39.4 32.2 38.1 18.4 20.9 25.8 1.2 2.0 3.3 5.1 3.8 4.1
17.0 17 .9 19.1 11.2 12.7 12.6 5.8 5.2 6.5
6,504,800 6,549,900 6,551,400

-.....
-
Table 3. Personal crI ..... : Victimization rat .. for .,.1'10" ... 12 and over, by IJpe of crime and .. x of victim., 1874-77 aver. .
(Rate per 1,000 population age 12 and over)
Type of crime
Crimes of violence Rape
Completed rape Attempted rape
Robbery Robbery' with injury
From serious assault From minor assault
~obbery without injury Assault
Aggravated assault With injury Attempted assault with weaoon
Simple 'assault With injury Attempted assault without '\veapon
Crimes of theft Personal larceny with contact
Purse snatching Pocket picking
Personal larceny without contact
Male (6,794,200)
34.4 '0.l (lZ)
'0.1 12.7 4.0 2.9 1.1 8.7
21.6 lO.O 4.4 5.6
11.6 3.2 8.4
76.6 2.9
'0.0 2.9
73.6
Female (7,805,400)
17.9 1.5 0.5 1.0 5.6 1.8 0.5 1.3 3.8
10.8 3.1 1.0 2.1 7.7 2.1 5.6
69.3 7.& 3.6 4.2
61.5
NOTE: Detail may not add to total stown because of rounding. Numbers in parentheses refer to population in the group. I
Z Less than 0.05. 'Estimate, based on zero or on about 10 or fewer sample cases, is statistically unreliable.
4 -- 4 .... 224 ....

-00
Table 4. Penonal crimes: Victimization rates for penons age 12 and over, by type of crime and age of victims, 1974-77 average
(Rate per 1,000 population in each ag~ group)
12-15 16-19 20-24 Type of crime (1,329,500) (J ,348,800) (l ,388,100)
Crimes of violence 40.6 50.2 38.1 Rape '1.1 2.9 '1.6 Robbery 13.1 11.6 9.0
Robbery with injury 3.7 2.6- 2.0 From serious assault '1.5 '1.8 '1.0 From minor assault '2.2 '0.8 '1.0
Robbery without assault 9.5 8.9 6.9 Assault 26.3 35.8 27.5
Aggravated assault 9.5 14.8 12.4 With injury 4.2 6.8 5.1 Attempted assault with
weapon 5.3 8.0 7.3 Simple assault 16.9 21.0 15.1
With injury 7.6 6.8 3.0 Attempted assault without
weapon 9.3 14.1 12.1 Crimes of theft 104.0 115.4 94.4
Personal larceny with contact 'I. 7 5.9 6.1 Purse snatching '0.0 '1.3 '2.3 Pocket picking '1.7 4.6 3.7
Personal larceny without contact 102.3 109.4 88.3
25-34 35-49 (2,567,400) (2,941,300)
31.2 19.5 '1.4 '0.3 10.7 7.5 3.8 3.0 2.3 1.6 1.5 1.4 7.0 4.5
19.1 11.6 7.2 4.7 2.3 1.8
4.9 2.9 11.9 7.0 2.8 '1.1
9.1 5.9 84.6 74.5
5.7 5.3 1.8 2.5 3.8 2.9
78.9 69.2
NOTE: Detail may not add to total shown because of rounding. Numbers in parentheses refer to population in the group. 'Estimate, based on zero or on about 10 or fewer sample cases, is statistically unreliable.
50-64 65 and over (2,945,100) (2",079,500)
13.5 10.3 '0.1 '0.0 6.7 7.2 1.9 2.8
'1.2 '1.6 '0.7 '1.2 4.8 4.4 6.7 3.1 2.3 '1.6
'0.9 '0.9
1.4 '0.7 4.4 '1.5
'1.1 '0.5
3.3 '1.0 51.2 23.8 6.6 6.0 2.3 2.1 4.3 4.0
44.6 17.8

-10
-
Table 5. Personal crimes: Victimization rates for persons age 12 and over, by type of crime and race of victims, 1974-77 average
(Rate per I ,000 popul~tion age 12 and over)
Type of crime
Crimes of violence Rape Robbery
Robbery with injury From serious assault From minor assault
Robbery without injury Assault
Aggravated assault With injury Attempted assault with weapon
Simple assault With injury Attempted assault without weapon
Crimes of theft Personal larceny with contact
Purse snatching Pocket picking
Personal larceny without contact
White (12,496,800)
23.5 0.8 7.1 2.1 1.1 0.9 5.0
15.6 5.7 2.4 3.3
10.0 2.6 7.4
74.8 4.9 1.7 3.2
69.9
Black (l ,929,800)
38.3 '1.2 20.4 7.9 4.7 3.3
12.5 16.7 10.1 3.4 6.7 6.5 2.7 3.B
58.7 9.4 3.5 5.9
49.3
NOTE: Detail may not add to total shown because of rounding. Numbers in parentheses refer to population in the group.
lEstimate, based on about 10 or fewer sample cases, is statistically unreliable.

T ..... 8. PenoMI crI ..... : victim_lion ...... for penona .... 12.nd over, by type 01 crime ..,d N •• nd nICe 01 victim., 117.t-77 .¥eI'IIge
IRate per 1,000 population age 12 and over)
Male White Black
Female White Black
Type of crime (5,878,000) (828,400) (6,618,800) (1 ,101 ,400)
Crimes of violence 31.4 55.1 16.5 Rape 10.1 10.0 1.4 Robbery 9.8 33.0 4.7
Robbery with injury 3.0 II. 7 1.3 Robbery without injury 6.9 21.3 3.4
Assault 21.5 22.2 10.2 Aggravated assault 9.1 15.9 2.6 Simple assault 12.4 6.2 7.8
Crimes of theft 78,8 59.8 71.2 Personal larceny with contact 2.5 5.3 7.0 Personal larceny without contact 76.3 54.5 64.3
NOTE: Detail may not add to total shown because of rounding. Numbers in parentheses refer to population in the group.
IEstimate, based on zero or on about 10 or fewer sample cases, is statistically unreliable.
25.6 12.1 11.0
5.2 5.8
12.5 5.8 6.8
57.8 12.4 45.4

---------------~----~-.......... ---------~----
Table 7. Pe..,nal crimes: Victimization rat .. for penons age 12 .nd over, by type of crime and ethnlclty of victim., 1974-77 average
Type of crime
Crimes of violence Rape Robbery
Rpbbery with injury From serious assault From minor assault
.Robbery without injury Assault
Aggravated assault With injury Attempted assault with weapon
Simple assault With injury Attempted assault without weapon
Crimes of theft Personal larceny with contact
Purse snatching Pocket picking
Personal larceny without contact
Hispanic (l ,035,700)
30.2 11.4 15.5 5.3 3.6
'1.7 10.2 13.3 5.2
11.9 13.3 8.1 3.8 4.3
46.9 7.7 3.9 3.8
39.2
Non-Hispanic (13,546,000)
25.2 0.8 6.5 2.6 1.4 1.2 5.8
16.0 6.4 2,6 3.8 9.6 2.5 7.1
74.8 5.4 1.3 3.6
69.4
NOTE: Detail may not add to total shown because of rounding. Numbers in parentheses r~fer to population in the group. .
'Estimate, based on about 10 or fewer sample cases, is statistically .unreliable.
t-.) -
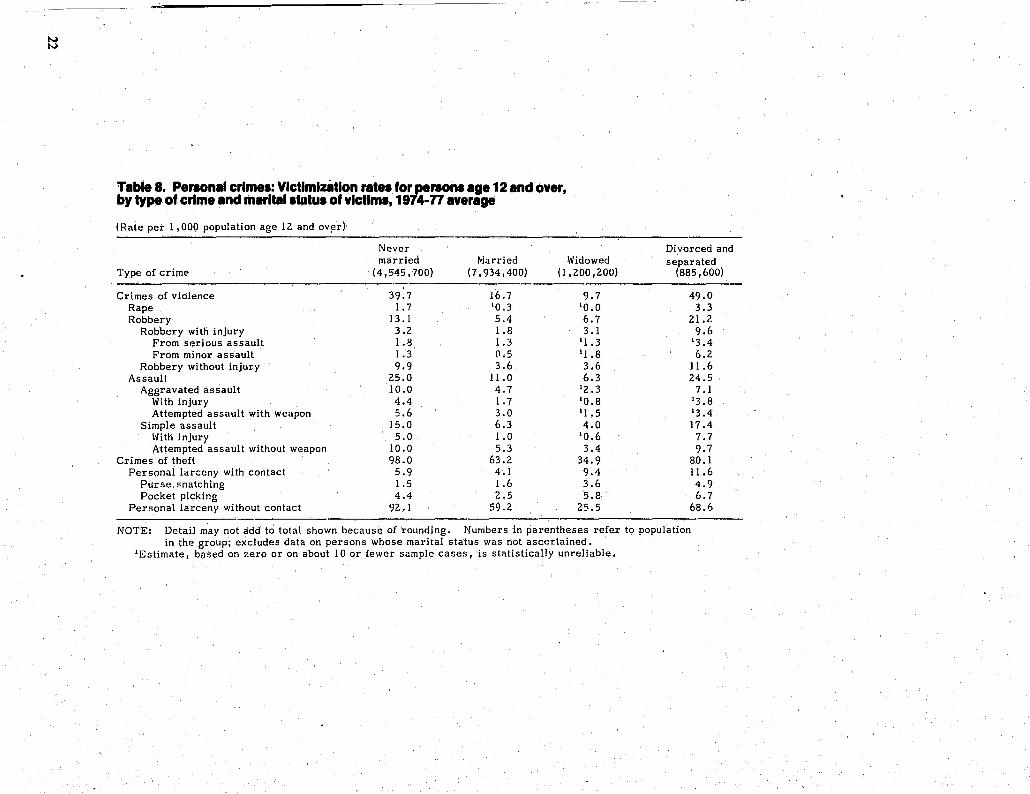
Table 8. Peraonal crimes: Victimization ... t .. for peraons age 12 and over, by type of crime and marital status of victims, 1974-77 average
(Rate per 1,000 population age 12 and ov~r)
Never married Married Widowed
Type of crime (4,545,700) (7,934,400) (l ,200,200)
Crimes of violence 39.7 16.7 9.7 Rape 1.7 '0.3 '0.0 Robbery 13 .1 5.4 6.7
Robbery with injury 3.2 1.8 3.1 From serious assault 1.8 1.3 '1.3 From minor assault 1.3 (l.5 '1.8
Robbery without injury 9.9 3.6 3.6 Assault 25.0 11.0 6.3
Aggravated assault 10.0 4.7 '2.3 With injury 4.4 1.7 '0.8 Attempted assault with weapon 5.6 3.0 '1.5
Simple assault 15.0 6.3 4.0 With injury 5.0 1.0 '0.6 Attempted assault without weapon 10.0 5.3 3.4
Crimes of theft 98.0 63.2 34.9 Personal lar.:eny with contact 5.9 4.1 9.4
Purse gnatching 1.5 1.6 3.6 Pocket picking 4.4 2.5 5.8
Personal larceny without contact 92.1 59.2 25.5
Divorced and separated
(885,600)
49.0 3.3
21.2 9.6
'3.4 6.2
11.6 24.5
7.1 '3.8 '3.4 17 .4 7.7 9.7
80.1 11.6 4.9 6.7
68.6
NOTE: Detail may not add to total shown because of rounding. Numbers in parentheses refer to population in the group; excludes data on persons whose marital status was not ascertained.
'Estimate, based on zero or on about 10 or fewer sample cases, is statistically unreliable.

~ IN
Table 9. Penonal crimes: Vlctlmlzatlon rat .. for persons age 12 and over, by type of crime and annual family Inco~e of victims, 1974-77 average
(Rate per 1,000 population age n and over)
Less than $3,000 $3,000-$7,499 $7,500-$9,999 $10,000-$14,999 Type of crime (703,100) (2,983,200) (I ,452,800) (3,177,800)
Crimes of violence 49.3 31.5 24.7 23.5 Rape 11.4 1.3 11.2 10.6 Robbery 15.6 13.7 11.8 6.7
Robbery with injury 14.7 5.7 3.8 1.7 From serious assault 13.8 3,0 2.6 1.1 From minor assault 10.9 2.7 11.2 10.6
Robbery without injury 10.9 8.0 8.0 5.0 Assault 32.3 16.5 11 :7 16.2
Aggravated assault 8.9 8.0 3.4 5.9 With injury 14.3 3.2 11.1 2.8 Attempted assault with weapon 14.6 4.8 12.2 3.1
Simple assault 23.3 8.6 8.3 10.3 With injury 6.2 3.6 11.4 2.2 Attempted assault without weapon 17.1 5.0 6.9 8.1
Crimes of theft 66.7 54.7 64.6 73.4 Personal larceny with contact 6.6 8.8 5.1 4.1
Purse snatching 13.3 3.8 '0.9 1.2 Pocket picking 13.3 4.9 4.2 2.9
Personal larceny without contact 60.2 45.9 59.5 69.3
$15,000-$24,999 (3,332,200)
21.6 10.5 4.9 1.6
10.8 10.8 3.4
16.2 7.1 3.3 3.8 9.1 2.8 6.3
83.0 3.6
10,8 2.8
79.3
NOTE: Detail may not add to'total shown because of rounding. Numbers in parentheses refer to population in the group; excludes data on persons whose income level was not ascertained.
1Estimate, based on about 10 or fewer sample cases, is statistically unreliable.
Table 10. Personal crimes: Victimization rates for persons aga 25 and over, by level of educational attainment and type of crime, 1974-77 average
(Rate per 1,000 persons age 25 and over)
Robberl Assault Level 01' educational Crimes 01 With Without Crimes attainment violence Rape Total injury injury Total Aggravated Simple theft
Elementary school 0-4 years (417,1-00) 12.1 '0.0 10.3 13.3 17.0 '1.8 '1.8 '0.0 21.0 5-7 years \656,600) 22.7 '0.0 12.4 5.4 7.0 10.3 14.1 6.2 31.5 8 years \1,064,500) 14.2 '0.4 8.6 3.7 4.9 5.3 13.1 12.2 32.4
High school 1-3 years \l ,551,700) 20.0 10.5 8.8 2.7 6.1 10.8 4.6 6.2 49·4 4 years (3,916,200) 15.8 10.6 6.7 3.0 3.7 8.5 3.4 5.1 58.2
College 1-.3 years (1,386,500) 24.7 10.3 7.4 11.4 6.0 17.0 5.7 11.4 84 .. 8 4 years or more (1,625,000) 23.9 10.6 8.2 12.1 6.1 15.1 5.0 10.1 96.9
of
$25,000 or more (1,413,900)
21.6 11.1 6.0
11.2 10.6 10.7 4.8
14.5 5.2
10.6 4.6 9.3
11.6 7.8
110.8 3.8
11.3 2.5
106.9
Personal larcenl With Without contact contact
9.1 12.0 9.3 22.2 6.6 25.8
4.9 44.5 5.5 52.7
5.2 80.6 5.9 90.9
NOTE: Detail may not add to total shown because of rounding. Numbers in parentheses refer to population in the group; exc1ude!i d.ata on· persons age 25 and over whose level of education was not ascertained.
'Estimate, based on zero or or. about 10 or fewer sample cases, is statistically unreliable.
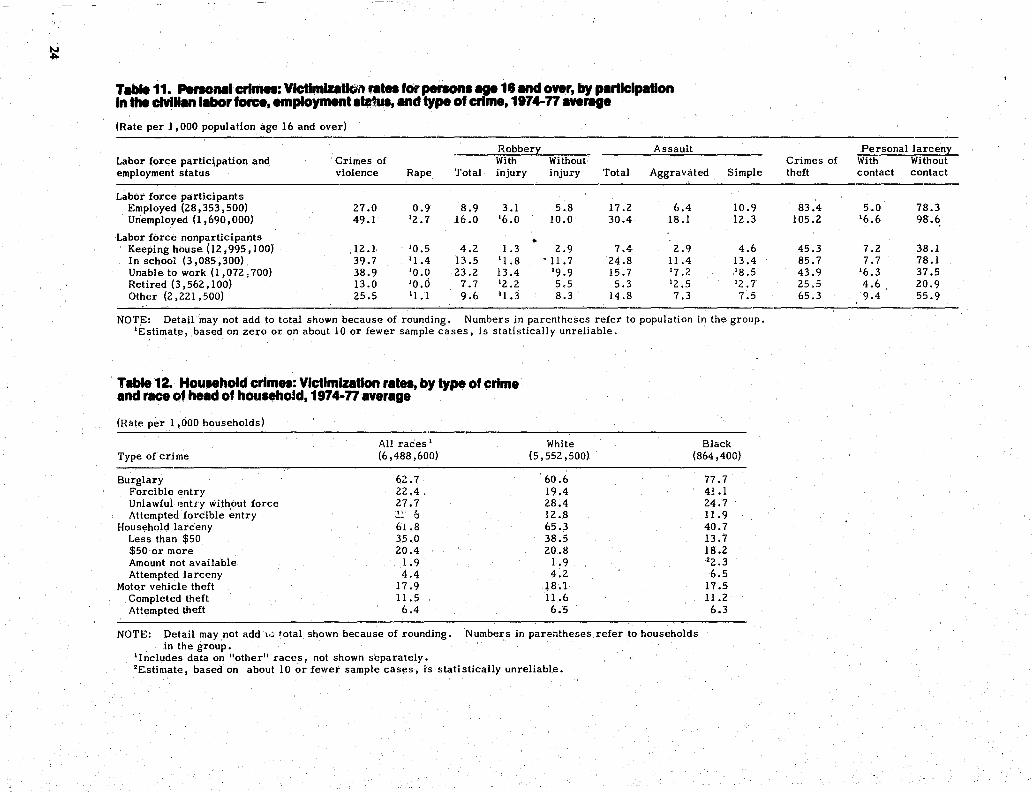
Table 11. PeI'lOllllI crI ..... : VIctImlutIGn flit .. for penon •• 18 lind over, by partlelpalUon In the clvll"n labor forw, employment .a.M, and type of crime, 1974-77 average
(Rate per J ,000 popUlation age 16 and over)
f{obber>:: Assault Labor force partic~pation and Crimes of With Without employment status violence Rape Total injury injury Total Aggravated Simple
Labor force participants Employed (28,353,500) 27.0 0.9 8.9 3.1 5.8 17 .2 6.4 10.9 Unemployed (l,690,000) 49.1 '2.7 16.0 '6.0 10.0 30.4 18.1 12.3
Labor force nonparticipants • Keeping house (12,995,100) 12.1 '0.5 4.2 1.3 2.9 7.4 2.9 4.6 In school (3,085,300) 39.7 '1.4 13.5 '1.8 ' 11.7 24.8 11.4 13.4 Unable to work (I .072,700) 38.9 '0.0 23.2 13.4 '9.9 15.7 '7.2 '8.5 Retired (3,562,100) 13.0 '0.0 7.7 '2.2 5.5 5.3 '2.5 '2.7 Other (2,221,500) 25.5 '1.1 9.6 '1.3 8.3 14.8 7.3 7.5
NOTE: Detail may not add to total shown because of rounding. Numbers in parentheses refer to population in the group. 'E~timate, based on zero or on about 10 or fewer sample cases, is statistically unreliable.
Table 12. Hou~hold crimea: Victimization ratea, by type of crime and race of head of houHhold, 1974-77 average
(Rate per 1,000 households)
All races' White Black Type of crime (6,488,600) (5,552,500) (864,400)
Burglary 62.7 60.6 Forcible entry 22.4. 19.4 Unlawful .~nt:!'y without force 27.7 28.4 Attempted forcible entry 01' e 12.8
Household larceny 61.8 65.3 Less than $50 35.0 38.5 $50 or more 20.4 20.8 Amount not available 1.9 1.9 Attempted larceny 4.4 4.2
Motor vehicle theft 17.9 18.1 Completed theft 11.5 11.6 Attempted theft 6.4 6.5
NOTE: Detail may not add i,,) total shown because of rounding. Numbers in parentheses refer to households in the group.
'Includes data on "other" races, not shown separately. 2E.stimate, based on about 10 or fewer sample cases, is statistically unreliable.
77.7 41.1 24.7 11.9 40.7 13.7 18.2 22.3 6.5
17.5 11.2 6.3
Personal larceny Crimes of With Without theft contact contact
83.4 5.0 78.3 105.2 '6.6 98.~
45.3 7.2 38.1 85.7 7.7 78.1 43.9 '6.3 37.5 25.5 4.6 20.9 65.3 9.4 55.9
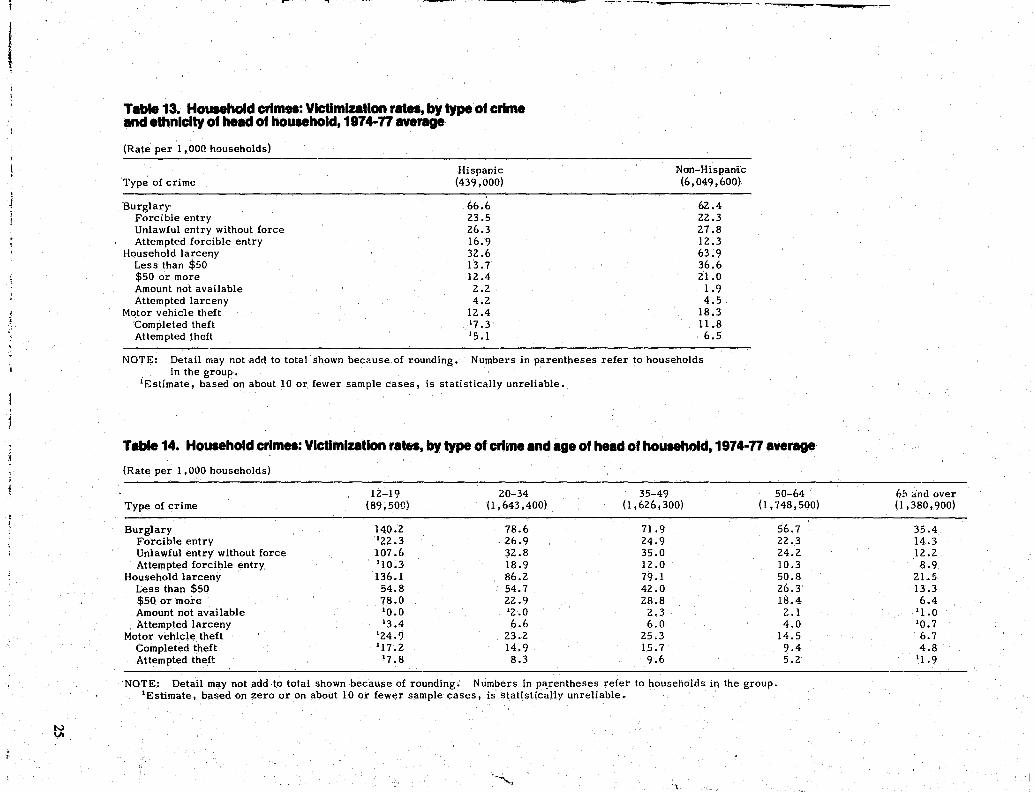
-, ---,- ----------- --~----_.___- ~, -"f""'--- ---~- -----~-------r
tv VI
Table 13. HOUHhoid crimes: Victimization rat .. , by type of crime and ethnlclty of head of household, 1974-77 average
(Rate per 1,000 households)
Type of crime
Burglary Forcible entry Unlawful entry without force Attempted forcible entry
Household larceny Less than $50 $50 or more Amount not available Attempted larceny
Motor vehicle theft Completed theft Attempted theft
Hispanic (439,000)
66.6 23.5 26.3 16.9 32.6 13.7 12.4 2.2 4.2
12.4 '7.3 '5.1
Nan-Hispanic (6,049,600)
62.4 22.3 27.8 12.3 63.9 36.6 21.0
1.9 4.5
18.3 11.8 6.5
NOTE: Detail may not add to total shown because of rounding. Numbers in parentheses refer to households _ in the group. 'Estimate, based on about 10 or fewer sample cases, is statistically unreliable.
Table 14. HOUHhold crlm .. : Victimization rates, by type of crlille and age of head of houHhold, 1974-77 average
(Rate per 1,000 households)
12-19 20-34 35-49 50-64 Type of crime (89,500) (1, 643 ,~OO) (1,626,300) (1,748,500)
Burglary 140.2 78.6 71.9 56.7 Forcible entry '22.3 26.9 24.9 22.3 Unlawful entry without force 107.6 32.8 35.0 24.2 Attempted forcible entry '10:3 18.9 12.0 10.3
Household larceny 136.1 86.2 79.1 50.8 Less than $50 54.8 54.7 42.0 26.3 $50 or more 78.0 22.9 28.8 18.4 Amount not available '0.0 '2.0 2.3 2.1 Attempted larceny '3.4 6.6 6.0 4.0
Motor vehicle theft '24.<) 23.2 25.3 14.5 Completed theft '17.2 14.9 1.5.7 9.4 Attempted theft '7.8 8.3 9.6 5.2
NOTE: Detail may not add-to total shown because of rounding. Numbers in p~rentheses refer to households in the group. 'Estimate, based on zero or on about 10 or fewer sample cases, is' statisticatly unreliable.
1}5 and over (1,380,900)
35.4 14.3 12.2 8.9
21.5 13.3 6.4
'1.0 '0.7 6.7 4.8
'1.9

IV 0'1
J
Table 15. Household crimes: Victimization rates, by type of crime and annual family Income, 1974-77 average
(Rate per 1,000 households)
Less than $3,000 $3 ,000-$ 7,499 $7,500-$9,999 $10,000-$14,999 $15,000-$24,999 $25,000 or more Type of crime (516,200) (1,603,600) (638,300) (1,300,100) (I ,218,100) (493,700)
Burglary 80.4 58.5 67.7 56.6 64.5 75.6 Forcible entry 25.1 24.7 22.3 19.2 23.6 24.0 Unlawful entry without force 34.2 23.8 30.0 23.3 31.7 36.6 Attempted forcible entry 21.1 9.9 15.4 14.1 9.2 15.1
Household larceny 51.4 43.3 64.2 78.7 73.2 75.3 Less than $50 29.1 25.2 36.7 47.0 42.0 34.5 $50 or more 17.7 11.7 24.4 22.9 26.4 32.2 Amount not available 1.6 2.1 '0.0 0.9 1.4 5.3 Attempted larceny 3.0 4.2 3.1 7.9 3.4 3.4
Motor vehicle theft 4.4 8.3 16.1 24.2 27.9 30.8 Completed theft 1.8 5.3 7.2 18.9 17.4 16.6 Attempted theft 2.6 3.0 8.9 4.9 10.5 . 14.1
NOTE: Detail may not add to total shown because of rounding. Number'S in parentheses refer to households in the group; excludes data on persons whose income level was not ascertained.
'Estimate, based on zero or on about 10 or fewer sample cases, is statistically unreliable.
Table 16. Household crimes: Victimization rates, by type of crime and number of persons In household, 1974-77 average
(Rate per 1,000 households)
On~ Two-three Type of crime (1,593,600) "_".(3,045,400)
Burglary 56.5 62.8 Forcible entry 23.5 23.5 Unlawful entry without force 20.2 26.4 Attempted forcible entry 12.9 13.0
Household larceny 29.0 53.5 Less than $50 15.9 31.2 $50 or more 9.3 16.4 Amount not available '1.4 1.7
. Attempted larceny 2.4 4.1 Motor vehi,cle theft 8.1 16.8
Completed theft 4.6 10.2 Attempted theft 3.5 6.6
Four-five . (1,430,600)
64.5 17 .9 36.0 10.7 98.8 57.2 32.5 3.2 6.0
28.1 19.6 8.5
S"ix or more (417,700)
79.3 26.3 38.1 14.8
121.1 60.4 50.9 '0.8 9.1
28.7 19.5
9.2
NOTE: Detail may not add to total shown because of rounding. Numbers in parfmtheses refeI"to'households in the group; excludes data on households whose number of persons could not be ascertained.
'Estimate, based on about 10 or fewer sample cases, is statistically unreliab'le.

N ......
-~--~-~\-.~---
Table 17. HouMhold crlm .. : Victimization ratn. by type of crime. 'orm of tenure. and race of head of houHhold. 1974-77 average
(Rate per 1,000 households)
Owned or being bought Rented All races I White Black All races I White
Type of crime (3,175,300) (2,965,400) (196,400) (3,313,300) (2,587,100)
Burglary 62.8 62.0 76.4 62.6 59.0 Forcible entry 22.0 20.8 47.2 22.3 17.7 Unlawful entry without force 27.6 28.6 214.8 27.8 28.3 Attempted forcible entry 12.7 12.6 214.4 12.5 13.0
Household la.rceny 77 .8 79.3 57.9 46.4 49.4 Less than $50 45.0 47.0 115.7 25.5 28.8 $50 or more 26.3 26.1 29.7 14.8 14.8 Amount not available 2.3 2.1 25.1 1.5 1.5 Attempted larceny 4.3 4.1 27.3 4.6 4.3
Motor vehicle theft 18.9 18.6 24.4 17.0 17.6 Completed theft 12.5 12.6 211.6 10.6 10.5 Attempted theft 6.4 6.0 212.8 6.4 7.1
Black (668,000)
78.1 39.2 27.6 1.1.2 35.7 13.1 14.8 21.5 6.3
15.4 11.1 24.4
NOTE: Detail may not add to total show;: because of rounding. Numbers in parentheses refer to households in the FO~. .
1 Includes data on "other" races, not shown separately; 2Estimate, based on about 10 or fewer sample cases, is statistically unreliable.
Table 18. HOUHhoid crlm .. : Victimization rat ... by type of crime and number of unlll In sal\9cture occupied by hOUHhold. 1974-77 average
(Rate per 1,000 households)
One' Two Three-four Type. of crime (2,830,600) (983,000) (428,800)
Burglary 67.3 42.4 59.7 Forcible entry 24.2 13.7 15.8 Unlawful entry without force 29.8 20.2 28.4 Attempted forcib.le entry 13.4 8.5 15.5
Household larceny 84.9 59.7 61.8 Less tha'n $50 50.5 29.4 43.~
$50 or more 26.6 25;9 15.1 Amount not available 2.4 21.9 21.4 Attempted larceny 5.5 22.5 21.6
Motor vehicle theft 18.4 22.2 18.9 Completed theft U.8 14.1 16.0 Attempted theft 6.6 8.1 23.0
Five-nine (309,800)
89.8 33.0 41.2 15.6 58.2 29.2 16.8 23.0 29.2 13.6
210.6 .l3.Q,
Ten or more (1,847,500)
60.5 24.3 23.5 12.7 27.3 12.8 9.5
21.0 4.0
14.8 8.5 6.3
NOTE: Detail may not add to total shown because of rounding. Numbers in parentheses refer to households in the group; excludes data on households whose number 'of units in structure could not be ascertained.
'Includes data on mobile homes, not shown separately. 2Estimate, based on zero or on about 10 or .fewer sample cases, is statistically unreliable.
Other than housing units
(72,700)
113.0 217.8 86.8 28.4 70.8
J40.6 230.2
20.0 20.0
222.7 29.0
213.6

T.biii 11. 1'9 .... 1 crI ..... of violence: Number of vIctImlZlltlona .nd vletlmlatlon ...... for.......,.. ... 12 Md over, b, type of crInHt Md vlctlm-off .... r ..... tIonahlp, 1.74-77_ ....
~Rate per 1,000 persons age 12 and over~
Type of crime
Crimes of violence Rape Robbery
Robbery with injury From serious assault From minor assault
Robbery without injury Assault
Aggravated assault With injury Attempted assault with weapon
Simple assault \~ith injury Attempt~d assault without weapon
Involving strangers Number Rate
286,800 10,000
121,300 34,900 20,800 14,200 86,300
155,600 66,300 23,900 42,400 89,200 21,700 67,500
19.6 0.7 8.3 2.4 1.4 1.0 5.9
10.7 4.5 1.6 2.9 6.1 1.5 4.6
NOTE: Detail may not. add to total shown because of rounding. IEstimate, based on about 10 or fewer sample cases, is statistically unreliable.
Involving nonstrangers Number Rate
86,400 2,600 8,600 6~200 2,400 3,800 2,400
75,300 25,900 13,500 12,400 49,400 16,200 33,200
5.9 10.2 0.6 0.4
10.2 0.3
10.2 5.2 1.8 0.9 0.8 3.4 1.1 2.3
T ..... 20. PenoMI cr" ...... of violence: Percent of vIctImlZlltlonllnvolvlng :in ..... , by ... of vIdImI Mel.,.,. of crime, 1174-77 ..,.,....
Robber;i With Without
Age Crimes of violence 1 Total injury injury Total
All ages 76.8 93.4 "84.9 97.4 67.4 12-15 67.2 91.2 "68.4 100.0 55.1 16-19 12.7 87.3 "64.0 94.2 66.6 20-24 77.4 92.5 "77.4 96.9 12.5 25-34 79.2 85.6 83.2 93.9 73.9 35-49 75.9 95.1 87.7 100.0 62;8 50-64 83.4 98.5 100.0 97.9 68.1 65 and over 94.4 100.0 100.0 100.0 81.5
1 I neludes data on rape, not shown separately. "Estimate, based on about 10 or fewer sample cases, is statistically unreliable.
Assault
Aggravated Simple
71.9 64.4 67.5 48.2 68.7 65.1 68.5 67.7 77.8 71.6 63.6 62.3 68.2 68.0
183.4 1 79.3

Table 21. Peraonal crimes of violence: Percent of vlctlmlzaUonllnvolvint sttiingenJ, by NX and race of victims and type of crime, 1974-77 average
Robberr With Without
Sex and race' Crimes of violence 1 Total injury injury
Both sexes White 76.3 92.5 82.0 96.8 Black 78.5 95.2 90.0 98.4
Male 80.6 93.9 87.7 96.7 White 79.5 92.2 83.2 96.1. Black 85.4 97.0 95.4 97.9
Female 70.5 90.0 80.0 98.5 White 71.1 93.0 79.4 98,,0 Black 67.3 90.9 80.7 100.0
lIncludes data on rapl}, not shown separately. 'Estimate, based on about 10 C!r fewer sample cases, is statisticall y unreliable.
Table 22. Penonal crimea of violence: Percent of vlctlmlzatlonllnvolvlng It~ngftrl, by maritaiitalul of vlcllmland type of crime, 1974-77 average
Robber):: With Without
Marital status Crimes of violence 1 Total injury injury
Never married 75.2 94.1 80.4 98.5 Married 80.1 92.7 86.8 95.7 Widowed 95.7 100.0 100.0 100.0 Separated or divorced 68.0 89.9 83.0 95.5
lInc.1udes data on rape, not shown separately. 'Estimate. based on about 10 or fewer sample cases. is statistically unreliable.
----.-1'""" - .. , ,.-----
Assault
Total Aggravated Simple
68.6 75.2 64.8 60. ! 60.9 58.6
72.8 75.9 70.1 73.5 78.7 69.7 68.2 64.0 78.7
57.9 60.7 56.8 59.5 64.1 58.0 49.3 254.6 244.8
AssiluH
Total Aggravated Simple
64.8 6?6 61.5 73.7 '18.4 70.3 91.4 281).4 93.2 49.1 250.4 48.5

T ..... 23. ,...,...1 crImn of violence, Percenl of vlctlmlullons Involving .1,. .... ,., by .nn .... fam", Income of victim •• nd type of crime, 1174-77 av ...
Robber~ Annual family With Without income Crimes of violence I Total injury injury
Less than $3,000 73.1 91.5 271.6 100.0 $3,000-$7,499 73.5 90.8 83.9 95.6 $7,500-$9,999 81.9 97.9 100.0 96.8 $10,000-$14,999 75.7 91.1 65.4 100.0 $15,000-$l4,999 80.0 98.0 100.0 97.1 $25,000 and over 78.3 85.0 263.6 90.6
Iinciudes data on rape, not shown separately. 2Estimate, based on about 10 or fewer sample cases, is statistically unreliable.
T.bIe 24. Penonal crimea of violence: Percenl dl.lrlbutlon 'of .Ingle-offender victimization., by type of crime .nd perceived 18. of offen iter ,'1974-77 .ver ...
Perceived, sex of offender
Total
65.0 61.4 64.0 68.4 74.0 74.0
Not known and Type of crime
Crimes of violence Rape Robbery
Robbery with injury Robbery without injur·y
Assault Aggravated assault Simple assault
Total
100.0 100.0 100.0 100.0 100.0 100.0 100.0 100.0
Male
88.7 100.0 95.2 90.8 97.4 85.5 88.5 83.8
NOTE: Detail may not add to total shown because of rounding.
Female 'not available
11.0 10.0 14.8 19.2 12.6 14.0 10.1 16.2
10.4 10.0 10.0 10.0 10.0 10.5 11.4 10.0
lEstimate', based on zero or on about 10 or fewer sample cases, is statistically unreliable.
Assault
Aggravated Simple
70.7 62.8 72.3 51.2
261.7 64.9 74.3 65.1 73.5 74.3 81.9 69.6
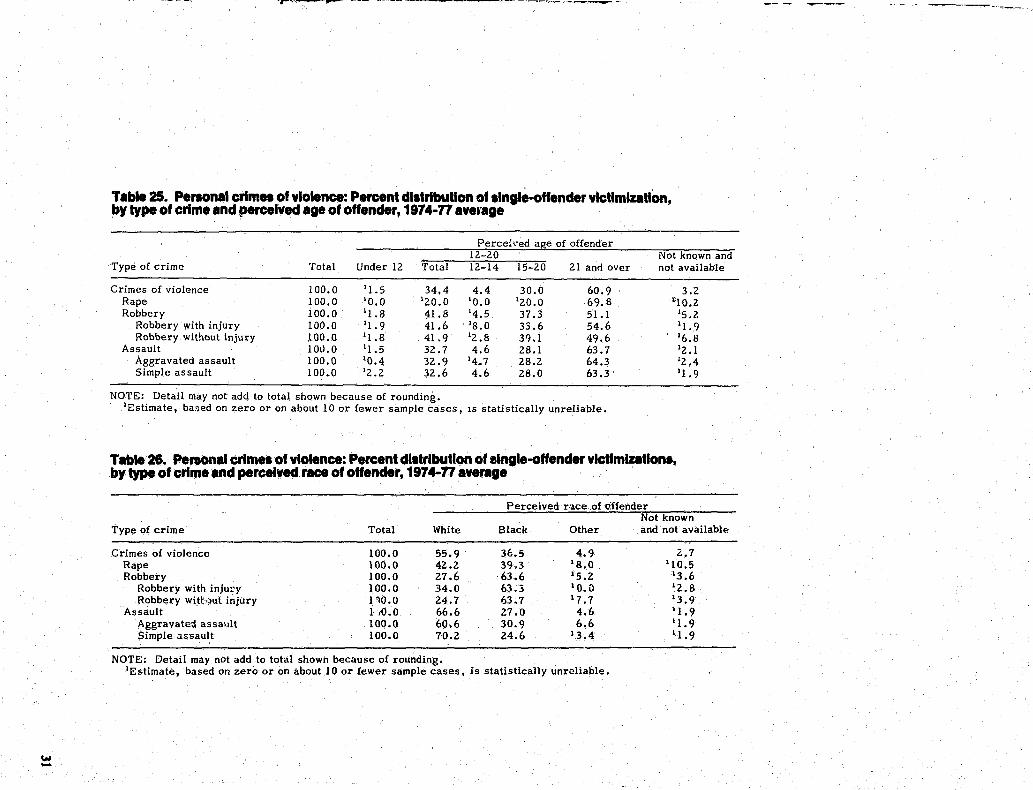
w -
Table 25. Penonal crlm .. of violence: Percent dlltrlbullon of Iingle-offender victimization, by type of crime and perceived age of offender, 1974-77 avel'age
Perceived age of offender 12-20 Not known and
Type of crime Total Under 12 ·Total 12-14 15-20 21 and over not available
Crimes of violence 100.0 11.5 34.4 4.4 30.0 60.9 3.2 Rape 100.0 10.0 120.0 10.0 120.0 69.8 1:10.2 Robbery 100.0 11.8 ~1.8 14.5 37.3 51.1 15.2
Robbery with injury 100.0 '1.9 41.6 'S.O 33.6 54.6 11.9 Robbery without injury 100.0 11.8 4l.9 '2.8 39.1 49.6 16.8
Assault 10u.0 '1.5 32.7 4.6 2B.l 63.7 12.1 Aggravated assault 100.0 '0.4 32.9 14.7 28.2 64.3 12.4 Simple assault 100.0 '2.2 32.6 4.6 28.0 63.3 11.9
NOTE: Detail may not add to total shown because of rounding. IEstimate, based on zero or on about 10 or fewer sample cases, IS statistically unreliable.
Table 26. Penonal crimea of violence: Percent dlltrlbutlon of elngle-offender victimization •• by type of crime and perceived race of offender, 1974-77 average
Perceived r:.lce.ofofiender Not known
Type of crime Total White Black Other and "not available
Crimes of violence 100.0 55.9 36.5 4.9 2.7 Rape 100.0 42.2 39,3 18.0 110.5 Robbery 100.0 27.6 -63.6 15.2 13.6
Robbery with injury 100.0 34.0 63.3 10.0 12.8 Robbery wi.t~.)ut injury 1 '10.0 24.7 63.7 17.7 13.9
Assault 1/0.0 66.6 27.0 4.6 '1.9 Aggravatan assault 100.0 60.6 30.9 6.6 '1.9 Simple assault 100.0 70.2 24.6 13.4 11.9
NOTE: Detail may not add to total shown because of rounding. IEstimate, based on zero or on about 10 or fewer sample cases, is statistically unreliable.
-.----~--:-

Table 27. Pel"lOnal crimes of violence: Percent distribution of slngle-offender victimizations, by age of victims and perceived age of offender, 1974-77 average
Percei ved age of offender Not. known and
Age of victims Total Under 12 12-20 21 and over not available
12-19 100.0 11. 7 58.9 35.8 13.7 20-34 100.0 11.5 19.6 76.5 12.4 35-49 100.0 '10.0 31.0 62.3 16.7 50-64 100.0 11.5 23.3 75.3 10.0 65 and over 100.0 16.1 137.7 52.6 13.6
NOTE: Detail may not add to total shown because of roundi ng. IEstimate, based on zero or on about 10 or fewer sample cases, is statistically unreliable.
Table 28. Personal crimes of violence: Percent distribution of multlpla-offender victimizations, by type of crime and perceived sex of offendeR, 1974-77 average
Pe.rceived sex of offenders Not known and
Type of crime Total All male All female Male and female not availab.le
Crimes of violence 100.0 85.8 6.2 6.0 12.0 Rape 100.0 1100.0 10.0 10.0 '0.0 Robbery 100.0 89.7 12.9 '4.8 '2.6
Robbery with injury 100.0 90.2 '2.9 '5.3 '1.7 Robbery without injury 100.0 89.5 '2.9 '4.5 '3.1
Assault 100.0 80.8 10.2 7.7 '1.3 Aggravated assault 100.0 90.6 '2.6 '5.2 '1.6 Simple assault 100.0 73.9 15.6 '9.4 '1.1
NOTE: Detail may not add to total shown because of rounding. IEstimate, based on zero or on about 10 or fewer sample cases, is statistically unreliable.

--.. ~-- ---~-------. ~---'~-~"'I''r~-----'r--~ ---__._-,- - - - -' - --- ---- _.-'
Ta.,.. 21. PenoMI crlm .. of violence: Percent cIIltrlbuUon of multlple-offender vIctImluUonI, by type of crtme and perceived. of offende.., 1814-77 aer.
Perceived age of offenders Not known and
Type of crime Total All under 12 All 12-20 All 21 and over Mixed ages not available
Crimes of violence 100.0 '1.2 47.S 25.4 20.3 4.S Rape 100.0 '0.0 '27.S '58.1 '0.0 '14.1 Robbery 100.0 10.8 47.S 26.3 IS.2 6.9
Robbery with injury 100.0 '1.4 4S.3 21.4 22.S '6.1 Robbez:y without injury 100.0 '0.6 47.6 2S.6 16.0 7.2
Assault 100.0 'I. 7 4S.4 23.4 24.2 '2.3 Aggravated assault 100.0 '0.9 43.6 24.8 27.5 '3.2 Simple assault 100.0 '2.3 52.2 22.2 21.7 '1.6
NOTE: Detail may not add to total shown because of rounding. 'l!;stimate, based on zero or on about 10 or fewer sample cases, is statistically unreliable.
Table 30. Penonal crlm .. of violence: Percent dlltrlbutlon of multlple-offender vlctlmlutlonl, by type of crime and perceived race of offenders. 1974-77 average
Perceived race of offenders Not known and
Type of crime Total All white All black All other Mixed races not available
Crimes of violence 100.0 38.S 47.4 3.6 6.0 4.2 Rape 100.0 '74.5 '12.4 '0.0 '13.1 '0.0 Robbery 100.0 23.0 60.4 13.6 7.2 5.8
Robbery with injury 100.0 24.6 60.5 '1.4 IS.9 '4.6 Robbery without injury 100.0 22.3 60.3 '4.6 '6.4 '6.4
Assault 100.0 53.9 35.1 '3.S '4.5 '2.7 Aggravated assault 100.0 49.7 34.3 '7.6 '3.2 '5.2 Simple assault 100.0 57.3 35.7 '0.7 '5.5 'O.S
NOTE: Detail may not add to total shown because of rounding. 'Estimate, based on zero or on about 10 or (eWer sample cases, is statistically unreliable.

Table 31. Panonal crl ..... of violence: Percent dl.trlbutlon of multlple-offender victimization., by age of victim. and perceived age of offendera, 1974-77 aver.
Perceived age of offenders Age of victims Total All under 12 All 12-20 All 21 and over
12-19 100.0 11.2 68.8 11.1 20-34 100.0 10.7 36.4 32.9 35-49 100.0 12.6 30.2 35.4 50-64 100.0 II. 7 38.1 34.9 65 and over 100.0 10.0 42.3 130.2
NOTE: Detail may not add to total shown because of rounding. IEstimate, based on zero or on about 10 or fewer sample cases, is statistically unreliable.
Table 32. Penonal crimea: Number of Incldenla and victimization. and ratio of Incldenla to victimization., by type of crime, 1974-77 average
Type of crime
Crimes of violence Rape
Completed rape Attempted rape
Robbery Robbery with injury
From serious assault From minor assault
Robbery without injury Assault
Aggravated assault With injury Attempted assault with weapon
Simple assault With injury Attempted assault without weapon
Crimes of· theft Personal larceny with contact
Purse snatching Completed purse snatching Attempted purse snatching
Pocket picking -Personal larceny ',yithout contact
Incid"nts
320,500 12,100 4,400 7,700
114,500 38,300 21,800 16,500 76,300
193,900 73,400 31,900 41,500
120,500 32,900 87,700
1,015,950 75,900 27,100 16,100 11,000 48,800
940,075
NOTE: Detail may not add to total shown because of rounding.
Victimizations
373,200 12,500 4,600 7,900
129,800 41,200 23,200 18,000 88,700
230,900 92,200 37,400 54,900
138,600 37,900
100,700 1,061,500
81,000 27,900 16,300 11 ,600 5,3,100
980,500
Mixed ages
Ratio
1: 1.16 1:1.04 1:1.06 1:1. 02 1: 1 .13 1:1. 08 1:1.06 1:1.09 1: 1.16 1:1.19 1 :1.26 1:1.17 1:1.32 1:1.15 1:1.15 1: 1.15 1:1.04 1:1.07 1:1.03 1:1.02 1:1. 01 1: 1. 09 1:1.04
17.8 24.5 25.9
115.5 118.8
Not known and not available
11.1 15.6 16.0 19.8 18.8

~~~ ~ - ---- ------------...,"'r---- ----~--- ~~..".,.-~-- ~--
Table 33. Penonal crimes of violence: Percent distribution of Incidents, by vlctlm-offender relationship, type of crime, and number of victims, 1974 .. 77 average
Two Relationship and type of crime Total One or more
All incidents Crimes of violence 100.0 90.Z 9.8"
Rape 100.0 97.7 IZ.3 Robbery 100.0 94.3 5.7
Robbery with injury 100.0 95.Z 14.8 Robbery without injury 100.0 93.8 6.Z
Assault 100.0 87.4 1Z.6 Aggravated assault 100.0 84.3 15.7 Simple assault 100.0 89.3 10.7
Involving strangers Crimes of violence 100.0 90.1 9.9
Rape 100.0 97.0 IZ·.9 Robbery 100.0 94.5 5.5
Robbery with injury 100.0 96.4 13.6, Robbery without injury 100.0 93.6 6.4
Assault 100.0 86.0 14.0 Aggravated assault 100.0 83.0 17.0 Simple assault 100.0 88.0 lZ.0
Involving non strangers Crimes of violence 100.0 90.6 9.4
Rape 100.0 1100.0 10.0 Robbery 100.0 91.5 18.5
Robbery with injury 100.0 87.6 I1Z.4 Robbery without injury 100.0 1100.0 10.0
Assault 100.0 90.1 9.9 Aggravated assault 100.0 87.3 l1Z.7 Simple assault 100.0 91.5 8.5
NOTE: Detail may not add to total shown because of rounding. lEstimate, based on zero or on about 10 or fewer sample cases, is statistically unreliable.

-------
Table 34. Pel'Hnal crl ..... of violence: Number.and percent dlltrlbutlon of Inclden .. , by type of crime and vlctlm-off~nder relatlclMhlp, 1974-77 average
All incidents Involving strangers Type oC crime Number Percent Number Percent
Crimes of violence 320,500 100.0 244,400 76.3 Rape 12,100 100.0 9,500 79.0 Robbery 114,500 100.0 107,000 93.4
Robbery with injury 38,300 100.0 33,100 86.5 From serious assault 21,800 100.0 19,600 89.9 From mirlOr assa'ult 16,500 100.0 13,500 81.9
Robbery without injury 76,300 100.0 73,900 96.9 Assault 193,900 100.0 127,900 66.0
Aggravated assault 73,400 100.0 51,400 70.0 With injury 31,900 100.0 20,200 63.4 Attempted ass,ault with weapon 41,500 100.0 31 ,200 75.1
Simple assault 120,500 100.0 76,500 63.5 With injury 32,900 100.0 18,500 56.4 Attempted assault without weapon 87,700 100.0 58,000 66.2
NOTE: Detail may not add to total shown because of rounding. lEstimate, base,d on about 10 or fewer sample cases, is statistically unreliable.
Involving nonstrangers Number Percent
76,100 23.7 2,500 121.0 7,600 6.6 5,200 13.5 2,200 110.1 3,000 118.1 2,400 ,!3.1
66,000 34.0 22,000 30.0 11,700 36.6 10,400 24.9 44,000 36.5 14,300 43.6 29,700 33.8

__ -.",", -------'4----.. =_--_ .... __ 'P_---_--_____ ..,... ____ ..... ,.... __ ~~ ____ -,-_ -.~ ___ (I -
TI"" 35.. PeI'lOlllI and houHhold crl ..... : Percent .... trlbutton of Inclcllnta, by type of crl .... IftdtlmeofoccumtnCe, 1974-77~". '" '
Daytime Nighttime Not known and Type of crime Total 6 a.m.-6.p.m: Total 6 p.m.-midnight Midnight-6 a.m. Not known not available
All personal crimes 100.0 48.9 43.5 24.9 12.9 5.8 7.5
Crimes of violence 100.0 47.9 51.3 39.0 12.2 10.1 10.9 Rape 100.0 31.4 65.5 44.9 120.6 10.0 13.1 Robbery 100.0 45.8 53.5 41.2 12.0 '0.3 '0.7
Rohbery with injury 100.0 36.6 63.4 50.3 13.1 10.0 '0.0 From serious assault 100.0 31.3 68.7 54.8 ID.9 to.O 10.0 From minor assault 100.0 43.6 56.4 44.3 '12.1 '0.0 10.0
Robbery without injury 100.0 50.4 48.6 36.7 11.5 ,10.4 '0.7 Assault 100.0 50.1 49.0 37.2 11.8 '0.0 10.8
Aggravated assault 100.0 4Z.4 57.1 40.2 16.9 '0.0 10.4 With injury 100.0 42.1 56~9 37.4 19.4 '0.0 11.0 Attempted assault with weapon 100.0 42.6 57.4 42.4 15.0 '0.0 10.0
Simple assault 100.0 54.8 44.1 35.4 8.7 '0.0 11.1 With injury 100.0 53.6 46.4 33.6 12.7 '0.0 '0.0 Attempted assault without weapon 100.0 55.3 43.3 36.1 7.2 10.0 '1.5
Crimes of theft 100.0 49.3 41.1 20.4 13.1 7.6 9.6 Personal larceny with contact 100.0 71.6 27.0 24.8 12.2 10.0 '1.4
Purse snatching 100.0 68.5 31.5 30.3 11.2 '0.0 10.0 Pocket picking 100.0 73.3 24.5 21.7 12.8 10.0 '2.2
Perso~~ larceny without contact 100.0 47,5 42.2 20.1 13.9 8.2 10.3
AWhousehold crimes ii - ,': 100.0 30.3 52.2 1.9.9 21.1 11.1 17 .5
Burglar>\, 100.0 38.0 41.3 18.9 13.5 9.0 20.7 ,Forci ble~entry. 100.0 41.2 41.0 20.7 12.0 8.3 17.8 Unlawful entry without force 100.0 37.2 38.4 15.8 13.6 9.0 24.4 Attempted forcible entry 100.0 33.9 48.4 22.3 15.9 10.1 17.7
Household larc,eny 100.0 25.4 57.7 19.6 25.6 12.5 16.9 Less that $50 100.0 24.0 57.4 20.0 23.0 14.3 18.6 $50 or more l.00.0 27.7 55.6 17.5 28.9 9.2 16.8 Amount not available 100.0- 41.3 40.3 15.1 121.9 '13.3 118.4 Attempted larceny 100~0 19.4 77.1 31.8 32.0 13.3 13.5
Motor vehicle theft 100.0 20.4 71.2 24.8 32.5 13.9 8.4 Completed theft 100.0 20.0 73.2 26.8 32.2 14.3 6.8 Attempted theft 100.,0 21.2 67.5 21.3 33..1 13.1 11 •. 3
., NOTE:' Detail may not add to total shdwn because cjf rounding. (,;
IEstimate, based on zero or on about 10 or'iewer sample cases, is statistically unreliable.
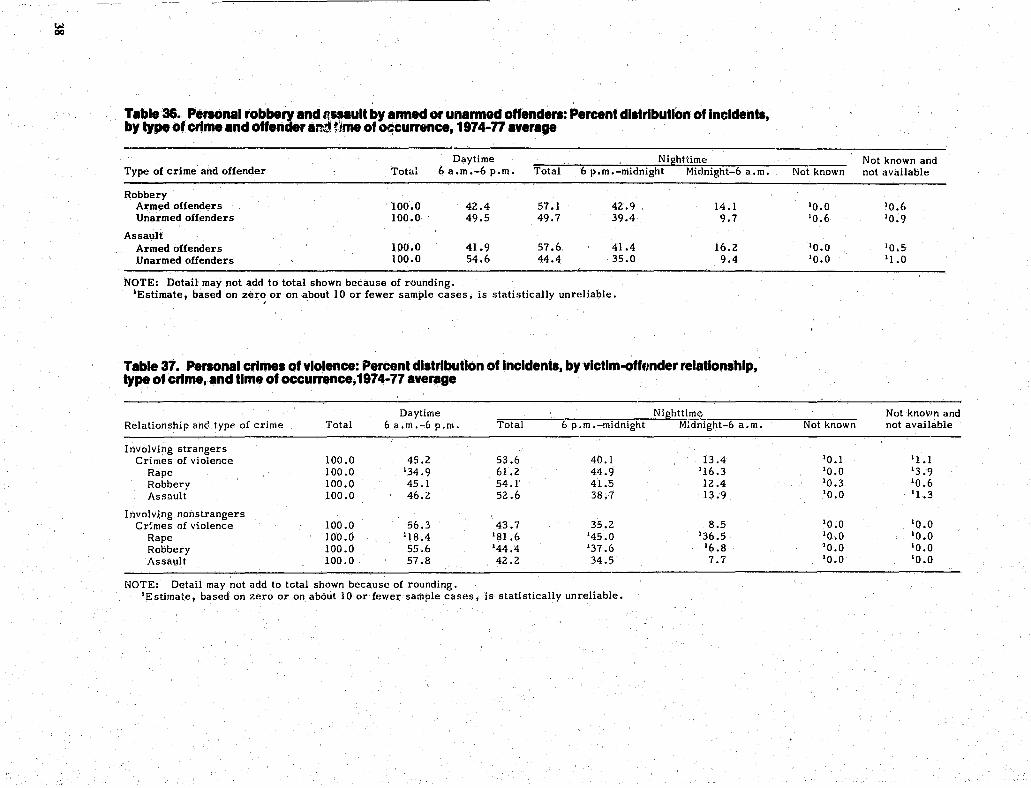
Table 36. Personal robbery and alNult by annecl or unanned offenders: Percent distribution of Incidents, by type of crime and offendar and fJrna of occummce, 1974-77 average
Daytime Nighttime Type of crime and offender Total 6 a.m .-6 p.m. Total 6 p.m.-midnight Midnight-6 a. m.
Robbery Armed offenders 100.0 42.4 57.1 42.9 14.1 Unarmed offenders 100.0 49.5 49.7 39.4 9.7
Assault Armed offenders 100.0 41.9 57.6 41.4 16.2 Unarmed offenders 100.0 54.6 44.4 35.0 9.4
NOTE: Detail may not add to total shown because of rounding. lEstimate, based on zer~or on about 10 or fewer sample cases, is statistically unreliable.
Tabla 37. Penonal crimea of violence: Percent distribution of Incidents, by vlctim-offftnder relationship, type of crime, and time of occurrence,1974-77 average
Daytime Nighttime Relationship anC: typi" of crime Total 6 a. m • -6 p. m • Total 6 p.m.-midnight Midnight-6 a.m.
Involving strangers Crimes of violence 100.0 45.2 53.6 40.1 13.4
Rape 100.0 134.9 61.2 44.9 116.3 Robbery 100.0 45.1 54.1 41.5 12.4 Assault 100.0 46.2 52.6 38.7 13.9
InvolvIng nonstrangers Cr;mes of violence 100.0 56.3 43.7 35.2 8.5
Rape 100.0 118.4 181.6 145.0 136.5 Robbery 100.0 55.6 144.4 '37.6 16.8 Assault 100.0 57.8 42.2 34.5 7.7
NOTE: Detail may not add to total shown because of rounding. lEstimate, based on zero or on about 10 or fewer sample cases, is statistically unreliable.
Not known and Not known not available
10.0 10.6 10.6 10.9
10.0 10.5 10.0 11.0
Not knm"n and Not known not available
10.1 11.1 10.0 13.9 10.3 10.6 10.0 11.3
10.0 10.0 10.0 10.0 10.0 10.0 10.0 10.0

Table 38. Selectecl personal and household crimes: Percent distribution of Incidents, by type of crime and place of occurrence, 1974-77 averege
Inside non-Inside Near residential
Type of crime Total own home own home building
Crimes of violence 100.0 11.0 9.9 13.4 Rape 100.0 '18.4 '6.2 '5.5 Robbery 100.0 7.6 11.9 B.9
Robbery with injury 100.0 'B.3 14.5 '4.3 Robbery without injury 100.0 7.3 10.7 11.2
Assault 100.0 12.6 9.0 16.5 Aggravated as",~ult 100.0 13.4 11.0 12.7 Simple assault 100.0 12.1 7.7 IB.8
Personal larceny with contact 100.0 '1.9 5.4 49.0
Motor vehicle theft 100.0· '1.3 16.6 '1.2
NOTE: Detail may not add to total shown because of rounding. 'Estimate, based on zero or on about 10 or fewer sample cases, is statisticaily unreliable.
Inside school
5.7 '4.3 '1.B 11.6 '1.9 B.O
'4.3 10.3
'3.4
'0.0
Table 39. Personal robbery and .... ult by armed or unarmed offenders: Percent distribution of Incidents, by type of crime and offender and place o~ occurrence, 1974-77 average
Inside non-Inside Near residential Inside
Type of crime and offender Total own home own home building school
Robbery By armed offenders 100.0 9.B 11.2 7.6 '1.0 By unarmed offenders 100.0 '5.3 12.7 10.3 12.7
Assault By armed offenders 100.0 13.9 11.1 12.9 13.4
By unarmed offenders 100.0 11.8 7.B lB.4 10.5
NOTE: Detail may not add to total shown because of rounding. 'Estimate, based on about 10 or fewer sample cases, is statistically unreliable.
On street or in park, playground, sChoolground, and parking lot Elsewhere
53.6 6.4 41.3 '24.3 65.5 4.3 66.1 '5.2 65.2 '3.B 47.3 6.5 51.0 7.4 45.1 6.0
34.9 5.3
79.4 '1.5
On street or in park, playgEoun~. sehoolgro,und, and parkihg lot Elsewhere
65.5 '4.9 65.4 '3.6
50.7 7.9 45.5 5.9

Table 40. larcenies not Involving vIcIIm-offender conlllcl: Percent d~'trlbutlon of Incldente, by type of crime I and place of occunence,1974-77avera ...
Type of crime and place of occurrence Percent within type Percent of total
Total
HOllsehold larceny Inside own home Near own home
Personal larceny without contact I nside. nonresidential building Inside school On street or in pa!k, playground,
schoolground,. and parking iot Elsewhere
NOTE: Detail may not ad.d to total shown because of rounding. Represents not applicable.
100.0 14.2 85.8
100.0 15.3 21.2
53.7 9.8
Table 41. Larcenies not Involving victim-offender contact: Percent distribution of Incident., by type of c~me, I place of occurrence, and value of theft loss, 1974-77 average
Type of crime and Amount' not place of occur~ence Less than $50 $50 or more available
Total 100.0 100.0 100.0
Household larceny 29.6 29.8 28.4 I nside own home 3.0 6.4 17.7 i~ear own home 26.6 23.3 20.7
Personal larceny without contact 70.4 70.2 71.6 I nside nonresidential building 10.5 10.9 16.2
I nside school 22.5 4.1 18.7 On street or in park,
playground, sChoolground, and parking lot 31.1 46.0 33.6
i!:lsewhere 6.3 9.3 '3.1
NOTE: De.tail ;nay not add to total shown because of rounding. 'Esti!Tlate, based on about 10 or fewer sample cases, is statistically unreliable.
100.0
29.5 4.2
25.3
70.5 10.8 15.0
37.8 6.9
Attempted larceny
100.0
28.7 '2.0 26.7
71.3
10.1 4.2
51.9 '2.1

-~-------~'~---~----------'-"JIIIII'---",:,,","';_ -----------------... .-------~.-~~--
...... -
Three Not known and Type at crime Total One Two or more not available
Crimes of violence 100.0 58.8 19.0 19.2 3.0 Rape 100.0 77.5 18.9 19.8 '3.9 Robbery 100.0 41.7 28.7 27.6 12.0
Robbery with injury 100.0 40.3 26.4 31.1 '2.2 Robbery without injulOY 100.0 42.4 29.9 25.8 '1.9
Assault 100.0 67.8 13.9 14.8 3.5 Aggravated assault 100.0 b4.4 15.0 16.0 '4.6 Simple assault 100.0 69.8 13.3 14.0 '2.8
NOTE: Detail may not add to total shown because or rounding. 'Estimate, based on about 10 or fewer sample cases, is statistically unreliable.
Tilble 43. PeI"lOlUlI crlm .. of violence: Percent of Incidents In which on ...... UMCIweaponl, by type of crime Mel vIcUm-oftencIer..a.tlonlhlp, 1174-77 ........
Type of crime All incidents Involving stranger.s
Crimes of violence Rape Robbery
Robbery with injury Robbery without injury
Assault' Aggravated assault
41.1 33.8 51.9 50.3 52.8 35.2 93.0
Jinciudes data on simple assault, which by'definition does not invobre the u,se of a weapon. IEstlmate, based on about lO'or fewer sample cases, is statistically unreliable •
45.3 37.5 53.9 54.5 53.6 38.7 96.3
""-
Involving non strangers
27.8 219.6 224.7 223.2 227.8 28.5 85.4

Table 44. Personal crimes of violence: Percent distribution of types of weapons used In Incidents by annad offenders, by type of crime and type of weapon, 1974-77 average
Type ot crime. Total Firearm Knife Other
Crimes of violence 100.0 20.7 41.0 32.6 Hape 100.0 '23.4 '63.8 '12.8 Robbery 100.0 22.9 50.7 21.6
Robbery with injury 100.0 17.2 43.7 32.0 Robbery without injury 100.0 26 .. 0 54.5 15.9
Aggravated assault 100.0 18.4 30.7 44.0 \'l~th injury 100.0 '12.2 23.4 57.1 Attempted assault with weapon 100.0 22.4 35.4 35.b
NOTE: Detail may not add to total shown because of rounding. 'Estimate, based on zero or on about l() or fewer sample cases, is statistically unreliable.
Table 45. Personal crimes of violence: Percent of victimizations In which victims took self-protective measures, by type of crime and victim-offender relationship, 1974-77 average
" " Type unknown
5.7 -'0.0 '4.9 '7.1 '3.7 '6.9 '7.4 '6.6
Type of crime All victimizations Involving strangers Involving nonstrangers
Crimes of violence 60.2 57.8 68.2 Rape 76.0 69.9 '100.0 Robbery 42.9 41.5 63.1
Robbery with injury 54.5 50.9 75.2 From serious assault 50.3 50.3 '50.8 From minor assault 59.9 51.7 '90.5.
Robbery without injury 37.6 37.7 131,9 Assault 69.1 69.8 67.7
Aggravated assault 70.0 70.1 69.8 IVith injury 65.7 62.5 71.3 Attempted assault with
weapon 72.9 74.3 68.1 Simple assault 68.5 69.5 66.6
\'lith injury 70.4 69.0 72.1 Attempted assault without
weapon 67.8 69.7 64.0
'Estimate, based on about 10 or fewer sample cases, is statistically unreliable.

.a;.. ~
~-----------..---------------~,. ~-,
Tabl.,.46. Penonal crimes of violence: Percent of victimizations In which victims took self-protective measures, by c!1~racterlstICl of victims and type of crime, 1974-77 average
Robbery Crimes of With Without
Characteristic violence' Total injury injury Total
Sex Male 58.0 40.1 51.5 34.9 68.3 Female 64.0 48.4 60.4 42.8 70.6
Race White 63.6 48.2 56.8 44.7 70.0 Black 4S.4 33.0 50.7 21.7 65.1
Age 12-19 58.8 39.1 59.2 32.2 65.1 20-34 6S.6 52:2 59.9 4E1.7 75.5 35-49 59.4 40.9 41.6 40.4 71.1 50-64 50.1 38.3. 64.8 28.0 62.8 65 <!-nd over 38.0 35.9 246.1 229.3 242.9
'InCludes data on rape, not shown separately. 'Estimate, based on about 10 or fewer sample cases, is statistically unreliable.
Table 47. Penonal crimes of violence: Percent distribution of self-protective measures e.nployed by victims, by type of measu.re and type of crime, 1974-77 average
Robbery With Without
Self-protective measure Crimes of violence Rape Total injury injury Total
Total 100.0 100.0 100.0 100.0 100.0 100.0
Used or brandished firearm or Knife 1.9 '0.0 15.2 11.6 17.S '1.0
Used physical force or other weapon 34.0 35.1 37.3 45.S 31.1 32.S
Tried to get help or frighten offender 20.9 40.0 29.8 39.1 23.1 16,6
Threatened or reasoned with offender 24.6 125.0 25.1 20.9 28.0 24.4
Nonviolent resistance, including evasion 27.7 116.3 24.2 22.0 25.9 29.7
Other 14.2 '9.6 7.9 '6.4 '9.0 16.7
NOTE: Detail may not add to total shown because of rounding. 'Estimate, based on ztiIO or on about 10 or fewer sample cases, is statistically unreliable.
):) J,/
.-:.!
Assault
Aggravated Simple
70.9 66.0 67.6 71.8
71.6 69.1 67.4 61.6
64.3 65.6 78.5 73.4 70.3 71.7 56.4 66.2
261.7 222.0
Assault
Aggravated Simple
100.0 100.0
11.4 '0.7
36.3 30.4
IS.1· 15.5
24.8 24.2
29.5 29.8 17.2 16.4
--"' .. ,----
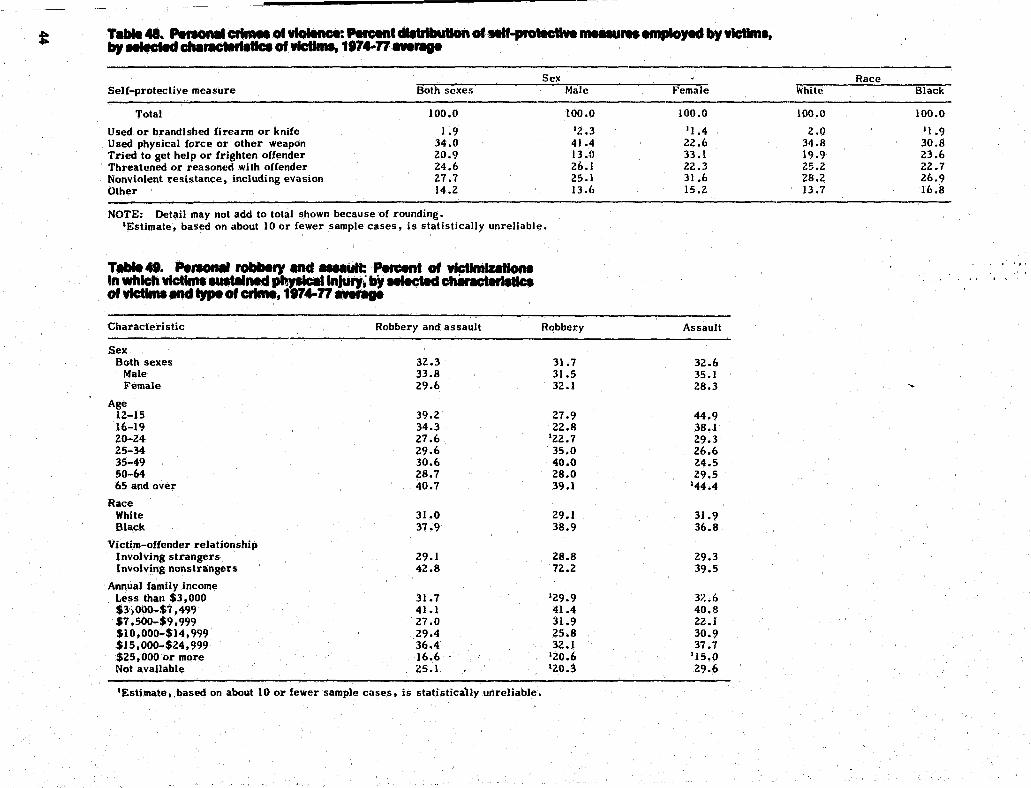
Sex Race Self-protective measure Both sexes Male Female White Black
Total 100.0 100.0 100.0 100.0 100.0
Used or brandished firearm or knife 1.9 12.3 11.4 2.0 11.9 Used physical force or other weapon 34.0 41.4 22.6 34.8 30.8 Tried to get help or frighten offender 20.9 13.{) 33.1 19.9 Z3.6 Threatened or reasoned with offender 24.6 26.1 22.3 25.2 22.7 Nonviolent resistance, including evasion 27.7 Z5.1 31.6 28.2 26.9 Other 14.2 13.6 15.2 13.7 16.8
NOTE: Detail may not add to total shown because of rounding. 'Estimate, based on about 10 or fewer sample cases, is statistically unreliable.
Characteristic Robbery and assault Robbery Assault
Sex Both sexes 3Z.3 31.7 32.6
Male 33.8 31.5 35.1 Female 29.6 32.1 28.3
Age 12-15 39.2 7.7.9 44.9 16-19 34.3 22.8 38,1 20-24 27.6 122.7 29.3 25-34 29.6 35.0 26.6 35-49 30.6 40.0 24.5 50-64 28.7 28.0 7.9.5 65 and over 40.7 39.1 144.4
Race White 31.0 29.1 31.9 Black 37.9 38.9 36.8
Victim-offender relationship Involving strangers 7.9.1 28.8 29.3 Involving nonstrangers 42.8 72.2 39.5
Annual family income Less than $3,000 31.7 129.9 3?.6 $3>000-$7,499 41.1 41.4 40.8 $7,500-$9,999 27.0 31.9 22.1 $10,000-$14,999 29.4 25.8 30.9 $15,000-$24,999 36.4 32.1 37.7 $25,000 or more 16.6 120.6 115.0 Not available 25.1 120.3 29.6
'Estimate, ,based on about 10 or fewer sample cases, is statistically unreliable.

)4
Table so. Penonal crimes of violence: Percent of victimizations In which victims Incurred medical expenses, by selected characteristics of victims and type of crime, 1974-77 average
Characteristic Crimes of violence' Robbery
Race All races 1 13.5 14.1
White 1.2.7 12.6 Biac:k 17.1 18.1
Victim-offender relationship Involving strangers 12.5 12.5 Involving nonstrangers 16.9 '36.6
Assault
12.2 11.7 15.6
11.4 14.0
NOTE: Data include only those victimizations in which victims knew with certainty that medical expenses were incurred and al so knew, or were able to estimate, the amount of such expenses.
1 Includes data on "other" races, not shown separately. 'Includes data on rape, not shown separately. 'Estimate, based on about 10 or fewer sample cases, is statistically unreliable.
Table 51. Personal crimes of violence: Percent distribution of victimizations In whWch victims incurred medical expenses, by type of crime and amount of expenset, 1974-77 average
Type of crime Total Less than $50 $50-$249
Crimes 01 violence I 100.0 39.1 37.8 Robbery 100.0· '41.2 '38.6 Assault 100.0 ' 35.6 40.9
$250 or more
23.0 '20.2, 223.S
NOTE: Data include only those victimizations in which victims knew with certainty that medical expenses wen! incurred and also knew, or were able to estimate, the amount of such expenses. Detail may.not add to total shown because of rounding.
lIncludes data on rape, not shown separately. 'Estimate, based on about 10 or fewer sample cases, is statistically unreliable.
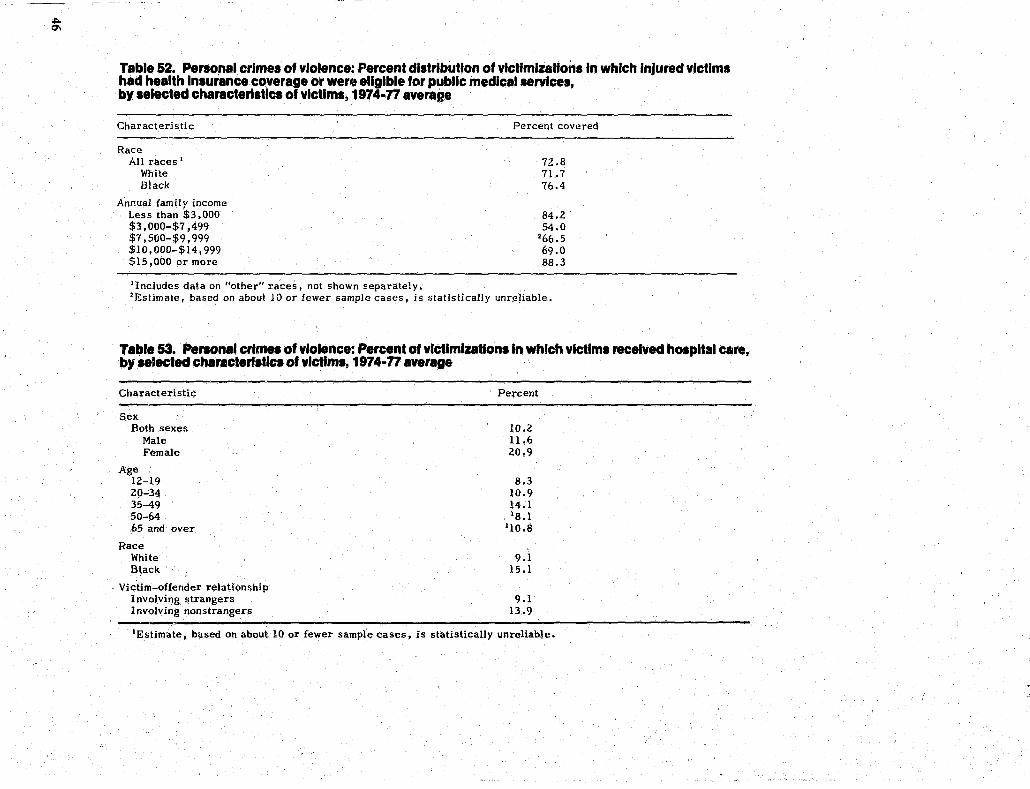
Table 52. Perso"al crimes of violence: Percent distribution of victimizations In which Injured victim. had health Insurance coverage or were eligible for public medlcalservlces, by selected characteristics of victims, 1974-77 average
Characteristic
Race All races I
White Black
Annual family income Less than $3,000 $3,000-$7,499 $7,500-$9,999 $10,000-$14,999 $15,000 or more
Percent covered
72.8 71.7 76.4
B4.2 54.0
266.5 69.0 BB.3
'Includes data on "other" races, not shown separately. , 2Estimate, based on about JO or fewer sample cases, is statistically unreliable.
Table 53. Personal crimes ohlolence: Percent of victimizations In which victims received hospital care, by selected characteristics of victims, 1974·77 average
Characteristic
Sex Both sexes
Male Female
Age 12-19 20-34 35-49 50-64 65 and over
Race White Black
Victim-offender relationship Involving strangers Involving nonstrangers
Percent
10.2 11.6 20.9
8.3 10.9 14.1 'B.l
'10.8
9.1 15.1
IEstimate, based on about 10 or fewer sample cases, is statistically unreliable.

Table 54. Personlliand houMhold crimes: Percent of victimizations retuHlng In economic lou, by type of crlmG and type of lou, 1974-77 average .
All Theft losses Damage lG,sses economic All theft All damage
Type of crime losses losses With damage Without damage losses With theft
All personal crimes 79.0 10.1
'Crimes of violence 35.0 24.1 2.6 21.5 10.3 2.6 Rape 34.9 20.4 '5.3 '15.0 '15.3 '5.3 Robbery 73.3 67.4 6.9 60.4 6.7 6.9
Robbery wi th injury 81.1 69.4 13.9 55.4 14.0 13.9 Robbery without injury 13.2 66.4 3.7 62.7 3.3 3.7
Assault 13.5 12.0 Aggravated assault 13.1 12.6 SiMple assault 13.8 11.6
Crimes of theft 94.5 92.0 12.7 79.3 1.5 12;7 Personal larceny with contact 86.4 85.6 '2.8 82.9 '3.6 '2.8
Purse snatching 60.7 58.3 '6.9 51.5 '0.9 '6.9 Pocket picking 100.0 100.0 '0.6 99.4 '0.6 '0.6
Person .. l larceny without, contact 95.2 92.5 13.6 79.0 7.7 13.6
All household crimeR 91.7 79.1 17.1 ~2.0 18.4 17.1
Burgiary 88.4 69.7 26.5 43.2 26.9 26.5 Forcible entry 94.3 84.1 64.8 19.3 43.7 64.e Unlawful entry 91.7 88.9 7.0 81.9 5.3 7.0 Attempted forcible entry 70.8 'Z.l '1.2 '0.8 70.0 '1.2
Household larceny 95.9 92.8 8.2 84.6 11.3 8.2 Completed larceny 100.0 100.0 8.9 91.1 8.9 8.9 Attempted lal'ceny 43.4 27.9
Motor vehicle theft 88.5 64.2 14.8 49.4 21.7 14.8 Completed theft 100.0 100.0 23.1 76.9 14.1 23.1 Attempted theft 68.0 35.4
NOTE: Detail may not add to total shown. because of rounding. ... Represents not applicable • 'Estimate, based on zero or on about '10 or fewer sample cases, is statistically unreliable.
Without theft
10.9 '14.6
5.9 11.8 3.2
13.5 13.1 13.8 2.5
'0.8 '2.4 '0.0 2.6
12.6
18.7 10.1 2.9
68.8 3.1
'0.0 43.4 24.4 '0.0 68.0

~ T.bIe 55. PeI'8OMI .. d household ct1 ..... : Percent dlatt1butlon 01 vlctlmlutlona resuh~~a In economic lou, OD by nICe 01 victim .. type 01 crime, .nd v.lue ollau, 1974-77 fter ...
Race aad .type of crime Total No monetary value Less than $10 $10-$49 $50-$249 $250 or more Not known and nol available
All ract's'
All p"rsonal crim"s 100.0 2.5 21.5 34.1 28.5 7.2 6.2 Crimes of violence 2 100.0 8.9 16.4 28.3 24.9 11.5 10.1
Robbery 100.0 4.6 15.3 28.0 28.7 15.1 8.3 Robbery with injury 100.0 '5.7 15.9 24.2 31.7 15.6 '6.9 Robbery without injury 100.0 '4.0 15.0 30.0 27.1 14.8 9.1
Assault 100.0 21.4 20.5 28.4 '10.7 '2.0 17.0 Aggravated assault 100.0 '21.5 '20.7 '16.9 '11.6 '0.0 '27.4 Simple assault 100.0 21.3 20.5 34.5 '10.2 '3.2 '11).3
Crimes of theft 100.0 1.6 22.2 34.8 29.0 6.7 5.7 Personal larceny with contact 100.0 '0.5 13.6 37.7 34.7 '3.7 9.8 Personal larceny without contact 100.0 1.7 22.8 34.6 28.6 6.9 5.4
All household crimes 100.0 5.6 13.5 23.9 26.5 23.6 6.9 Burglary 100.0 8.0 8.0 16.') 30.3 28.6 8.3
Forcible entry 100.0 3.7 3.9 6.5 27.8 48.0 10.0 Unlawful entry without force 100.0 '1.0 9.5 24.0 37.9 21.8 5.7 Attempted forcible entry 100.0 37.9 13.1 21.0 14.4 'I. 7 11.9
Household larceny 100.0 3.4 21.8 J4.7 27.4 7.6 5.1 Completed larceny 100.0 2.6 22.2 34.8 28.0 7.8 4.7 Attempted larceny 100.0 '26.6 '10.6 32.7 '10.0 '2.5 '17.6
Motor vt'hicle theft 100.0 5.5 '1. 7 8.1 10.0 66.3 8.5 Completed theft 100.0 '0.0 '0.0 '0.4 '4.1 90.6 4.') Attempted theft 100.0 19.8 '6.3 28.2 25.4 '2.2 18.0
Ivhitc
All personal crimes 100.0 2.3 22.3 34.8 28.1 6.8 5.7 Crimes of violence' 100.0 9.2 15.') 31.4 21.4 11.9 10.2
Robbery 100.0 34.6 14.1 32.1 24.5 16.2 8.6 Assault 100.0 1 (). ') 22.') 28.0 '10.9 '2.5 15.9
Cri mes of theft 100.0 1.6 23.0 35.1 28.8 6.2 5.3 Personal larceny with cOI.tnct 100.0 '0.7 12.7 37.4 35.9 '2.8 10.5 Personal larceny without cOI:tnct 100.0 1.7 23.6 35.0 28.3 6.4 4.9 All household crimes 100.0 5.8 14.9 25.4 25.9 21.9 6.1
Burglary 100.0 8.8 9.2- 18.5 29.9 26.2 7.5 llousehold larceny 100.0 3.2 23.0 35.8 26.6 7.2 4.4 I~otor vehicle theft 100.0 5.8 '2.0 7.5 10.0 66.1 8.6
Black
All personal crimes 100.0 3.6 15.8 29.2 31.8 10.5 9.1 Crimes of violence' 100.0 '8.6 17.7 22.9 31.0 10.3 9.5
Robbery 100.0 '4.8 18.6 21.5 34.1 12.6 '8.3 Assault 100.0 '30.1 '0.0 '33.7 '11.5 '0.0 '17.2
Cri mes of theft 100.0 '1. 7 IS.I 31.5 32.1 10.6 8.9 Personal larceny wit:, contact 100.0 '0.0 '16.2 33.0 35.3 '6.6 '8.9 Personal larccny without contact 100.0 '2.1 15.0 31.2 31.5 11.3 8.9
All household crimes 100.0 4.3 4.7 13.9 31.1 34.3 11.8 Burglary 100.0 '4.5 '2.4 10.0 32.8 38.5 11.7 Household larceny 100.0 '4.4 11.1 22.1 36.7 12.3 13.6
Motor vehicle theft 100.0 '3.3 '0.0 '12.3 '10.0 66.7
NOTE: Det.ail may not add to total nhc\'m because of rounding. 'Includes data on "other" races, not shown separately. 'Includes data on rape, not show .. "<:pa,ately. 'Estimate, based on zero or on about 10 or fewer sample cases, is statistically unreliable.
I
I

Tab;' 56. Selected personal crimes: Percent dlltrlbutlon of vlctlmlzatlonl multlng In theft lou, by race of vlctlml, type of crime, and value of 1011, 1974-77 iIIverage
Race and type of crime Total No monetary value Less than $10 $10-$49 $50-$99 $100-$249 $250 or moz:e
All races 1
Robbery 100.0 31.5 15.6 27.7 16.9 15.4 15.9 Crimes of theft ' 100.0 1.0 23.0 36.1 14.4 15.4 6.2
White Robbery 100.0 32.3 14.3 31.8 15.4 12.8 15.9 Crimes of theft' 100.0 0.9 23.8 36.3 14.4 15.0 6.0
Black Robbery 100.0 30.0 19.5 21.5 17.8 20.1 16.1 Crimes of theft' 100.0 31.8 16.1 33.2 15.6 17.6 8.9
NOTi!:: Detail may not add to total shown because of rounding. 1 Includes data on "other" races', not shown separately. 'Includes both personal larceny with contact and personal larceny without contact. 3Estimate, based on zero or on about 10 or fewer sample cases, is statistically unreliable.
Not available
6.9 3.9
7.6 3.6
'5.0 6.8

.'f.: ..
VI o
;:1~::~~:~~.\ ..
Table 57. Personal and houlehold crlmel: Percent dlltrlbutlon of vlctlmlzatlonl relultlng In theft 10SI, by race of vlctlml, type of crime, and proportion of 1011 recovered, 1974-77 average
None Some All Not Race and type of crime Total recovered recovered recovere~ available
All races'
All personal crimes' 100.0 80.4 12.3 7.3 ('Z) Robbery 100.0 82.4 9.4 8.1 '0.0 Crimes of theft 100.0 80.2 12.5 7.2 ('Z)
Personal larceny with contact 100.0 79.2 16.0 '4.8 '0.0 Personal larceny without contact 100.0 80.3 12,3 7.4 ('Z)
All household crimes 100.0 74.0 14.1 11.9 'n.o Burglary 100.0 79.6 15.0 5.5 '0.0 Household larceny 100.0 79.7 11.0 9.3 '0.0 Motor vehicle theft 100.0 24.0 26.8 49.3 '0.0
White
All personal crimes' 100.0 79.6 12.5 7.9 ('Z) RObbery 100.0 77.8 10.5 11.7 '0.0 Crimes of theft 100.0 79.7 12.6 7.6 ('Z)
Personal larceny with contact 100.0 76.0 20.1 '3.9. '0.0 Personal larceny without contact 100.0 80.0 12.1 7.9 (.'Z)
All household crimes 100.0 73.3 14.5 12.3 '0.0 Burglary 100.0 78.0 15.9 6.1 '0.0 Household larceny 100.0 79.7 10.7 9,5 '0.0 ~lotor vehicle the::'t 100.0 22.'1 29.2 48.4 '0,0
Black
All personal crimes' 100.0 85.0 11.5 3.5 '0.0 Robbery 100.0 90.6 '7.9 '1.4 '0.0 Crimes of theft 100.0 83.5 12.5 4.0 '0.0
Personal larceny with contact 100.0 88.5 '5.1 '6.4 '0.0 Personal larceny without contact 100.0 82.5 13.9 '3.6 '0.0
All household crimes 100.0 77.7 12,2 10.2 '0.0 Burglary 100.0 85.3 11.6 '3.1 '0.0 Household larceny 100.0 79.1 13.4 '7.5 '0.0 Motor vehicle theft 100.0 '31.6 '11.3 57.1 '0.0
NOTE: Detail may not add to total shown because of rounding. Z Kepresents less than 0.05. 'I ncludes data on "other" races, not shown separatel y. 'Includes data on rape, not shClwn separately, but excludes data on assault which by definition does not
involve theft. 'Estimate, based or) zero or on about 10 or fewer sample cases, is statistically unreliable.

c
~ "
, .
I
I
I
i i I

Table 58 •. Penona. and household crlmel:, Perce;nt dCliributlon I of victimizations In which theft louel were recovered. by type of crime and method of recovery of lOll. 1974-77 average
Both Other insurance and
Typ~ of crime Total Insurance only method only other method
All personal crimes 1 100.0 39.8 59.1 ~L1
Robbery 100.0 26.4 93.6 20.0 Grimes of theft 100.0 42.5 56.3 21.2
Personal larceny with contact 100.0 20.0 100.0 20.0 Personal larceny without contact' 100.0 46.0 52..8 21.2
All household crimes 100.0 40.5 52.9 6.3 Burglary 100.0 54.5 39.6 25.9 Household larceny 100.0 33.3 66.3 20.4 Motor vehicle theft 100.0 35.8 48.9 14,7
NOTE: Detail may not add to total shown because of rounding.
Method not available
20.0
20.0 '0.0 20.0 20.0
20.2 20.0 20.0 20.6
IIncludes data on rape, not shown separately, but excludes data Dn assault, which by definition does not invol ve theft.
2Estimate, based Dn zero or ,on about 10 or fewer sample cases, is statistically unreliable.
Table 59. Houlehold crlmel: Percent dlatrlbutlon of vlctlmlzatlonl resulting In theft 1088. by value of 10.1 aod type of crime, 1974-77 @vfmlge
Valyg of loss All household crimes Burglary Household larceny Motor vehicle theft
Total 100.0 100.0
No monetary value 1.7 10.6 Less than $10 14.2 6.5 $10-$49 24.8 17.3 $50-$99 13 .1 14.0 $100-$249 15.4 22.0 $250-$999 15.2 23.3 $1,000 or mor,e 12.7 13.7 Not available 3.0 2.6
NOTE: Detail may not add to total shown because of rounding.
100.0
2.8 22.9 35.4 14.9 12.7 6.9 1.1 3.3
IEstimate, based on zero or on about'10 or fewer sample cases, is statistically unreliable.
100.0
10.0 10.0 10.4 10.4 14.2 25.4 66.9 12.7

Table 60. Personal and household crimes: Percent of victimizations resulting In loss of time from work, by type of crime, 1974-77 average
Type of crime
All personal crimes
Crimes of violence Rape Robbery
Robbery with injury Robbery without injury
Assault Aggravated assault Simple ass.-'!<ult
Crimes of theft Personal larceny with contact Personal larceny without contact
All household crimes
Burglary Forcible entry Unlawful·entry without force Attempted forcible entry
Household lar-ceny Less than $50 ~~50 or mor-e Amount not available Attempted larceny
Mo~or vehicle theft Completed theft Attempted theft
Percent
5.5
10.0 '22.7 12.2 25.1 8.4 B.l
10.8 6.3 4.0
'3.3 4.0
5.1
6.3 12.6 3.4
'1.6 1.9
'1.4 '2.2 '2.5 '3.6 13.3 16.Z '3.1
'Estimate, based on about 10 or- fewer- sample cases, is statistically unr-eliable.
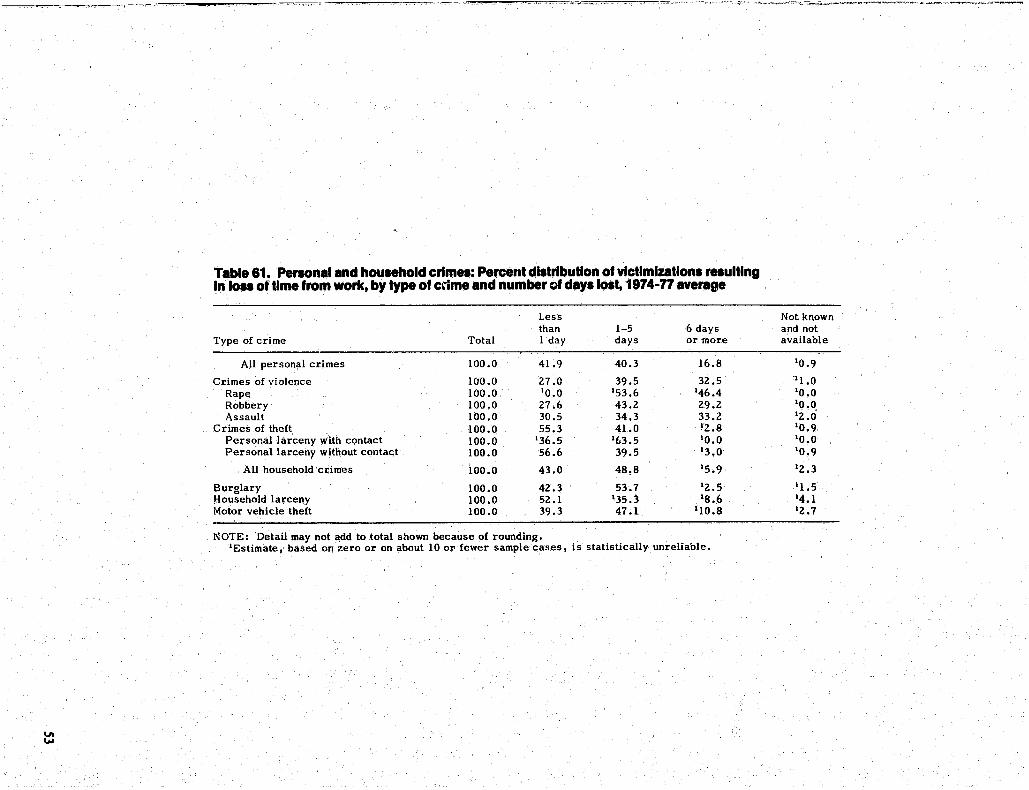
Table 61. Penonal and houHhold crimes: Percent dlltrlbutlon of vlctlmlzatlonl relultlng In lOll of time from work, by type of c~me and number of daYIIOIt, 1974-77 average
Less than 1-5 6 days
Type of crime Total I day days or more
All personal crimes 100.0 41.9 40.3 16.8
Crimes of violence 100.0 27.0 39.5 32.5 Rape 100.0 10.0 153.6 146.4 Robbery 100.0 27.6 43.2 29.2 Assault 100.0 30.5 34.3 33.2
Crimes of theft 100.0 55.3 41.0 '2.8 Personal larceny with contact 100.0 136.5 163.5 10.0 Personal larceny without contact 100.0 56.6 39.5 13.0
All household crimes 100.0 43.0 48,8 15.9
Burglary 100.0 42.3 53.7 12.5 Household larceny 100.0 52.1 135.3 18.6 Motor vehicle theft 100.0 39.3 47.1 110.8
NOTE: 'Detail may not add to total shown because of rounding. lEstimate, based on zero or on about 10 or fewer sample cases, is statistically unreliable.
Not known and not available
10.9
"11.0 10.0 10.0 12.0 10.9. 10.0 10.9
12.3
11.5 14.1 12.7

T.ble 12. PenoMlllnd houHhold crlm .. : Percent of vlctlmlZlltlons reported to the police, by type of crime, 1974-77 .ver.ge lind by ye.r
1974-77 Type of crime average 1974 1975 1976 1977
All personal crimes 34.2 37.0 34.5 33.8 32.1
Crimes of violence 50.9 58.2 46.7 46.0 53.2 Rape 64.2 '62.1 '59.2 '54.3 '72.9 Robbery 54.9 67.5 43.8 52.3 58.0
Robbery with injury 67.5 76.7 48.8 68.9 69.7 From serious assault 75.6 77.6 '56.3 79.5 81.5 From minor assault 58.4 '75.2 '39.7 '58.9 '53.1
Robbery without injury 49.0 62.4 42.4 45.5 49,1 Assault 47.9 52.6 47.9 42.2 49.4
Aggravated assault 57.1 56.4 65.1 57.1 51.0 \'lith injury 66.6 63.9 64.9 70.5 67.9 Attempted assault with weapon 50.6 49.2 65.2 48.0 39.8
Simple assault 41.8 48.9 37.3 33.8 48.4 With injury 47.6 69.8 47.5 3Q.4 43.8 Attempted assault withol.lt W83.POn 39.6 43.3 30.6 3LS 49.7
Crimes of theft 28.3 29.6 30.0 29.5 25.0 Personal larceny with contact 33.6 35.0 30.8 33.8 34.9
Purse snatching 37.5 '36.7 '29.2 41.6 '43.0 Pocket picking 31.5 34.5 31.9 29.3 30.8
Personal larceny without contact 27.9 29.1 29.9 29.0 24.3
All household crimes 47.0 47.1 45.5 49.3 46.4
Burglary 55.1 53.1 54.7 57.0 55.8 Forcible entry 77.0 70.7 80.6 76.2 81.0 Unlawful entry without force 45.4 42.1 44.2 46.3 49.1 Attempted forcible entry 37.4 42.5 37.8 40.6 31.4
Household larceny 31.8 33.5 29.9 32.7 31.5 Completed larceny I 32.2 34.0 30.4 33.0 31.8
Less than $50 20.0 20.9 18.6 22.6 18.4 $50 or more 53.6 59.0 54.6. 49.2 53.0
Attempted larceny 26.7 '28.5 '23.3 a28.7 '26.9
t-totor vehicle theft 71.3 6.L6 70.0 79.7 68<7 Completed theft 94.1 100.0 94.1 95.5 88.3 Attempted theft 30.4 28.3 '22.9 41.1 '30.9
I Includes data, not shown separately j on larcenies for which the value of 1055 was not ascc,rta.ined. 'Estimate, based on about 10 or fewer sample cases, is statistically unreliable.

VI VI
, .J
TIIbIe 63. Personal crimea: Percent of vlctlmlzationl reported to the police! by trpe of crime and sex of vlctlml, 1974-n average
Type of crime
All personal crimes
Crimes of violence Rape Robbery
Robbery with injury From serious assault From minor assault
Robbery without injury Assault
Aggravated assault With in-jury Attempted assault with weapon
Simple assault With injury Attempted assault without weapon
Crimes of theft Personal larceny with contact
Purse snatching Pocket picking
Personal larceny without contact
Male
35.4
50.2 '47.3 50.9 68.6 76.2 49.7 42.8 49.9 58.7 70.7 49.3 42.2, 42.6 42.1 .28.8 32.1 '0.0 32.1 28.6
All victimizations
'Estimate, based on zero or on about 10 or fewer sample cases, is statistically unreliable.
Female
32.8
51.9 65.2 62.7 65.2 72.8 62.4 61.4 44.5 52.8 50.7 53.8 41.2 54.3 36.3 27.9 34.0 37.5 :31.1 27.1
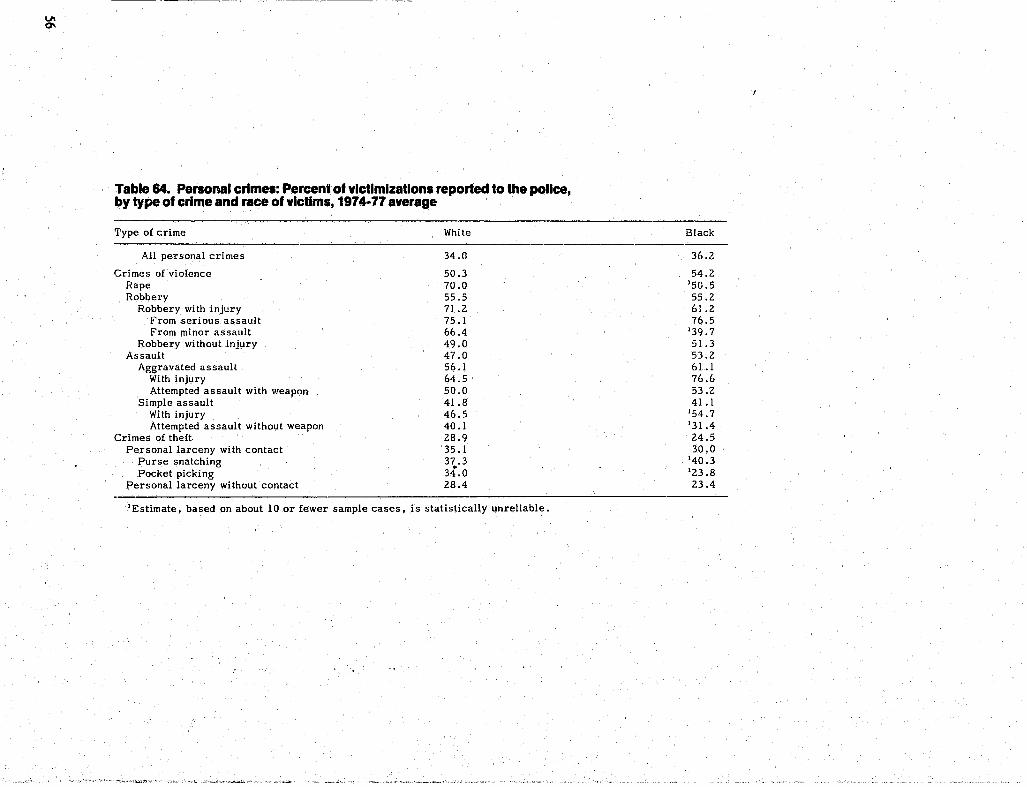
Table &4. Penonal crimes: Percent of victimizations reported to the police, by type of crime and race of victims, 1974-77 average
Type of crime White
All personal crimes 34.0
Grimes of violence 50.3 Rape 70.0 Robbery 55.5
Robbery with injury 71.2 From serious assault 75.1 From minor assault 66.4
Robbery without injury 49.0 Assault 47.0
Aggravated assault 56.1 With injury 64.5 Attempted assault with weapon 50.0
Simple assault 41.8 With injury 46.5 Attempted assault without weapon 40.1
Crimes of theft. 28.9 Personal larceny with contact 35.1
Purse snatching 37.3 Pocket picking 34.0
Personal larceny without contact 28.4
'Estimate, based on about 10 or fewer sample cases, is statistically unreliable.
" .. ' .
Black
36.2
54.2 '50.5 55.2 61.2 76.5
'39.7 51.3 53.2 61.1 76.6 53.2 41.1
'54.7 '31.4 24.5 30.0
'40.3 '23.8 23.4

~.~.~. -.-. -.~--.-. ~~.~.\ ." ..... , ..• ~,,<.,. .. ~-+>~ .... "'
VI -.J
T ..... e. ,. ..... crimeI: Percent 01 vIcIImIuIIon. NpOfIed 10 ... police, It, type of crtme Mel ethnicIIJ of vIcI ...... 1.74-77 .......
Type of crime
All personal crimes
Crimes of violence Rape Robbery
Robbery with injury From serious assault From minor assault
Robbery without injury Assault
Aggravated assault With injury Attempted assault with weapon
Simple assault With injury Attempted assault without weapon
Crimes of theft Personal larceny with contact
Purse snatching P(x:ket picking
Personal larceny without contuct
Hispanic
35.4
45.7 '100.0
49.1 '55.5 '52.5 '61.8 45.8 36.0
'37.7 '49.2 '31.1 '34.9 '40.4 '30.1
la.S '31.6 '45.5 '17.0 28.3
All victimizations
'Estimate, bastlO on about 10 or fewer sample cases, is statistically unreliable.
Non-Hispanic
34.1
51.4 59.5 55.7 69.3 80.1 56.4 49.5 48.7 '58.3 67.6 51.9 42.2 48.4 40.0
28.3 33.8 36.2 32.6 27.8
T ..... II. Penonal c:rime8: Pen:ent of victimization. NpOfIed 10 ... police, .., type of crI .... and. of vlcllm., 1.74-77 average
Type of crime 12-19 20-34 35-49 50-64
All personal crimes 24.8 36.9 38.6 39.7
Crimes of violence 43. i 49.9 65.1 54.5 Rape 70.9 '5§.2 '67.9 '100.0 Robbery 43.0 50.7 69.6 59.5
Robbery with i.njury 52.2 60.4 78.0 64.0 Robbery without injury 39.8 46.3 64. t 57.8
Assault 41.3 49.1 62.0 48.9 Aggravated assault 58.4 54.1 61.4 68.4 Simple assault 30.3 45.7 62.5 38.4
Crimes of theft 17.2 32.0 31.7 35.8 Personal larceny with contact 115.7 35.2 37.2 40.9 Personal larceny without contact 17.3 31.8 31,.3 35.1
lEstimate, based on zero or on about 10 or fewer sample cases, is statistically unreliable.
65 and over
38.2
56.9 '0.0 64.6 92.3 46.8
'39.1 \36.8 '41.8
30.2 29.2 30.5

Table 67 . Household crimes: Perce~t of victimizations reported to the police, by type of crime and race of head of-household, 1974-77 average
Type of crime All households White households Black households
All household crimes 47.0 46.9
Burglary 55.1 54.7 Forcible entry 77.0 78.9
Nothing taker. 55.2 58.3 Something taken 81.1 83.5
,Unlawful entry without forc'! 45.4 45.6 Attempted forcible entry 37.4 38.3
Household larceny 31.8 32.8 ComplGted larceny' 32.2 33.1
Less than $50 20.0 20.5 $50 or more 53.6 56.4
Attempted larceny 26.7 28.4 Motor vehicle theft 71.3 71.9
Com(Jleted theft 94.1 93.7 Attempted theft 30.4 33.2
'Includes data ,not shown separately, on larcenies for which the value of loss was not ascertained. 'Estimate, based on about 10 or fewer sample cases, is statistically unreliable.
Table 68. Household crimes: Percent of victimizations reported to the police, by type of crime and form of tenure, 197~-77 average
Type of crime Owned
All household crimes 49.8
Burgl;lry 59.8 Forcible entry 83.4
Nothing taken 67.7 Something taken 86.7
Unlawful entry without force 43.2 Attempted forcible entry 51.9
Household larceny 36.3 Completed larceny t 36.4
Less than $50 23.8 $50 or more 58.1
Attempted larceny 34 .. 8 Motor vehicle thoft 73.8
Completed theft 95.9 Attempted theft 30.8
~ Includes data, not sho,wn separately, on larcenies for which the value of loss was not ascertained. 2E~timate, baSed on'about 10 or fewer sample cases, is statistically unreliable.
47.5
56.9 72.4
'40.8 75.3 44.4
229.5 21.6 22.0 10.4 33.6
219.4 66.2 96.8
211 .6
Rented
43.6
51.0 70.7 41.1 75.8 47.6 23.3 24.5 25.1 13.6 45.9
'19.5 68.6 92.0 29.9
,t" .}

Table 69. Household crimes: Percent of victimizations reported to the police, by type of crime and annual family Income, 1974-77 average
Type of crime Les s than $3,000 $3,000-$ 7,499 $7,500-$9,999 $10,000-$14,999 $15,000-$24,99~
All household crimes 40.2 46.8 45.9 45.8
Burglary 50.8 55.6 57.4 53.2 Forcible entry 73.0 72.7 65.4 82.9 Unlawful entry without force 45.0 43.7 49.6 45.3 Attempted forcible entry 33.8 41.7 60.8 25.8
Household larceny 21.0 30.5 32.3 29.8 Completed larceny 1 22.3 30.0 33.2 30.5
Less than $50 29.4 22.0 19.3 18.3 $50 or more 45.5 46.2 54.2 55.8
Attempted larceny 20.0 235.9 213.7 22, .. 2 Motor vehicle theft 269.9 69.6 52.2 80.1
Completed theft 2100.0 86.6 83.4 92.4 Attempted theft . 249.7 239.3 226.9 '36.3
lInc1udes data, not shown separately, on larcenies for which the value of loss was not ascertained. 'Estimate, based on zero or on about 10 or fewer sample cases, is statistically unreliable.
Table 70. Household crimes: Percent of victimizations reported to the pelice, by value of loss and type of crime, 1974-77 average
49.1
54.0 74.5 43.0 39.0 36.5 36.9 23.1 58.7
229.5 70.7 98.4
224.8
All household Household ~lotor vehicle Value of loss 1 crimes Burglary larceny theft
Less than $10 17 .0 25.3 15.2 20.0 $10-$49 24.0 32.0 20.8 2100.0 $50-$249 54.5 58.2 49.9 281.6 $250 or more 85.2 84.1 66.2 95.0
lThe proportions refer only to losses of cash and/or property and exclude the value of property damage. "Estimate, based on zero or on about 10 or fewer sample cases, is statistically unreliable.
$25,000 or more Not available
52.9 46.2
63.6 53.7 97.0 82.3 53.7 42.4
234.3 232.5 36.4 30.4 36.1 30.9 21.8 20.0 55.4 48.4
243.1 224.2 67.2 73.2 96.1 100.0
233.0 219.3
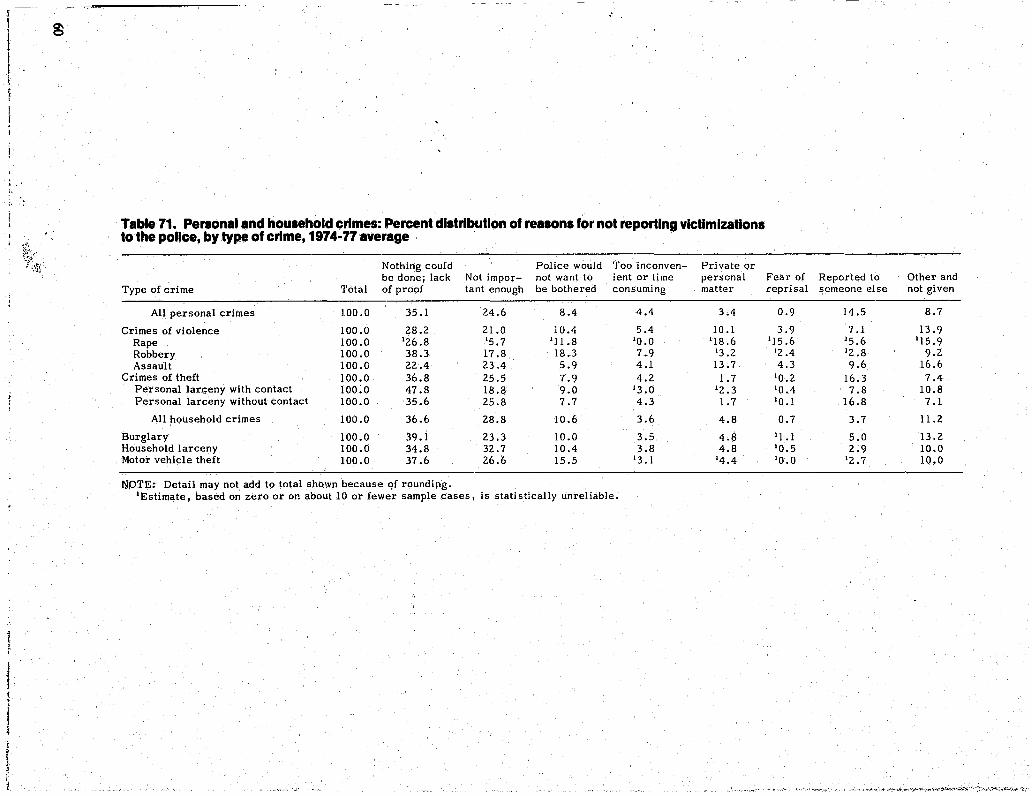
. . . ' ;. "
1 ! !
I
Table 71. Personal and houlehold crimes: Percent dlltrlbutlon of realons for not reporting victimizations to the pollee, by type of crime, 1974-77 average
Nothing could Police would Too inconven- Private or be done; lack Not impor- not want to ient or time personal
Type of crime Total of proof tant enough be bothered consuming matter
All personal crimes 100.0 3S.1 24.6 8.4 4.4 3.4
Crimes of violence 100.0 28.2 21.0 10.4 S.4 10.1 Rape 100.0 126.8 'S.7 '11.8 10.0 118.6 Robbery 100.0 38.3 17.8 18.3 7.9 '3.2 Assault 100.0 22.4 23.4 5.9 4.1 13.7
Crimes of theft 100.0 36.8 25.5 7.9 4.2 1.7 Personal larceny with contact 100:0 47.8 18.8 9.0 '3.0 12.3 Personal larceny without contact 100.0 3S.6 25.8 7.7 4.3 1.7
All household crimes 100.0 36.6 28.8 10.6 3.6 4.8
Burglary 100.0 39.1 23.3 10.0 3.5 4.8 Household larceny 100.0 34.8 32.7 10.4 3.8 4.8 Motor vehicle theft 100.0 37.6 26.6 15.5 '3.1 14.4
l'lIPTE: Detail may not add to total shown because qf rounding. lEstimate, based on zero or on about 10 or fewer sample cases, is statistically unreliable.
Fear of Reported to Other and reprisal someone else not given
0.9 14.S 8.7
3.9 7.1 13.9 lIS .6 IS.6 lIS .9
12.4 12.8 9.2 4.3 9.6 16.6 '0.2 16.3 7.4 10.4 7.8 10.8 '0.1 16.8 7.1
0.7 3.7 11.2
'1.1 S.O 13.2 'O.S 2.9 10.0 '0.0 '2.7 10.0
Appendix II
Survey Instruments
A basic screen questionnaire (Form NCS-l) and a crime incident report (Form NCS-2) were used to elicit information on the relevant crimes committed against the household as a whole and against any of its members age 12 and over. Form NCS-twas designed to screen for all instances of victimization before details of any specific incident were coliected. The screening form also was used for obtaining information on the characteristics of each household and of its members. Household screening questions were asked only once for each household, whereas individual screening questions were asked of all members age 12 and over. However, a knowledgeable adult member of the household served as a proxy respondent for 12- and 13-year-olds, individuals temporarily absent, and incapacitated persons (optional).
Once the screening process was completed, the interviewer obtained details of each revealed incident, if any. Form NCS-2 included questions concerning the extent of economic loss or injury, characteristics of offenders, whether or not the police were notified, and other pertinent details.

62 {,
I ,;
U.I. Da"""TIIINT DP Co...llICI ., MI".AU OP' TH_ CaNtu.
ACT1t11i1 .1 CO ....... CTI"" ....... T 1'0" 'Hill
L.~-r .~"o;.:~:=:,,~I:~ • .:::;.J~:;-II:~.T .. A,.IO" NATIONAL CRIME SURVEY
NATIONAL SMI'U MC50I - IASIC stlliN QUISTION"AIRI "CS·2 - CRIMIINCIDINT III'OIlT
Serl., N ~~~~~=b.~--~C
·~rr,~7,;~~~~~~~~~:=~~:=~:7------~~~~-;~~I~ft~C"~·~.~(~C~c~~J-----------------------~!I
, 0 Owned Dr bein, bou,bl. 2 0 ReMed for cash 3 0 No cash renl
: .Olt. compl,ted I I I I
NOTE: Fill NCS·7 Nonlnrerview Record, for Tvpes A. 8. and C nonlnlerv/.wl ..
• T" •• f Ilvln, qu.r' ... (cc 15) HO.llft, Uftlt
1 0 House. aparllllent. flal a C1 HU In "onUanSienl hal.'. mOI.I, etc. J 0 HU- !'ermanent in trlnS; ent hOlel. motel. elc. .0 HU in roominl house 50 Mobil. home Qr uailer .. 0 HU nOI specified above - D.scribe..,
OTHER Unit , 0 Quarters no.l HU in room In: or boardinc house eO Unit nOI permanent in transIent hOlel. mOlel. elc. ~ 0 Vacanllen! slle or trailer lite
100 Not specified abQve - Describe..,
10.1 zoi ,e] 3
-04
ASIC IN EACH
.0'° or more 10 Mobile home or trailer a 0 Onlv OTHER units
9. (Olh" th.ft the , • , .... lln ... ) 4 .... ny .... 1ft thl. hou •• h.l ... ,,,.,. 0 ..... Ift ... from thl •••• r ... ?
'ONo 20 Yes - WIt.,lrln".f ..... 1" ... I. th.,?..,
\ 0 lInd.r SI.OOO zbSI.OOOto f.999 J 0 2.000 to 2.999 40 3.000 to 3.999 sO. 4.000 to 4.999 aD 5.000 to 5.999 10 6.000 to 7.499 • 0 7,500 10 9.999
• 0'0.000 10 I 1.999 100 f2.ooo 10 14.999 1\ 015.000 to 19.999 12 0 20.000 10 24.999
1
a n d
u 0 25.000 to 49.999 2 to 0 SO.ooo and over
~~~------------~ II •• H .... h.ftl .... IN .. 12 , •• , • • f .,. n~ OVER 71
Total number
~. H •••• hoI4 ..... IN,. 12' ..... f .'.-,
_____ Total number
00 None
12. Cr' ... Re,ortl fIIl"-, _____ TOlal number - Fill itelll31
on Control Cord 00 None
13e. u •• of ,.I.phon. (cc 25)
o Phone in unit (Yes In ec 25a)
Phon~ inlerview aeeePlable? (ec 2Se or 2Sd)
I 0 Yes •.••••.••.•• }SKIP 10 ntxt Z 0 No - Refused number applicable item
o Phone elsewhere (Yu in cc 2Sb)
Phone Inlerview acceptable? (cc 2Se or 2Sd)
s c:J Yes •••••.•••.•. }SKIP to next • [] No - Refused number applicable Item
No phone (No i" cc 25a and 2Sb)
ew
I'
\

u. 'If=... 1~1'I0, It. 17. 11. It. zta. I za. 21. 22. 21, 24. UIII IIlLATIOIIIIlIf' All MAIIITAL IIACE 101110111 Silt Alllfto '''cllllll- ''''IIII11~
........ , ImIiVII.
.Inll - 11.111 .0. ~U.,ou'IIiOLD ~:.fll' ITATUI : ~~:~U :::t.1 :::'~~':l
DAY I -" 1I1.IIICOIID (cc 12) ICC 131» I" 17) ICc I') ICc 19.) : (cc 19b) Icc 20) ICc 21) ICC 22)
1.1" !~ @) @,~ @): (§> (§) @) I r.1"" - Soll,ltspondonl Ii" \ IIIId of: 1M. ":1'11,: Ii:1M I n Yes
""'~ ___ -4'l:)T'I. - Soll'respondent 0t: 1'1111. 01 ""d 0t:JWd, 0\:111111 .[JF teJ"o "',,,, ['\ -} r10w hlld '\JO jrJet I I ,_ "", - ~Oly Fill !3hn LiiiO '1_ n C "" -' .. ': Ofiiiii
• C I Ttl, - PtOlY co •• , - NO. • Cl OI",,,.IIU.. • r.: I Sop, I
IcC 231
@) , Cl~" • eJ No
'r.J HI- Fill '8-21 '1:'1 " .. .,."U.. s Cl NIl l .... ---~--....L.L ... C ... ~k-.·-I.,..II-em-~,..o-n-co-v-e-,-p-.'-e.L.-:'I.--:th-!-ls"Ih~ S'mi 264. Hn,' y •• h.n I .. kln, fo, wo.k dUling Ih. POll 4 w •• ks?
C"ICK household IS lISt enume.ation! (Ba" morketi) @ 1 0 Yes No - Wh.n did you la.t wo.k? J-IT_I!,..IrI_. ___ .!:O::..Y;"e:,;s_-....;..S;,;IC;,;IP_I:,;o_C;"h,.:e,;:c ... k ... 11 ... e ... m.,;8;,," ~....!:O=-N ... O ___ -I 20 Less than 5 yeats ago -SKIP to 280
, ~5tr. Dlol y ... lln III thl. 110.," .ft .p.11 1. 1910? 30 S or more years ago} SKIp 10 29 ~ • 0 Yes - SKIP to Check Item 8 20 Nt> • 0 Never worked
~. Wh ... 01101 y.u liv. on A,.iI I, 19701 (Stal., I ••• I,n [email protected] rooiDnwhyy •• COuldMGIIOke ajobLASTWEEK? U.S. ,. ..... I.n, .te.) 052 1 0 No yes - 20 Alfudy had a iob
• 0 Temporary illness SlIle, elC. CounlY 40 Going 10 school
~ c. DI4 you 11 •• '1 •• 101. Ih. 1i .. 11I 01 a clly, towII, vilial" .Ic.? 5 0 Other - Specify?
045 1 ci No 20 Yes - Nome of city. town. "illale. etc. 7l-~=-"':':"'--:--:-:--""""',..-7'".......:;:;:===:::;::======:....l 046 I I I I I I 280. Fo. who .. diel you (1 •• 1) wa.k? (Nome 01 company.
IAsk moles 18+ onlyl business. organization or other employerj Ir.::-. 4. W ... you In th ...... eI Fo .... on A~,iI I, 19701
,.~:;;4::;7 __ .-:D=-Y_e_s-:-~_2..:0=_NO""":'~ __ 7":"'_~--:-__ " ___ -t@ x 0 Never worked - 5IC/P to 29
CHECK It.. Is this person 16 years oid or older?' b. Whol kind 01 bu.in ... 0. Inelu.lry i. Ihl.? (E.g.: TV and ITEM • .,. 0 N~ ,- SIC/P 10 29 0 Yes radio mf, •• reloil shoe slore. Stale Lobar Deportment. form)
260. Wh.t wo .. y.u doln, .... t ",I LAST l'fEEK - (wo.klng. @ i I I I k .. pllli hou .. , goln, to .. hool) 0' .o ... thln, ol .. ? c. Wo •• you _
~ 10 Wo,kin, - SIC/P to 280 60 Unable to work-SICIPt026d @ 'D.n .mplor" 010 PRIV.TE company. bu. in ... or ~ 20 With _lob but nel ill work 70 Relired lncli.idua lor wog •• , 5010ry 0. commi .. ion.?
3 0 Lookin, for work ~ 0 Other - Specify '"'i 20 A GOVERtiMEtiT .mploy •• (Fed •• al, Stat., caunly • • 0 Keepln, house or loco I)? 5 is Gain, 10 school (If Armed Forces. SKIP to 2801 3D SELF·EMPLOYED in OWN b •• in.u. p.of .. sionol
,roetic. tOf farm? b. Did y.u elo any w •• k .t all LAST WEEK, nal counting wo.k
••• u.d th. h •••• ? (Note' If form or business operator in HH. osk aboul unpaid work.1
~ 001'10 Yes - How many hou .. ? - SICIP to 280 •• Did y •• hov. _ j.b af bu.in ... from which yo. w,,,
t ... po.a.lly .b.onl o •• n lay.ff LAST WEEK? @ • 0 No 2 0 .,. es - Absent - SIC/P 10 18_
a 0 Yes - Layoff - SKU' to 27
• 0 Wo.king WITHOUT PAY in lamily bus in ... 0. form?
d. Wh.1 kind of work wor. yo. doing? (E.g.: electrical e~gine.r. stock clerk. tYPist. (ormer. Armed Forces)
@) I I I I •. What "or. you. mol/lmpo.lanl activltl.s or duli .. ? (E.g.:
Iyplng. keeping (lecounl books, selline c(lrs. Armed Forces)
63
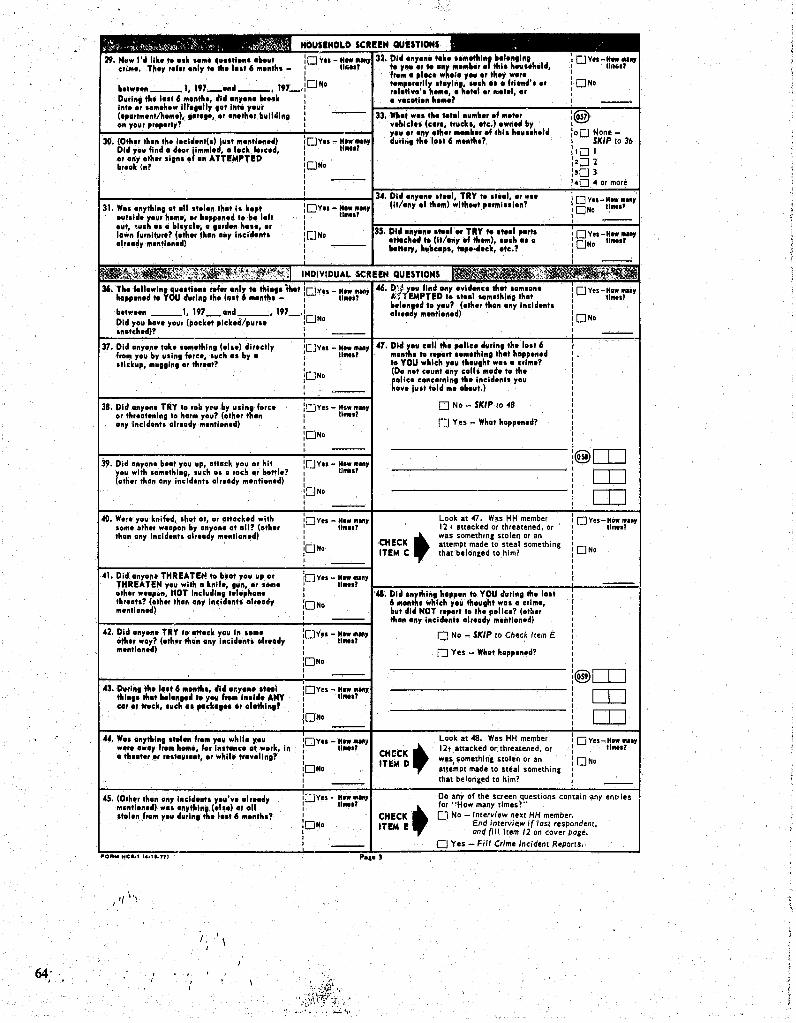
29. Mow 1'4 like te .. k ..... ~u •• tI.o •• hut 10vII-cr'''.' Th.y r.f.r .oly to tho lut 6 ... oth. - : , ~.tw •• o ___ l. 197_004 ___ • 197_.IO N•
Durio. the lo.t 6 .. ooth •• 414 .01.0. ~r •• k : lot. or .o .. ehow 1II.,olly •• t Into your , (oplr .... ot/hl ... ) ••• r •••• Ir .nlth., ~ulldl.. ' 00 your prop.rty?
30. (Dth.r thin tho locI4.ot(.) lu.t ... otlond) 014 you find I d .. r 11 .... ld. I I.ck "rc.d. or ooy oth.r .1, •• ° 0. ATTEMPTED br.ok I.?
, ION. , , ,
- How .... , 11 .... 1
33. Whot wo. tho ou .. hr .f ... t.r vehlcl •• (c .... truch •• tc.) .wo.d by rou .r I.y .th.r ..... ~.r ., thl. hou .. hold durin. the I .. t 6 .... Ih.?
1--------------------.;...-------134. Old o.y •••• t •• I. TRY te .t.ol. or ~ •• (lI/I.y of Ih ... ) without p.""llIlo.? 31. WI. I.ythlo. II III .101 •• Ihol I. klpl
oul.ld. your ho .... or hopp ••• d 1o ~. I.ft out. ~uch "' 0 ~Icycl •• I ,ord •• h •••• or lowo fur.ltur.? (olh.r Ihoo aoy l.cld •• I. olr.ody .... 1I0 •• d)
,oY .. -H ...... ' , 11 .... 1 , , ION. , , ,
36. Th ... lIowl., ~u •• II.o. r.f.r •• Iy te thl.,. ihol ,["ves-hopponod te YOU durl •• tho 10.16 .. o.th. - , ~.
I ~.t"' ••• ___ 1. 197_00d ___ .197_.: N
Did you ho •• your (po chi plchd/purl. ,0 • , 37. Old a.yo •• toh .o ... thl •• (.1 •• ) dlr.ctly
fro .. YOII by u.ln. forc ••• uch II ~y a .lIckup ... u"ln. or throat?
38. Old onyon. TRY to rob y~u by u.ln. forc. or Ihr.ot.nln, 10 hor .. you? (olh.r Ihon any incidonll olr.ady ... nllon.d)
39. Old onyon. b.ot you uP. oll§<k you or hit you with .o .. othin, •• uch a. a rock or Hlllo? (olh.r Ihan ony Incld.nll olr.ody .. onllon.d)
40. W.,. you knlf.d •• hot ot. or ollocked wllh '0". olh.r w.opon by anyone 01 oil? (olh.r than any incid.nt. olr.ody ... nlion.d)
I I I
- HI. man, 11m .. '
ION. I . I
- How mlft, '1 .... 1
:ONo I I
Yes - HI. min, 11 .... 1
IQNO I I
Yes - H" •• lIr 11 .... 1
Yes - HI •• ,ft,
46. D·;~.r.0u fl.d lOY •• Idonc. thai .o .... ne Alrl EMPTED 1o .t.11 .0 ... Ihl., Ihol hlo.,.d 10 you? (oth .. tho. I.y l.eld •• 11 olr.ody .... 1I0 •• d)
47. 014 you call tho pollc. rln. .. ooth. te r.port .o ... thln. thlt te YOU which you thou,ht WII 0 (Do not count onv call ... od. 10 tho polic. conc.rnln. tho Incld.nll you ho •• lu.t told "c OHUt.)
o No - SKIP to 48
!-] Ye5 - Whol hopp.n.d?
I
ION. I I
I
I· I I I I I I I I I I I I I I
1(®IT] 1 IT]
-------------------- ! c==r=:J
CHECK .. ITEM C .,.
Look at ~7. Was HH member 12 + attacked or threatened. or was somethlO& stolen or an attempt m.de to ste.1 something th.t belon,ed to him?
[] Yes - Ho ..... , I - 11 .... 1 I I I
ION. I I I I 41. Old onyo"~ THREATEN 10 b.II you up or
THREA TEM Y"U with a knlf ••• un. or '0 ... oth.r w.op~n. HOT Includln. t.l.phon. Ihr.ot.? (olh.r tho" Iny I"cld.nll 11r.ldy ... nllonod)
11 .... 1 ~-----------------_I_---===:...l
42. Old Inyon. TRY 10 Illock you In .0 ... oth.r way? (oth~r than any Incld.nl. 01r.04y ... ntlon.d)
43. Durl •• tho 1 .. 1 6 .. onth •• 414 .. yoo •• 1 .. 1 thin •• thol hl .... 4 te you , .... I.old. AMY co, 0' truck •• uch 01 pock •••• or clothln.?
44. WI. I.ythln •• tel •• 'ro .. you whilo you wer. aWl, 'rDIll hOflle, for in,tanc. at work, In a th.ot.r or r •• '"ur"nt. or whllo Irl •• lin.?
45. (Oth.r than o.y Incldo.t. you' •• alr.ldy .. ,.tlo.04) WI. o.rthln. (01.0) It all • tol.~ Jro .. you durlo. tho I •• t 6 .. o.tho?
I
iON. I I
I I ·ION.
- MI. _1ft, 11 .... 1
,OV.I-HOW ... , I 11 .... 1 I
'ON.
1:.::J'fes· Ho. I 11 .... 1 I
ION. I I I
te. YOU 4u,I •• tho 10.' you thou.ht wo. I crl ....
but did MDT r.port to Ih. pollc.? (otlt .. than I.y I.cld •• t. liroody .. ontlon.d)
I I I I I I I I
CH!!CK .. ITEM 0.,.
o No - SKIP to Check Item E
rJ Yes - WhIt h.pp.n.d?
Look at ~8. Was HH member 12+ attacked or threatened. or was,somethlr,1 stolen or an attempt mlde to steal somethine that belon,ed to him?
l@[IJ I I , I I I I
IT] IT]
I 0 Yes-How .... , I 11 .... 1
: ON. I I I
Do any of the screen questions contain any entries for hHow many times?" o No -Interview ne .. HH member •
End interview if lost respondent. ond fill item 12 on cover pOle.
Yes - Fill Cri .. e Incident Reports.

,. ;;<:; " :~:'.'. .',';> .• . ~,·/ti:';~~.~l 'I.SOMAL CHA.ACTI.ISTICS' C,;~;';/ZiW::", " ~;.",?~,{~i, 'i;.;>~ .;.- :11 . . 114, 11. I"· 117• 11. It. MI. ... 21. 21. 21. 24. . ". TYI'! 0' . UII llILATIOIIM" "II .IIITAL IACI :0111'1 IIX A_O 1 .... " .. - .... tI'H-
'.TlIIV'.1 1O. TO HOUIIHOLO LAIT ITATUI I :a~I: ~''''"' ..... , ...
HIAO ""H' I ..... IIItI, ... , "EYER - IIG'. OAY I .11 RECOIID I I.c III
I ICC 22) Icc 231 I.c 12) Icc Ubi Icc \7) ICC 191) IIcc lib) Icc 31) Icc 211
LsII @ @ @ @) I@. @ I @ @) @) @) I , 0 PI, - StIl"IIPOllcltll' '1:IHtad '[1M,' '1,:,1. : tf:JM I[')VII , CIVil 2 (:1 T.I. - StIl·'IIPOllcltll' 2[ ,I". 01 "'.d 2 [:J Id. 2 r:l Ne.l .[J F '[IH. .(.]NO
Flrsl '[1 PI,. - ",oaY} Fill ,3bort LiiW IC10wllChiid AP II.] D. , CJ 01. : 00".'11 G;idI • L7I Ttl. - "'oay cov.,_ No. • [') 01"" r.,.II., • Cl StP • I • r:J NI - Fill 16-2' • C'i Nort<,I.II .. sCINM I
I
Look at item 4 on cover pale. Is this the lime 2611. H ... ,ou b •• n I".'n, f •• w~ •• du.ln, tho ,ut 4 w .... ? CHECK. household as last enumeration! (80. I marked) @) , DYes No - When .lId ,ou I .. t wo.k? !TEMA DYes - SKIP 10 Check Ilem 8 ONo a 0 Less than 5 years a,o-SICIP 10 280
250. Old you live In ,hi. hau •• an 1.,.11 1. 1970? J 0 5 or mote yells .,o} SICIP 10 36 19 ' 0 Yes - SKIP 10 Check Ilem 8 zONa o 0 Never worked
b. Wh.r. did ,ou II". on 1.,.11 1. 1970? (St.t •• fo,.'.n countr,. ~7. I. th ••• an, •• oton wh, ,ou could nat take a lob LAST WEEK?
U.S. po ..... io .... 'c.) OS2 'DNa Yes - z 0 Already had. lob
State, etc. County J 0 Tempor.ry illness o 0 Goln, to school
~ c. Old ,ou 1I •• lnlld. ,h. 11,,'11 of a city. town. villa, ••• tc.? 5 0 O,her - Specify?
04S , 0 No z 0 Yes - Nome of city. lawn. villD,e, etc. "1 -046 I I I I I I . 210. For who .. did you (lot') work? (Name of compony.
(Ask males I B+ only' business. or,aniza,lon or o'her employer) i<§V d' W.ro 'OU In ,h. Ar .. od Forco. an 10,.11 1. 1970? 047 , 0 Yes zONa (oSi) x 0 Neve, wo,ked - SKIP 'a 36
CHF:-::'''~ Is this person 16 years old or older! '-' b. Wh.t kind of bu.ino .. or Indultr, I. thlt? (E.,.: TV and ITEM B o No - SKIP 'a 36 DYes rodio mf, .. re'ail shoe Slor •• Sia'e Labor Department, farm)
260. Who' w.ro you doln, .. a.' .1 LAST WEEK - (w.rklnl. @) I , I k •• pln, hou.o.,oln, '0 .chool) .r .o ... thln, 01 .. 1 c. W.ro 'au-
@) , 0 Wo,king - SKIP 10 2Ba GO Unable to '''Ork-SKIP'026d @ , 0 An o .. ploroo of a PRIVATE co .. pony. hu.ln ... or 2 0 With a job but not at work '0 Retired Indlvlduo for w ...... alorl' or co .... I,,'on.?
3 0 Looking for work eO Othe, - Specify """'i z 0 A GOVERNMENT 0 .. ,10,.0 (Fodorol. Sta, •• county.
00 Keepin, house or loco I)?
5 n Goln& to school (If Armed Forces. SKIP 'a 2Ba, J 0 SELF·EMPLOYED in OWN bu.ln .... prof ... lonol
b. Old you do an7 work at all LAST WEEK. no' cauntin, work practice or farm?
around 'ho hou.o? (No,e: If farm or business ope,alor In HH. 00 Workln, WITHOUT PAY In fa .. ,I, bu.lno .. or farm?
ask about unpaid Work.) d. Who' kind of work woro you doing? (E.,.: electrical
® oONo Yes - How .. an, houlI? - SKIP 'a 2Ba engineer, stock "erk, 'ypist, farmer. Armed Farces)
c. Old you hay. a lob or bu.lno .. fro .. which you woro @) I I I I to .. pororlly ob •• n' or on la,off LII.ST WEEK? •• Who' woro ,our mo.'I .. ,ortan' acllvill ... or du,I .. ? (E.,.:
@ 'ONo 20 Yes - Absent - SKIP to 2ea typin,. keepin, accounl books, selling cars. Armed Forces) 3 n Yes - Layoff - SKIP to 27
INDIVIDUAL SCREEN QUESTIONS . ,-
36. Th. follow In, qU.I"on. r.for only to 'hln •• 'I" Yes _ H' ..... y 46. Old you find any .. Id.nc. ,ho' ..... on. "-1 Ves - Ho ..... y that hoppened to YOU during tho 10116 _tho - : 1iI ... 1 ATTEMPTED to ,,'.01 lo .. o,hln, ,ho'
, 11 .... 1
b.tw •• n __ l. 197 __ and __ • 197. __ • 'r) bolon,.d '0 ,ou? (oth.r ,han any :r:J No Did you hovo your (pocket plcked/pu" •• no'ched)?: . No incid.n'. olr.ad, mon,io.od) I ---
I-;-Did anyon. 'ok •• 0 .. o,loln, (01.0) dlroctly 47. Did 'au call tho pollco durin, ,h. 10.,6 .. on,h. to ropor' :P. : I-' Yes - H ...... 1 from 'au b, u.in, for ... luch a. by a I 'iI ... 1 lom.,hln, that happ.n.d to YOU wh!ch you ,hou,h,!"o, a
Itickup. "ulVln, or ,hroat? I r:1 No --- crl .. o? (Do no' coun' any call. m~do to ,h. poll ..
38. Old anyon. TRY 'a rob 'au b, u.ln, forc. :r:,yes - H ••••• y @ concornin, 'ho incldo.1I you ha.o lUI' lold mo about.)
or ,hr.a' •• ln, '0 harm 'au? (othor 'hen an, I U .... , R=1 0 No - SKIP to 4B incld.nll alroad, m.ntion.d) 'I'] No --- DYes - Who' happ.nod?
39. Old anyone b.at 'au uP. attack you or hit you 1 r 1 YU - H ...... , to with lam.thin, •• uch a. a rock or bottlo? I' 11 .... 1 (o,h., ,han "ny Incld.nll alr.ady .. onllonod) Ir:l No --- Look at 47 - ~as HH member 12. In Yes _ H~ ..... ,
40. W.r. you knif.d •• ho' 0'. or attackod wl,h I rJ Yes - H ••••• , CHECK. attacked 6r threatened I or was some· .. t • ""' .. , .omo o,hor w.opon b, an,ono a' all? ("hor I . tl"'ll iTEM C thin, Sllolen or an «tempt made to Ir:l No 'han an, Incidonll alroady ... ntlonod) Ir:J No --- steal sl)methir:1 that Oelon,ed to him?:
41. Did an,on. THreEA TEN to boat 'au u, or I r:l Yes _ How ... ., 41. Did any,hln, happen 'a YOU durin, tho la.t 6 mon,hl which THREATEN you with a knllo.,un.or 10 .. 0 :. 11 .... 1 @ 'au ,hou,II, .'0' a crl .... bu, did NOT r.por' to tho polico? o,h.r w.apon. HOT including t.lophone thrHI'?1 • rn (o,h.r ,h.n 011, Incldonll alr.ad, .. ontionod) (oth., ,hon any incldon .. alraady ,""ntl.,o4) : ['] No --- o No - SICIP to Check Ilem E
42. Old anyone TRY '0 attack 'au In .0 ... in Yes - Hew .... , I::fj 0 Yes -I¥hot hopp.n.d? o,hor way? (o,h.r ,han any Incldo.'. I U .... , olroody montlonod) 1['] No
43. Durin, ,h. 10 .. 6 man,h •• did on,ono "'001 'r:l Yes _ How .... y '. Look at 48 - Was HH member 12+ Inyes- H ...... ' ·,hin" ,ho' bolo",od to you fro .. in.ido ANY: ' 11 .... 1 CHECKt Ittlckf:d or threatened, or was some : 1iI ... 1 car or truck, .~ch a. pac~a ... or clo,hln,? 1\"] No
--~" ITEM 0 thin, stolen or an attempt made to I
44. Woo a."hin, .'ol.n fro .. you whllo you ,r.J Ves - r. ...... , steal somethln, that belon,ed to himqr:l No
We,. away from home, for inslance 01 work, I' tlMIf Do any of the screen questions: contain any entrles In ci ,h.a'.r or ro.taurant. or whll. tr.avolln.?11.I No for '-How. many times?"
45. (O,hor ,han any Incidon'. ,ou'v. alro.4, CHECK. o No - In,erview ne.t HH member •. End interview If Ir.l VII - HOW ... ., ITEM E ,"on'ion.dl Woo on"hln. (0100) at all .'olon : u .... , 'as' responden', and fill item 12 on cover po,e.
fro .. you durin, ,h. IGI' 6 .. on'~.? I[']N. --- DYes - Fi II Crime Inciden' Reports.
FO"M Nee·' 14 .... ' 71 P ••• 4
65
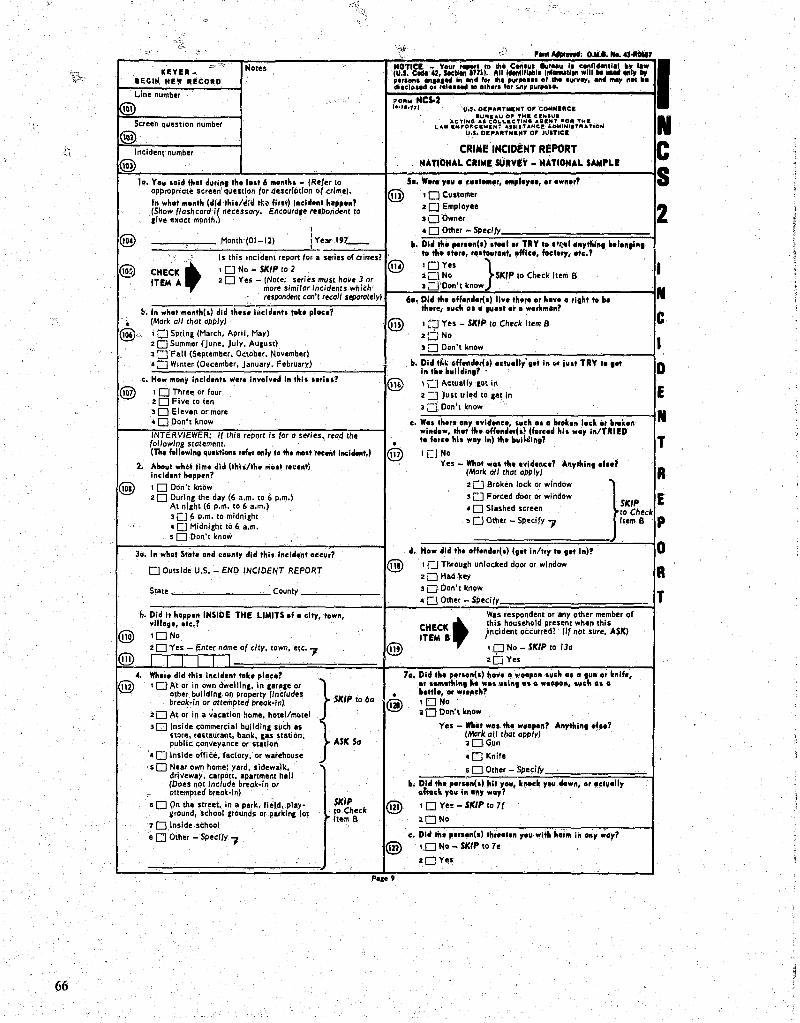
'. / , ,'"c
J\ c> , ... AIPf ..... : 0 .......... UofIOII7 "Y -'-:~ NOles NOTICI _ You.r.",.t 10 !h. C .... u. .. ... u I. confld.,.,., ~~ I ••
KEUII - (u.s. Code 42, SocII .. 17711 .. All IdonIllI.,. '''' ..... 11 .. will. IIIOd "'" ., Ie.GIN. liE'" II!COIIO , ... on ...... Id In .. d 10 .... purpo ... 01 th •• ur.~, IOd m.y ~ .. ~.
Line number dllClol.d or ret •• , .. to olh.r. ror !M1~ purpo".
'Oft .. NC502 @) ' •• 11.17; v.,. DE~ ... ,n"INT 0' CONN. flies
'V"KAU Oil' THE CIIN.UI Screen qUeslion number .. eYING .... <:OLol.I.CTINO AGIINT -0,. THII
LAW &H ... Ofl:c .. "" ..... r ."I.T.H(i.~ Jobfrll!INII"PtATION
<® U.S. DI" ... TMEMT 0' JOSTle.
Incldenl number CRIME INCIDENT REPORT
@) NATIONAL CRIMI SURVIY - NATIONAL SAMPLE
10. Vou .old that durin, th.l.at 6 m.ntha - (Refer to 5 •• W ... ,.u • U''''''', ...,1 •••••••• wn .. ? appropriate screen' questfon for deter/ptfon af erimei. @> 'OCuSlome. In what month (did 'hla/~fJ 'h " .. I) Incld.n, ho".n? (Show flashcard if necessary. Eneoura,e resPondent to
20 Employ,e
,ive exaCI month.1 10 Owner I 40 Other - Specify
® Month (01-12) lYe.r 19Z __ II. Dftl tho po ... n(.) .tHI •• TRV '0 "!;'II'n,thln, ~.I.n.'n, ,-------
·c Is Ihls Incident report for a series 01 crimes! 10 tho .t ..... e'lou.ant, offlc., fact .... OIC.?
@) CHECK t I 0 No - SICIP 10 2 @ 'DYes } 2 C.1 No SICfP to Check Item 8
ITEM A 2 0 Ye~ - (Note: serres must hove 3 or J ;::J'Don't know more similar incidents which
respondent can't re,a/l separately) 6o, Old th. all •• 4.r<I) II •• th". o. ha .. a .I,ht 10 ~.
b. In what month(.) did ,h ... l"cld •• 11 take placo? th •• e •• uch 01 a , ... t or a warlcman?
.. (Mark 01/ that apply) @) 'CJ yes - SICIP to Check Item 8 ~<, '0 Spring (March. April, May) 2DNo
20 Summer (June, july. August) J [] Don'l know 3 [JF all (September, October, Novemberl
~. Old tf.~, oll.nd •• It) oCIu.Ily' ,.t In ~. lu., TRV t. ,., • Q Winter (December. january. February)
c. How mony Incldon'. w ... In.ol •• d In ,hi •• .,i •• ? In tho ~ulldln,? •
@ I C] AClually got In @) I 0 Three or lour 2::J jusl tried 10 gel in
20 FiVe 10 ten 3;j Don'l know
3D Eleven 0. more • 0 Oon'l know c. Waa ,h ... any •• Id.nc •• luch II a hrok •• I.ck or h"ken
INTERVIEWER: I( this report is for 0 stries, read the wlnd.w. thot the offond •• (.) (forc.d hi. w.y In/TRIID
fol/owing statemeot. • to f .... hil ",a. In) tho hulldln,?
(n.. following qu.llli .. a ref .. only to the ma.' ...... , Incl_t.) @) 'CJ NO 2, Allaut whli' "lftO did (thh/lho IftOlt .... nl; Yes - What wo' the •• Id.n .. ? Any thin, .I •• ?
Incldont happon? (Mark oil Ihat apply)
@ 10 Oon'tknow 20 8roken lock or window
20 Durin, Ihe day (6 a.m. 10 6 p.m.) 3 CJ Forced door or window
} SkIP AI nl,ht (6 p.m. 10 6 a.m.) • 0 Slashed screen 306 p.m. 10 midnithl to Check
• 0 Midnight 10 6 a.m. s Cl Olher - Specify -, Item 8
sO Oon'l know
la. In who' StaiD and •• un" did this Incld.n' occur? d. How did tho all.nd.,(.) (g.' In/'ry to g.t In)?
D OUlslde U.S. - END INCIDENT REPORT @) I 0 Throuch unlocked door Dr window 2[]Had key
State CounlY 3D Don'l know
40 Other - Specifv
b. Did it happon INSIDE THE LIMITS of a cit,. town. Was respondenl or any other member 01 villa,., etc.?
CHECK t thl s household present when Ihl s
@) 'DNa ITEM 8 }ncident occurred? (If not su.e, ASIC)
@) 20 Yes - Ente, name of ciry, town, etc. -, <ill) I 0 No - SI</P to 130
I I I I I I 2CJ Yes
4. Whoro did thlt Incldont 'ab plac.? .., 70. Old tho p .... n(.) h ... a ,. .. pon .uch II 0 ,~n or knife.
@) I 0 At Dr in own dwelllnc. In ca .. ge or a •• omo,hln, h. wa. ,,,In, n a ... ,on •• ueh ... Ol~er build inc on property (Includes >- SICIP to 60 • h."I."" w •• nch? break-In or attempted break-in) @) 101010
20 At or in a vacallon home, hOlel/molel ~ 20 Don't know
3 [J Inside commerci.1 bulldlnc such as Yes - What WII tho woap.n? An,thln, .I .. ? store. restaurant, bank. ,as s;tatlon~ >- ASIC So
(Mark ali that apply) publ ic conveyance or slation 30Gun
• o Inside ulllee, lac(ory. or warehouse 40 Knile sO Near oWn home: yard. sidewalk, sOOther Specify
dri veway. carpOtl. apartment hall ~. Old the p .... n(.) hit ,.u. knock ,OY down. 0' .ctually (Does nOl/nclude break-in or
~ attempled break·ln) aftack y.u I" a", way?
.0 On me streel. in a park. fi~!d,play- Sl<IP @) , 0 Ye. - SICIP to 7f , *raund, school ,round$ Dr parklnc lot to Check
70 Inside school Item B 11.0 No
Ii 0 Olher - Specify -, c. Dhl th. p .... n(o) th ••• ton ,.u with harm I. an, w.,?
@) to No - SICIP to 7ft
20Yes
Po,. 9
66
I N C S
2
N C
I
D E N
T
R
E P
o R T
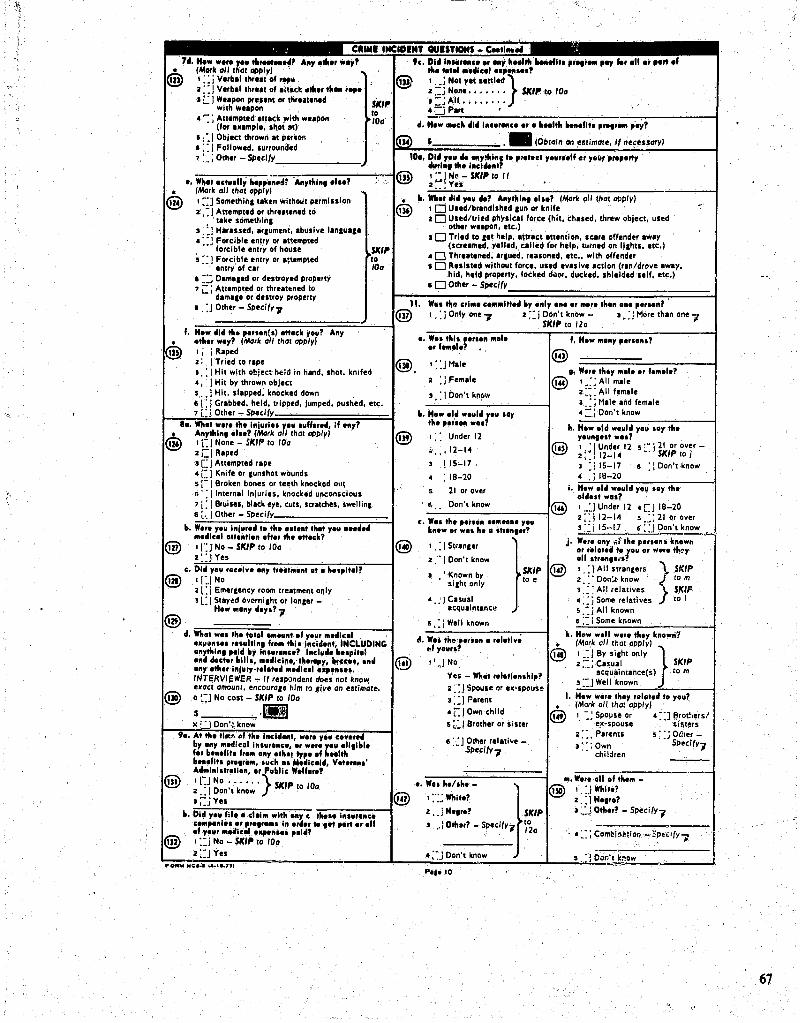
[,
100. Diol ,OU ole e!!,IIolftS to , .. to.t ,0ur •• 1f er ,uu, , .. , • .., ..... Ift. th. Ift.loIeftl'
or ,ort of
=---:-:-:--.-----------~~~r.0<\ 1'- No - SIC',. 10 /I •• Wh.t I.tuall, h.".n"'? Yes
(Mark all Ihal apply) .:;::.:..!...;-:::-.--:~~_:'-__:----..,_--_,_---.---_I I ~:J Somethlnc laken wlthOilI permission It. Wh.t oil" ,.u ole' Aft,thl ••• I .. ? (MGrk all Ihal apply) z';: J Allempled or Ihrellened 10 1 0 USld/brlndlshed cun or knife
Ilk. somelhlnc Z 0 Used/tried physical force (hll. chased. threw objeci. used , ::; Hlrlssed, Ircumenl, Ibuslve IlncuIC. other WI.pon, IIC.) • ::J Forcible enlry or Illempled 10 Trlld 10 cel hllp, IltrlCI IlIlnllon, sCIre of'ender IWIY
'orclble enlry 0' house' SIC',. (screamld, yellld, cliled for help, turned on lichts, etc.) 5:: J Forcible entry orl\lImpted 10.0 Threltened. Ircued. reasoned, etc .. wllh offender
entry 0' Clr 100 10 Reslstld wlthoUI 'orCI. uSld eVIslve ICIIon (ren/drove IW'Y, • ::~ DlmaCld or deStroyed property hid, hlld property, locked daor, ducked, shielded self, elc.)
7 L: j Allimpted or threltened 10 1_-:::-..;·~O:::.;O~th~e:r:,,--=s:p:ec:l~fY:::=:=:==:======:=====~====~ dlm.c. or destroy propelly r • . :J Olher _ SpeclfYjI W •• th_ •• 1 ......... I" ... lty .ftl, ••••• _ •• th ••••• , .... n?
ar"~hol I Li None - SICIP 10 100 z c'1 Rlped , [J Anempted rIpe • C J Knife o. cunshot wounds 5 [-I B.oken bones or leeth knocked out 6' : Iinternil Injuries. knocked unconscious 7 i: I Bruises, black eye, cuts. saatches. swellinc 0[ . .1 Olher - Specify
It. Iftlu,'" t. tho •• t.ftt , ... .".ft" ••• It •• th •• ,,".k?
No - SIC/P 10 100 Yes
•• 0101 y.u rc •• I .. 1ft, " •• t .... t It I 'I~J No z l: I Emercency room Ireatmenl only , L: 1 Siayed overnicht or lon,er -
Hlw .. I., oIa,.? jI
d. WI. • ...... t •• ~ •••••••• ultl.1 f .... thit a.,thl., palol It, I .. u.a •• a? Iftelu". 0.01 oIe.t •• ~iII ..... oIlelu. th .... " ~u ••• l.tI a.' oth •• 1.lu". ••• I.t." ..... 1 •• 1 •• ,.ft •••• INTERVIEWER - If res/Y.lndenl does nol lenow exocl omounl. encouro,e him 10 ,ive on eSlimale. a ~:J No COSI - SICI,. 10 100
--___ ·IWJJ
b, •• , .. odi.ol I .. ur.ftco •• r f •• Io ••• flh fr_ a.y .th •• bOft.flh pra,r_ •• ueh a • • " .. 1.1 .... " ••••• Puloli. W.lfa •• ? I t:J No •• , , , '} SIC/,. 10 z .: 1 Oon'l know 10 a I;-:j Yes
It, DI" ,.u fil. 0 elal .. with 0., & .... ,a.I •••• , •• ,._. In .riI •• to ,.t pi" .r of ,.ur ... ,lIell • .,.ft ••• ,altl? I ::'i No - SIC/,. 10 100
I • : I Only one 7 z :: j Don't know - 3. :! More Ihln one 7 SIC',. 10 120
I: :JMale
z :1 Femlle
" : I Oon'l kn6w
~, Hlw .ltI wo.loI , •• ,or tho , ..... wo.
I,: Under 12
" .. , 12-1~ 115-17
: 18-20
21 or ave.
f" Don't know
c. WI •• h. ,.,.on I.":"". you kn.w or wa. h. a It'ln,.,?
I , : J Slran,er
2:- J Don't know
, .' Known by siCht only
•. , J Casual acquaintance
}
SK',. 10 e
5 , : 1 Well known
~. Wti. th~ " ..... a •• Iotl •• til,ou,,? .
"<J No
Yes - WhIt ..... " ••• hlp? 2 ::J Spouse or ex'spous,",
3::J Parenl • r.:1 Own child
5 ;.: 1 B.other or siSler
6 :~J Olher reillive-SPecifYjI
., WII h.l.h. - } I :.:~ Whit.?
Z .. I N.,r.? SIC/,.
' .. ,;~spedfY1 \20
4 ::J Don't knr,w
P,.,IO
f, H.w ... ny , ...... ?
@) .' W.r. th., .. II. or f .... I.?
@ I.:;AII male 2 ~:: All female 3.: j Mile and female .:.1 Don't know
h, H.w old wo.ld y.u .oy tho y •• n ••• t w •• ?
I,
I '1 Under 12 5 ," i 21 o. over -2:::12-1~ " SIC/"IO/ 3 :! 15-17 6:: Oon'l know
18-20
olde .. wo.? I,.] Under 12 2:: Ill-l~ 3·· i 15-17
4 [J 18-20 5.:; 21 or over 6" 'I know
W ••• an, "f tho p ...... kn.wn a. r.'a,.d t. YOU or WI •• th~y all .tr .... ,,1 I . : 1 All slran,e.s '\ SK'P z, :' Don;:· know ./ 10 m 1 ., A:I relalives ~ SIC/P· " :: j Some ,elalives ) to I 5 .:i A" known 6 • ... 1 Some known
k, How WIll wor. th., (Marie all thaI apply) I ;~ 1 By sicht only 2 I._I Ca~ual
acquaintlnce(s) to m 3 - Well known
I, H.w ... r. th.y relat.d ,. y.u? (Marie all Ihal apply) 1 :; Spouse or
~x·spouse
z : ~ , Parents ,": Own
.• children
.. , w ••• all of th.m -I. :J Whit.? z.:1 N •••• ?
• - -] a-rot~lersl • ~ $i$t~rs
s::jOtiterSpecify,
, ~:.l.oth.r? - Specify,
67

w ... ,.. tile .. I" , .. _.tIt~ .•.. 1", tit •• fhII"r(.)! , O"Y .. - SIC',. ;10.1 Ilo aON.
.:E===:;:r.====:-=-:-.-::::::==:::;;.---t
t.... ,tltet ., eth ... I. tit.
INTERVIEWER - Includl anYlhl~, Ilalin fram un'lcci,nizait'. bu.'nl .. In re'lICndll!l'. haml. Do nollnclud~ilnYlhln, IIIIIln from o,r",o,nlzabll bu.'n .. , In reljlCndlnl', homl or 'lj16lher bulinl", luch 0' ml"handl .. or cash (ram 0 re,llIer.
i 0 Y .. - SIC'" 10 13f zON.
... Dlllth.: ..... ,.) ATTIM'T .... k""."" •• th.t .. I..... .. , .. If .th." I. tit. hH, ... 1t1? , 0 No - SIC'" 10 131 ' zO ViIs
•• Whet 4111 th., ", t. t.b? A.,thl •• cl .. ? (Marl< all Ihal apply)
'OPU"I z CJ W.ller or mon.y, • D·C.' • [J Olhe, molor vehlcll ~ CJ Perl 01 lear (hubc.p. IIp.-cI.ck. etc.)
• [J Oon'l know 7 Other-
~ Old th.y try 10 lakl I pu .... wlliel.
CHICK or mon.y! /80x lor 2 marhd in 13cl ITIM C ::J No - SIC',. 10 /,'0
·"Y ••
4, W •• the ,., .... f.r I ....... ., rJYI.
No
•. Wh.t 414 he" .. , An,thl ••• 1 •• , (Mark all Ihol , CJ Alllckid ' z w Threatlnld with harm • C J Anlmpted to break Inlo hou.e or .ara.e "t'~Anlmpted 10 bt: .. k inlo car • Ci Harill.d, ar.umenl. Ibu.lvi l.n,uI.e e eJ Oame.ed or destroYld property 7. 0 Anlmpltd Of Ihr.llened 10 dama.e or
dlltroy properlY • 0 Other -'Specify ________ _
f.' Whet ..... k .. "'t .. 1 ... ..-1 .. ,.. ., .th ... I ..... , ..... ~I.4'An,thl ••• I .. l nr.I ,C •• h: ", • • IliBlJ
Ind/or' ", ' Property: f~,j, all IhO! GIIPlyl o 0 Only J~.h takln - SIC',. io He 1 ClPUfIe ". , aOWalier
'~c;J C. • El Other motor Vlhl,11 , • q'PlrloFcaf(hilka,;i8,',-cltck, IIC.)
/-
~ ••• II·
CHICK., ITIM D.,.
Wa' a cer or.oilter mG;ti vahlell taken? (Box 3 or .. mariead In 13f1
o No - SIC',. to C"ack Itam e OYII
H,4 ' ... 1111 ...... . • ',, .... the , ...... wh.
'ONo ...... } z 0 Oon'l know SIC',. to C"eck Itl'" E
'OY" ... DI4 the , ....... tur. the (c.,l_ta, .ahlcl.),
'OVII 2 No
I. Box I or 2 ma,kid in Ill?
o No - SIC',. to 150
DYes
c. W .. the ('ur •• /w.n.t/ .... .,) •• PII' , ...... fe, I.'ta •••• I •• ,.ck.t .r ... , •• h.14 .., ra. Who. It ... t.h.'
'DYes 20No
CHICK .. ITiM ,.,.
Was cash lakin? /Box Om;l(ked in
DYes - SICIP 10 160
ONo
IS.. Alta •• th ... whot w., tho velu •• f tho PROPIRTY thot w •• ,.ko,,' INTERVIeWeR - exclude stolen cash. and enter SO for Slolen chech and credil cards, even If Ihey were used •
s •• ... How 414 ,ou ".~14. the .01 ••• f the "apt'" th.t w •• ... I.,,? A", .th., w.,? (Mark all that apply)
1 ::J Ori.inal COSt
Z ::1 Re~lace",enl cost
J:: J Personal ~stlm'le of currenl value
• ~J insurance reporl eSlimale
5 Cj Pol ice eSlimale
6:: 1 Don't know
70 Olher - Specify -----------__
160. W.. ., ,.rt 0' the .tal .. _ • ., II , .. ,.", 'KIWO..4. not •• u.tI •••• ,thl ....... lve4 Ire. I"".ra,, •• '
1:-J NOne} z:J All SICIP 10 170
J t~j P8rt
•• Whet w .. ,.C •• O,M' A.,thl ••• 1 Ii.?
Ca.h: S ______ •• and/or Properly: ("'ark all Ihal apply)
o ::::::J Cash only recovered - s/c/P 10 170
'0 Purse,
zOWaliet
.DCar
.0 Other "'OIl" vehicl.
,0 Perl of car (hubcap. lapl-cleck. etc.) • ::! O:her - Specify ____________ _
•• Who; ••• the •• Iuo of tho ,rap'", ...... ,<:4 ( .. clu41 •• •• , .... ..4 c.,h)?
s
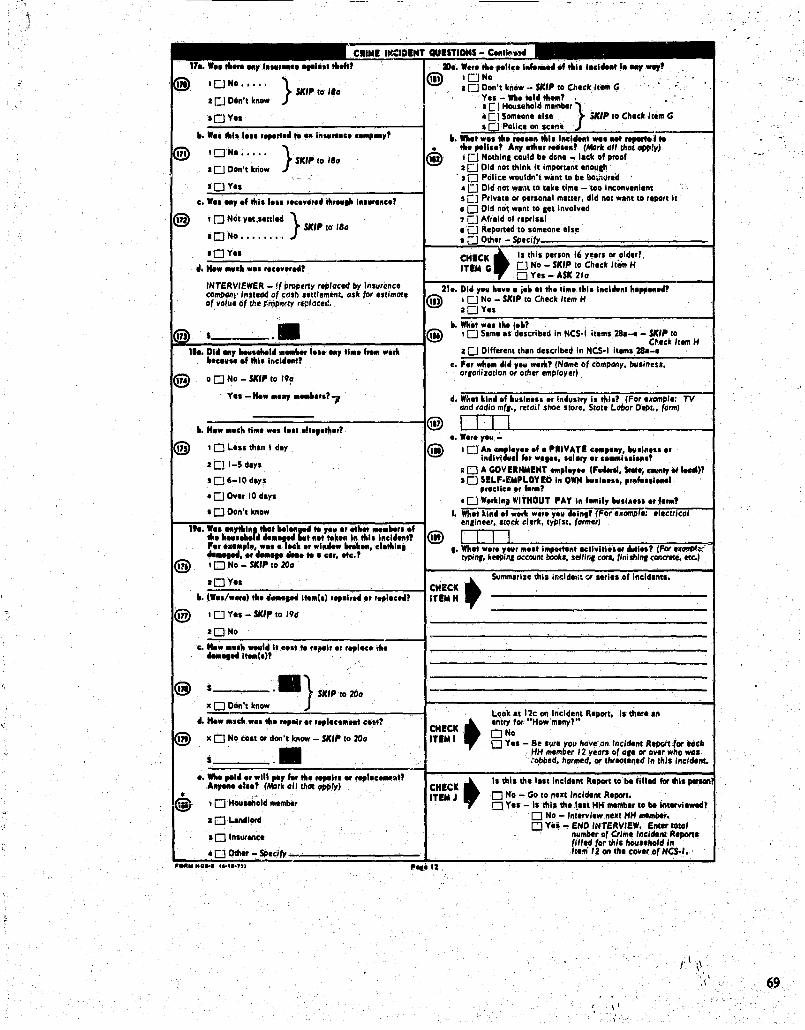
I CJ Don'l know
'CJY" It. W •• 1101. I .... .,.rt .... '" InsurellC. c • .., ... ,?
'0 No..... } S/('''IO Ilia I CJ Don'l know
YII
C, WI. I", .f thl. I ... r ....... " th ..... I ... u ...... ?
'0 NOI YII.selllld } SIC',. 10' Ilia 10No ........
IDYll
.. , ...... clo WII •• c ...... ,
'NTeRVleWeR - If property replaced by insurDnce compan)' in.llod of CQ.h .elliemenl, ask for .. llmale of value of the r:ropcrly rellleced.
• •• , .. , 01" ... , ......... 1 .. "' ...... I ...... , tl ... fre .. w.rt "'c,ue •• f thl. hlCI ..... I?
o 0 No - SIC',. 10 19!,
YI. -Hew "I", ......... '7
It. Hlw .. uch tl ... WI. I •• t .It,,.th.,?
, 0 L ... !hln IdlY
10'-SdIYS
·06-IOdlYs
40 Over 10 dlYs
Wer, 110. ,.lIc. r..t. .... ,f 1101. IlIcl ..... Ie .., wer? 'ONo 10 Don'l know - SIC',. to Chec. It.." G
Ye. - ..... I .. th .. ? . • [ I Houlehold me,~ber 4 [I Someone else SIC',. 10 Chec. Item G
we .... ..,.,..I .. ,.lIc.? A.., ..... M .. d (Mar. all Iha! appM
, 0 No!hln. could be don. -: lack of proo' I [J Old nOI!hlnk II Imporlanl enoulh
.• 0 Pollee would,,'1 wlnl to be bo .. '1'i1reil 40 old nOI WillI 10 like lime - 100 Inconvlnienl 5 [] Prlvete or personll miller. did nOI wanllo r,poll II • 0 Old nOI Wlnl 10 leI Involved
A"aid 0' reprlill Reporled to lomeone els~ Other -
penon 16 yeln or older? No - $/('" 10 ChiC. lIem H Yes - ASIC 210
•• 01" y.u h .... j.1t It the tl ... till. I .. cl ..... t h." ..... ? , 0 No - $/(,,. to Check 'Iem H lOY"
It .... t WII the 1.10' , 0 S.ml IS described In NCS·I illms 281-. - SIC',. to
C~eck II .... H I Differenllhln described in NeS'1 ileml 281-e
c. Fer wh... ,.u •• rt, (Name of company, bullneu, or,anization Or other employer)
•• W ... ,.u-, 0 A .. ....,I.r ••• f • PRIVATE C'''''''Y. ' •• Inl ....
. In"ly'''u .... w ••••••• 11.,,, ce_I .. I,",? Z 0 A GOVERNMENT ... ,1., •• IF ......... " -tr .. leal)? .0 SELF·EMPLOY liD In OWN •• 1 ...... ' ...... 1_1
,.o.tlc ........ ,
.0 W.rtl"l "ITHOUT PAY In f_lI, •• 1" ... I' f ... ?
~1=0~Y_"~~~ __ ~~~ __ ~~~~~-iCH2CK It. (W •• /w".) the 1 .... (.) • .,.1 ...... .,I ..... ? ITEM H
, 0 Yes - SIC',. to 19d
10No
c. H.w ... ch _I .. It c .. t ....... , •••• .,1 ... 1ft • ........ I_(.)?
s ___ .• $/('" to 200
)C Don'l know
... H.w M.h wo. the .. ,.1 .... .,I ........ t CII,?
)C 0 No COlt or don't know - SIC',. to 200
s •• e ..... ,.1" .. will ,., fer the ..,.Ira er ..,llc_r.t' A", .. e .I •• ? (Mark 01/ !hac app'y)
\ 0 Hou .... old ... mbe.
10 Landlord
• 0 InlUfence
• 0 Other-"'.M Me... ,.-'e·77,
CHECK ITEM I
CHECK .. ITEMJ .,
12
Look II 12c on Incldenl Reporl. I. thetl In ent., for "Ho. mlny?" DNa o Y.s - 8e sure you have an 'ncldent Rlport.for lach
. HH memb .. r '2 yeors of 0,1 fit' over who IWI' ;~bbed. harmed. fit' threallned In thl. Incldlnt.
I. thl. the I." Incident Rlport to be filled for dli.
o No - Go to next 'ncldenl RePfIt'!. . DYe. - II thl. the last HH ... mblr to be interviewed?
o No - 'ntlrvle. nllft HH member. o Yel - eND INTeRVIew. entlr IOta'
number of Crime 'ncldenl Report • filled for !hI. /tou.eltold In 'tl"" I 2 on thl cov.r of HC5- I •
r \ '\ I • . , .\
I' ., 69

Appendix III
Survey methodology and standard errors
'The National Crime Survey (NCS) is a nationwide household survey focusing on the victimization experiences of individuals age 12 and' over, excluding crewmembers of merchant vessels, institutionalized persons, and Armed Forces personnel living in military barracks.
E~timates presented in this report are based on that portion of the national sample constituting New York State (hereafter referred to as "the State"). NCS data derive from a stratified multistage cluster sample, designed for producing national estimates. In order to obtain reliable State, estimates, it was necessary to perform certain modificati'oris in the procedure used for producing national estimates.
Source of da'ta The primary sampling units (PSU's) comprising the
first stage of the cluster sampling were counties, groups of counties, or large metropolitan areas. Large PSU's were included in the sample with certainty and were considered to be self-representing (SR). For the Nation as a whole, there were 156 SR PSU's. The remaining PSU's, called non-self-representing (NSR), were combined into 220 strata by grouping PSU's with similar demographic characteristics, as determined by the 1970 Census. The strata were formed within the four basic census regions, but not necessarily within States. From the strata of NSR PSU's, one PSU was seh;cted per stratum with probability proportionate to size; and, although there was a sample control requiringc')ome representation in every State, not~1I States were equally represented. For purposes of producing State estimates, an adjustment was made for this"~mequal representation in the estimation procedure described below.
Within each ~R PSU and each selected NSR PSU, a systematic sample of clusters of households was selected. The clusters were formed so that approximately four households were in each one, chosen so that each houl\ehold in a c1ustep had the same initial probability of selection. To account for units built after the 1970 Census, a sample was drawn, by means of an independent clerical' operation, of permits issued for the construction
.. of residential housing. Jurisdictions that do not issue permits were included by means of a sample of area segments. The resulting sample of new construction units,
70
though yielding a r~\latively small proportion of the total sample, has accounU~d for an increasing share as time has elapsed since '1970. ,
For purposes 0(' conducting field interviews, the complete sample is' spread out over 6 months of interviewing so that oni~-sixth of the sample is interviewed each month. A rotatiot' scheme is employed in order to reduce the burden on ttie respondents that would result if they were permanently i\.'1 the sample. This rotation takes the form of replacing one-sixth of each month's sample with new salnple units. Once a sample household is replaced it does not return to sample. The first interview at a sample address is fol' bounding purposes only-i.e., establishing a time frame to avoid duplicative reporting on subseqmmt visits-and data from this interview are not used for making estimates. Therefore, an additional one-sixth sample is interviewed each 6' months for bounding only. Each household remains in the sample for 3 years, granting seven interviews at 6-month intervals.
For the period 1974-77, a yearly average of 16,700 housing units was designated fur the sample, and interviews were obtained from the occupants of an average of 13,500 of these units. The count of housing units interviewed includes those in which at least one member, but not necessarily all those eligible, was interviewed. Of the 3,200 housing units for which interviews were not obtained, 2,400 were found to be vacant or were occupied by persons ineligible for the survey. An additional 100 units had been demolished or converted to nonresidential use, or were otherwise ineligible for the survey. For the remaining 700 housing units (about 5 percent eligible for interview), no occupants were interviewed because they could not be contacted after repeated visits, declined to be interviewed, Were temporarily absent, or were otherwise 110t available. A yearly average of about 29,800 occupants of New York State residential units were contacted personally by Census Bureau interviewers during 1976 and 1977. Interviews were obtained from some 29,000 of these persons, or about 97 percent of the total. Data on the distribution of personal interviews and noninterviews are not available for 1974 and 1975.
Estimation procedure The estimation procedure is performed on a quarterly
basis to produce estimates of the volume and rates of victimization. Sample data from 8 months of field interviewing are required to produce a quarterly estimate. For example, as shown on the accompanying chart, data ,collected during the months of February through September are required to produce an estimate for the first quarter of any given calendar year. In addition, each quarterly estimate is made up of equal numbers of field observations in which a specific month of occurrence was from 1 to 6 months prior to the time of interview. Thus, incidents occurring in January may be reported in a February interview (1 month ago) or in a March interview (2 months ago) and so on up to 6 months ago for interviews conducted in July. One purpose of this

arrangement is to minimize expected biases associated with the tendency of respondents to place criminal vict.imizations in more recent months during the 6-month recall period than when they actually occurred. Similarly, annual. estimates are derived by accumulating data from the four qU;irterly estimates which, in turn, are obtained from a total of 17 months of field interviewing from February of one ye,ar through June of the following year.
The estimates produced from the sample data were obtained by means of assigning weights to sample persons and sample households. These weights were applied to the sample results in order to inflate them to the level of the State population. A weight consisted of the product of the factors described below, reflecting certain modifications in the procedure for producing U.S. estimates. The ratio factors described in step #6, below, were unique to the estimation procedure for State data.
I. The reciprocal .of the initial probability of selection. This factor was the same f?r all sample units.
2. A duplication control factor to reflect any subsampling that was done after the initial selection.
3. An adjustment to reduce bias resulting from the noninterview of eligible households. This adjustment was computed within cells that were defined for groups of PSU'shaving similar demographic characteristics. Cells were defined separately for six groups-combinations of two race categories and three residence categories.
S~parate adjustment factors were calculated for these rIOninterview c.ells, for housing units within SMSA's and outside SMSA's, as well as for quarters other than housing units. For the most part, the groups were formed within U.S. regions, but they were not necessarily within S.tate boundaries, so that State estimates may be subject to-certain bias.
4. An adjustment to reflect noninterviewed persons within households where at least one perSon was interviewed. This adjustment was computed for cells defined within each region. Cells for this adjustment were defined separately for 24 groups-combinations of two race. four age, and three household relationship categories.
5. Two ratio estimate factors were calculated using the complete national sample and applied to the State data.
a) A ratio factor applied to data from the NSR PSU's for the purpose of reducing the variance arising from the sampling of PSU's in noncertainty strata. The factor's numerator was the 1970 census population count in collapsed race-residence cells for noncertainty strata, based on SMSA and non-SMSA groups, for four geographical regions. The denominator of this factor was an estimate of the same population based on the 1970 Census population for sample PSU's.
b) The second ratio adjustment was computed and applied on a person basis for various age, sex, and race categories. Its primary purpose was to adjust for
Month of interview by month of recall
Month of interview
January February March April May June July August September October
(X's denote months in the 6-month recall period)
Period of reference (or recall) First quarter Second quarter Third quarter
Jan. Feb. Mar. Apr. May June July Aug. Sept.
x X X X X X X X X X
X X X X X
X X X X X X X X X X X X
X X X X X X
X X X X X X
X X X X X
Fourth quarter Oct. Nov. Dec.
X November .~-------------------------------------------------------------------------
December X X X X X X
January X X X X X X
February X X X X X
March X X X X
April X X X
May X X
June X
July
71
.. " .-
,', rJ..'
'" , ... -differeritial under~overage of persons age l2 and' over, based on independently derived census figures adjusted
" '. for population changes since 1970. ",-'6. Two adQitional r~tio estimate factors were calculated
from ,~the, portion of the national sample located within the Stat;::.' "
a) One, factor, applied only to data from NSR PSU's; was used to adj4st for the unequal population representation that occurred because of the sClection. of such PSU's. II ' '
b) The oth~r ratio factor adjusted weighted sample estimates of the civilian noninstitutional population age
{) 12 and over to ind!lpendently derived census figures for the same population as of Plidyear 1974 through 1977.
The above'factors were"used in the"derivation of each person's final weight. In addition, if a personal crime inciden't involved more than one victim, a factor was applied to the final 'weight to adjust for the chance of multiple. reporting of the incident. The weight calculated for householq estimates did not include the adjustment for noninterviewed persons within households where at least one person was interviewed (step 1/4, above); and it did not include an ~djustment for incidents, as each criminal act against a household was considered a single victimization. When a p~rsonal crime was reported in the survey as having occurred simultaneously with a commercial burglary or robbery, it was assumed that the incident was essentially a commercial crime, and therefore, it was not counted as an incident of personal crime. However, the details of the event as they related to the victimized individual were included in the survey results. Also, the ratio estimate factor described in step #5b, above, was applied to households by using the characteristics .of the wife in a husband-wife household and those of the head of .household in other households. This procedure is thought to be more precise than that of uniformly using the characteristics of the head of household, because sample coverage generally,is better for females than for males.
The estimated number of crimes is based on data weighted ,as described above, calculated on the basis ofan annual average for the period 1974-77. The victimization rates are based on the weighted estimates of numbers of
'personal or household victimizations added for the years '1974-77 and divided by the sum of weighted estimates of the total number of persons or households for these years.
Series victimizations Victimizations that occurred in series of thrt;e or more
for which the victim was unable to describe the details of each event have been excluded from the analysis and data tables itf this report. Because respondents had difficulty." pinp"ointing the dates of these acts, this information was recorded by the season (or seasons) of occurrence within the 6-month reference period and tabulated by the quarter (lfthe yt;ar.in which the data were col/ected. But, fpr the majori~y of crimes, the data were tabulated on the basis of the specific month of occurrence to produce quarterly estimates. '
72
An examination of national data on series victimizations shows tti~t, these crimes fend disproportionately to be either assaults, more often simple than aggravated, or household larcenies for which the amount of loss was valued at less than $50. Although series victimizations, if combined with the main body of crime data, would increase the reported levels of crime, it is believed that there would be very little impact (,)n year-to-year change
. in victimization rates. Efforts are underway to study the nature of series victimizations in greater detail, in order to gauge more accurately their relationship to regular victimizations.
.Rellabillty of estimates The particular sample used for the NCS is only one of a
large number of possible samples of the same size that could have been selected using the same sample design and sample selection procedures. Estimates derived from different samples would differ from each other. The standard error of a survey estimate is a measure of the variation amoqg the estimates from all possible samples, and is" therefore, a measure of the precision with which the estimate from a pa'rticular sample approximates the average of all possible sample estimates. The estimate and its associated standard error may be used to con!itruct an approximate confidence interval-that is, an interval having a prescribed probability that it would include the average of all possible sample estimates. This average mayor may not be contained in any particular computed interval. But, for a particular sample, it can be determined with specified confidence that the average of all possibl~' sample estimates is included in the constructed interval.
Uall possible samples were selected under essentia!1y the same, general conditions and using the same sample design, and if an estimate and its estimated standard error were calculated from each sample, then:
1. Approximately 68 percent of the intervals from one standard error below the estimate to one standard error above the estimate would include the average for all possible samples.
2. Approximately 90 percent of the intervals from 1.6 standard errors below the estimate to 1.6 standard errors above the estimate would include the average for all possible" samples.
3. Approximately 95 percent of the intervals from two standard errors below the estimate to two standard errors above the estimate would include the average for .. II possible samples.
In addition to sampling error, the estimates presented in this report are subject to nonsampling error. Major sources of such error are related to the ability of respondents to recall victimization experiences that occurred during the 6 months prior to the time of interview. Research on the capacity of victims to recall specific kinds of crime, based on interviewing persons who were victims of offenses drawn from police files, indicates that:assault is the least well recalled of the crimes meas~'red by the NCS. This may stem in part from
j 1

the observed tendency of victims not to report crimes ~ommitted by offenders known to them, especially if they are relatives. In addition, it is suspected that, among certain groups, crimes that contain the elements of assault area part of everyday life and, thus, are simply forgotten or are not considered worth mentioning to a survey interviewer. Taken together, these recall problems may result in a substantial. understatement of the "true" rate of victimization from assault.
Another source of nonsampling error related to the recall capacity of respondents is their inability to place the criminal event in the correct month, even though it is placed in the correct reference period. This source of error is partially offset by the requirement for monthly interviewing and by the estimation procedure described earlier. An additional problem involves telescoping, or bringing within the appropriate 6-month period incidents that occurred earlier-or, in a few instances, those that happened after the close of the refc~ence period. The latter is believed to be relatively rare because 75 to 80 percent of the interviewing takes place during the first week of the month following the reference period. In any event, the effect of telescoping is minimized by the bounding procedure described above. The interviewer is provided with a summary of the incidents reported in the preceding interview and, if a similar incident is reported, it can then be determined from discussion with the respondent whether the reported incident is indeed a new one.
Methodological research undertaken in preparation for the Nes indicated that substantially fewer incidents of crime were reported when one household member reported for all persons residing in the household than when each household member was interviewed individually. Therefore, the self-response procedure was adopted as a general rule; allowances for proxy response under the contingencies discussed earlier are the only exceptions to this rule.
Despite these attempts to minimize the effect of victim recall problems, memory lapses inevitably occur. Some evidence of the extent of this problem will be obtained from the findings of a reinterview program in which a natioml.l sample of approximately 5 percent of the interviewed cases in each month are interviewed a second time by a supervisor or a senior interviewer. Differences between the original interview and the reinterview are reconciled by discussion between the reinterviewer and the respondent. However, no definitive results are yet available from this program.
Other sources of nonsampling error result from other types of response mistakes, including errors in reporting incidents as crimes, mistaken classification of crimes, systematic data errors introduced by the interviewer, biases resulting from the rotation pattern used, errors in coding :and processing the data, and incomplete sampling frames (e.g., a large number of mobile homes and one small class of housing unit constructed since 1970 are not included in the sampling frame). Quality control and edit
procedures were utilized at various steps of the survey operation to keep the nonsampling "errors at an acceptably low level.
As calculated for the NeS, the standard errors partially measure only those nonsampling errors arising from random response and interviewer errors; they do not reflect any systematic biases in the data. In order to derive standard errors that would be applicable to a wide vari~ty of items and could be prepared at a moderate cost, a number of approximations were required. As a result, the parameters displayed in the table at the end of this appendix and used for calculating standard errors provide an indication of the order of magnitude of the standard errors rather than the precise standard error for any specific item. The parametel's are based on modifications made in the national estimation procedure to reflect the State population and the effect of the correlated data from partially overlapping samples.
Application and computation of standard errors
Results presented in this report were tested to determine whether or not statistical significance could be associated with observed differences between values. Differences were tested to ascertain whether they were significant at 2.0 standard errors (95-percent confidence level) or 1.6 standard errors (90-percent confidence level). For this report, differences that failed the 90-percent test were not considered statistically significant.
Formula 1. Standard errors for estimated numbers of victimizations or incidents may be calculated by using the following formula:
s.e.(x) = oJax2 + bx
In this formula, "x" is the estimated number of personal or household victimizations or incidents, and "a" and "b" are parameters found in the accompanying table. The formula can be used for testing either average annual figures or estimates for individual years.
To illustrate the use of Formula 1, Data Table 19 shows that the 1974-77 average annual number of robbery victimizations committed by strangers was 121,300. This estimate and the appropriate parameters, a = - 0.0000003 and b = 800, are substituted in the formula as follows:
s.e.{x) = , (-0.0000003)(121,300)2+ 800(121,300) = 9,900 (rounded to nearest 100)
This means that the confidence interval around the estimate of 121,300 at one standard error is 9,900, and the confidence interval at the second standard error would be double that figure, or 19,800.
Formula 2. Standard errors for estimated average annual 'victimization rates may be calculated by using the following formula: I"''''':'' ---_ b
s.e.(r)- z r(IOOO-r) I n this form ula, "z" is 4 times the size of the population. subgroup that is the base of the rate or proportion; "r" is the estimated rate or proportion for which the standard error is being computed; and "b" is the parameter in the accompanying table.
, 73

To illustrate the use of Formula 2, Data Table 4 shows an estimated robbery rate' of 10.7 per J ,000 persons age 25-34. The appropriate base figure to be used in the formula is 4 times the average yearly base shown in that data table. or 10,269,600 (4 x 2,567,400). And, the "b" parameter corresponding to that 4-year aggregated base is 2,300. The calculation proceeds as follows:
s.e.(r) = =1.5
2300 . (10.7)(IOOO-W.7) 10,269,600
This means that the confidence interval around the estimate of 10.7 at one standard error is 1.5, and the confidence interval at the second standard error would be double that figure, or 3.0
Formula 3. The standard error of a difference between fWo estimates is approximated with the formula:
s.e.(Xt - X2) = , [s.e.(Xtp + (s.e.(x2)2] where Xl and x2 represent the two estimates. The formula will represent the actual standard error quite accurately for the difference between uncorrelated estimates. If, however, there is a large positive cnrrelation, the formula will overestimate the true standard error of the difference; and if there is a large negative correlation, it will underestimate the true standard error of the difference.
In the preceding example, the standard error of the estimated rate of 10.7 was calculated using Formula 2. Table 4 of the report provides a second estimated rate of 7.5 robberies and an average yearly base of 2,941,300 for the 35-49 age group. Using Formula 2 again, it can be found that the standard error C?f this rate is 2.4. Applying
Personal and household crimes: Parameters used for calculating standard errors
Annual average
a b
Total personal crimes -0.0000011 1,500 Crimes of violence -0.0000009 1,400
Rage -0.0000006 900 Ro bery -0.0000003 800 Assault -0.0000008 1.300
Crimes of theft -0.0000008 1,300
'rotal household crimes -0.0000008 1,300 Burglary -0.0000006 1,000 Household larcenx -0.0000008 1,400 Motor vehicle the ~0.0000006 900
Formula 3 with r l =\0.7 and r2 =7.5 then s,e.(l't-r2)'; ~(1.5)1+(1.2)l
= 1.9 This means that the chances are 95 out of )00 that the
estimated difference based on the sample would differ from the average difference from all possible samples by less than twice the standard error, or 3.8, The 95-percent confidence interval around the difference of 10.7 - 7.5 = 3.2 is from -0.6 to 7.0 (i.e., 3.2 plus and minus 3.8). Because this confidence interval includes negative values, it cannot be concluded with 95-percent confidence that this difference stems from factors other than sampling error.
The ratio of a difference to its standard error also may be used for determining its level of statistical significance. For example, a ratio of 2.0 or more denotes that the difference is significant at the 95-percent confidence level; a ratio from 1.6 to 2.0 indicates that the difference is significant at a confidence level between 90 and 95 percent; and a ratio of less than 1.6 defines a level of confidence below 90 percent. In the above example, the ratio of the differ;;nce 3.2 to its standard error 1.9 equals 1.7. It can, therefore, be concluded that there was a difference significant at a confidence level in the 90 to 95 pen;ent range for the robbery rates for persons age 25-34 and 35-49.
Specific standard errors for household crimes may be computed by using the same formulas. In Data Tables 19-71, percents rather than rates are used, requiring that the formula 2 value of 1,000 be replaced by 100 for computation of the corresponding standard errors.
Individual year Four-year aggregate'
a b b
-0.000187 2,700 5,400 -0.000187 2.700 4.800 -0.000187 2.700 3.000 -0.000187 2.700 2,300 -0.000187 2,700 4,800 -0.000187 2,700 4,800
-0.000166 2.300 4,800 -0.000166 2,300 3,300 -0.000166 2,300 4.800 -0.000166 2,300 3,000
1The paramelers listed are for use in conjunclion only wilh Formula 2, v.nich requires that lhe denominalor (but nol the numeralor) of a given rale or percenl be aggregated for Ihe 4·year period; "a" paramelers are nol necessary for lhis test.
74

Appendix IV
Technical notes Information provided in this appendix is designed to
aid in understanding the report's selected findings and, more broadly, to assist data users in interpreting statistics in the data tables. The notes address general concepts as well as potential problem areas, but do not purport to cover all data elements or problems. The glossary should be consulted for definitions of crime categories, variables, and other terms used in the data tables and selected findings.
General Throughout this report, victimizations are the basic
unit~ ()f measure. A victimization is a specific criminal act as it affects a single victim, whether a person or household. For crimes against persons, however, some survey results are presented on the basis of incidents, not victimizations. An incident is a specific criminal act involving one or more victims and one or more offenders. For many specific categories of personal crime, victimizations outnumber incidents, a difference that stems from two contingencies: (I) some crimes were simultaneously committed against more than one person, and (2) certain personal crimes may have occurred during the course of a commercial offense. Thus, for each personal victimization reported to survey interviewers, it was determined whether others were victimized at the same time and place and whetHer the offense happened during a commercial crime. A weighting adjustment in the estimation procedure (see Appendix III) protected against the double counting of incidents; this adjustment continued to be made after the suspension of the commercial victimization survey during 1977. If, for example, two customers were beaten during the course of a store holdup, the event was assume~ to be a commercial robbel'y, not an incident of personal assault. With respect to crimes against households, there is no distinction between victimizations and incidents, as each criminal act against a residence was assumed to have involved a single victim, the affected household. In fact, the terms "victimization" and "incident" can be used interchangeabley in analyzing data on household crimes.
As indicated with respect to personal crimes, victimization data are more appropriate than incident data for the study of the effects, or consequences, of crime experiences upon the individual victim. They also are better suited for assessing victim reactions to criminal
attack and for examining victim perceptions of offender attributes. Thus, in addition to serving as a key element in computing victimization rates, victimization counts are used for developing information on victim injury and medical care, economic losses, time lost from work, victim self-protection, offender characteristics, and reporting to pollc~. On the other hand, incident data are more adequate for the examination of the circumstances surrounding the occurrence of personal crimes. Accordingly, data concerning the time and place of
. occurrence of such offenses, as well as the use of weapons and number of victims and offenders, are based on incidents. E'
In the hypothetical case given above, therefore, the rate data for.personal assault would reflect the attack on each customer, and other victimization tables would incorporate details concerning the outcome of the crime for each person, such as any injuries, damage to clothing, and foss of time from work,
For data on crimes against persons, the table titles stipulate whether victimizations or incidents are the relevant units of measure.
Victim characteristics A variety of attributes of victimized persons and
households appear on victimization rate tables. The rates, or measures of the occurrence of crime, are computed by dividing the number of victimizations associated with a specific crime, or grouping of crimes, by the number of persons or households under consideration. For crimes against pen;ons, the rates are based on the total number of individuals age 12 and over, or on a portion of that population sharing a particular characteristic or set of traits. Household crimes are regarded as being directed against the household as a unit rather than against the individual members; in calculating a rate, therefore, the denominator of the fraction consists of the number of households in question.
As indicated previously, victimizations of households, unlike those of persollls, cannot involve more than one victim dl.iring a specific criminal act. However, repeated victimizations of individuals or households can and do occur. As general ~ndicators of the danger of having been victimized during the reference period, the rates are not sufficiently refined to represent true measures of risk for specific individuals or households. In other words, they do not reflect variations in the degree of risk of repeated, or multiple, victimizations; and, because of the manner in which they are calculated, the rates in effect apportion multiple victimizations among the population at large, thereby distorting somewhat the risk that any single person or household had of being victimized.
Victim-offender relationship in personal crimes of violence
One of the more significant dimensions of personal' crime concerns the relationship between victim and
75

offender. Public attention about crime in the streets in l' ,0
large "measure ha,s focused on unprovoked physical attacks made on citizens by' unknown assailants. The nature of the r.alationship between victim and offender is a key eJement to understanding crime and judging the risks involved for the various groups in society. Heretofore, the only available national statistics on the maher have been for homicide; these have demonstrated that tht} great majority of murder victims were at least acqliainted with their killers, if not related to them. With respect to the personal crimes of violence that it measures, the National Crime Survey makes possible an examination of the relationship between, victim and offender.
Based on information from Tables 19-23, treatment of the-!~ubject centers on a special section of the selected findings. Nevertheless, the relationship between victim .andoffender is a recurrent variable in findings and in Gil tables dealing with other subjects, such as weapons use and reporting to the police. Conditions governing the classification of crimes as having involved "strangers" or "nonstrangers" are d~scribed in the glossary, listed under
ceach of those categories.
"Oitender characterlltici In perlonal crlmel of violence
Some of the tables on this subject display data on the offenders only and others cover both Victims and offenders. The offellder characteristics examined are sex, age, and race, based on information furnished by victims
d who s~;w the offenders and, consequently, knew the number" of persons Involved in 'the crime. As with most information developed from this survey, offender attributes are Q,ased solely on the victim's perceptions and ability to reca'fl the crime. Hdwever, because the events often were stressful experiences, resulting in confusion or physical harm to the victim, it was likely that data concerning offender characteristics were more subject than other survey findings to distortion arising from erroneous responses, Many of the crimes probably occlJrred under somewhat, vague I.:ircumstances, especially those at night. Furthermore, It is possible that victim preconceptions, or prejudices, at times may have influenced the attribution of offender characteristics. If victims tende<,t to misidentify ~ particular trait (or a set of them) more than others, bias would have been introduced into the findings, and no ~ethod has been developed for determining the ~xistence and effect of such bias.
In the relevant data tables, a distinction is made between "single-offender" and "multiple-offender" crimes, with the latter classification applying to those committed by two or more persons: As applied to multiple-offender crimes, the category "mixed ages" refers to cases in which the offenders in any single incident were classifiable under more than one age group; similarl!'"the term "mixed races" applies to situations in which the offenders were members of more than a single racial group.
76
Number of vlctlml As noted previously, the number of individuals victim
ized in each personal crime is a key element for computing rates of victimization and other data on the impact of crime. However. the data table specifically concerning the number of individual victims per crime is based on incidents.
Time of occurrence For each of the measured crimes against persons or
households, data on when the offenses occurred were obtained for three broad time intervals: the daytime hours (6 a.m. to 6 p.m.); the first half of nighttime (6 p.m. to midnight); and the second half of nighttime (midnight to 6 a.m.).
Place of occurrence For data from the household survey, tables on place of
occurrence distinguish six kinds of sites, two of which cover the respondent's home and its immediate vicinity. For certain offenses not involving contact between victim and offender, .the classification of crimes is chiefly determined on the basis of their place of occurrence. Thus, by de'finition. most household burglaries happen at principal residences, with a small percentage at second homes or at places occupied temporarily, such as hotels ~nd mGtels. Personal larceny without contact and household larceny are differentiated from one another solely on the basis of where the crimes occur. Whereas the latter transpire only in the home and its immediate environs, the former can take place at any other location. To be classified as a household larceny within the victim's own home, the offenses had to be committed by a person (or persons) admitted to the residence, or by someone having customary access to it, such as a deliveryperson, servant, acquaintance, or relative. Otherwise, the crime would have been classified as a household burglary, or as a personal robbery if force or the threat of force were used.
Number of offenders In personal crimes of violence
One table based on incident data displays information on the number of offenders involved in personal crimes of violence. In the sequence of survey questions on characteristics of offenders, the lead question concerned the number of offenders. If the victim did not know how many offend~rs took part in the incident, no further questions were asked about offender characteristics, and the crime was classified as having involved strangers.
Use of weapons For personal crimes of violence, information was
gathered on whether or not the victims observed that the offenders were armed, and, if so, the types of weapons observed. For purposes of tabulation and analysis, the mere presence of a weapon constituted "us,e." In other
. words, the term "weapons use" applies both to situations in which weapons were used to intimidate or threaten and

to those in which_ they actually were employed in a physical att!;1ck. ,.
In addition to firearms and knives, the data tables distinguish "other" weapons and those of unknown types. The category "other" refers to such objects as clubs, stones, bricks, and bottles. For each personal crime of violence by an armed offender, the type, or types, of weapons present were recorded, not the number of weapons. For instance, if offenders wielded two firearms and a knife during a personal robbery, the crime was classified as one in which weapons of each type were used.
Victim self·protectlon With reference to personal crimes of violence,
information was obtained on whether or not victims tried to avoid or thwart attack, and, if so, the measures they took. The following reactions, ranging from nonviolent to forcible, were considered self-protection measures: reasoning with the offender; fleeing from the offender; screaming or yelling for help; hitting, kicking, or scratching the offender; and using or brandishing a weapon. The pertinent tables distribute all measures, if any, employed by victims in each crime; no determination was made of the single most important measure.
Physical Injury to victims Information was gathered concerning the injuries
sustained by the victims of each of the three personal crimes of violence. However, during the preparat.ion of this report, the requisite data were not available for calculating the proportion of rape victimizations in which victims were injured. Therefore, information on the percent of crimes in which victims were harmed is confined to personal robbery and assault. For these two offenses, the relationship between seriousness of injury and crime classification is described in the glossary, under "Physical injury."
Victims who had been injured furnished data on hospitalization and on medical expenses. With regard to medical expenses, the data tables are based solely on information from victims who knew with certainty that such expenses were incurred and also knew, or were able to estimate, their amount. By excluding victims unaware of such outlays and of their amount the utility of the data is somewhat restricted. Although data were unavailable on the proportion of rapes attended by victim injury, information relating to hospitalization and medical costs were available for that crime; these results are reflected in the appropriate data tables.
Economic: lo .. es With respect to economic losses incurred by persons or
households, the data tables distinguish between crimes resuiting in "theft and/or loss" and "theft loss" only. Table titles specify the applicable category of loss, The term "theft loss" refers to stolen cash, property, or both, whereas "damage" pertains to property only. Items categorized as having "no monetary value" could include losses of trivial, truly valueless objects, or of those having considerable sentimental importance. References to losses "recovered" apply to compensation received by victims for theft losses, as well as to restoration of stolen property or cash, although no distinction is made as to the manner of recovery. For assault, information on economic losses relates solely to property damage, because assaults attended by theft are classified as robbery. There was no attempt to measure attempted pocket picking; by definition, therefore, all pocket pickings had the outcome of theft loss, and there may have been sorpe cases with property damage. .
Time lost from work For all crimes reported to interviewers, the survey
determined whether persons lost time from work after the experience, and, if so, the length of time involved. With respect to crimes against persons or households, the survey did not record the identity of the household member (or members) who lost work time, although it may be assumed that, for personal offenses, it usually was the victim who sustained the loss.
Reporting vlctlmlzetlons to the pollee
The police may have learned about criminal victimizations directly from the victim or from someone else, such as another household member or a bystander, or because they appeared on the scene at the time of the crime. In the data tables, however, the means by which police learned of the crime are not distinguished; the overaH proportion made known to them was of primary concern.
Interviewers recorded all reasons cited by respondents. for not reporting .crimes to the police. The data table on this topic distributes all reasons for not reporting, and no determination was made of the primary reason for not reporting the crime.
77
Glossary .. Age-The appropriate age category is determitl~:d by
each respondent's age as of the last day of the month preceding the interview.
Aggravated assault-Attack with a weapon resulting in any injury anq attack without a weapon resulting either in
. serious injury (e.g., broken bones, loss of teeth, internal injuries, loss of consciousness) or in undetermined injury requiring 2 or more days of hospitalization. Also includes attempted assault with a weapon.
Annual family income-Includes the income of the household head and all other related persons residing in the same household unit. Covers the 12 months preceding the interview and includes wages, salaries, net income from business or farm, pensions, interest, dividends, rent, .and any other form of monetary income. The income of persons unrelated to the head of household is excluded.
Assault-An unlawful physical attack, whether aggravated or simple, upon a person. Includes attempted assaults with or without a weapon. Exciudes rape and attempted rape, as well as attacks involving theft or attempted theft, which are classified as robbery.
Attempted forcible entry-A form of burglary in which force is used in an attempt to gain entry.
Burglary-Unlawful or forcible entry of a residence, usually, but not necessarily, attended by theft. Includes attempted forcible entry.
Ethnicity-A distinction between Hispanic and nonHispanic respondents,~egardless of race.
Forcible entry~A form of burglary in which force is used to gain entry (e.g., by breaking a window or slashing a screen).
Head of household-For classification purposes, only one individual per household can be the head person. In husband-wife households, the husband arbitrarily is considered to be the head. In other households, the head person is the individual so regarded by its members; generally, that person is the chief breadwinner.
Hispanic-Persons wbo report themselves as MexicanAmericans, Chicanos, Mexicans, Mexicanos, Puerto Ricans, Cubans, Central or South Americans or other Spanish culture or origin, regardless of race.
Household-Consists of the occupants of separate living quarters meeting either ofthe following criteria: (1) Persons, whether present or temporarily absent, whose usual place of residence is the housing unit in question, or (2) Persons staying in the housing unit who have no usual place of residence elsewhere.
Household crimes-Burglary or larceny of a residence
78
or motor vehicle theft. Includes both completed and attempted acts.
Household larceny-Theft or attempted theft of property or cash from a residence or its immediate vicinity. Forcible entry, attempted forcible entry, or unlawful entry is not involved.
Incident-A specific crimi"nal act involving one or more victims and offenders. In situations where a personal crime occurred during the course of a commercial crime, it is assumed that the incident was primarily directed against the business, and, therefore, it is not counted as an incident of personal crime. However, details of the outcome of the event as they relate to the victimized individual are reflected in data on personal victimizations.
Larceny-Theft or attempted theft of property or cash without force. A basic distinction is made between personal larceny and household larceny.
Marital status-Each household member is assigned to one of the following categories: (I) Married, which includes persons having common-law unions and those parted temporarily for reasons other than marital discord (employment, military service, etc.); (2) Separated and divorced. Separated includes married persons who have a legal separation or have parted because of marital discord; (3) Widowed; and (4) Never married, which includes those whose only marriage has been annulled and those living together (excluding common-law unions).
Motor vehicle-Includes automobiles, trucks, motorcycles, and any other motorized vehicles legally allowed 01) -public roads and highways.
Motor vehicle theft-Stealing or unauthorized taking of a motor vehicle, including attempts at such acts. Non~Hispanic-Persons who report their culture or
origin as other than "Hispanic," defined above. The distinction is made regardless of race.
Nonstranger-With respect to crimes entailing direct' contact between victim and offender, victimizations (or incidents) are classified as having involved nonstrangers if victim and offender either are related, well known to, or casually acquainted with one another. In crimes involving a mix of stranger and nonstranger offenders, the events are classified under nonstranger. The distinction between stranger and nonstranger crimes is not made for personal larceny without contact, an offense in which victims rarely see the offender.
Offender-The perpetrator of a crime; the term generally is applied in relation to crimes entailing contact between victim and offender.
Offense-A crime; with respect to personal crimes, the two terms can be used interchangeably irrespective of whether the applicable unit of measure is a victimization or an incident.
Personal crimes-Rape, robbery of persons, assault, personal larceny with contact, or personal larceny without contact. Includes both completed and attempted acts.
Personal crimes of theft-Theft or attempted theft of property or cash, either with contact (but without force or

'" 7'", -------------~
threat of force) or without direct contact between victim and offender. Equivalent to personal larceny.
Personal i!rimes of violence-Rape, robbery of persons, or assault. Includes both completed and attempted acts.
Personal larceny-Equivalent to personal crimes of theft. A distinction is made between personal larceny with contact and personal larceny without contact.
Personal larceny with contact-Theft of purse, wallet, or cash by stealth directly from the person of the victim, but without force or the threat of force. Also includes attempted pUr!;e snatching.
Personal larceny without contact-Theft or attempted theft, without direct contact between victim and offender, of property or cash from any place other than the victim's home or its immediate vicinity. In rare cases, the victim sees the offender during the commission of the act.
Physical injury-The term is applicable to each of the three personal crimes of violence, although data on the proportion of rapes resulting in victim injury were not available during the preparation of this report. For personal 'robbery and attempted robbery with injury, a distinction is made between injuries from "serious" and "minor" assault. Examples of injuries from serious assault include broken bones, loss of teeth, internal injuries, and loss of consciousness, or undetermined injuries requiring 2 or more days of hospitalization; injuries from minor assault include bruises, black eyes, cuts, scratches, and swelling, or undetermined injuries requiring less than 2 days of hospitalization. For assaults resulting in victim injury, the degree of harm governs classification of the event. The same elements of injury applicable to robbery with injury from serious assault also pertain to aggravated assault with injury; similarly, the same types of injuries applicable to robbery with injury from minor assault are relevant to simple assault with injury.
Race-Determined by the interviewer upon observation, and asked only about persons not related to the head of household who were not present at the time of interview. The racial categories distinguished are white, black, and other. The category "other" consists mainly of American Indians and persons of Asian ancestry.
Rape-Carnal knowledge through the use of force or the threat of force, including attempts. Statutory rape (without force) is excluded. Includes both heterosexual and homosexual rape.
Rate of victimization-See "Victimization rate," below. Robbery-Theft or attempted theft, directly from a
person, of property or cash by force or threat of force, with or without a weapon.
Robbery with injury-Theft or attempted theft from a person, accompanied by an attack, either with or without a weapon, resulting in injury. An injury is classified as resulting from a serious assault, irrespective of the extent of injury, if a weapon was used in the commission of the crime or, if not, when the extent of the injury was either serious (e.g., broken bones, loss of teeth, internal injuries, loss of consciousness) or undetermined but requiring 2 or
more days of hospitalization. An injury is classified as resulting from a minor assault when the extent of the injury was minor (e.g., bruises, black eyes, cuts, scratches, swelling) or undetermined but requiring less than 2 days of hospitalization.
Robbery without injury-Theft or attempted theft from a person, accompanied by force or the threat of force, either with or without a weapon, but not resulting in injury.
Simple assaqlt-Attack without II weapon resulting either in minor injury (e.g., bruises, black eyes, cuts, scratches, swelling) or in undetermined injury requiring less than 2 days of hospitalization. Also includes attempted assault without a weapon, ..
Stranger-With respect to crimes entailing direct contact between victim and offender, victimizations (or incidents) are classified as involving strangers if the victim so stated, or did not see or recognize the offender, or knew the offender only by sight. In crimes involving a mix of stranger and nonstranger offenders, the events are classified under nonstranger. The distinction between stranger and nonstrangel' crimes is not made for personal larceny without contact, an offense in which victims rarely See the offender.
Tenure-Two forms of household tenancy are distinguished: (I) Owned, which includes dwellings being bought through mortgage, and (2) Rented, which also includes rent-free quarters belonging to a party other than the occupant and situations where rental payments are in kind or in services.
Unlawful entry-A form of burglary committed by someone having no legal right to be on the premises even though force is not used.
Victim-The recipient of a criminal act; usually used in relation to personal crimes, but also applicable to households or commercial establishments.
Victimization-A specific criminal act as it affects a single victim, whether a'person or household. In criminal acts against persons, the number of victimizations is determined by the number of victims of such acts; ordinarily, the number of victimizations is somewhat higher than the number of incidents because more than one individual is victimizled during certain incidents, as well as because personal victimizations that occurred in conjunction with commercial crimes are not counted as incidents of personal crime. Each criminal act against a household is assumed to involve a single victim, the affected household.
Victimization rate-For crimes against persons, the victimization rate, a measure of occurrence among popUlation groups at risk, is computed on the basis of the number of victimizations per 1,000 resident popUlation age 12 and over. For crimes against households, victimization rates are calculated on the basis of the number of incidents per 1,000 households.
Victimize-To perpetrate a crime against a person or household.
79

U.S. DEPARTMENT OF JUSTICE BUREAU OF JUSTICE STATISTICS
USER EVALUATION Criminal Victimization of New York State Residents
.. NCJ-66481, SD-NCS-S-1
Dear Readet: The Bureau of Justice Statistics is interested in your comments alid suggestions about this repart. We
have provided this form for whatever opinions you wish to express about it. Please cut out both of these pages, staple them together on one corner, and ~l')ld so that the address appears on the outside. After folding, usa tape to seal closed.
Thank you for your help.
1. For what purpose did you use this report?
2. For that purpose, the report- 0 Met most of my needs 0 Met some of my needs 0 Met none of my needs
3. How will this report be useful to you?
o Data source o Othlr (please specify) ____________ _
o Teaching material
o Reference for article \)r report o Will !!.2! bl useful to tnl (please ~xplainJ ______ _
o GIlleral information
o Criminal justice program planning
4. Which parts of the report, if any, were diffie,ult to understand or use? How could they be improved?
5. Can you point out specific parts of the text or table notes that are not clear or term. that need to be defined?
P .... '

6. A~e there ways this report could be improved that you have not mentioned?
7. Please suggest other topics you would like to see addressed in future ref'orts using data from this series.
8. In what capacity did you use this report?
,:::J R_rcher
o Educator
o Student
o Crimine' justice egency employ"
o Government other then crimilNll justice· spt�Cify-------------------------
O~h .... SPtICffy------------------~------------------------------------------------

9. If you used this report as a governmental employee, please indicate the level of government.
o Federal Deity
o State o Other - Specify -o County
10. If you used this report as a criminal justice agency employee, please indicate the sector in which you work.
o Law enforcement (police) o Corrections
o Legal services and ~rosecution o Parole
o Public or private defense services o Criminal justice planning I!gency
o Courts or court administration o Other criminal justice agency - Specify type
o Probation
11. If you used this report as a criminal justice employee, please indicate the type of position you hold. Mark all that apply.
o Agency or institution administrator o Program or project manager
o General program planner/evaluator/analyst o Statistician
o Budget planner/evaluator/analyst o Other· Specify
o Operations or management planner/evaluator/analyst
12. Additional comments
I-~--.'
-
.., .,
I
" NCJ-88481 SD-NCS-S-1
OPTIONAL
~ame Telaphone i' ( )
"
Number and street l
\\
~ity State :lIP Code
- - - - ..-:- _ ... - - - - - - - -~ _. (Fold here). - - - - - - - - - - - - - - - - - - ---
U.S. DEPARTMEl'iT OF JUSTICE ,', Bureau of Justice Statistics
Washington. D.C. 20531
;~!
NCS Program Manager Bureau of Justice Statistics U.S. Department of Justice Washington. D.C. 20531
PLACE STAMP HERE
- - ~-- - - - - - - - -- - - - - - - (Fold here) - - - - - - - - - - - - - - - - - - --
Page 4
1 !
,-!l NCJRS REGISTRATION
· ,;
NCJ~88481 SO-NCS-S-'
The National Criminal.Justice Reference Service (NCJRS) abstracts documents published in the criminal justice field. PerSons who II'e repatered with the Reference Service receive announcements of documents in their stated fields of interest and order forms for free copies of Bureau of Justice Statistics publications. If you are not registered with the Reference Service, and wish to be, please provide your name and mailing address below and check the appropriate box.
N.me
Number .nd atr .. t
Cit,
U.S. DEPARTMENT OF JUSTICE lure .. of Juatlce Statlltic. W.ahlngton, D.C. 20531
State
(Fold here)
User Services Department 2
Te"phone
( ) ,
ZIP Code
National Criminal Justice Reference Service Bureau of Justice Statistics U.S. Department of Justice Box 6000 Rockville. Maryland 20850
(Fold here)
If you wish to receive copies of any of the Bureau of Justice Statistics Reports listed on the reverse 'Side, plea.~e list them below.
0
0
' ....... ndme. NCJRS reglatr.tlon form.
' ....... ndmethe reporta lIated below.
PLACE STAMP HERE
.'

Bureau of Justice Statl.tle. Report. Single coplel ..... v.lI.ble .t no ch.rge from the N.llon.1 Crlmln.1 JUltice Ref.rence Ser;lce, Box 6000, Rockville, M~, 20850~ Mulllple copl.lare for IIle by Ihe Superlntendenl of Documenll, U.S. Governmenl Printing Office, Wal'llllgton, D.C. 20402.
Wstlonal Crime Survey: Crlmln.1 Victimization In the United St.l .. (annual):
Summary Flndi"gs of 1977-78 Changes in Crime and of Trends Since 1973. NCJ-61368 . _
A Description of Trends from 1973 to 1977. NCJ-59893
1978 (final report). NCJ-66480 1977. NCJ-58725 1976. NCJ-·19543 1975. NCJ-44593 1974. NCJ-39467 1973. NCJ-34732
The COil of Negligence: Losees from Preventable Household Burglaries. NCJ-53527
Intlm.te Vlctlml: A Study of Violence Among Friends and Relatives. NCJ-62319
Crime and Sealon.llly, NCJ-64818 Crlriiln.1 Victimization of New York SI.te
Relldents, 1974-77, NCJ-66481 Crlmln.1 Victimization SurveYlln 13
American cltlel (summary report, 1 vol.), ,'NCJ-18471 . ':'Bolton, NCJ-34818
Buffalo, NCJ-34B20 Cincinnati, NCJ-34819 HOUlton, NCJ-34B21 Miami, NCJ .. 34B22 Milwaukee, NCJ-34823
. Minneapolll, NCJ-34B24 New Orleanl, NCJ-34825 O.kland, NCJ-34B26 Plttlburgh, NCJ-34B27 San Diego, NCJ-34B2B San Francllco, NCJ-34B29 Wa.hlngton, D.C., NCJ-34B30
PubUt: Attitudes About Crime (13 vols.): BOlton, NCJ-46235 Buffalo, NCJ-46236 Cincinnati, NCJ-46237 Houston, NCJ-46238 Miami, NCJ-46239 Milwaukee, NCJ-46240 Minneapolis, NCJ-46241 New Orleanl, NCJ-46242 Oakland, NCJ-46243 Pittsburgh, NCJ-46244 S:m Diego, NCJ-46245 San Francllco, NCJ-46246 Washington, D.C., NCJ-46247
Criminal Vlcllmlzatlon Surveys In Chicago, Detroit, LOl Angeles, New York, and Philadelphia: A Comparison of 1972 and 1974 Findings, NCJ-36360
Criminal. Victimization SurveYI In the . Nation's FI'Ie Largest Cltlel: National
Crime Panel SlIi'veys in Chicago, Detroil, Los Angeles, New York, and Philadelphia, Hit2, NC.J-169Q9
Criminal Victimization Surveys In Eight American C,tles: A Comparison of 1971172 and 197417tj Findings-National Crime Surveys in Atlanta, Baltimore. Cleveland, Dallas. Deriver, Newark, Portland, and SI. Louis, NCJ-,3636t
Crimeland Vlctlmli: A Report on the Day tonI San Jose Pilot SUrlley of Victimization, NCJ-013314
Indicators of Crime and Criminal JUltlce: Quantitative Studies, NCJ-62349
Applications of the National Crime Survey Victimization and AHltude Date:
Public Opinion About Crime: The Attitudes of Victims and Nonvictims in Selected Cities, NCJ-41336
Local Vic!lm Suno:;Jys: A Review of the Issues, NCJ-39973
_ The Police and Public Opinion: An Analysis of Victimization and Attitude Data from 13 American Cities, NCJ-42018
An Introduction to the Nalilmal Crime Survey, NCJ-43732
COinpenlltlng Vlctlml of Violent Crime: Potential Costs and Coverage of a National Program, NCJ-433B7
Crime Agalnlt Personlln Urban, SUburban, and Rural Areal: A Comparative Analysis of Victimization Rates, NCJ-53551
Rape Victimization In 26 Amerlcln Cltll.ll, NCJ-55878
Criminal Victimization In Urban Schooli, NCJ-56396
National Prisoner Statistics: Cepltal Punllhment (annual):
1978, NCJ-59897 1979 advance report, NCJ- 67705
Prllonersln State and Federalln,lIIution. on December 31: 1978, NCJ-64671 1979 advance report. NCJ-66522
Cenlulof State Correctional FaCilities, 1974 advance report, NCJ-25642
Profile 01 State Prllon Inmatei: Soclodemographic Findings from the 1974 Survey of Inmates of State Correctional Facilities. NCJ-5B257
Cenlul of Prllonersln State Correctional. Facilltlel, 1973, NCJ-34729
Cenlul of Jalll and Survey of Jail Inmates, 1978, preliminary report, NCJ-55172
Profile 01 Inmates of Local Jails: Socio-demographic Findings from the 1978 Survey of Inmates of Local Jails, NCJ-65412
The Natlon'l Jalll: A report on the census of jails from the 1972 Survey of Inmates of Local Jails, NCJ-19067
Survey of Inmatelof Local Jalll, 1972, advance report, NCJ-13313
Uniform Parole Reports: Parole In the United Slates (annual):
197B. NCJ-58722 1976and 1977, NCJ-49702
Characterlltlc. of the Parole Population, 1978, NCJ-66479
. A National Survey 01 Parole-Related Legilialion Enacted During the 1979 Legislative Session, NCJ-64218
Children !n Custody: Juvenile Detention and Correctional Facility Census 1977advance report:
Cer,sus of Public Juvenile Facilities, NCJ-60967
Census of Private Juvenile Facilities, NCJ-60968
1975 (final report), NCJ-5B139 1974, NCJ-57946 1973, NCJ-44777 1971, NCJ-13403
Myths and Realities About Crime: A Nontechnical Presentation of Selected Information from the National Prisoner Statistics Program and the National Crime Survey, NCJ-46249
State and Local Probation and Perole Systems, NCJ-41335
Slate and Local Prosecution and Civil Attorney Systeml, NCJ-41334
National Survey 01 Court Organization: 1977 ?upplement to State Judicial Systems,
NCJ-40022 1975 Supplement to State Judicial Systems,
NCJ-29433 1971 (full report), NCJ-11427
State Court Model Statistical Dictionary, NCJ-62320
Shlle Court ealeload Statlltlcs: The State of the Art. NCJ-46934 Annual Report, 1975, NCJ-51885 Annual Report, 1976, NCJ-56599
A Croll· City Comparllon 01 Felony eale Prot:;, .. lng, NCJ-55171
Trendlln Expenditure and Employment Data lor the Criminal Jilltlce SYltem, 1971·77 (annual), NCJ-57463
Expenditure and Employment Data for the Criminal JUltice S,ltem (annual) 1978 Summary Report, NCJ-66483 1978 final report, NCJ-66482 1977llnal report, NCJ-53206
Dictionary 01 Criminal JUltlce Data Terminology: Te~ms and Definitions Proposed for In!erstate anCi National Data Collection and Exchange, NCJ-36747
Criminal JUltlce Allenclelln the U.S.: Summary Report of the National Criminal Justice Agency List, NCJ-65560.
Criminal JUltice Agenelelln Region 1: Conn., Maine, Mass., N.H., R.I., Vt., NCJ-17930
2: N.J., N.Y .. NCJ-17931 3: Del., D.C., Md .. Pa., Va., W.Va., NCJ-17932 4: Ala., Ga" Fla., Ky., Miss., N.C., S.C .. Tenn., NCJ-17933
5: III., Ind., Mlch .. Minn .• Ohio, Wis .. NCJ-17934
6: Ark., La .. N.Mex .. Okla., Tex., NCJ-17935 7: Iowa, Kans .. Mo .• Nebr., NCJ-17936 8: Colo., Mont., N.Dak., S.Dak., Utah, Wyo., NCJ-17937
9: Ariz., Calif., Hawaii, Nav .. NCJ-15151 10: Alaska. Idaho, Oreg., Wash., NCJ-17938
Utilization of Criminal Justice Statistics Project:
Sourcebook of Criminal Justice Statlstici 1979 (annual). NCJ-59679
Public Opinion Regarding Crime, Criminal Justice, and Related Topics. NCJ-17419
N:!w Directions In Proces.lng of Juvenile Offenders: The Denver Model. NCJ-17420
Who Gets Detained? An Empirical Analysis ot the Pre-Adjudicatory Detention of Juveniles in Denver, NCJ-17417
Juvenile Dispositions: Social and Legal Factors Related to the Processing of Denver Delinquency Cases, NCJ-17418
Offender-Based Tmnlh'lcl/on Statistics: New Directions in Data Collection and Reporting. NCJ-29645
Sentencing of California Felony Offenders, NCJ-29646
The Judicial Processing of Assault and Burglary Offenders in Selected California Counties. NCJ-29644
Pre-Adjudicatory Detention In Three Juvenile Courts, NCJ-34730
Delinquency O:sposltlons: An Empirical Analysis of Processing Decisions in Three Juvenile Courts, NCJ-34734
The Patterns and Distribution of Assault Incident Characteristics Among Social Areas. NCJ-40025
Patterns of Robbery Characteristics and Their Occurrence Among Social Areas, NCJ-40026
Crime-Specific Analysis: The Characteristics of Burglary incidents.
NCJ-42093 An Empirical Examination of Burglary
Offender Characteristics. NCJ-43131 An Empirical Examination,of Burglary
Offenders and Offense Characteristics. NCJ-42476
Sources of National Criminal Justice Statistics: An Annotated Bibliography, NCJ-45006
Federel Criminal Sentencing: Perspectives of Analysis and a Design for Research, NCJ-336B3
Variations In Federal Criminal Sentences: A Statistical Assessment at the National Level, NCJ-336B4
Federal SentenCing Patterns: A Study of Geographical Variations, NCJ-33685
Predicting Sentences In Federal CoUrtl: The Feasibility of a National Sentencing Policy. NCJ-336B6

U.S. Department .of Justice Bureau of Justice Statistics
Washing tOil, D.C. 20531
Official Business Penalty for Private Use $300
Postage and Fees Paid U.S. Department of Justice Jus 436
SPECIAL FOURTH-CLASS RATE BOOK
. '
1 • . •
U.S-MAIL ®
.... . ~ .. .
(i 1-1 )00<,
S )00<. ::s ~ --< .... (') 1"+ ..... ' a .... N ~ .... 0 =s. o r~ ~
Zi (i)
~
;< * {:I.l • 1""1-~ <rP
~ ('D tf.l .... Q.. ('I),
=S: 1"+; r:tl, '
\

I ,
,~
" ~, ,',
I
I , ,
I
; I ,
I; , I
P i :1 1 ;;
11 ; I ! I
i I n , ,; ; i t
.! '
il ,
;;