criminal justice trends -...
TRANSCRIPT

CRIMINAL JUSTICE TRENDS
Presented at the
Criminal Justice Estimating Conference
Held December 20, 2017
(Web Site: http://edr.state.fl.us)


Table of Contents
Criminal Justice Trends……………………………………………………………… i
Accuracy of the July 21, 2017 Forecast
Monitoring Admissions and Population from February 23, 2017 CJEC....... 1
Components of Admission Errors ............................................................... 2
Crime
Reported Crime ........................................................................................... 3
Reported Crime --Violent and Non-Violent Offenses................................... 4
Uniform Crime Report -- Recent Trends……………………………………… 5
Crime Rate .................................................................................................. 6
Total Arrests ................................................................................................ 7
Arrests by Offense....................................................................................... 8
Judicial System
Felony Filings …………………………………………………………………… 9
Felony Filings by Type….………………………………………………………… 10
Guilty Dispositions ...................................................................................... 12
Guilty Dispositions by Type of Offense………………………………………… 13
Recent Trends in Filings and Guilty Dispositions……………………………… 15
Percent of Guilty Dispositions Imprisoned .................................................. 16
Criminal Justice System Measures ................................................................ 17
Prison Admissions
Admissions to Prison by Fiscal Year............................................................ 22
New Commitments to Prison by Fiscal Year ………………………………… 23
New Commitments to Prison by Calendar Year ……………………………… 24
Conditional and Control Release Violators without New Sentences………… 25
New Commitments Before and After "Zero Tolerance"................................ 26
Technical Violators During and After "Zero Tolerance"……………………… 27
Technical Violators as Percent of Total Admissions………………………… 28
Average Sentence Length of New Commitments ………..…………………… 29
Recent Sentence Length Trends ……………………………………………… 31
Sentence Length Distribution of New Commitments................................... 32
Year-and-a-Day New Commitments ……………………………………...…… 33
Year-and-a-Day New Commitments as Percent of Total…………………… 34
Year-and-a-Day New Commitments by County ……………………………… 35
Short sentences: Hillsborough and Pinellas Counties……………………… 36
New Commitment Detail by County …………………………………………… 37
Population, New Commitments, and Year-and-a-Day Sentences ………… 39
New Commitments by Primary Offense ...................................................... 41

Primary Offense of Year-and-a-Day Commitments ………………………… 46
Third Degree Felons as Percent of New Commitments............................... 48
Monitoring CS/SB 1722 -- 22-Point Diversion ………………………………… 49
Offenders Sentenced to Prison under 10-20-Life …………………………… 50
Other Trends
County Jail Average Daily Population ………………………………………… 52
Sentenced Felons in County Jails as Percent of Total Jail Population …… 54
Offenders on Active Supervision………………………………………………… 55
Offenders with Life and Death Sentences in Prison on June 30…………… 56
Prison Admissions and Population by Fiscal Year ...................................... 58
Age Distribution of Prison Admissions by Fiscal Year................................. 61
Fiscal Year 16-17 Prison Admissions: Top Five Offenses by Age Group.... 62
Age Distribution of the Prison Population on June 30.................................. 63

i
CRIMINAL JUSTICE TRENDS
Accuracy of July 2017 forecast
Admissions since the July conference totaled 11,546—398 less than projected for an error of -3.3 percent. (Page 1)
The end-of-month population on November 30th was 96,637. This was 705 under the projected
97,342 (-0.7% error). (Page 1)
Over 95.0 percent of July through November admissions were new commitments, and the percentage error for this group was slightly more than for all commitments. There were 11,025 new commitments, 426 fewer than projected (-3.7% error). The number of conditional and control release violators returned to prison with technical violations was 28 more than projected (5.7% error). (Page 2)
Crime
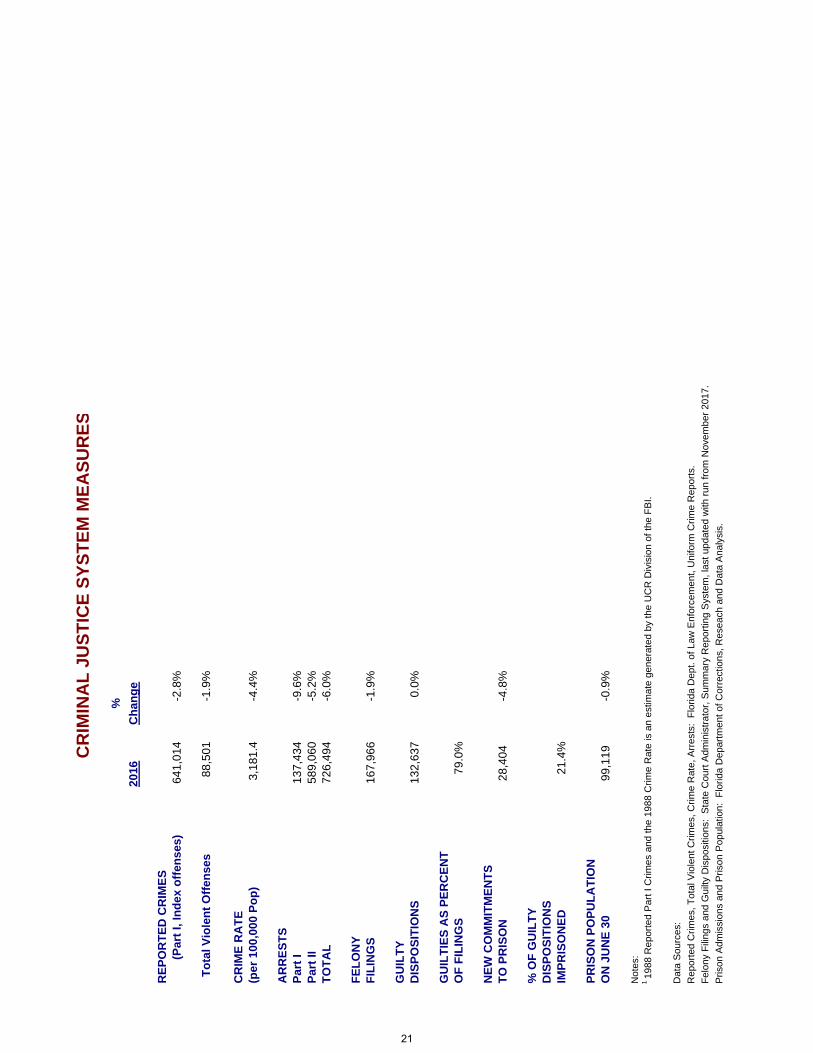
The number of index offenses decreased in 2016 by 18,146 (-2.8%) from the 2015 level of 659,160. The 641,014 index crimes reported in 2016 was lower than reported in any year since 1978. This is the eighth year in a row in which index offenses declined. (Page 3)
The number of reported violent offenses decreased by -1.9 percent in 2016. Violent offenses, which include murder, forcible sexual offenses, robbery, and aggravated assault, were 13.8 percent of all index offenses in 2016, up from 13.7 percent in 2015. Non-violent index offenses include burglary, larceny, and motor vehicle theft. These decreased by -2.9 percent in 2016. Note that drug related offenses are not included in index offenses. (Page 4)
Data for the first six months of 2017 indicate that the number of reported crimes has continued to
decline. The number of total index crimes decreased by -2.0 percent in the first six months of 2017 compared to 2016. The number of violent crimes decreased by -1.2 percent falling to 42,938. Nonviolent crimes decreased by -2.1 percent. (Page 5)
The crime rate fell from 3,326.5 in 2015 to 3,181.4 in 2016 (-4.4%). This decline is greater than
observed in 2015 when the crime rate fell by -3.1 percent. (Page 6) 2016 arrests declined by -6.0 percent, from 773,061 in 2015 to 726,494 in 2016. Arrests for index
offenses declined by -9.6 percent in 2016 while arrests for non-index crimes decreased by -5.2 percent. The largest percentage decrease in index offense arrests was in larceny (down -14.2%). The only increase in index offense arrests was in motor vehicle theft (up 12.6%). (Pages 7 and 8)
Arrests for the first six months of 2017 were down -1.2 percent from 2016. (Page 5)
Filings and Guilty Dispositions
After essentially no change in 2011, the number of felony filings has declined over the last five years.
The number of filings declined by -2.0 percent in 2012, by -6.5 percent in 2013, by -5.6 percent in 2014, by -2.4% in 2015, and by -1.9% in 2016. (Pages 9 and 15)
Violent offense filings decreased by -2.5 percent in 2016 and nonviolent offense filings declined by
-3.4 percent. During the same period, drug filings increased by 1.7 percent. (Pages 10 and 11)

ii
The share of violent filings decreased in 2016 from the prior year and was 20.1 percent of all filings. The share of filings that are nonviolent decreased from 52.8 percent in 2015 to 52.0 percent in 2016, while the share of drug filings increased from 27.0 percent to 27.9 percent. (Pages 10 and 11)
After seven years of decreases, the number of guilty dispositions remained relatively flat in 2016. (Pages 12 and 15)
Violent offense guilty dispositions increased by 1.8 percent and nonviolent offense guilty dispositions
declined by -1.7 percent in 2016 over 2015. During the same period, drug guilty dispositions increased by 2.3 percent. (Pages 13 and 14)
The share of guilty dispositions for violent offenses increased from 17.8 to 18.1 percent between 2015
and 2016. The share for nonviolent offenses decreased and the share for drug offenses increased. (Pages 13 and 14)
The most current available data indicate that filings and guilty dispositions are increasing. Filings for
January through August 2017 obtained from the November 2017 data were 3.8 percent above the January through August 2016 filings obtained in October 2016. January through August 2017 guilty dispositions were 3.5 percent higher than for the same period in 2016. (Page 15)
The percent of guilty dispositions which are imprisoned as new commitments has trended upward from less than 16 percent in the late nineties to 23.3 percent in 2009. The percentage fell for three years but then increased through 2014. Since then, there have been two years of declines, with a decrease to 21.4% in 2016 (down from 22.5% in 2015). (Page 16)
Prison Admissions
There were 29,432 admissions to prison in FY 16-17, down -5.2 percent from FY 15-16. This continues the decline observed the previous three fiscal years. (Page 22)
New commitments, which are close to 96.0 percent of all admissions, totaled 28,154 in FY 16-17.
This represented a -5.1 percent decrease from the prior fiscal year. New commitments also decreased in the prior three fiscal years. (Page 23)
In looking at new commitments by calendar year, new commitments in 2016 decreased by -4.8 percent from the previous calendar year. New commitments have now decreased over three calendar years. (Page 24)
Conditional and control release violators without new sentences comprise the remaining 4.4
percent of total admissions. These admissions decreased in FY 16-17 by -7.8 percent, a reverse from the increase in the previous fiscal year. (Page 25)
New commitments moved to a new level in March 2003 at the beginning of zero tolerance. They
trended down after late 2008 into 2014, before beginning to stabilize. New commitments have been between 1,500 and 2,600 for the last six months, with only two months exceeding the number of commitments for the same time period in 2016. (Page 26)
Offenders sentenced to prison for technical violations in FY 16-17 decreased by -14.1 percent from
the prior fiscal year. This was the second fiscal year decrease in technical violators after three years of increases. The first five months of FY 17-18 indicate a 13.3% increase compared to those same months in FY 16-17. (Page 27)
After a three-year period during which technical violators as a percentage of total admissions averaged 29.1 percent (and exceeded 30 percent in 12 months), this percentage fell to 24.0 percent in
iii
FY 07-08. Since then, the percentage has averaged between 18.5 percent and 20.6 percent. In FY 16-17, technical violators as a percentage of total admissions was 18.5 percent, down from 20.4 percent in FY 15-16. The post-zero tolerance percentages have remained well below pre-zero tolerance levels. (Page 28)
The percentage of supervision revocations due to technical violations who are sentenced to prison has decreased in FY 16-17 for a second straight year after three years of increases. In FY 11-12, 30.4 percent of technical violators were sentenced to prison, but by FY 14-15 it had reached 33.7 percent. As of FY 16-17, it has dropped to 31.0 percent sentenced to prison. The first five months of FY 17-18 are showing an upward trend with 32.8 percent sentenced to prison. (Page 28)
After a one year increase, the average sentence length of new commitments decreased to 61.8
months in FY 16-17, down from 62.7 months in FY 15-16. (Pages 29 and 30) In November 2017 the average sentence length of new commitments was 60.9 months (5.1 years).
(Pages 30 and 31)
There are often shifts in the sentence length distribution. Total new commitments decreased by 1,498 (-5.1%) in FY 16-17 from the prior fiscal year with the largest decreases being in sentences from 16 to 21 months in length and greater than 102 months in length. Year-and-a-day sentences increased by 16 (0.7%) while all other sentence lengths decreased in FY 16-17. More recent data shows a marked shift to greater reductions in the higher sentence lengths. In the first five months of FY 17-18, new commitments declined by -4.9 percent and new commitments with greater than 102 months decreased by -13.8 percent. (Page 32)
As noted above, the number of year-and-a-day new commitments grew by 0.7 percent in FY 16-17.
This was the first year increase following a two year decrease in year-and-a-day commitments. However, the increase was minimal, implying relatively no change in this commitment type. (Page 33)
The percentage of year-and-a-day sentences also increased in FY 16-17 after two years without
change. In FY 16-17, 8.1 percent of new commitments had year-and-a-day sentences, up from 7.6 percent in FY 15-16. (Page 34)
In the first five months of FY 17-18, year-and-a-day sentences decreased statewide by -5.3 percent.
The largest decrease was in Bay County where these sentences decreased by -76.0 percent. Hillsborough (-22.4 percent) and Miami-Dade (-33.4 percent) also experienced large decreases. Year-and-a-day sentences increased by more than 10 in four counties. (Page 35)
There has been an increase in year-and-a-month sentences in Hillsborough County since November
2007. These increases were in conjunction with a large decline in year-and-a-day sentences. Hillsborough’s percentage of total new commitments that are either year-and-a-day or year-and-a-month in length declined after October 2006, remained stable for a couple of years and trended upward before stabilizing once again in the last two fiscal years. Looking at both of these short sentences suggests that the earlier decline observed in year-and-a-day sentences did not represent as great a change in sentencing behavior as one might initially assume. Data for FY 16-17 and the first five months of FY 17-18 suggest that year-and-a-day sentences still represent a large share of these short sentences. Data suggest that Pinellas County started using the year-and-month sentence as an alternative to year-and-a-day sentences beginning in 2010. More recent data for Pinellas County indicate relative stabilization in both sentencing types, with a large share of year-and-a-month sentences. (Page 36)
Growth in new commitments is not uniform across the state. Comparing July through November of
FY 16-17 and FY 17-18, 35 counties experienced negative growth in the number of new commitments and 32 counties showed positive growth. Between FY 15-16 and FY 16-17, 38 counties experienced negative growth in new commitments and 27 counties showed positive growth.

iv
Polk County had the largest number of new commitments in the first five months of FY 17-18 (733, 6.6% of total). Hillsborough’s new commitments accounted for 6.4 percent of the state total in this same time period, down from 6.9% in the first five months of FY 16-17. New commitments from Duval County accounted for 5.3 percent of the total (down from 7.3%). (Page 37)
While still representing a significant share of the state’s total, Duval County led the state in the number
of declines in new commitments in the first five months of FY 17-18 with new commitments decreasing from 848 in FY 16-17 to 581 in FY 17-18 (-31.5%). Miami-Dade had a decrease of 157 new commitments (-28.6%). Four other counties had decreases of over 75 new commitments. (Page 38)
Even with a statewide decrease in new admissions (-4.9%), thirty-two of Florida’s counties sent more
new commitments to prison in the first five months of FY 17-18 than in FY 16-17. Volusia sent 89 more new commitments to prison (22.3% increase) and Polk sent 85 more new commitments (13.1% increase). (Page 38)
Florida’s three largest counties, Miami-Dade, Broward, and Palm Beach, accounted for 29.4 percent
of the state population in 2017, but only 14.7 percent of the state’s new commitments to prison in FY 16-17 and 19.8 percent of the year-and-a-day sentences. On the other hand, Bay County accounts for 0.9 percent of the state’s total population, but accounts for 3.1 percent of new commitments. Similarly, Hillsborough County accounts for 6.7 percent of the state’s total population, but accounts for 12.8 percent of the year-and-a-day sentences, and though Volusia only represents 2.6 percent of the state population, it accounts for 11.3 percent of year-and-a-day sentences. Jackson and Jefferson counties each sentenced roughly one out of every four new commitments to a year-and-a-day sentence. (Pages 39 and 40)
The -4.9 percent decrease in new commitments in the first five months of FY 17-18 was not evenly
distributed by offense group. The largest decrease in terms of raw numbers was in the “Burglary” category, decreasing by 187 (-10.2%) between these times periods in FY 16-17 and FY 17-18. “Robbery” offenses decreased by 168 (-21.6%) and “Property Theft/Fraud/Damage” offenses decreased by 122 (-6.5%). “Drug” offenses decreased by 49 (-1.9%). “Burglary” averages about 5 years in sentence length and “Property Theft/Fraud/Damage” averages roughly 2 ½ years, while “Robbery” averages about 8 years and “Drug” offenses average about 3 years. (Page 41)
Decreases in new commitments in the “Burglary” category were distributed across many offenses, with
the largest decrease being in, “Burglary of an occupied dwelling” where there were 123 (-13.1%) fewer between these time periods in FY 16-17 and FY 17-18. “Burglary assault any person” decreased by 30 (-22.9%) and “Burglary of an unoccupied structure” decreased by 28 (-5.8%). (Page 42)
In the “Robbery” category, “Robbery with firearm or deadly weapon” decreased by 89 (-24.4%) in
the first five months of FY 17-18. “Robbery, no firearm or deadly weapon” decreased by 75 (-27.8%). (Page 43)
Declines in new commitments within the “Property Theft/Fraud/Damage” offense category were
distributed across many offenses, with the largest decrease being in “Traffic in stolen property” where there were 87 (-14.2%) fewer in the first five months of FY 17-18. (Page 44)
In the “Drug” offense category, the largest decrease was in “Cocaine S/M/D” where there were 71
(-14.7%) fewer between the first five months of FY 16-17 and FY 17-18. “Cocaine possession” also decreased by 54 (-15.7%) and “Sell cocaine etc. within 1000 ft of school or other restricted place” decreased by 25 (-10.5%). “Methamphetamine offenses” increased by 92 (28.8%), “S/M/D Other Sch I and II” increased by 45 (37.5%), and “Possess controlled substance (other)” increased by 44 (19.8%). (Page 45)
Decreases in the “Drug” offense category for year-and-a-day sentences accounted for the largest
share of the decrease in these sentences between these times periods in FY 16-17 and FY 17-18. New

v
commitments with a “Drug” primary offense decreased by 17 (-6.7%). The “Robbery” offense category also showed a decrease of 11 (-35.5%). (Page 46)
New commitments with year-and-a-day sentences have a wide variety of offenses. In the first five
mothers of FY 17-18, “Grand theft, $300 - $4,999” and “Possess controlled substance (other)” were the most common primary offenses. These two offenses accounted for 12.8 percent of the total year-and-a-day new commitments (up from 12.4% in FY 16-17). (Page 47)
The year-and-a-day offense with the largest decrease in the number of new commitments between
these time periods in FY 16-17 and FY 17-18 was “Robbery, no firearm or deadly weapon.” There were 15 fewer year-and-a-day offenders with this offense, a decrease of -62.5 percent. “Cocaine possession” decreased by 14 new commitments (-26.4%) and “Burglary of an unoccupied structure” decreased by 11 new commitments (-18.3%). (Page 47)
The percentage of new commitments sentenced for third degree felonies stayed roughly the same
at 43.6 percent in FY 16-17. (Page 48) The percentage of diversion eligible offenders sentenced to prison who committed a felony following the
passage of CS/SB 1722 declined from 2.6 percent in FY 09-10 to 1.8 percent in FY 14-15. In FY 15-16, this percentage rose slightly to 2.1 percent. In FY 16-17, this percentage fell to 1.5 percent. In the first five months of FY 17-18, this percentage fell to 1.1 percent. (Page 49)
The number of offenders sentenced to prison under 10-20-Life increased in FY 16-17 with 1,368
offenders sentenced under these provisions receiving mandatory prison terms. Of these offenders, 12.0 percent received a sentence of at least 25 years in length, down from 12.5 percent in FY 15-16. (Pages 50 and 51)
The total affected prison population under 10-20-Life continues to grow. On June 30, 2017, there were
11,442 offenders who had received a mandatory prison term under this statute in Florida’s prisons. This represented 11.7 percent of Florida’s prison population on that date. (Pages 50 and 51)
COUNTY JAILS
Average daily population in county jails increased after the implementation of zero tolerance. The
adjusted June 2017 average daily population (ADP) of 53,218 was -0.6 percent lower than the adjusted June 30, 2016 ADP of 53,536. At the peak of zero tolerance, the ADP exceeded 66,000 (July 2007). (Page 52)
The adjusted average daily population has been below 60,000 since December 2009. (Page 53)
In FY 15-16, an average of 19.3 percent of the offenders in county jail had been sentenced for a
felony. In FY 16-17, an average of 19.5 percent of the offenders in county jail had been sentenced for a felony. In the first three months of FY 17-18 the percentage appears to have decreased slightly with an average of 19.2 percent of the offenders in county jail sentenced for a felony. (Page 54)
OTHER TRENDS After increasing from 112,529 on June 30, 2006 to 119,216 in June 2008, the number of offenders on
active supervision fell over the next three years to 113,622 in June 2011. The number on active supervision grew in 2012, but then declined for another five years and was 105,285 on June 30, 2017 (down -1.3% from the prior year). (Page 55)

vi
The number of offenders with either a life or a death sentence has grown over the last twenty-five years increasing from 4,549 in 1990 to 13,579 in 2017. In 1990, 10.6 percent of inmates were serving a life or death sentence on June 30. In 2017, this percentage increased to 13.9 percent. (Page 56)
The percent of offenders with either a life or a death sentence, as well as a 10-20-Life sentence, has
risen steadily over the years. As of June 30, 2017, 21.8 percent of the prison population was made up of offenders with one of these sentences. (Page 57)
The prison population on June 30, 2017 was 97,794, a decrease of -1.3 percent from June 30, 2016.
(Pages 58 and 60) The number of prison inmates per 100,000 Florida population fell in FY 16-17 to 477.4. This is the
seventh year in a row in which the incarceration rate declined. In the prior 30 years, the incarceration rate had grown from 202.3 (in FY 79-80) to 543.7 (in FY 09-10). This rate had remained relatively flat between FY 94-95 and FY 01-02, but had risen each year between FY 02-03 and FY 09-10. (Pages 58 and 59)
The age distribution of prison admissions has changed significantly since FY 99-00. While the
percentage of 18 to 24 year olds has declined, the percentage of those older than 50 has grown steadily. (Page 61)
The top five offenses by age group varied considerably across admissions in FY 16-17, with several
top crimes for older age groups connected to prior criminal history. (Page 62)
The age distribution of the prison population has also changed significantly since June 30, 2000. While the percentage of 18 to 24 year olds has declined, the percentage of those older than 50 has grown steadily, with inmates aged 50 to 59 now making up a greater share of the prison population than 18 to 24 year olds. (Page 63)

MONTHLY CUMULATIVEOVER/ OVER/
MONTH ESTIMATE ACTUAL (UNDER) (UNDER)
July 2017 2,406 2,167 -239 -239
August 2017 2,460 2,687 227 -12
September 2017 2,406 1,671 -735 -747
October 2017 2,362 2,704 342 -405
November 2017* 2,310 2,317 7 -398
Total 11,944 11,546 % Error: -3.3%
* Preliminary actual
CUMULATIVEOVER/
MONTH ESTIMATE ACTUAL (UNDER)
July 2017 97,719 97,415 -304August 2017 97,810 97,573 -237September 2017 97,651 96,662 -989October 2017 97,504 96,790 -714November 2017 97,342 96,637 -705
-0.7% Error
POPULATION
MONITORING PRISON ADMISSIONS TO THE DEPARTMENT OF CORRECTIONSSINCE THE CRIMINAL JUSTICE ESTIMATING CONFERENCE HELD 7/21/2017
ADMISSIONS
MONITORING PRISON POPULATION IN THE DEPARTMENT OF CORRECTIONSSINCE THE CRIMINAL JUSTICE ESTIMATING CONFERENCE HELD 7/21/2017
1

July 2017 CJEC Actual DiffCumulative difference
July 2017 2,406 2,167 (239) (239) August 2017 2,460 2,687 227 (12)
September 2017 2,406 1,671 (735) (747) October 2017 2,362 2,704 342 (405)
November 2017 2,310 2,317 7 (398)
Total 11,944 11,546 (398)
-3.3% error
July 2017 CJEC Actual DiffCumulative difference
July 2017 2,304 2,051 (253) (253) August 2017 2,348 2,549 201 (52)
September 2017 2,307 1,594 (713) (765) October 2017 2,267 2,592 325 (440)
November 2017 2,225 2,239 14 (426)
Total 11,451 11,025 (426)
-3.7% error
July 2017 CJEC Actual DiffCumulative difference
July 2017 102 116 14 14 August 2017 112 138 26 40
September 2017 99 77 (22) 18 October 2017 95 112 17 35
November 2017 85 78 (7) 28
Total 493 521 28
5.7% error
ALL ADMISSIONS
NEW COMMITMENTS
CONDITIONAL AND CONTROL RELEASE OFFENDERS RETURNED WITH TECHNICAL VIOLATIONS
COMPONENTS OF ADMISSION ERRORS SINCE JULY 21, 2017 CJEC
2

1995
1996
1997
1998
1999
2000
2001
2002
2003
2004
2005
2006
2007
2008
2009
2010
2011
2012
2013
2014
2015
2016
All O
ffens
es1,
074,
862
1,07
5,69
81,
069,
885
1,02
1,35
293
0,31
389
1,75
790
6,74
989
5,60
887
7,17
984
6,16
283
3,91
684
6,19
087
3,31
487
9,71
082
1,13
276
7,17
576
6,13
872
2,47
169
5,49
267
0,01
365
9,16
064
1,01
4
0
200,
000
400,
000
600,
000
800,
000
1,00
0,00
0
1,20
0,00
0
REP
OR
TED
CR
IME
(All
Inde
x O
ffens
es)
3

1995
1996
1997
1998
1999
2000
2001
2002
2003
2004
2005
2006
2007
2008
2009
2010
2011
2012
2013
2014
2015
2016
Non
viol
ent
928,
411
928,
273
922,
956
885,
427
805,
490
767,
667
780,
966
772,
250
757,
379
726,
793
712,
238
720,
425
745,
200
757,
833
711,
144
668,
611
671,
297
632,
022
606,
902
582,
080
568,
950
552,
513
Vio
lent
146,
451
147,
425
146,
929
135,
925
124,
823
124,
090
125,
783
123,
358
119,
800
119,
369
121,
678
125,
765
128,
114
121,
877
109,
988
98,5
6494
,841
90,4
4988
,590
87,9
3390
,210
88,5
01
0
200,
000
400,
000
600,
000
800,
000
1,00
0,00
0
1,20
0,00
0
REP
OR
TED
CR
IME
Viol
ent a
nd N
onvi
olen
tIn
dex
Offe
nses
4

Change from prior year
2008 432,737 1.6%2009 398,265 -8.0%2010 379,335 -4.8%2011 371,620 -2.0%2012 357,347 -3.8%2013 338,804 -5.2%2014 330,709 -2.4%2015 323,980 -2.0%2016 313,113 -3.4%2017 306,817 -2.0%
Change from prior year Change from prior year
2008 61,595 -2.5% 371,142 2.3%2009 55,451 -10.0% 342,814 -7.6%2010 49,398 -10.9% 329,937 -3.8%2011 47,769 -3.3% 323,851 -1.8%2012 45,177 -5.4% 312,170 -3.6%2013 43,662 -3.4% 295,142 -5.5%2014 43,743 0.2% 286,966 -2.8%2015 44,720 2.2% 279,260 -2.7%2016 43,438 -2.9% 269,675 -3.4%2017 42,938 -1.2% 263,879 -2.1%
Change from prior year
2008 572,116 3.9%2009 537,824 -6.0%2010 509,074 -5.3%2011 499,157 -1.9%2012 478,728 -4.1%2013 464,456 -3.0%2014 444,558 -4.3%2015 393,812 -11.4%2016 380,145 -3.5%2017 375,463 -1.2%
Source: Florida Department of Law Enforcement, "Crime in Florida January-June", various years.
ARRESTS
Six Month Uniform Crime Report: January through June
TOTAL INDEX CRIMES
VIOLENT INDEX CRIMES
NON-VIOLENT INDEX CRIMES
5

7464
7272
6809
6072
5580
5552
5371
5138
4831
4654
4612
4675
4678
4379
4087
4053
3788
3611
3435
3327
3181
0
1,00
0
2,00
0
3,00
0
4,00
0
5,00
0
6,00
0
7,00
0
8,00
0
9697
9899
0001
0203
0405
0607
0809
1011
1213
1415
16
CR
IME
RAT
EIn
dex
Crim
es p
er 1
00,0
00 P
opul
atio
n
6

0
200,
000
400,
000
600,
000
800,
000
1,00
0,00
0
1,20
0,00
0
1996
1998
2000
2002
2004
2006
2008
2010
2012
2014
2016
TOTA
L A
RR
ESTS
Sou
rce
of d
ata
chan
ged
in 1
996
to fi
nger
prin
t car
ds a
nd in
199
8 to
agg
rega
te re
ports
from
Law
Enf
orce
men
t Age
ncie
s.
7

Index Offenses 2014%
Change 2015%
Change 2016%
Change Murder 685 3.6% 670 -2.2% 642 -4.2%Forcible Sex Offenses 1,839 -0.3% 1,803 -2.0% 1,747 -3.1%Robbery 7,712 -2.9% 7,192 -6.7% 6,521 -9.3%Aggravated Assault 27,437 -3.7% 27,337 -0.4% 26,137 -4.4%Burglary 20,923 -8.6% 18,931 -9.5% 18,037 -4.7%Larceny 92,499 -2.3% 88,780 -4.0% 76,139 -14.2%Motor Vehicle Theft 6,206 14.2% 7,291 17.5% 8,211 12.6%Total Index Offenses 157,301 -2.9% 152,004 -3.4% 137,434 -9.6%
Part IIManslaughter 120 -29.4% 81 -32.5% 98 21.0%Kidnap/Abduction 842 -0.5% 765 -9.1% 760 -0.7%Arson 289 -11.9% 285 -1.4% 252 -11.6%Simple Assault 77,911 -1.5% 78,076 0.2% 74,126 -5.1%Drug Arrests 122,353 -3.1% 114,984 -6.0% 114,550 -0.4%Bribery 31 -34.0% 36 16.1% 13 -63.9%Embezzlement 954 0.4% 1,024 7.3% 1,041 1.7%Fraud 12,245 -12.5% 11,885 -2.9% 11,954 0.6%Counterfeit/Forgery 2,486 -1.5% 2,346 -5.6% 2,247 -4.2%Extortion/Blackmail 103 -10.4% 103 0.0% 85 -17.5%Intimidation 3,224 -9.5% 2,651 -17.8% 2,324 -12.3%Prostitution/commercialized sex 3,359 -10.7% 2,701 -19.6% 2,397 -11.3%Non-Forcible Sex Offenses 3,322 -4.7% 2,930 -11.8% 2,728 -6.9%Stolen Property 2,406 -13.9% 1,980 -17.7% 1,774 -10.4%Driving Under Influence 42,782 1.8% 31,784 -25.7% 35,042 10.3%Destruction/Vandalism 6,466 -3.2% 6,566 1.5% 6,192 -5.7%Gambling 416 37.3% 157 -62.3% 149 -5.1%Weapons Violations 4,912 -3.5% 4,879 -0.7% 5,152 5.6%Liquor Law Violations 21,705 -14.0% 17,431 -19.7% 14,280 -18.1%Miscellaneous 403,712 -6.8% 340,393 -15.7% 313,896 -7.8%Total Part II 709,638 -5.4% 621,057 -12.5% 589,060 -5.2%
ALL OFFENSES 866,939 -5.0% 773,061 -10.8% 726,494 -6.0%
Source: Florida Department of Law Enforcement, Uniform Crime Reports, various years
ARRESTS
8

0
50,0
00
100,
000
150,
000
200,
000
250,
000
1992
1994
1996
1998
2000
2002
2004
2006
2008
2010
2012
2014
2016
FELO
NY
FILI
NG
S
9

Year Total1992 35,996 22.5% 80,625 50.4% 43,429 27.1% 160,050
1993 34,038 22.1% 77,312 50.3% 42,346 27.6% 153,696
1994 35,204 21.9% 78,718 49.0% 46,762 29.1% 160,684
1995 35,720 21.8% 80,838 49.2% 47,639 29.0% 164,197
1996 41,166 23.1% 84,100 47.2% 52,894 29.7% 178,160
1997 41,153 22.3% 84,852 46.1% 58,158 31.6% 184,163
1998 45,227 23.4% 86,874 45.0% 60,919 31.6% 193,020
1999 45,989 24.2% 83,174 43.8% 60,888 32.0% 190,051
2000 44,589 24.0% 84,970 45.7% 56,527 30.4% 186,086
2001 42,611 23.1% 85,689 46.4% 56,271 30.5% 184,571
2002 41,353 22.4% 87,134 47.3% 55,808 30.3% 184,295
2003 39,041 20.8% 90,094 48.1% 58,244 31.1% 187,379
2004 38,409 19.7% 92,730 47.6% 63,724 32.7% 194,863
2005 38,337 18.4% 100,457 48.2% 69,746 33.4% 208,540
2006 39,499 17.9% 107,295 48.6% 73,963 33.5% 220,757
2007 41,514 18.0% 115,620 50.1% 73,688 31.9% 230,822
2008 40,978 18.3% 113,932 50.8% 69,568 31.0% 224,478
2009 40,347 19.6% 102,577 49.8% 62,910 30.6% 205,8342010 39,160 19.3% 102,443 50.6% 60,866 30.1% 202,4692011 38,875 19.2% 107,430 53.0% 56,340 27.8% 202,6452012 39,122 19.7% 107,677 54.2% 51,795 26.1% 198,5942013 35,311 19.0% 100,483 54.1% 49,860 26.9% 185,6542014 34,337 19.6% 93,999 53.6% 46,989 26.8% 175,3252015 34,596 20.2% 90,416 52.8% 46,129 27.0% 171,1412016 33,718 20.1% 87,357 52.0% 46,891 27.9% 167,966
Note: Filings for minimum-mandatory offenses prior to 1992 are excluded. The minimum-mandatory classification for filingswas discontinued 7/1/91. 1 Summary Reporting System categories of capital murder, non-capital murder, sexual offenses, robbery, and other crimes against persons. 2 Summary Reporting System categories of burglary, theft, forgery and fraud, worthless checks, other crimes against property and all other felonies. 3 Summary Reporting System drug category.
Data Source: Office of State Courts Administrator, Summary Reporting System, Update run date: 11/17.
FELONY FILINGS BY OFFENSE TYPE
Violent1 Nonviolent2 Drug3
10

0
20,0
00
40,0
00
60,0
00
80,0
00
100,
000
120,
000
140,
000
Year
FELO
NY
FILI
NG
SB
y O
ffens
e Ty
pe
Non
-vio
lent
Dru
gs
Viol
ent
11

0
25,0
00
50,0
00
75,0
00
100,
000
125,
000
150,
000
175,
000
200,
000
1992
1994
1996
1998
2000
2002
2004
2006
2008
2010
2012
2014
2016
GU
ILTY
DIS
POSI
TIO
NS
12

Year Total1992 27,315 20.8% 64,555 49.3% 39,188 29.9% 131,0581993 26,395 21.5% 60,672 49.3% 35,950 29.2% 123,0171994 25,463 20.6% 59,592 48.2% 38,705 31.3% 123,7601995 25,918 20.7% 59,733 47.8% 39,375 31.5% 125,0261996 25,413 19.9% 62,742 49.0% 39,792 31.1% 127,9471997 26,355 18.6% 70,656 49.9% 44,725 31.6% 141,7361998 31,065 21.7% 64,833 45.2% 47,557 33.2% 143,4551999 31,622 21.5% 66,824 45.5% 48,436 33.0% 146,8822000 31,259 22.5% 63,235 45.5% 44,390 32.0% 138,8842001 30,393 21.3% 67,502 47.2% 45,012 31.5% 142,9072002 29,891 20.9% 68,907 48.1% 44,455 31.0% 143,2532003 28,256 19.1% 73,039 49.4% 46,412 31.4% 147,7072004 26,718 17.6% 74,606 49.2% 50,220 33.1% 151,5442005 26,201 16.5% 78,734 49.5% 54,073 34.0% 159,0082006 26,856 15.7% 85,704 50.1% 58,524 34.2% 171,0842007 28,481 15.5% 94,797 51.5% 60,715 33.0% 183,9932008 29,805 16.0% 98,355 52.8% 58,105 31.2% 186,2652009 28,165 17.5% 84,483 52.4% 48,498 30.1% 161,1462010 26,729 17.3% 82,453 53.4% 45,220 29.3% 154,4022011 26,266 17.2% 84,928 55.5% 41,873 27.4% 153,0672012 26,202 17.4% 84,198 56.0% 40,012 26.6% 150,4122013 25,625 17.7% 81,828 56.4% 37,690 26.0% 145,1432014 24,188 17.6% 76,957 56.0% 36,361 26.4% 137,5062015 23,582 17.8% 73,653 55.5% 35,378 26.7% 132,6132016 24,009 18.1% 72,434 54.6% 36,194 27.3% 132,637
Note: Filings for minimum-mandatory offenses prior to 1992 are excluded. The minimum-mandatory classification for filingswas discontinued 7/1/91. 1 Summary Reporting System categories of capital murder, non-capital murder, sexual offenses, robbery, and other crimes against persons.
3 Summary Reporting System drug category.
Data Source: Office of State Courts Administrator, Summary Reporting System, Update run date: 11/17
GUILTY DISPOSITIONS BY OFFENSE TYPE
Violent1 Nonviolent2 Drug3
2 Summary Reporting System categories of burglary, theft, forgery and fraud, worthless checks, other crimes against property and all other felonies.
13

0
20,0
00
40,0
00
60,0
00
80,0
00
100,
000
Year
GU
ILTY
DIS
POSI
TIO
NS
By
Offe
nse
Type
Non
-vio
lent
Viol
ent
Dru
gs
14

NumberPercent Change Number
Percent Change
2000 186,086 ‐2.1% 138,884 ‐5.4%2001 184,571 ‐0.8% 142,907 2.9%2002 184,295 ‐0.1% 143,253 0.2%2003 187,379 1.7% 147,707 3.1%2004 194,863 4.0% 151,544 2.6%2005 208,540 7.0% 159,008 4.9%2006 220,757 5.9% 171,084 7.6%2007 230,822 4.6% 183,993 7.5%2008 224,478 ‐2.7% 186,265 1.2%2009 205,834 ‐8.3% 161,146 ‐13.5%2010 202,469 ‐1.6% 154,402 ‐4.2%2011 202,645 0.1% 153,067 ‐0.9%2012 198,594 ‐2.0% 150,412 ‐1.7%2013 185,654 ‐6.5% 145,143 ‐3.5%2014 175,325 ‐5.6% 137,506 ‐5.3%2015 171,141 ‐2.4% 132,613 ‐3.6%2016 167,966 ‐1.9% 132,637 0.0%
Jan‐Aug 2015 1 114,490 87,984 Jan‐Aug 2016 2 115,121 0.6% 90,383 2.7%Jan‐Aug 2017 3 119,506 3.8% 93,504 3.5%
1 From November 2015 SRS run2 From October 2016 SRS run3 From November 2017 SRS run
Source: State Court Administrator, Summary Reporting System, (last updatedwith run done November 2017).
Felony Filings Guilty Dispositions
RECENT TRENDS IN FELONY FILINGS AND GUILTY DISPOSITIONS
15

0%5%10%
15%
20%
25%
30%
35%
1992
1994
1996
1998
2000
2002
2004
2006
2008
2010
2012
2014
2016
Perc
ent o
f Gui
lty D
ispo
sitio
ns Im
pris
oned
16

%%
%%
%19
96C
hang
e19
97C
hang
e19
98C
hang
e19
99C
hang
e20
00C
hang
e
REP
OR
TED
CR
IMES
(Par
t I, I
ndex
offe
nses
)1,
075,
698
-0.3
%1,
069,
885
-0.5
%1,
021,
352
-4.5
%93
0,31
3-8
.9%
891,
757
-4.1
%
Tot
al V
iole
nt O
ffens
es14
7,42
5-1
.9%
146,
929
-0.3
%13
5,92
5-7
.5%
124,
823
-8.2
%12
4,09
0-0
.6%
CR
IME
RA
TE2
(per
100
,000
Pop
)7,
464.
1-2
.1%
7,27
1.7
-2.6
%6,
808.
8-6
.4%
6,07
1.7
-10.
8%5,
579.
6-8
.1%
AR
RES
TSPa
rt I
NA
NA
NA
NA
198,
948
NA
184,
606
-7.2
%17
4,23
5-5
.6%
Part
IIN
AN
AN
AN
A68
1,24
3N
A71
3,07
34.
7%70
8,62
4-0
.6%
TOTA
L68
5,99
2-5
.5%
686,
565
0.1%
880,
191
28.2
%89
7,67
92.
0%88
2,85
9-1
.7%
FELO
NY
FILI
NG
S17
7,68
78.
2%18
4,16
33.
6%19
2,94
24.
8%19
0,05
1-1
.5%
186,
086
-2.1
%
GU
ILTY
DIS
POSI
TIO
NS
132,
665
3.5%
141,
736
6.8%
143,
761
1.4%
146,
882
2.2%
138,
884
-5.4
%
GU
ILTI
ES A
S PE
RC
ENT
OF
FILI
NG
S74
.7%
77.0
%74
.5%
77.3
%
74.6
%
NEW
CO
MM
ITM
ENTS
TO P
RIS
ON
20,7
922.
5%21
,829
5.0%
22,6
453.
7%24
,273
7.2%
25,5
415.
2%
% O
F G
UIL
TYD
ISPO
SITI
ON
SIM
PRIS
ON
ED15
.7%
15.4
%15
.8%
16.5
%18
.4%
PRIS
ON
PO
PULA
TIO
NO
N J
UN
E 30
64,3
333.
8%64
,713
0.6%
66,2
802.
4%68
,599
3.5%
71,2
333.
8%
CR
IMIN
AL
JUST
ICE
SYST
EM M
EASU
RES
17
%%
%%
%20
01C
hang
e20
02C
hang
e20
03C
hang
e20
04C
hang
e20
05C
hang
e
REP
OR
TED
CR
IMES
(P
art I
, Ind
ex o
ffens
es)
906,
749
1.7%
895,
608
-1.2
%87
7,17
9-2
.1%
846,
162
-3.5
%83
3,91
6-1
.4%
Tot
al V
iole
nt O
ffens
es12
5,78
31.
4%12
3,35
8-1
.9%
119,
800
-2.9
%11
9,36
9-0
.4%
121,
678
1.9%
CR
IME
RA
TE2
(per
100
,000
Pop
)5,
552.
1-0
.5%
5,37
1.1
-3.3
%5,
138.
3-4
.3%
4,83
0.6
-6.0
%4,
654.
0-3
.7%
AR
RES
TSPa
rt I
184,
967
6.2%
179,
649
-2.9
%18
0,39
20.
4%17
4,64
1-3
.2%
170,
929
-2.1
%Pa
rt II
738,
165
4.2%
733,
438
-0.6
%79
4,53
18.
3%85
4,35
97.
5%88
5,19
23.
6%TO
TAL
923,
132
4.6%
913,
087
-1.1
%97
4,92
36.
8%1,
029,
000
5.5%
1,05
6,12
12.
6%
FELO
NY
FILI
NG
S18
4,57
1-0
.8%
184,
295
-0.1
%18
7,37
91.
7%19
4,86
34.
0%20
8,54
07.
0%
GU
ILTY
DIS
POSI
TIO
NS
142,
907
2.9%
143,
253
0.2%
147,
707
3.1%
151,
544
2.6%
159,
008
4.9%
GU
ILTI
ES A
S PE
RC
ENT
OF
FILI
NG
S77
.4%
77.7
%78
.8%
77.8
%
76.2
%
NEW
CO
MM
ITM
ENTS
TO P
RIS
ON
25,5
710.
1%27
,176
6.3%
30,3
4011
.6%
31,4
453.
6%33
,249
5.7%
% O
F G
UIL
TYD
ISPO
SITI
ON
SIM
PRIS
ON
ED17
.9%
19.0
%20
.5%
20.7
%20
.9%
PRIS
ON
PO
PULA
TIO
NO
N J
UN
E 30
72,0
071.
1%73
,553
2.1%
77,3
165.
1%81
,974
6.0%
84,9
013.
6%
CR
IMIN
AL
JUST
ICE
SYST
EM M
EASU
RES
18

%%
%%
%20
06C
hang
e20
07C
hang
e20
08C
hang
e20
09C
hang
e20
10C
hang
e
REP
OR
TED
CR
IMES
(Par
t I, I
ndex
offe
nses
)84
6,19
01.
5%87
3,31
43.
2%87
9,71
00.
7%82
1,13
2-6
.7%
767,
175
-6.6
%
Tot
al V
iole
nt O
ffens
es12
5,76
53.
4%12
8,11
41.
9%12
1,87
7-4
.9%
109,
988
-9.8
%98
,564
-10.
4%
CR
IME
RA
TE2
(p
er 1
00,0
00 P
op)
4,61
1.6
-0.9
%4,
675.
01.
4%4,
677.
50.
1%4,
379.
3-6
.4%
4,08
6.9
-6.7
%
AR
RES
TS
Part
I16
9,39
9-0
.9%
184,
478
8.9%
200,
532
8.7%
192,
630
-3.9
%17
4,17
7-9
.6%
Part
II94
1,27
76.
3%94
2,04
60.
1%94
9,40
10.
8%85
7,29
9-9
.7%
846,
320
-1.3
%TO
TAL
1,11
0,67
65.
2%1,
126,
524
1.4%
1,14
9,93
32.
1%1,
049,
929
-8.7
%1,
020,
497
-2.8
%
FELO
NY
FILI
NG
S22
0,75
75.
9%23
0,82
24.
6%22
4,47
8-2
.7%
205,
834
-8.3
%20
2,46
9-1
.6%
GU
ILTY
DIS
POSI
TIO
NS
171,
084
7.6%
183,
993
7.5%
186,
265
1.2%
161,
146
-13.
5%15
4,40
2-4
.2%
GU
ILTI
ES A
S PE
RC
ENT
OF
FILI
NG
S77
.5%
79
.7%
83.0
%
78.3
%76
.3%
NEW
CO
MM
ITM
ENTS
TO P
RIS
ON
35,7
247.
4%39
,376
10.2
%40
,274
2.3%
37,4
80
-6.9
%35
,181
-6
.1%
% O
F G
UIL
TYD
ISPO
SITI
ON
SIM
PRIS
ON
ED20
.9%
21
.4%
21.6
%23
.3%
22.8
%
PRIS
ON
PO
PULA
TIO
NO
N J
UN
E 30
88,5
764.
3%92
,844
4.8%
98,1
925.
8%10
0,89
4
2.
8%10
2,23
2
1.
3%
CR
IMIN
AL
JUST
ICE
SYST
EM M
EASU
RES
19

%%
%%
%20
11C
hang
e20
12C
hang
e20
13C
hang
e20
14C
hang
e20
15C
hang
e
REP
OR
TED
CR
IMES
(Par
t I, I
ndex
offe
nses
)76
6,13
8-0
.1%
722,
471
-5.7
%69
5,49
2-3
.7%
670,
013
-3.7
%65
9,16
0-1
.6%
Tot
al V
iole
nt O
ffens
es94
,841
-3.8
%90
,449
-4.6
%88
,590
-2.1
%87
,933
-0.7
%90
,210
2.6%
CR
IME
RA
TE(p
er 1
00,0
00 P
op)
4,05
2.6
-0.8
%3,
787.
6-6
.5%
3,61
1.2
-4.7
%3,
434.
7-4
.9%
3,32
6.5
-3.2
%
A
RR
ESTS
Part
I16
9,86
3-2
.5%
165,
115
-2.8
%16
1,94
8-1
.9%
157,
301
-2.9
%15
2,00
4-3
.4%
Part
II78
2,81
1-7
.5%
795,
077
1.6%
750,
423
-5.6
%70
9,63
8-5
.4%
621,
057
-12.
5%TO
TAL
952,
674
-6.6
%96
0,19
20.
8%91
2,37
1-5
.0%
866,
939
-5.0
%77
3,06
1-1
0.8%
FELO
NY
FILI
NG
S20
2,64
50.
1%19
8,59
4-2
.0%
185,
654
-6.5
%17
5,32
5-5
.6%
171,
141
-2.4
%
GU
ILTY
DIS
POSI
TIO
NS
153,
067
-0.9
%15
0,41
2-1
.7%
145,
143
-3.5
%13
7,50
6-5
.3%
132,
613
-3.6
%
GU
ILTI
ES A
S PE
RC
ENT
OF
FILI
NG
S75
.5%
75
.7%
78.2
%78
.4%
77.5
%
NEW
CO
MM
ITM
ENTS
TO P
RIS
ON
32,7
26
-7.0
%31
,324
-4
.3%
32,5
78
4.0%
31,1
94
-4.2
%29
,849
-4
.3%
% O
F G
UIL
TYD
ISPO
SITI
ON
SIM
PRIS
ON
ED21
.4%
20.8
%22
.4%
22.7
%22
.5%
PRIS
ON
PO
PULA
TIO
NO
N J
UN
E 30
102,
319
0.1%
100,
527
-1.8
%10
0,88
4
0.
4%10
0,94
2
0.
1%10
0,05
0
-0
.9%
CR
IMIN
AL
JUST
ICE
SYST
EM M
EASU
RES
20
%20
16C
hang
e
REP
OR
TED
CR
IMES
(Par
t I, I
ndex
offe
nses
)64
1,01
4-2
.8%
Tot
al V
iole
nt O
ffens
es88
,501
-1.9
%
CR
IME
RA
TE(p
er 1
00,0
00 P
op)
3,18
1.4
-4.4
%
AR
RES
TSPa
rt I
137,
434
-9.6
%Pa
rt II
589,
060
-5.2
%TO
TAL
726,
494
-6.0
%
FELO
NY
FILI
NG
S16
7,96
6-1
.9%
GU
ILTY
DIS
POSI
TIO
NS
132,
637
0.0%
GU
ILTI
ES A
S PE
RC
ENT
OF
FILI
NG
S79
.0%
NEW
CO
MM
ITM
ENTS
TO P
RIS
ON
28,4
04
-4.8
%
% O
F G
UIL
TYD
ISPO
SITI
ON
SIM
PRIS
ON
ED21
.4%
PRIS
ON
PO
PULA
TIO
NO
N J
UN
E 30
99,1
19
-0.9
%
Not
es:
1 19
88 R
epor
ted
Par
t I C
rimes
and
the
1988
Crim
e R
ate
is a
n es
timat
e ge
nera
ted
by th
e U
CR
Div
isio
n of
the
FBI.
Dat
a S
ourc
es:
Rep
orte
d C
rimes
, Tot
al V
iole
nt C
rimes
, Crim
e R
ate,
Arr
ests
: Fl
orid
a D
ept.
of L
aw E
nfor
cem
ent,
Uni
form
Crim
e R
epor
ts.
Felo
ny F
iling
s an
d G
uilty
Dis
posi
tions
: S
tate
Cou
rt A
dmin
istra
tor,
Sum
mar
y R
epor
ting
Sys
tem
, las
t upd
ated
with
run
from
Nov
embe
r 201
7.P
rison
Adm
issi
ons
and
Pris
on P
opul
atio
n: F
lorid
a D
epar
tmen
t of C
orre
ctio
ns, R
esea
ch a
nd D
ata
Ana
lysi
s.
CR
IMIN
AL
JUST
ICE
SYST
EM M
EASU
RES
21

%
Cha
nge
from
pr
ior y
ear
FY 9
2-93
33,2
17
-6.3
%FY
93-
9430
,295
-8
.8%
FY 9
4-95
26,7
51
-11.
7%FY
95-
9623
,893
-1
0.7%
FY 9
6-97
23,7
89
-0.4
%FY
97-
9824
,318
2.
2%FY
98-
9925
,147
3.
4%FY
99-
0027
,126
7.
9%FY
00-
0127
,217
0.
3%FY
01-
0227
,564
1.
3%FY
02-
0330
,287
9.
9%FY
03-
0433
,615
11
.0%
FY 0
4-05
34,1
29
1.5%
FY 0
5-06
36,7
22
7.6%
FY 0
6-07
39,3
00
7.0%
FY 0
7-08
42,2
79
7.6%
FY 0
8-09
40,0
50
-5.3
%FY
09-
1037
,794
-5
.6%
FY 1
0-11
35,6
27
-5.7
%FY
11-
1232
,508
-8
.8%
FY
12-
1333
,516
3.
1%FY
13-
1432
,822
-2
.1%
FY 1
4-15
31,5
92
-3.7
%FY
15-
1631
,038
-1
.8%
*FY
16-
1729
,432
-5
.2%
Incl
udes
con
ditio
nal r
elea
se a
nd c
ontro
l rel
ease
vio
lato
rs w
ith a
nd w
ithou
t new
sen
tenc
es.
*Thi
s nu
mbe
r may
cha
nge
slig
htly
as
revi
sion
s ar
e m
ade
thro
ugh
2017
.
AD
MIS
SIO
NS
TO P
RIS
ON
BY
FISC
AL
YEA
R
‐
5,000
10,000
15,000
20,000
25,000
30,000
35,000
40,000
45,000
Admission
s to Prison
22

%
Cha
nge
from
pr
ior y
ear
FY 9
2-93
29,7
68
-10.
8%FY
93-
9425
,806
-1
3.3%
FY 9
4-95
21,4
55
-16.
9%FY
95-
9620
,172
-6
.0%
FY 9
6-97
21,2
80
5.5%
FY 9
7-98
22,1
00
3.9%
FY 9
8-99
23,4
24
6.0%
FY 9
9-00
25,3
79
8.3%
FY 0
0-01
25,5
25
0.6%
FY 0
1-02
25,8
54
1.3%
FY 0
2-03
28,6
58
10.8
%FY
03-
0431
,638
10
.4%
FY 0
4-05
31,9
64
1.0%
FY 0
5-06
34,5
46
8.1%
FY 0
6-07
37,2
99
8.0%
FY
07-
08
40,4
91
8.6%
FY 0
8-09
38,7
35
-4.3
%FY
09-
1036
,450
-5
.9%
FY 1
0-11
34,3
94
-5.6
%FY
11-
1231
,376
-8
.8%
FY
12-
1332
,279
2.
9%FY
13-
1431
,472
-2
.5%
FY 1
4-15
30,2
78
-3.8
%FY
15-
1629
,652
-2
.1%
*FY
16-
1728
,154
-5
.1%
NEW
CO
MM
ITM
ENTS
BY
FISC
AL
YEA
R
Incl
udes
con
ditio
nal r
elea
se a
nd c
ontro
l rel
ease
vio
lato
rs w
ith n
ew
sent
ence
s.
*Thi
s nu
mbe
r may
cha
nge
slig
htly
as
revi
sion
s ar
e m
ade
thro
ugh
2017
.
‐
5,000
10,000
15,000
20,000
25,000
30,000
35,000
40,000
45,000
New
Com
mitm
ents
23

% C
hang
e fr
om p
rior
year
1993
27,7
54
-1
4.1%
1994
23,4
83
-1
5.4%
1995
20,2
86
-1
3.6%
1996
20,7
92
2.
5%19
9721
,829
5.0%
1998
22,6
45
3.
7%19
9924
,273
7.2%
2000
25,5
41
5.
2%20
0125
,571
0.1%
2002
27,1
76
6.
3%20
0330
,340
11.6
%20
0431
,445
3.6%
2005
33,2
49
5.
7%20
0635
,724
7.4%
2007
39,3
76
10
.2%
20
0840
,274
2.3%
2009
37,4
80
-6
.9%
2010
35,1
81
-6
.1%
2011
32,7
26
-7
.0%
2012
31,3
24
-4
.3%
2013
32,5
78
4.
0%20
1431
,194
-4.2
%20
1529
,849
-4.3
%20
1628
,404
-4.8
%
Incl
udes
con
ditio
nal r
elea
se a
nd c
ontro
l rel
ease
vio
lato
rs w
ith n
ew s
ente
nces
.
NEW
CO
MM
ITM
ENTS
BY
CA
LEN
DA
R Y
EAR
‐
5,000
10,000
15,000
20,000
25,000
30,000
35,000
40,000
45,000
New
Com
mitm
ents
24

% C
hang
e fr
om
prio
r yea
r
FY 9
8-99
1,72
3
-2
2.3%
FY 9
9-00
1,74
7
1.
4%FY
00-
011,
692
-3.1
%FY
01-
021,
710
1.1%
FY 0
2-03
1,62
9
-4
.7%
FY
03-
041,
977
21.4
%FY
04-
052,
165
9.5%
FY 0
5-06
2,17
6
0.
5%FY
06-
072,
001
-8.0
%FY
07-
081,
788
-10.
6%FY
08-
091,
315
-26.
5%FY
09-
101,
344
2.2%
FY 1
0-11
1,23
3
-8
.3%
FY 1
1-12
1,13
2
-8
.2%
FY
12-
131,
237
9.3%
FY 1
3-14
1,35
0
9.
1%FY
14-
151,
314
-2.7
%FY
15-
161,
386
5.5%
*FY
16-
171,
278
-7.8
%
*Thi
s nu
mbe
r may
cha
nge
slig
htly
as
revi
sion
s ar
e m
ade
thro
ugh
2016
.
Con
ditio
nal R
elea
se a
nd C
ontr
ol R
elea
se V
iola
tors
with
out N
ew S
ente
nces
‐
500
1,000
1,500
2,000
2,500
Cond
ition
al Release and
Con
trol Release
Violators w
ithou
t New
Sen
tences
25

0
500
1,00
0
1,50
0
2,00
0
2,50
0
3,00
0
3,50
0
4,00
0
4,50
0
New
Com
mitm
ents
Bef
ore
and
Afte
r Zer
o-To
lera
nce
Impl
emen
tatio
n
Befo
re
Afte
r
26

% Change
Technical violators to prison FY 2002-03: 7,898Technical violators to prison FY 2003-04: 9,478 20.0%
Technical violators to prison FY 2004-05: 10,148 7.1%
Technical violators to prison FY 2005-06: 10,576 4.2%
Technical violators to prison FY 2006-07: 11,207 6.0%
Technical violators to prison FY 2007-08: 10,145 -9.5%
Technical violators to prison FY 2008-09: 8,195 -19.2%
Technical violators to prison FY 2009-10: 7,506 -8.4%
Technical violators to prison FY 2010-11: 7,180 -4.3%
Technical violators to prison FY 2011-12: 6,310 -12.1%
Technical violators to prison FY 2012-13: 6,324 0.2%
Technical violators to prison FY 2013-14: 6,473 2.4%
Technical violators to prison FY 2014-15: 6,502 0.4%
Technical violators to prison FY 2015-16: 6,335 -2.6%
Technical violators to prison FY 2016-17: 5,443 -14.1%
MONTHLY AVERAGE BY TIME PERIOD: Diff % changeBefore zero tolerance:
July 2002 through December 2002 633
Transition period:
January 2003 through June 2003 (transition period): 684 51 8.1%
During zero tolerance:
July 2003 through June 2004 790 106 15.5% July 2004 through June 2005 846 56 7.1% July 2005 through June 2006 881 35 4.1% July 2006 through June 2007 934 53 6.0% July 2007 through June 2008 845 -89 -9.5%
After end of zero tolerance:
July 2008 through June 2009 683 -162 -19.2% July 2009 through June 2010 626 -57 -8.3% July 2010 through June 2011 598 -28 -4.5% July 2011 through June 2012 526 -72 -12.0% July 2012 through June 2013 527 1 0.2% July 2013 through June 2014 539 12 2.3% July 2014 through June 2015 542 3 0.6% July 2015 through June 2016 528 -14 -2.6% July 2016 through June 2017 454 -74 -14.0%
July 2016 through November 2016 181 July 2017 through November 2017 205 24 13.3%
Effect of "Zero Tolerance" Policy for Community Supervision ViolatorsOffenders sentenced to prison for technical violations of supervision
0
100
200
300
400
500
600
700
800
900
1000
7/02‐12/02
FY 03‐04 FY 05‐06 FY 07‐08 FY 09‐10 FY 11‐12 FY 13‐14 FY 15‐16
Probation Violators with Technical Violations Sentenced to Prison
Zero Tolerance PeriodTransition Period
Pre Zero Tolerance
After end of zero tolerance
27

t
0%
5%
10%
15%
20%
25%
30%
35%
Technical Violators as % of Total Admissions before, during, and after Zero Tolerance
Before
During
After
29.7%
32.8%34.6%
32.9%
32.2% 31.3%30.4%
32.4% 33.4% 33.7% 33.2%
31.0%32.8%
0.0%
5.0%
10.0%
15.0%
20.0%
25.0%
30.0%
35.0%
40.0%
FY 05‐06 FY 06‐07 FY 07‐08 FY 08‐09 FY 09‐10 FY 10‐11 FY 11‐12 FY 12‐13 FY 13‐14 FY 14‐15 FY 15‐16 FY 16‐17 Jul‐Nov 17
Percent of Technical Violators Sentenced to Prison
28

54.1
55.7
59.1
60.2
61.8
61.2
63.2
60.9
62.7
61.8
0.0
10.0
20.0
30.0
40.0
50.0
60.0
70.0
Aver
age
Sent
ence
Len
gth
for N
ew C
omm
itmen
ts
29

40.0
45.0
50.0
55.0
60.0
65.0
70.0
Aver
age
Sent
ence
Len
gth
(in m
onth
s) fo
r New
Com
mitm
ents
30

Sentence Length
12 - 15 m16 - 21 m22 - 27 m28 - 33 m34 - 39 m40 - 45 m46 - 51 m52 - 57 m58 - 78 m79 - 102 mGT 102 m
Sentence Length
12 - 15 m16 - 21 m22 - 27 m28 - 33 m34 - 39 m40 - 45 m46 - 51 m52 - 57 m58 - 78 m79 - 102 mGT 102 m
Avg Sentence Length
Months
In years
May 17 Jun 17 Jul 17 Aug 17 Sep 17 Oct 17 Nov 17% % % % % % %
19.0% 18.6% 18.1% 18.2% 18.1% 17.9% 17.6%14.0% 13.8% 14.4% 14.6% 14.2% 15.5% 14.6%11.6% 14.1% 12.0% 12.9% 14.8% 13.1% 13.9%
6.7% 5.8% 6.2% 5.7% 6.3% 6.0% 5.8%10.5% 10.9% 11.5% 11.8% 11.5% 12.4% 12.5%
3.1% 3.2% 3.1% 3.6% 3.3% 2.8% 3.0%5.1% 5.3% 6.1% 5.5% 5.1% 4.7% 5.2%1.5% 0.9% 1.0% 1.3% 1.2% 1.7% 1.0%
11.0% 10.3% 9.7% 8.8% 9.1% 9.6% 9.7%4.2% 4.1% 5.3% 4.1% 4.0% 4.0% 4.2%
13.5% 13.1% 12.8% 13.6% 12.4% 12.4% 12.6%
100.0% 100.0% 100.0% 100.0% 100.0% 100.0% 100.0%
May 17 Jun 17 Jul 17 Aug 17 Sep 17 Oct 17 Nov 17% % % % % % %
19.0% 18.6% 18.1% 18.2% 18.1% 17.9% 17.6%33.0% 32.4% 32.4% 32.9% 32.3% 33.4% 32.2%44.6% 46.4% 44.4% 45.8% 47.1% 46.5% 46.0%51.2% 52.2% 50.6% 51.5% 53.4% 52.5% 51.8%61.7% 63.2% 62.1% 63.3% 64.9% 64.9% 64.3%64.8% 66.4% 65.2% 66.8% 68.1% 67.7% 67.3%69.9% 71.7% 71.2% 72.3% 73.3% 72.4% 72.5%71.3% 72.6% 72.2% 73.6% 74.4% 74.1% 73.5%82.3% 82.8% 81.9% 82.4% 83.5% 83.6% 83.2%86.5% 86.9% 87.2% 86.4% 87.6% 87.6% 87.4%
100.0% 100.0% 100.0% 100.0% 100.0% 100.0% 100.0%
May 17 Jun 17 Jul 17 Aug 17 Sep 17 Oct 17 Nov 17% % % % % % %
8.1% 7.9% 8.5% 8.0% 7.0% 7.2% 7.3%
May 17 Jun 17 Jul 17 Aug 17 Sep 17 Oct 17 Nov 17Average Average Average Average Average Average Average
62.3 60.9 59.8 62.2 60.2 59.9 60.9
5.2 5.1 5.0 5.2 5.0 5.0 5.1
SENTENCE LENGTH DISTRIBUTIONS FOR NEW COMMITMENTS BY MONTH
Cumulative Percentage
Percent of all sentences that are a year and a day
Average sentence length
31

PercentFY 15-16 FY 16-17 Change Change
366 days 2,260 2,276 16 0.7%
367 days-15 m 2,799 2,796 (3) -0.1%
16 - 21 m 4,323 3,962 (361) -8.4%
22 - 27 m 3,850 3,693 (157) -4.1%
28 - 33 m 1,901 1,793 (108) -5.7%
34 - 39 m 3,368 3,126 (242) -7.2%
40 - 45 m 935 879 (56) -6.0%
46 - 51 m 1,491 1,479 (12) -0.8%
52 - 57 m 367 347 (20) -5.4%
58 - 78 m 2,917 2,773 (144) -4.9%
79 - 102 m 1,296 1,241 (55) -4.2%
GT 102 m 4,145 3,789 (356) -8.6%
Total 29,652 28,154 (1,498) -5.1%
PercentJul 16-Nov 16 Jul 17-Nov 17 Change Change
366 days 886 839 (47) -5.3%
367 days-15 m 1,142 1,142 - 0.0%
16 - 21 m 1,609 1,623 14 0.9%
22 - 27 m 1,523 1,460 (63) -4.1%
28 - 33 m 727 658 (69) -9.5%
34 - 39 m 1,306 1,319 13 1.0%
40 - 45 m 353 347 (6) -1.7%
46 - 51 m 628 584 (44) -7.0%
52 - 57 m 138 137 (1) -0.7%
58 - 78 m 1,137 1,033 (104) -9.1%
79 - 102 m 506 474 (32) -6.3%
GT 102 m 1,635 1,409 (226) -13.8%
Total 11,590 11,025 (565) -4.9%
SENTENCE LENGTH DISTRIBUTION OF NEW COMMITMENTS AND CHANGE FY 15-16 TO FY 16-17
SENTENCE LENGTH DISTRIBUTION OF NEW COMMITMENTS AND CHANGE Jul 16-Nov 16 TO Jul 17-Nov 17
Source: Monthly datafile of status population on the last day of the month obtained from the Department of Corrections, Bureau of Research and Data Analysis. In FY 16-17, this file contained 97 percent of new commitments. Numbers were inflated to match new commitment totals obtained from DOC.
32

Fiscal Year Number Change % Change
FY 04‐05 31,964 4,157 490 13.4%
FY 05‐06 34,546 5,217 1,060 25.5%
FY 06‐07 37,299 6,605 1,388 26.6%
FY 07‐08 40,491 6,089 (516) ‐7.8%FY 08‐09 38,735 4,777 (1,311) ‐21.5%FY 09‐10 36,450 3,601 (1,176) ‐24.6%FY 10‐11 34,394 2,879 (722) ‐20.0%FY 11‐12 31,376 2,281 (598) ‐20.8%FY 12‐13 32,279 2,126 (155) ‐6.8%FY 13‐14 31,472 2,493 367 17.3%FY 14‐15 30,278 2,302 (191) ‐7.7%FY 15‐16 29,652 2,260 (42) ‐1.8%FY 16‐17 * 28,154 2,276 16 0.7%
* Preliminary
Year‐and‐a‐Day New Commitments by Fiscal Year
Source: Unadjusted new commitments and year‐and‐a‐day new commitments were obtained from the monthly datafile of status population on the last day of the month obtained from the Department of Corrections, Bureau of Research and Analysis. In FY 16‐17, this file contained 97 percent of new commitments. Total new commitment numbers shown above match new commitment fiscal year totals obtained from DOC and year‐and‐a‐day new commitments were adjusted to reflect fiscal year totals.
Total New Commitments
Year‐and‐a‐Day New Commitments
33

0.0%
2.0%
4.0%
6.0%
8.0%
10.0%
12.0%
14.0%
16.0%
18.0%
20.0%
Year‐and
‐a‐Day New
Com
mitm
ents as Pe
rcen
t of
All N
ew Com
mitm
ents
34

County Jul 16-Nov 16 Jul 17-Nov 17 Change % Change
Bay 44 11 (33) -76.0%
Hillsborough 137 106 (31) -22.4%
Miami-Dade 65 43 (22) -33.4%
Pinellas 28 9 (19) -66.5%
Orange 39 27 (11) -29.3%
Osceola 17 6 (10) -62.3%
St. Lucie 15 5 (9) -64.1%
Leon 60 53 (7) -11.7%
Volusia 109 102 (7) -6.1%
Pasco 19 14 (5) -27.3%
Sub-total 532 377 (155) -29.2%
Palm Beach 77 92 14 18.3%Columbia 5 21 16 302.6%Escambia 6 22 16 252.3%Polk 53 89 35 65.8%
Sub-total 65 132 66 101.3%
All other counties 289 330 41 14.0%
Total 886 839 (47) -5.3%
Year-and-a-Day New Commitments and Change by County
Source: Monthly status file of prison population prepared by Bureau of Research and Data Analysis, Department of Corrections. Numbers were inflated to account for missing records on the monthly status file.
35

0.0%
5.0%
10.0%
15.0%
20.0%
25.0%
30.0%
35.0%
40.0%
45.0%
Jul 0
5
Jan
06
Jul 0
6
Jan
07
Jul 0
7
Jan
08
Jul 0
8
Jan
09
Jul 0
9
Jan
10
Jul 1
0
Jan
11
Jul 1
1
Jan
12
Jul 1
2
Jan
13
Jul 1
3
Jan
14
Jul 1
4
Jan
15
Jul 1
5
Jan
16
Jul 1
6
Jan
17
Jul 1
7
Year-and-a-day and year-and-a-month sentences as percent of total: Hillsborough County
Yr and day Year and month
0.0%
2.0%
4.0%
6.0%
8.0%
10.0%
12.0%
14.0%
16.0%
18.0%
20.0%
Jul 0
9Se
p 09
Nov
09
Jan
10M
ar 1
0M
ay 1
0Ju
l 10
Sep
10N
ov 1
0Ja
n 11
Mar
11
May
11
Jul 1
1Se
p 11
Nov
11
Jan
12M
ar 1
2M
ay 1
2Ju
l 12
Sep
12N
ov 1
2Ja
n 13
Mar
13
May
13
Jul 1
3Se
p 13
Nov
13
Jan
14M
ar 1
4M
ay 1
4Ju
l 14
Sep
14N
ov 1
4Ja
n 15
Mar
15
May
15
Jul 1
5Se
p 15
Nov
15
Jan
16M
ar 1
6M
ay 1
6Ju
l 16
Sep
16N
ov 1
6Ja
n 17
Mar
17
May
17
Jul 1
7Se
p 17
Nov
17
Year-and-a-day and year-and-a-month sentences as percent of total: Pinellas County
Yr and day Year and month
36

% of % of state total state total
County Jul-Nov 2016 Jul-Nov 2017 Jul-Nov 2016 Jul-Nov 2017
Polk 648 733 5.6% 6.6%
Hillsborough 794 710 6.9% 6.4%
Duval 848 581 7.3% 5.3%
Pinellas 604 574 5.2% 5.2%
Palm Beach 491 523 4.2% 4.7%
Volusia 399 488 3.4% 4.4%
Broward 633 484 5.5% 4.4%
Orange 589 444 5.1% 4.0%
Miami-Dade 549 392 4.7% 3.6%
Brevard 327 380 2.8% 3.4%
Sub-total 5,882 5,309 50.8% 48.2%
All other counties 5,708 5,716 49.2% 51.8%
Total 11,590 11,025 100.0% 100.0%
Counties with the Most New Commitments
37

County Jul-Nov 2016 Jul-Nov 2017 Change % Change
Duval 848 581 (267) -31.5%
Miami-Dade 549 392 (157) -28.6%
Broward 633 484 (149) -23.5%
Orange 589 444 (145) -24.6%
Hillsborough 794 710 (84) -10.6%
Lee 309 232 (77) -24.9%
Alachua 297 240 (57) -19.2%
Bay 373 318 (55) -14.7%
Marion 271 231 (40) -14.8%
Martin 126 90 (36) -28.6%
Charlotte 108 73 (35) -32.4%
Pinellas 604 574 (30) -5.0%
Sub-total 5,501 4,369 (1,132) -20.6%
Sumter 30 67 37 121.8%
Citrus 123 161 39 31.4%Brevard 327 380 53 16.3%
Columbia 94 152 58 61.7%
Escambia 305 363 58 19.0%
St. Johns 107 167 60 56.1%
Hernando 116 186 70 60.3%
Polk 648 733 85 13.1%
Volusia 399 488 89 22.3%
Sub-total 2,149 2,698 549 25.5%
All other counties 3,940 3,958 18 0.5%
Total 11,590 11,025 (565) -4.9%
New Commitments and Change in New Commitments by County
Source: Monthly status file of prison population prepared by Bureau of Research and Data Analysis, Department of Corrections. In FY 16-17, this file contained 97 percent of new commitments, however county of commitment is sometimes missing. According to DOC, offenders entering prison near the end of the the month may not have this information available by the time the status file is run at the end of the month. It was assumed that these missing data would not bias the county of commitment distribution. Therefore, these numbers were inflated to match new commitment totals.
38

County
4/1/2017 Official
population
4/1/2017 Official
population percentage distribution
FY 16-17 new commitments
FY 16-17 new commitments
percentage distribution
FY 16-17 year-and-a-day sentences
FY 16-17 year- and-a-day sentences percentage distribution
FY 16-17 year- and-a-day
sentences as percent of all new
commitmentsAlachua 260,003 1.3% 704 2.5% 2 0.1% 0.3%Baker 27,191 0.1% 145 0.5% 0 0.0% 0.0%Bay 178,820 0.9% 878 3.1% 120 5.3% 13.7%Bradford 27,642 0.1% 79 0.3% 0 0.0% 0.0%Brevard 575,211 2.8% 943 3.3% 50 2.2% 5.3%Broward 1,873,970 9.1% 1,529 5.4% 107 4.7% 7.0%Calhoun 15,001 0.1% 26 0.1% 2 0.1% 8.0%Charlotte 172,720 0.8% 261 0.9% 8 0.4% 3.2%Citrus 143,801 0.7% 312 1.1% 12 0.5% 3.7%Clay 208,549 1.0% 256 0.9% 2 0.1% 0.8%Collier 357,470 1.7% 283 1.0% 0 0.0% 0.0%Columbia 68,943 0.3% 279 1.0% 38 1.7% 13.5%DeSoto 35,621 0.2% 153 0.5% 23 1.0% 15.0%Dixie 16,726 0.1% 40 0.1% 8 0.4% 21.0%Duval 936,811 4.6% 1,759 6.2% 14 0.6% 0.8%Escambia 313,381 1.5% 791 2.8% 25 1.1% 3.2%Flagler 105,157 0.5% 74 0.3% 5 0.2% 7.0%Franklin 12,161 0.1% 45 0.2% 4 0.2% 9.3%Gadsden 48,263 0.2% 74 0.3% 10 0.5% 14.1%Gilchrist 17,224 0.1% 42 0.1% 0 0.0% 0.0%Glades 13,087 0.1% 33 0.1% 0 0.0% 0.0%Gulf 16,297 0.1% 43 0.2% 10 0.5% 24.4%Hamilton 14,663 0.1% 36 0.1% 1 0.0% 2.9%Hardee 27,426 0.1% 86 0.3% 3 0.1% 3.7%Hendry 39,057 0.2% 100 0.4% 0 0.0% 0.0%Hernando 181,882 0.9% 339 1.2% 38 1.7% 11.1%Highlands 102,138 0.5% 149 0.5% 12 0.5% 7.7%Hillsborough 1,379,302 6.7% 1,827 6.5% 292 12.8% 16.0%Holmes 20,210 0.1% 73 0.3% 4 0.2% 5.7%Indian River 148,962 0.7% 216 0.8% 10 0.5% 4.8%Jackson 50,418 0.2% 208 0.7% 56 2.4% 26.7%Jefferson 14,611 0.1% 12 0.0% 3 0.1% 27.2%Lafayette 8,479 0.0% 18 0.1% 2 0.1% 11.7%Lake 331,724 1.6% 300 1.1% 17 0.7% 5.6%Lee 698,468 3.4% 738 2.6% 4 0.2% 0.6%Leon 287,899 1.4% 775 2.8% 151 6.6% 19.5%Levy 41,015 0.2% 92 0.3% 0 0.0% 0.0%Liberty 8,719 0.0% 17 0.1% 0 0.0% 0.0%Madison 19,377 0.1% 38 0.1% 1 0.0% 2.8%Manatee 368,782 1.8% 522 1.9% 20 0.9% 3.8%Marion 349,267 1.7% 645 2.3% 27 1.2% 4.2%Martin 153,022 0.7% 310 1.1% 12 0.5% 3.7%Miami-Dade 2,743,095 13.4% 1,386 4.9% 162 7.1% 11.7%Monroe 76,889 0.4% 187 0.7% 9 0.4% 5.0%Nassau 80,456 0.4% 107 0.4% 0 0.0% 0.0%Okaloosa 195,488 1.0% 478 1.7% 0 0.0% 0.0%Okeechobee 41,140 0.2% 157 0.6% 15 0.6% 9.3%Orange 1,313,880 6.4% 1,298 4.6% 98 4.3% 7.6%Osceola 337,614 1.6% 453 1.6% 38 1.7% 8.3%Palm Beach 1,414,144 6.9% 1,220 4.3% 181 8.0% 14.9%Pasco 505,709 2.5% 617 2.2% 47 2.1% 7.6%Pinellas 962,003 4.7% 1,391 4.9% 53 2.3% 3.8%Polk 661,645 3.2% 1,670 5.9% 162 7.1% 9.7%Putnam 73,176 0.4% 240 0.9% 7 0.3% 3.1%
Population, Total New Commitments, and Year-and-a-Day New Commitments by County
39

County
4/1/2017 Official
population
4/1/2017 Official
population percentage distribution
FY 16-17 new commitments
FY 16-17 new commitments
percentage distribution
FY 16-17 year-and-a-day sentences
FY 16-17 year- and-a-day sentences percentage distribution
FY 16-17 year- and-a-day
sentences as percent of all new
commitments
Population, Total New Commitments, and Year-and-a-Day New Commitments by County
St. Johns 229,715 1.1% 297 1.1% 1 0.0% 0.4%St. Lucie 297,634 1.5% 642 2.3% 24 1.1% 3.8%Santa Rosa 170,835 0.8% 188 0.7% 10 0.5% 5.6%Sarasota 407,260 2.0% 436 1.5% 20 0.9% 4.6%Seminole 454,757 2.2% 424 1.5% 34 1.5% 7.9%Sumter 120,700 0.6% 95 0.3% 6 0.3% 6.6%Suwannee 44,690 0.2% 179 0.6% 13 0.6% 7.0%Taylor 22,295 0.1% 122 0.4% 17 0.7% 13.8%Union 15,947 0.1% 43 0.2% 4 0.2% 9.7%Volusia 523,405 2.6% 1,049 3.7% 258 11.3% 24.6%Wakulla 31,909 0.2% 33 0.1% 3 0.1% 9.7%Walton 65,301 0.3% 113 0.4% 0 0.0% 0.0%Washington 24,985 0.1% 80 0.3% 18 0.8% 22.3%
Total 20,484,142 100.0% 28,154 100.0% 2,276 100.0% 8.1%
Source: Population data are from the University of Florida, Bureau of Research and Data Analysis. New commitments and year-and-a-day sentences are from monthly status file of prison population prepared by Bureau of Research and Data Analysis, Department of Corrections. Numbers were inflated to account for missing data on the monthly status file.
40

Ju
l 16-
Nov
16
Jul 1
7-N
ov 1
7
Jul 1
6-N
ov 1
6Ju
l 17-
Nov
17
Ju
l 16-
Nov
16
Jul 1
7-N
ov 1
7
Mur
der/M
ansl
augh
ter
427
38
9
3.7%
3.5%
(38)
-8.9
%28
6.6
314.
1
S
exua
l/Lew
d B
ehav
ior
660
62
9
5.7%
5.7%
(31)
-4.7
%16
3.9
152.
9
R
obbe
ry77
7
609
6.
7%5.
5%(1
68)
-2
1.6%
107.
593
.9
V
iole
nt, O
ther
1,75
9
1,
774
15.2
%16
.1%
15
0.
9%50
.849
.7
B
urgl
ary
1,82
9
1,
642
15.8
%14
.9%
(187
)
-10.
2%61
.157
.9
P
rope
rty T
heft/
Frau
d/D
amag
e1,
868
1,74
6
16
.1%
15.8
%(1
22)
-6
.5%
29.1
29.2
Dru
gs2,
578
2,52
9
22
.2%
22.9
%(4
9)
-1
.9%
38.2
38.2
Wea
pons
773
73
7
6.7%
6.7%
(36)
-4.7
%42
.442
.8
O
ther
919
97
0
7.9%
8.8%
51
5.
5%34
.931
.8
To
tal
11,5
90
11,0
25
100.
0%10
0.0%
(565
)
-4.9
%63
.360
.7
Sou
rce:
Mon
thly
sta
tus
file
of p
rison
pop
ulat
ion
prep
ared
by
Bur
eau
of R
esea
rch
and
Dat
a A
naly
sis,
Dep
artm
ent o
f C
orre
ctio
ns.
In F
Y 1
6-17
, thi
s fil
e co
ntai
ned
97
perc
ent o
f new
com
mitm
ents
how
ever
sen
tenc
ing
deta
ils a
re o
ften
mis
sing
. A
ccor
ding
to D
OC
, offe
nder
s en
terin
g pr
ison
nea
r the
end
of t
he m
onth
may
not
hav
e th
is
info
rmat
ion
avai
labl
e by
the
time
the
stat
us fi
le is
run
at th
e en
d of
the
mon
th.
It w
as a
ssum
ed th
at th
ese
mis
sing
dat
a w
ould
not
bia
s th
e pr
imar
y of
fens
e di
strib
utio
n.
Ther
efor
e, th
e pr
imar
y of
fens
e di
strib
utio
n w
as a
djus
ted
to m
atch
new
com
mitm
ent t
otal
s fo
r thi
s an
alys
is.
Per
cent
C
hang
eTi
me
perio
dP
erce
ntA
vera
ge S
ente
nce
Leng
th
(mon
ths)
FLO
RID
A N
EW C
OM
MIT
MEN
TS
Cha
nge
41

Ju
l 16-
Nov
16
Jul 1
7-N
ov 1
7
Jul 1
6-N
ov 1
6Ju
l 17-
Nov
17
Ju
l 16-
Nov
16
Jul 1
7-N
ov 1
7
Bur
glar
y of
an
occu
pied
dw
ellin
g93
6
813
51
.2%
49.5
%(1
23)
-1
3.1%
58.4
53.1
Bur
glar
y of
an
unoc
cupi
ed s
truct
ure
486
45
8
26.6
%27
.9%
(28)
-5.8
%28
.531
.9
Bur
glar
y, a
rmed
with
exp
losi
ve o
r w
eapo
n20
6
189
11
.3%
11.5
%(1
7)
-8
.3%
108.
910
5.1
Bur
glar
y as
saul
t any
per
son
131
10
1
7.2%
6.2%
(30)
-22.
9%13
7.4
130.
6
Rem
aind
er o
f offe
nses
in "B
urgl
ary"
ca
tego
ry70
81
3.
8%4.
9%11
15.7
%40
.652
.5
To
tal
1,82
9
1,
642
100.
0%10
0.0%
(1
87)
-1
0.2%
61.1
57.9
FLO
RID
A N
EW C
OM
MIT
MEN
TS F
OR
"B
UR
GLA
RY"
OFF
ENSE
S
Not
e: D
ata
wer
e ob
tain
ed fr
om m
onth
ly s
tatu
s fil
es p
repa
red
by B
urea
u of
Res
earc
h an
d D
ata
Ana
lysi
s, F
lorid
a D
epar
tmen
t of C
orre
ctio
ns a
nd w
ere
adju
sted
to a
ccou
nt fo
r mis
sing
dat
a.
Tim
e pe
riod
Per
cent
Cha
nge
Per
cent
C
hang
e
Ave
rage
Sen
tenc
e Le
ngth
(m
onth
s)
42

Ju
l 16-
Nov
16
Jul 1
7-N
ov 1
7
Jul 1
6-N
ov 1
6Ju
l 17-
Nov
17
Ju
l 16-
Nov
16
Jul 1
7-N
ov 1
7
Rob
bery
with
fire
arm
or d
eadl
y w
eapo
n36
5
276
47
.0%
45.3
%(8
9)
-2
4.4%
141.
612
3.4
R
obbe
ry, n
o fir
earm
or d
eadl
y w
eapo
n27
0
195
34
.7%
32.0
%(7
5)
-2
7.8%
65.9
54.5
R
obbe
ry w
ith o
ther
wea
pon
68
69
8.8%
11.3
%1
1.
5%10
5.2
82.4
S
udde
n sn
atch
, no
wea
pon
30
25
3.9%
4.1%
(5)
-16.
7%27
.230
.3
Hom
e in
vasi
on ro
bber
y w
ith fi
rear
m o
r de
adly
wea
pon
23
27
3.0%
4.4%
4
17.4
%20
5.1
157.
6
Oth
er ro
bber
y of
fens
es21
17
2.
7%2.
8%(4
)
-1
9.0%
66.1
104.
9
To
tal
777
60
9
100.
0%10
0.0%
(168
)
-21.
6%10
7.5
93.9
Not
e: D
ata
wer
e ob
tain
ed fr
om m
onth
ly s
tatu
s fil
es p
repa
red
by B
urea
u of
Res
earc
h an
d D
ata
Ana
lysi
s, F
lorid
a D
epar
tmen
t of C
orre
ctio
ns a
nd w
ere
adju
sted
to a
ccou
nt fo
r mis
sing
dat
a.
FLO
RID
A N
EW C
OM
MIT
MEN
TS F
OR
RO
BB
ERY
OFF
ENSE
S
Tim
e pe
riod
Per
cent
Ave
rage
Sen
tenc
e Le
ngth
(m
onth
s)C
hang
eP
erce
nt
Cha
nge
43
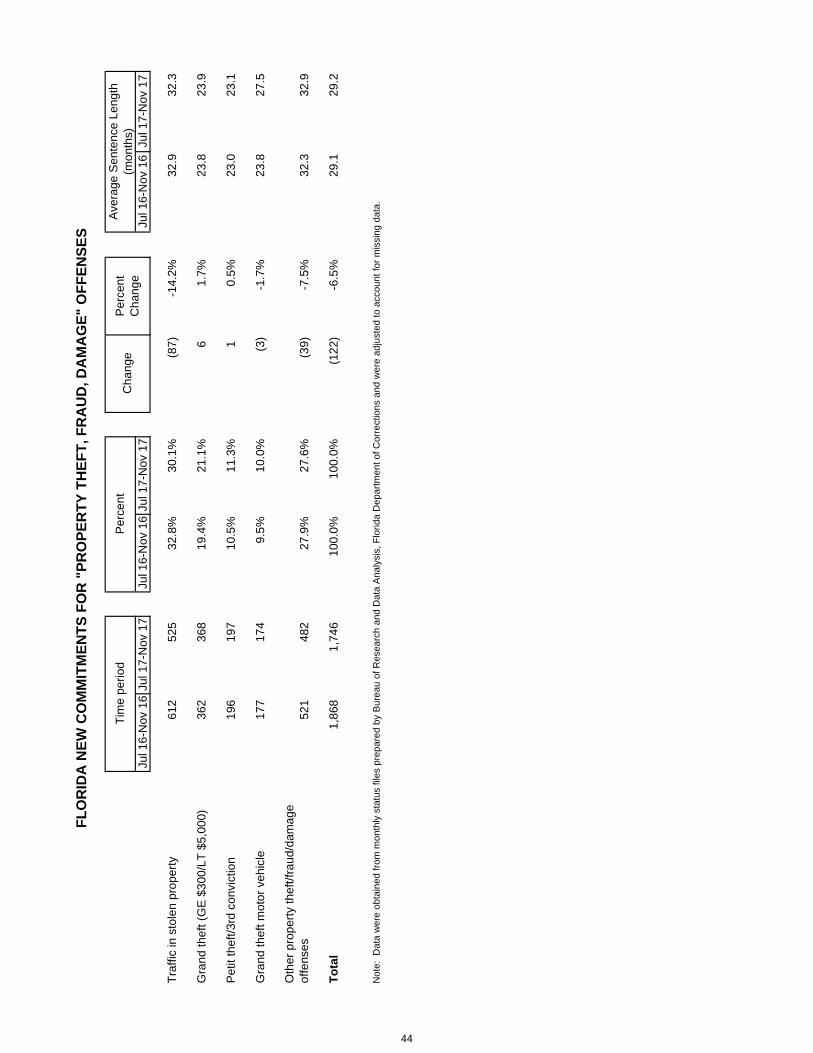
Ju
l 16-
Nov
16
Jul 1
7-N
ov 1
7
Jul 1
6-N
ov 1
6Ju
l 17-
Nov
17
Ju
l 16-
Nov
16
Jul 1
7-N
ov 1
7
Traf
fic in
sto
len
prop
erty
612
52
5
32.8
%30
.1%
(87)
-1
4.2%
32.9
32.3
Gra
nd th
eft (
GE
$30
0/LT
$5,
000)
362
36
8
19.4
%21
.1%
6
1.7%
23.8
23.9
Pet
it th
eft/3
rd c
onvi
ctio
n19
6
197
10
.5%
11.3
%1
0.
5%23
.023
.1
Gra
nd th
eft m
otor
veh
icle
177
17
4
9.5%
10.0
%(3
)
-1
.7%
23.8
27.5
O
ther
pro
perty
thef
t/fra
ud/d
amag
e of
fens
es52
1
482
27
.9%
27.6
%(3
9)
-7.5
%32
.332
.9
To
tal
1,86
8
1,
746
100.
0%10
0.0%
(122
)
-6.5
%29
.129
.2
Not
e: D
ata
wer
e ob
tain
ed fr
om m
onth
ly s
tatu
s fil
es p
repa
red
by B
urea
u of
Res
earc
h an
d D
ata
Ana
lysi
s, F
lorid
a D
epar
tmen
t of C
orre
ctio
ns a
nd w
ere
adju
sted
to a
ccou
nt fo
r mis
sing
dat
a.
FLO
RID
A N
EW C
OM
MIT
MEN
TS F
OR
"PR
OPE
RTY
TH
EFT,
FR
AU
D, D
AM
AG
E" O
FFEN
SES
Tim
e pe
riod
Per
cent
Ave
rage
Sen
tenc
e Le
ngth
(m
onth
s)C
hang
eP
erce
nt
Cha
nge
44
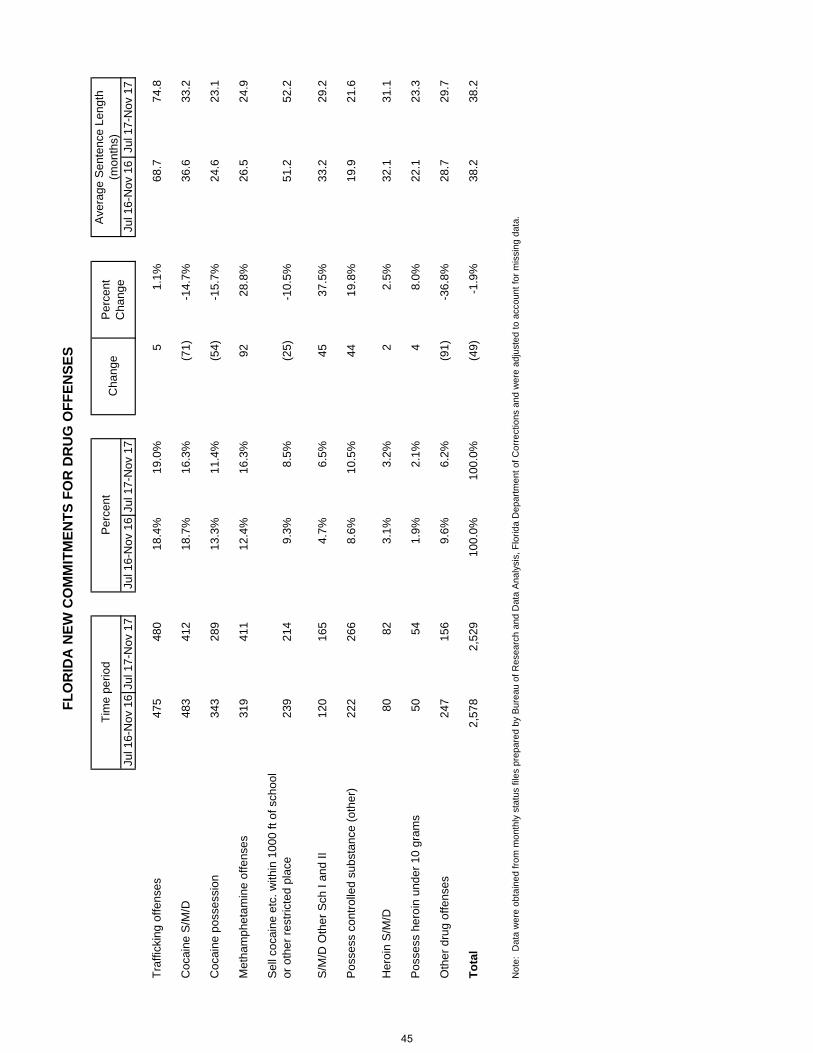
Ju
l 16-
Nov
16
Jul 1
7-N
ov 1
7
Jul 1
6-N
ov 1
6Ju
l 17-
Nov
17
Ju
l 16-
Nov
16
Jul 1
7-N
ov 1
7
Traf
ficki
ng o
ffens
es47
5
480
18
.4%
19.0
%5
1.
1%68
.774
.8
Coc
aine
S/M
/D48
3
412
18
.7%
16.3
%(7
1)
-1
4.7%
36.6
33.2
Coc
aine
pos
sess
ion
343
28
9
13.3
%11
.4%
(54)
-15.
7%24
.623
.1
Met
ham
phet
amin
e of
fens
es31
9
411
12
.4%
16.3
%92
28.8
%26
.524
.9
Sel
l coc
aine
etc
. with
in 1
000
ft of
sch
ool
or o
ther
rest
ricte
d pl
ace
239
21
4
9.3%
8.5%
(25)
-10.
5%51
.252
.2
S/M
/D O
ther
Sch
I an
d II
120
16
5
4.7%
6.5%
45
37
.5%
33.2
29.2
Pos
sess
con
trolle
d su
bsta
nce
(oth
er)
222
26
6
8.6%
10.5
%44
19.8
%19
.921
.6
Her
oin
S/M
/D80
82
3.
1%3.
2%2
2.
5%32
.131
.1
Pos
sess
her
oin
unde
r 10
gram
s50
54
1.
9%2.
1%4
8.
0%22
.123
.3
Oth
er d
rug
offe
nses
247
15
6
9.6%
6.2%
(91)
-36.
8%28
.729
.7
To
tal
2,57
8
2,
529
100.
0%10
0.0%
(49)
-1.9
%38
.238
.2
Tim
e pe
riod
Per
cent
Ave
rage
Sen
tenc
e Le
ngth
(m
onth
s)C
hang
eP
erce
nt
Cha
nge
Not
e: D
ata
wer
e ob
tain
ed fr
om m
onth
ly s
tatu
s fil
es p
repa
red
by B
urea
u of
Res
earc
h an
d D
ata
Ana
lysi
s, F
lorid
a D
epar
tmen
t of C
orre
ctio
ns a
nd w
ere
adju
sted
to a
ccou
nt fo
r mis
sing
dat
a.
FLO
RID
A N
EW C
OM
MIT
MEN
TS F
OR
DR
UG
OFF
ENSE
S
45

Per
cent
Ju
l 16-
Nov
16
Jul 1
7-N
ov 1
7
Jul 1
6-N
ov 1
6Ju
l 17-
Nov
17
Cha
nge
Cha
nge
Mur
der/M
ansl
augh
ter
1
-
0.
1%0.
0%(1
)
-100
.0%
Sex
ual/L
ewd
Beh
avio
r10
6
1.
1%0.
7%(4
)
-40.
0%
R
obbe
ry31
20
3.
5%2.
4%(1
1)
-3
5.5%
Vio
lent
, Oth
er11
9
118
13
.4%
14.1
%(1
)
-0.8
%
B
urgl
ary
106
10
7
12.0
%12
.8%
1
0.9%
Pro
perty
The
ft/Fr
aud/
Dam
age
216
21
5
24.4
%25
.6%
(1)
-0
.5%
Dru
gs25
3
236
28
.6%
28.1
%(1
7)
-6
.7%
Wea
pons
47
38
5.3%
4.5%
(9)
-1
9.1%
Oth
er10
3
99
11
.6%
11.8
%(4
)
-3.9
%
To
tal
886
83
9
100.
0%10
0.0%
(47)
-5.3
%
FLO
RID
A Y
EAR
-AN
D-A
-DA
Y N
EW C
OM
MIT
MEN
TS
Tim
e pe
riod
Per
cent
Sou
rce:
Mon
thly
sta
tus
file
of p
rison
pop
ulat
ion
prep
ared
by
Bur
eau
of R
esea
rch
and
Dat
a A
naly
sis,
Dep
artm
ent o
f C
orre
ctio
ns.
In F
Y
16-1
7, th
is fi
le c
onta
ined
97
perc
ent o
f new
com
mitm
ents
how
ever
sen
tenc
ing
deta
ils a
re o
ften
mis
sing
. A
ccor
ding
to D
OC
, offe
nder
s en
terin
g pr
ison
nea
r the
end
of t
he m
onth
may
not
hav
e th
is in
form
atio
n av
aila
ble
by th
e tim
e th
e st
atus
file
is ru
n at
the
end
of th
e m
onth
. It
was
ass
umed
that
thes
e m
issi
ng d
ata
wou
ld n
ot b
ias
the
prim
ary
offe
nse
dist
ribut
ion.
The
refo
re, t
he p
rimar
y of
fens
e di
strib
utio
n w
as a
djus
ted
to m
atch
new
com
mitm
ent t
otal
s fo
r thi
s an
alys
is.
46
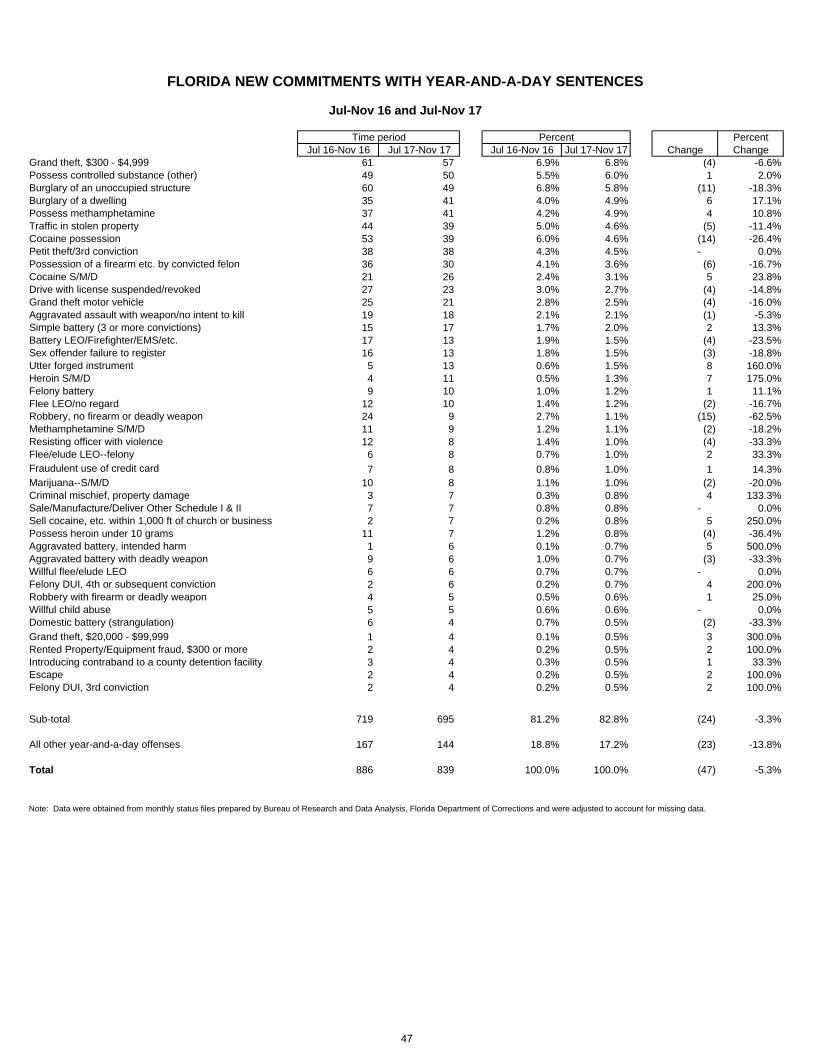
Percent
Jul 16-Nov 16 Jul 17-Nov 17 Jul 16-Nov 16 Jul 17-Nov 17 Change ChangeGrand theft, $300 - $4,999 61 57 6.9% 6.8% (4) -6.6%Possess controlled substance (other) 49 50 5.5% 6.0% 1 2.0%Burglary of an unoccupied structure 60 49 6.8% 5.8% (11) -18.3%Burglary of a dwelling 35 41 4.0% 4.9% 6 17.1%Possess methamphetamine 37 41 4.2% 4.9% 4 10.8%Traffic in stolen property 44 39 5.0% 4.6% (5) -11.4%Cocaine possession 53 39 6.0% 4.6% (14) -26.4%Petit theft/3rd conviction 38 38 4.3% 4.5% - 0.0%Possession of a firearm etc. by convicted felon 36 30 4.1% 3.6% (6) -16.7%Cocaine S/M/D 21 26 2.4% 3.1% 5 23.8%Drive with license suspended/revoked 27 23 3.0% 2.7% (4) -14.8%Grand theft motor vehicle 25 21 2.8% 2.5% (4) -16.0%Aggravated assault with weapon/no intent to kill 19 18 2.1% 2.1% (1) -5.3%Simple battery (3 or more convictions) 15 17 1.7% 2.0% 2 13.3%Battery LEO/Firefighter/EMS/etc. 17 13 1.9% 1.5% (4) -23.5%Sex offender failure to register 16 13 1.8% 1.5% (3) -18.8%Utter forged instrument 5 13 0.6% 1.5% 8 160.0%Heroin S/M/D 4 11 0.5% 1.3% 7 175.0%Felony battery 9 10 1.0% 1.2% 1 11.1%Flee LEO/no regard 12 10 1.4% 1.2% (2) -16.7%Robbery, no firearm or deadly weapon 24 9 2.7% 1.1% (15) -62.5%Methamphetamine S/M/D 11 9 1.2% 1.1% (2) -18.2%Resisting officer with violence 12 8 1.4% 1.0% (4) -33.3%Flee/elude LEO--felony 6 8 0.7% 1.0% 2 33.3%Fraudulent use of credit card 7 8 0.8% 1.0% 1 14.3%Marijuana--S/M/D 10 8 1.1% 1.0% (2) -20.0%Criminal mischief, property damage 3 7 0.3% 0.8% 4 133.3%Sale/Manufacture/Deliver Other Schedule I & II 7 7 0.8% 0.8% - 0.0%Sell cocaine, etc. within 1,000 ft of church or business 2 7 0.2% 0.8% 5 250.0%Possess heroin under 10 grams 11 7 1.2% 0.8% (4) -36.4%Aggravated battery, intended harm 1 6 0.1% 0.7% 5 500.0%Aggravated battery with deadly weapon 9 6 1.0% 0.7% (3) -33.3%Willful flee/elude LEO 6 6 0.7% 0.7% - 0.0%Felony DUI, 4th or subsequent conviction 2 6 0.2% 0.7% 4 200.0%Robbery with firearm or deadly weapon 4 5 0.5% 0.6% 1 25.0%Willful child abuse 5 5 0.6% 0.6% - 0.0%Domestic battery (strangulation) 6 4 0.7% 0.5% (2) -33.3%Grand theft, $20,000 - $99,999 1 4 0.1% 0.5% 3 300.0%Rented Property/Equipment fraud, $300 or more 2 4 0.2% 0.5% 2 100.0%Introducing contraband to a county detention facility 3 4 0.3% 0.5% 1 33.3%Escape 2 4 0.2% 0.5% 2 100.0%Felony DUI, 3rd conviction 2 4 0.2% 0.5% 2 100.0%
Sub-total 719 695 81.2% 82.8% (24) -3.3%
All other year-and-a-day offenses 167 144 18.8% 17.2% (23) -13.8%
Total 886 839 100.0% 100.0% (47) -5.3%
Note: Data were obtained from monthly status files prepared by Bureau of Research and Data Analysis, Florida Department of Corrections and were adjusted to account for missing data.
FLORIDA NEW COMMITMENTS WITH YEAR-AND-A-DAY SENTENCES
Jul-Nov 16 and Jul-Nov 17
Time period Percent
47
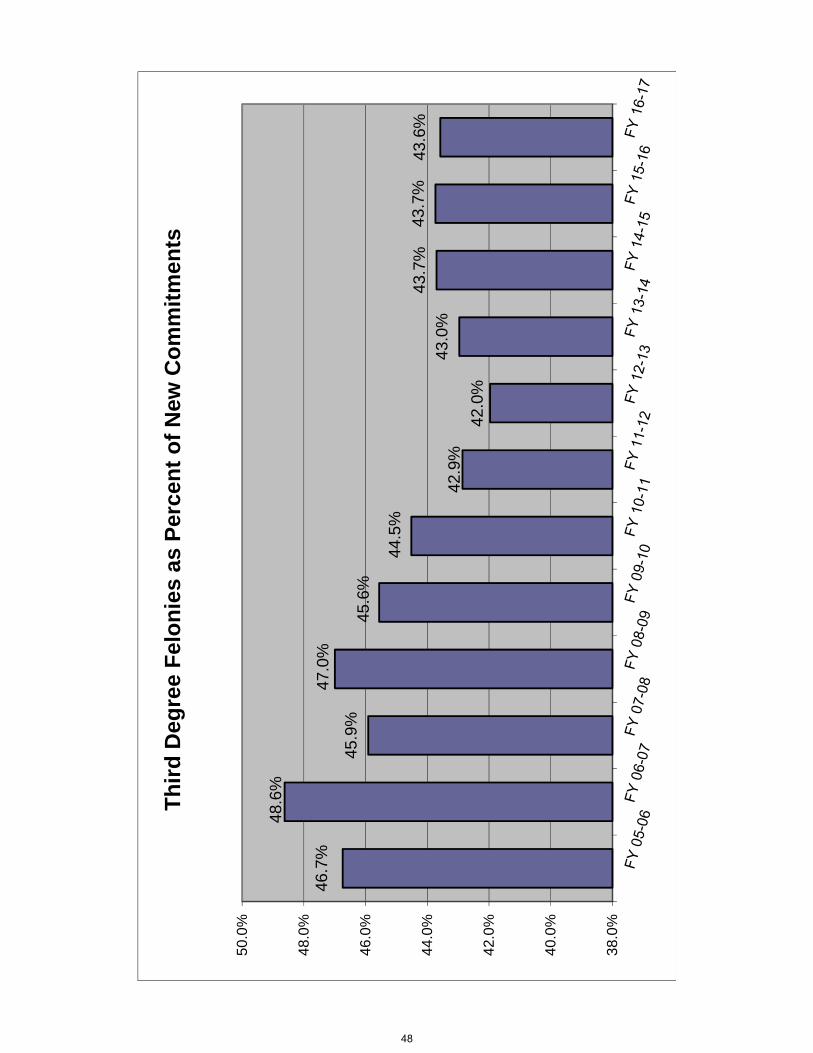
46.7
%
48.6
%
45.9
%
47.0
%
45.6
%
44.5
%
42.9
%42
.0%
43.0
%43
.7%
43.7
%43
.6%
38.0
%
40.0
%
42.0
%
44.0
%
46.0
%
48.0
%
50.0
%
Third
Deg
ree
Felo
nies
as
Perc
ent o
f New
Com
mitm
ents
48

s. 775 diversion eligible pool sentenced to prison as % of all sentencing events Prison
State Supervision Other Prison
State Supervision Other
FY 07-08129,837 41,666 1.32% 1,716 27,445 12,505 4.1% 65.9% 30.0%
FY 08-09122,056 36,781 1.37% 1,670 24,186 10,925 4.5% 65.8% 29.7%
FY 09-10 (offense prior to 7-1-2009) 70,519 16,646 1.31% 927 11,276 4,443 5.6% 67.7% 26.7%FY 09-10 (offense on or after 7-1-2009) 42,081 13,864 0.86% 362 9,661 3,841 2.6% 69.7% 27.7%FY 10-11 (offense prior to 7-1-2009) 24,194 4,380 1.14% 277 2,723 1,380 6.3% 62.2% 31.5%FY 10-11 (offense on or after 7-1-2009) 76,621 21,309 0.72% 551 16,222 4,536 2.6% 76.1% 21.3%FY 11-12 (offense prior to 7-1-2009) 11,986 1,924 0.88% 105 1,220 599 5.5% 63.4% 31.1%FY 11-12 (offense on or after 7-1-2009) 89,802 23,659 0.56% 502 17,867 5,290 2.1% 75.5% 22.4%FY 12-13 (offense prior to 7-1-2009) 6,740 1,009 0.79% 53 596 360 5.3% 59.1% 35.7%FY 12-13 (offense on or after 7-1-2009) 94,622 24,528 0.53% 506 18,365 5,657 2.1% 74.9% 23.1%FY 13-14 (offense prior to 7-1-2009) 4,014 523 0.75% 30 283 210 5.7% 54.1% 40.2%FY 13-14 (offense on or after 7-1-2009) 91,980 24,518 0.50% 461 18,418 5,639 1.9% 75.1% 23.0%FY 14-15 (offense prior to 7-1-2009) 3,057 367 0.62% 19 167 181 5.2% 45.5% 49.3%FY 14-15 (offense on or after 7-1-2009) 99,306 26,290 0.48% 476 18,579 7,235 1.8% 70.7% 27.5%FY 15-16 (offense prior to 7-1-2009) 2,328 311 0.73% 17 130 164 5.5% 41.8% 52.7%FY 15-16 (offense on or after 7-1-2009) 108,323 28,066 0.55% 593 19,321 8,152 2.1% 68.8% 29.0%FY 16-17 (offense prior to 7-1-2009) 1,795 197 0.45% 8 79 110 4.1% 40.1% 55.8%FY 16-17 (offense on or after 7-1-2009) 118,060 29,969 0.38% 446 20,777 8,746 1.5% 69.3% 29.2%FY 17-18* (offense prior to 7-1-2009) 436 43 0.69% 3 14 26 7.0% 32.6% 60.5%FY 17-18* (offense on or after 7-1-2009) 37,101 9,830 0.30% 110 6,639 3,081 1.1% 67.5% 31.3%
Prepared by Florida Legislature, Office of Economic and Demographic Research, December 6, 2017.
MONITORING CS/SB 1722 ‐‐ 22‐POINT DIVERSION
SENTENCING EVENTS
Total with LE 22 points AND 3rd degree felony
and non FF primary offense and no FF
additionals and no FF priors
SANCTION SANCTION %
* Preliminary, through November 30, 2017
4.1%4.5%
5.6%
2.6%
6.3%
2.6%
5.5%
2.1%
5.3%
2.1%
5.7%
1.9%
5.2%
1.8%
5.5%
2.1%
4.1%
1.5%
7.0%
1.1%
0.0%
1.0%
2.0%
3.0%
4.0%
5.0%
6.0%
7.0%
8.0%
FY 07‐08 FY 09‐10 (offenseprior to 7‐1‐2009)
FY 10‐11 (offenseprior to 7‐1‐2009)
FY 11‐12 (offenseprior to 7‐1‐2009)
FY 12‐13 (offenseprior to 7‐1‐2009)
FY 13‐14 (offenseprior to 7‐1‐2009)
FY 14‐15 (offenseprior to 7‐1‐2009)
FY 15‐16 (offenseprior to 7‐1‐2009)
FY 16‐17 (offenseprior to 7‐1‐2009)
FY 17‐18*(offense prior to
7‐1‐2009)
22‐Point Diversion Eligible Pool Sentenced to Prison
* Preliminary, through November 30, 2017
49

Equal to or greater than 3 yrs but less than 10 yrs
Equal to or greater than 10
yrs but less than 20 yrs
Equal to or greater than 20
yrs but less than 25 yrs
Equal to or greater than 25
yrs but less than LIFE LIFE
INMATES ADMITTED BY
YEAR
CUMULATIVE TOTAL
INMATES ADMITTED
10-20-Life population on June 30
FY 99-00 101 45 4 5 - 155 155 147 FY 00-01 310 234 25 30 7 606 761 729 FY 01-02 289 322 32 49 2 694 1,455 1,387 FY 02-03 303 327 48 65 18 761 2,216 1,987 FY 03-04 394 349 49 74 12 878 3,094 2,585 FY 04-05 317 358 49 86 17 827 3,921 3,170 FY 05-06 347 337 55 89 23 851 4,772 3,732 FY 06-07 426 352 62 102 21 963 5,735 4,380 FY 07-08 429 481 101 124 27 1,162 6,897 5,247 FY 08-09 521 586 98 118 22 1,345 8,242 6,221 FY 09-10 552 631 101 133 23 1,440 9,682 7,115 FY 10-11 530 551 110 148 27 1,366 11,048 7,905 FY 11-12 545 514 90 146 39 1,334 12,382 8,592 FY 12-13 631 509 78 166 24 1,408 13,790 9,305 FY 13-14 561 460 100 177 27 1,325 15,115 9,923 FY 14-15 589 474 85 143 36 1,327 16,442 10,478 FY 15-16 575 449 89 135 24 1,272 17,714 10,942 FY 16-17 690 434 80 145 19 1,368 19,082 11,442
Equal to or greater than 3 yrs but less than 10 yrs
Equal to or greater than 10
yrs but less than 20 yrs
Equal to or greater than 20
yrs but less than 25 yrs
Equal to or greater than 25
yrs but less than LIFE LIFE
INMATES ADMITTED BY
YEAR
10-20-Life population on June 30
FY 00-01 206.9% 420.0% 525.0% 500.0% NA 291.0% 395.9%FY 01-02 -6.8% 37.6% 28.0% 63.3% -71.4% 14.5% 90.3%FY 02-03 4.8% 1.6% 50.0% 32.7% 800.0% 9.7% 43.3%FY 03-04 30.0% 6.7% 2.1% 13.8% -33.3% 15.4% 30.1%FY 04-05 -19.5% 2.6% 0.0% 16.2% 41.7% -5.8% 22.6%FY 05-06 9.5% -5.9% 12.2% 3.5% 35.3% 2.9% 17.7%FY 06-07 22.8% 4.5% 12.7% 14.6% -8.7% 13.2% 17.4%FY 07-08 0.7% 36.6% 62.9% 21.6% 28.6% 20.7% 19.8%FY 08-09 21.4% 21.8% -3.0% -4.8% -18.5% 15.7% 18.6%FY 09-10 6.0% 7.7% 3.1% 12.7% 4.5% 7.1% 14.4%FY 10-11 -4.0% -12.7% 8.9% 11.3% 17.4% -5.1% 11.1%FY 11-12 2.8% -6.7% -18.2% -1.4% 44.4% -2.3% 8.7%FY 12-13 15.8% -1.0% -13.3% 13.7% -38.5% 5.5% 8.3%FY 13-14 -11.1% -9.6% 28.2% 6.6% 12.5% -5.9% 6.6%FY 14-15 5.0% 3.0% -15.0% -19.2% 33.3% 0.2% 5.6%FY 15-16 -2.4% -5.3% 4.7% -5.6% -33.3% -4.1% 4.4%FY 16-17 20.0% -3.3% -10.1% 7.4% -20.8% 7.5% 4.6%
PERCENTAGE CHANGE FROM PRIOR YEAR
Source: Florida Department of Corrections, Bureau of Research and Data Analysis, July 12, 2017.
These numbers may differ from those reported previously due to a change by the Department of Corrections in the methodology used to report admissions
Prison Admissions Sentenced Under Ch. 99-12 (3-10-20-Life)LONGEST MANDATORY SENTENCE LENGTH
50
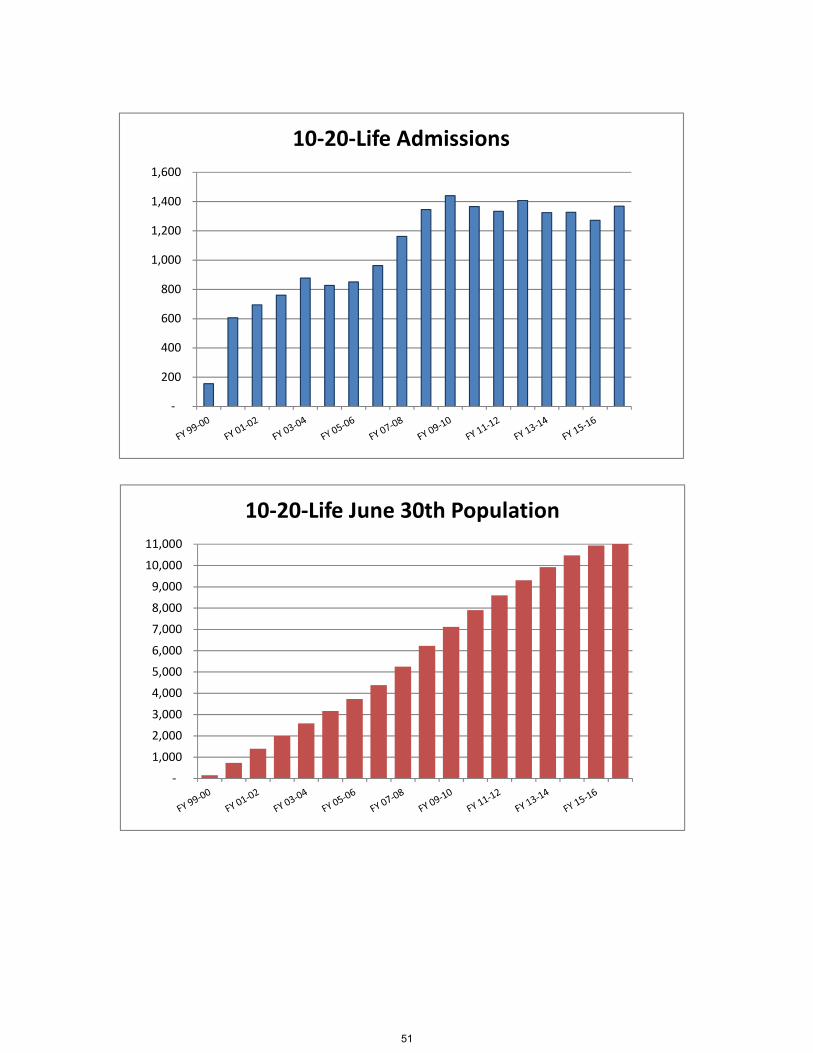
‐
200
400
600
800
1,000
1,200
1,400
1,600
10‐20‐Life Admissions
‐
1,000
2,000
3,000
4,000
5,000
6,000
7,000
8,000
9,000
10,000
11,000
10‐20‐Life June 30th Population
51

0
10,0
00
20,0
00
30,0
00
40,0
00
50,0
00
60,0
00
70,0
00
0001
0203
0405
0607
0809
1011
1213
1415
1617
June
Cou
nty
Jail
Ave
rage
Dai
ly P
opul
atio
nB
efor
e an
d A
fter Z
ero
Tole
ranc
e
Bef
ore
Afte
r--u
nadj
uste
dA
fter-
adju
sted
52

29,0
00
34,0
00
39,0
00
44,0
00
49,0
00
54,0
00
59,0
00
64,0
00
69,0
00
Ave
rage
Dai
ly P
opul
atio
n in
Cou
nty
Jails
Una
djus
ted
Adj
uste
d
53

16.0
%
17.0
%
18.0
%
19.0
%
20.0
%
21.0
%
22.0
%
Sent
ence
d Fe
lons
in C
ount
y Ja
ils a
s %
of T
otal
Jai
l Pop
ulat
ion
54

100,000
105,000
110,000
115,000
120,000
125,000
0304
0506
0708
0910
1112
1314
1516
17
Offen
ders on Ac
tive Supe
rvisionJune
30th
55

June 30Total
population
Offenders with life or
death sentence Change
Percent change
Percent with death or life sentence
1990 42,733 4,549 344 8.2% 10.6%1991 46,233 4,851 302 6.6% 10.5%1992 47,052 5,196 345 7.1% 11.0%1993 50,603 5,499 303 5.8% 10.9%1994 56,052 5,869 370 6.7% 10.5%1995 61,992 6,262 393 6.7% 10.1%1996 64,333 6,534 272 4.3% 10.2%1997 64,713 6,969 435 6.7% 10.8%1998 66,280 7,355 386 5.5% 11.1%1999 68,382 7,699 344 4.7% 11.3%2000 71,233 8,092 393 5.1% 11.4%2001 72,007 8,367 275 3.4% 11.6%2002 73,553 8,659 292 3.5% 11.8%2003 77,316 8,991 332 3.8% 11.6%2004 81,974 9,298 307 3.4% 11.3%2005 84,901 9,719 421 4.5% 11.4%2006 88,576 10,152 433 4.5% 11.5%2007 92,844 10,542 390 3.8% 11.4%2008 98,192 10,982 440 4.2% 11.2%2009 100,894 11,320 338 3.1% 11.2%2010 102,232 11,737 417 3.7% 11.5%2011 102,319 12,078 341 2.9% 11.8%2012 100,527 12,398 320 2.6% 12.3%2013 100,884 12,667 269 2.2% 12.6%2014 100,942 13,046 379 3.0% 12.9%2015 100,050 13,284 238 1.8% 13.3%2016 99,119 13,466 182 1.4% 13.6%2017 97,794 13,579 113 0.8% 13.9%
OFFENDERS WITH LIFE OR DEATH SENTENCES ON JUNE 30
0
2,000
4,000
6,000
8,000
10,000
12,000
14,000
16,000
Offenders with Death or Life Sentence on June 30th
56

0.0%
5.0%
10.0%
15.0%
20.0%
25.0%
Percen
t of O
ffend
ers w
ith Death or Life
Sen
tence or 10‐20
‐Life
Senten
ce on June
30th
10‐20‐Life
Death or Life
57

INMATESTOTAL PRISON RATIO OF PERPRISON PERCENT POP ON PERCENT ADMITS 100,000 OF
FISCAL YEAR ADMISSIONS CHANGE JUNE 30 CHANGE TO POP FL.'S POP
1978-79 8,292 3.6% 20,078 1.0% 0.41 212.5 1979-80 9,546 15.1% 19,722 -1.8% 0.48 202.3 1980-81 11,096 16.2% 21,579 9.4% 0.51 212.8 1981-82 13,621 22.8% 26,161 21.2% 0.52 250.8 1982-83 14,301 5.0% 27,717 5.9% 0.52 259.6 1983-84 12,516 -12.5% 26,471 -4.5% 0.47 241.0 1984-85 14,393 15.0% 28,310 6.9% 0.51 250.0 1985-86 17,154 19.2% 29,712 5.0% 0.58 254.9 1986-87 23,048 34.4% 32,764 10.3% 0.70 273.0 1987-88 30,454 32.1% 33,681 2.8% 0.90 273.2 1988-89 39,569 29.9% 38,059 13.0% 1.04 300.8 1989-90 43,639 10.3% 42,733 12.3% 1.02 330.3 1990-91 36,752 -15.8% 46,233 8.2% 0.79 348.7 1991-92 35,436 -3.6% 47,012 1.7% 0.75 348.3 1992-93 33,217 -6.3% 50,603 7.6% 0.66 368.6 1993-94 30,295 -8.8% 56,052 10.8% 0.54 399.1 1994-95 26,751 -11.7% 61,992 10.6% 0.43 432.4 1995-96 23,893 -10.7% 64,333 3.8% 0.37 439.9 1996-97 23,789 -0.4% 64,713 0.6% 0.37 433.2 1997-98 24,318 2.2% 66,280 2.4% 0.37 435.2 1998-99 25,147 3.4% 68,599 3.5% 0.37 440.3 1999-00 27,126 7.9% 71,233 3.8% 0.38 445.7 2000-01 27,217 0.3% 72,007 1.1% 0.38 441.6 2001-02 27,564 1.3% 73,553 2.1% 0.37 442.2 2002-03 30,287 9.9% 77,316 5.1% 0.39 455.3 2003-04 33,615 11.0% 81,974 6.0% 0.41 471.8 2004-05 34,129 1.5% 84,901 3.6% 0.40 477.6 2005-06 36,722 7.6% 88,576 4.3% 0.41 487.9 2006-07 39,300 7.0% 92,844 4.8% 0.42 503.3 2007-08 42,279 7.6% 98,192 5.8% 0.43 527.5 2008-09 40,050 -5.3% 100,894 2.8% 0.40 539.9 2009-10 37,794 -5.6% 102,232 1.3% 0.37 543.7 2010-11 35,627 -5.7% 102,319 0.1% 0.35 541.2 2011-12 32,508 -8.8% 100,527 -1.8% 0.32 527.0 2012-13 33,516 3.1% 100,884 0.4% 0.33 523.8 2013-14 32,822 -2.1% 100,942 0.1% 0.33 517.5 2014-15 31,592 -3.7% 100,050 -0.9% 0.32 504.9 2015-16 31,038 -1.8% 99,119 -0.9% 0.31 491.9 2016-17 29,432 -5.2% 97,794 -1.3% 0.30 477.4
PRISON ADMISSIONS AND POPULATION BY FISCAL YEAR
Data Sources: Total Admissions and June 30 Prison Population: Florida Department of Corrections, various publications and website.
April 1 population numbers used to calculate the inmates per 100,000 Florida population are from the Florida Demographic Estimating Conference held December 5, 2017.
Note: Total admissions include new commitments, control releasees with and without new sentences, and conditional releasees with and without new sentences.
58

0.0
100.
0
200.
0
300.
0
400.
0
500.
0
600.
0
INM
ATES
PER
100
,000
FLO
RID
A R
ESID
ENTS
59

0
20,0
00
40,0
00
60,0
00
80,0
00
100,
000
120,
000
Year
DO
C S
TATU
S PO
PULA
TIO
N:
JUN
E 30
60

0
5000
10000
15000
20000
25000
30000
35000
40000
45000
DOC PRISON ADMISSIONS BY FISCAL YEAR: AGE DISTRIBUTION
17 & Under 18‐24 25‐34 35‐49 50‐59 60+
2.19%0.72%
26.84%
18.99%
32.79%
36.19%
33.78%
31.26%
3.55%
10.19%
0.84% 2.64%0.00%
5.00%
10.00%
15.00%
20.00%
25.00%
30.00%
35.00%
40.00%
45.00%
50.00%
DOC PRISON ADMISSIONS BY FISCAL YEAR: PERCENTAGE OF DIFFERENT AGE GROUPS
17 & Under 18‐24 25‐34 35‐49 50‐59 60+
61
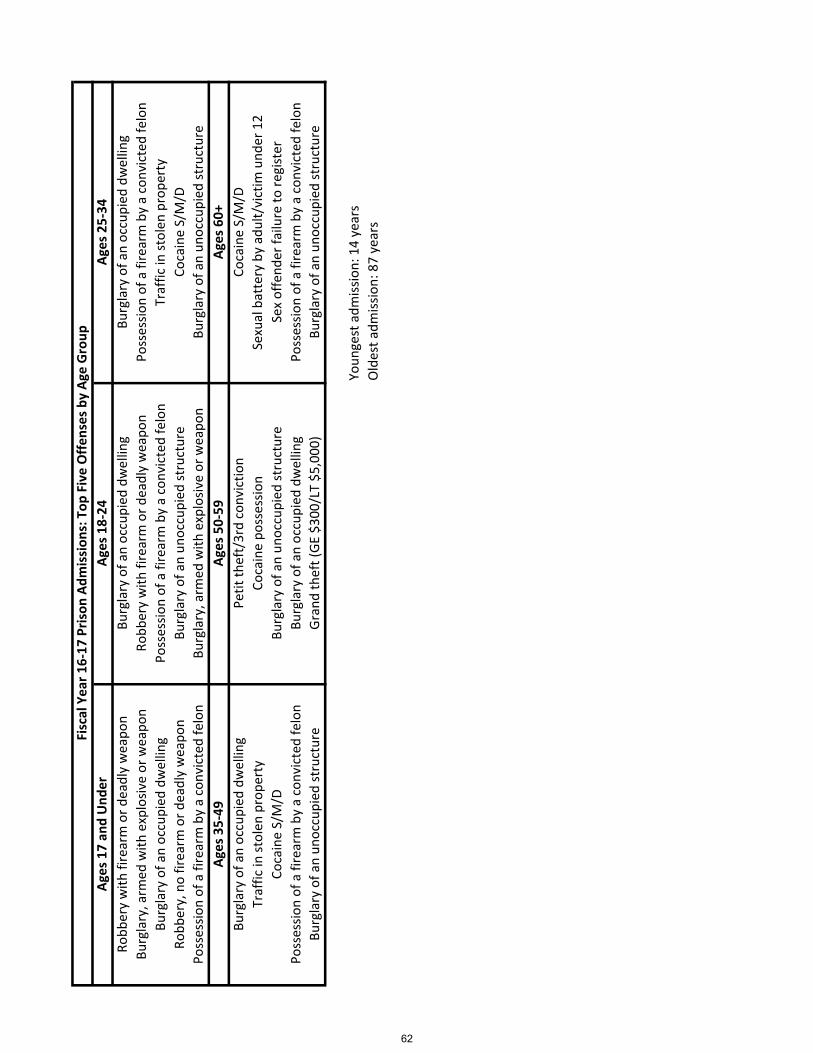
Ages 17 an
d Und
erAg
es 18‐24
Ages 25‐34
Robb
ery with
firearm or d
eadly weapo
nBu
rglary of an occupied
dwelling
Burglary of an occupied
dwelling
Burglary, arm
ed with
explosiv
e or weapo
nRo
bbery with
firearm or d
eadly weapo
nPo
ssessio
n of a firearm by a convicted felon
Burglary of an occupied
dwelling
Possessio
n of a firearm by a convicted felon
Traffic in
stolen
prope
rty
Robb
ery, no firearm
or d
eadly weapo
nBu
rglary of an un
occupied
structure
Cocaine S/M/D
Possessio
n of a firearm by a convicted felon
Burglary, arm
ed with
explosiv
e or weapo
nBu
rglary of an un
occupied
structure
Ages 35‐49
Ages 50‐59
Ages 60+
Burglary of an occupied
dwelling
Petit th
eft/3rd convictio
nCo
caine S/M/D
Traffic in
stolen
prope
rty
Cocaine po
ssessio
nSexual battery by adult/victim
und
er 12
Cocaine S/M/D
Burglary of an un
occupied
structure
Sex offend
er failure to
register
Possessio
n of a firearm by a convicted felon
Burglary of an occupied
dwelling
Possessio
n of a firearm by a convicted felon
Burglary of an un
occupied
structure
Grand
theft (GE $3
00/LT $5
,000
)Bu
rglary of an un
occupied
structure
Youn
gest adm
ission: 14 years
Oldest a
dmission: 87 years
Fiscal Year 1
6‐17
Prison
Adm
ission
s: Top
Five Offen
ses by
Age
Group
62
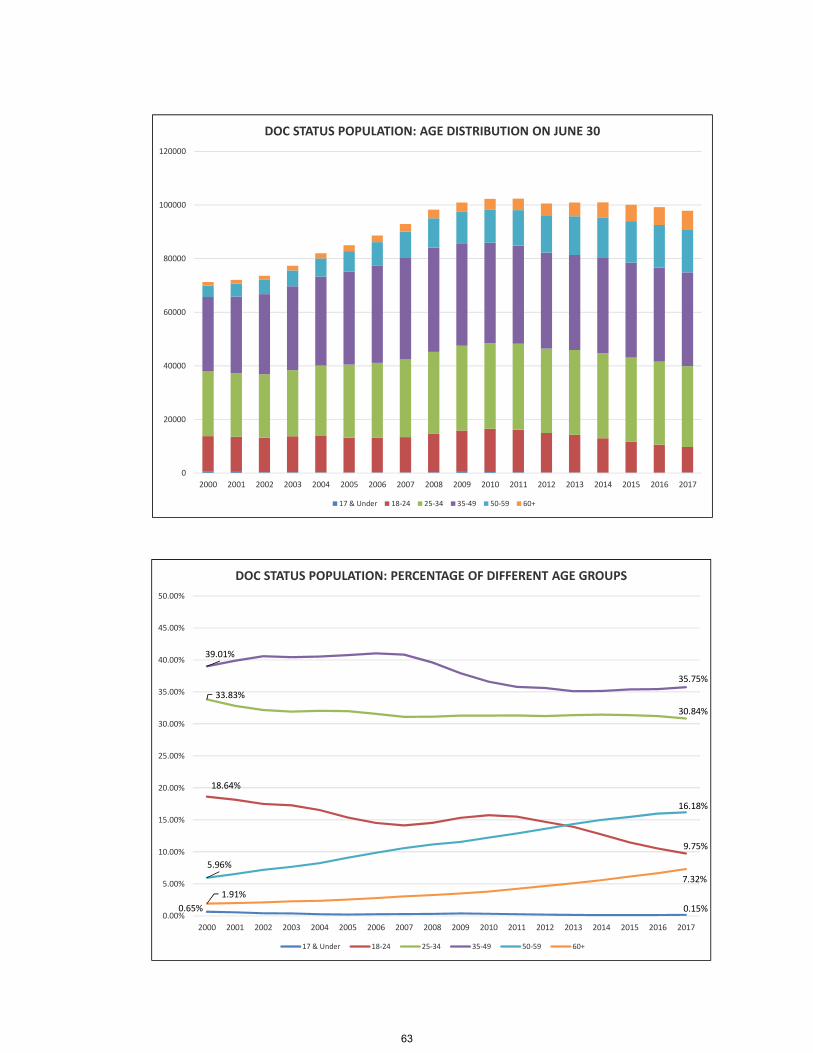
0
20000
40000
60000
80000
100000
120000
2000 2001 2002 2003 2004 2005 2006 2007 2008 2009 2010 2011 2012 2013 2014 2015 2016 2017
DOC STATUS POPULATION: AGE DISTRIBUTION ON JUNE 30
17 & Under 18‐24 25‐34 35‐49 50‐59 60+
0.65% 0.15%
18.64%
9.75%
33.83%
30.84%
39.01%
35.75%
5.96%
16.18%
1.91%7.32%
0.00%
5.00%
10.00%
15.00%
20.00%
25.00%
30.00%
35.00%
40.00%
45.00%
50.00%
2000 2001 2002 2003 2004 2005 2006 2007 2008 2009 2010 2011 2012 2013 2014 2015 2016 2017
DOC STATUS POPULATION: PERCENTAGE OF DIFFERENT AGE GROUPS
17 & Under 18‐24 25‐34 35‐49 50‐59 60+
63