creative skillset employment census of the creative media...
TRANSCRIPT

Creative Skillset Employment Census of the Creative Media Industries
2012

Professor Mike Campbell OBEChair, Creative Skillset Research and Evaluation Committee
I am pleased to have the opportunity to introduce you to the eighth Creative Skillset Employment Census of the creative media industries, which I hope you will fi nd an interesting, useful and valuable resource. Taken together with previous censuses, it provides insight into the changing composition of the industries’ employment patterns and geography over time. It includes up-to-date and detailed estimates of the size and shape of the creative media industries’ workforce as a whole, as well as covering separately: television, fi lm, interactive media, radio, facilities, animation, corporate production, computer games and VFX. It also considers the representation of women, Black, Asian and Minority Ethnic groups (BAME) and people with disabilities, enabling consideration of the changing representation of diverse groups across the industries.
It should be useful not only as a resource and depository of information, but also to businesses, those currently working in the industries, as well as those aspiring to become part of it. It provides a basis too, for companies to benchmark their own workforce against that of the industries as a whole. It can help target skills investments and identify the character of specifi c needs. It will be helpful to human resources staff, those involved in recruitment and bodies representing the interests of women, BAME groups and those with a disability, both within and beyond the industries.
The Census forms part of a wider, innovative programme of intelligence, research and evaluation on, and for, the industries being undertaken by Creative Skillset. Further details are available on the website www.creativeskillset.org/research
Foreword
Creative Skillset would like to thank the hundreds of employers who contributed
to the Census; the UK Commission for Employment and Skills for co-investing
in this important work through the Employer Investment Fund, and the
following contributors:
Acknowledgements
• Dr. David Brooks – Ashbrook Research & Consultancy, Director
• Professor Mike Campbell OBE – Independent Consultant
• Milo Connolly – Qualasys Research Business and Intelligence, Director
• Neil Heyer – Qualasys Research Business and Intelligence, Director
• Neil Flintham – Independent Consultant
Table of ContentsExecutive summary 4
Introduction 6
The size and shape of the creative media industries 9
Television 22
Film 28
Interactive media 34
Radio 39
Facilities 44
Animation 50
Corporate production 55
Computer games 60
VFX 65
Appendix: Census form 68

1 The Census does not include publishing, photo imaging, advertising and freelancers working in fi lm production.
Executive Summary
How the Census fits within Creative Skillset’s Research and Evaluation Strategy
The vision underpinning Creative Skillset’s Research and Evaluation Strategy is to support the growth and wealth creation of the Creative Industries, by providing outstanding labour market intelligence that enables UK employers to understand the size and shape of the sectors, skills needs within them, as well as plan for, invest in, and measure the impact of skills and talent interventions.
The Employment Census of Creative Media Industries sits within a larger programme of research activities, such as employer and workforce panels, forecasting tools and supply side mapping (see www.creativeskillset.org/research). Primary research such as the Census provides invaluable information to employers and other stakeholders across the Creative Media Industries. The results and analysis presented also benefi ts from drawing on a range of other sources and insights.
Key trends 2009-2012
Total employment in the creative media industries has grown by more than 4,000, representing a 2% increase in employment across the industries. The increase of employment compares to a 1% increase across the rest of the UK economy and is mostly driven by the growth in terrestrial broadcast, interactive media, facilities, animation, games publishing and games development support.
The sub-sectors which lost jobs include radio, studios and equipment hire, fi lm production, commercial production and pop promos and computer games development.
Representation of women has increased from 53,750 in 2009 to 69,590 in 2012. Women represented 36% of the total workforce in 2012 compared to 27% in 2009. This reverses the previous decline over the 2006-09 periods.
Representation of Black, Asian and Minority Ethnic (BAME) people declined from 7.4% of the total workforce in 2006 to 6.7% in 2009 and is now just 5.4% in 2012.
Levels of employment have increased in Wales, Scotland and Northern Ireland, the South East and the South West of England.
Distribution, methodology and response
A Census form was distributed to every company for which records were available in the creative media sectors covered, for completion on the Census date of 4 July 2012.
The sectors covered include:
• animation • commercials • computer games
• corporate production • facilities • interactive media • libraries and archives • radio • television • VFX • fi lm apart from the freelance crew employed by fi lm
production companies1.
The Census excludes freelancers who were not working on Census Day.
The 2012 Census achieved 832 responses including major employers and small companies. The proportion of responses completed online increased from 47% in 2009 to 57% of the overall response in 2012.
Caution should be exercised reading fi gures cut by three variables e.g. sector/gender/occupational group. Figures at this level are indicative only.
4

The overall representation of women has increased since 2009.
Television, interactive media, animation, commercials and pop promos, corporate production and computer games have seen the biggest increase. Other sub-sectors where representation has increased are fi lm distribution, studios and equipment hire, post production and independent radio production.
As in previous years, representation of women is highest in certain occupations: in particular make-up and hairdressing (81%) and costume and wardrobe (73%). Women also make up over half (56%) of the legal workforce, distribution, sales and marketing (55%), business management (52%) and broadcast management (51%) but less than half in every other occupational group.
There is considerable variation across the country, largely refl ecting the concentration of sub-sectors and occupations in each area. For example, London, the North West and Scotland, which all accommodate substantial segments of the television and radio broadcasting sectors, contain the highest proportions of women. Representation is lowest in South East and South West of England which contain concentrations of interactive and facilities companies as well as the West Midlands with its concentration of computer games companies.
Representation of people from a BAME background differs considerably between sectors, being highest in commercials production, independent radio, cable and satellite and terrestrial broadcast and lowest in special physical effects, VFX, corporate production and studios and equipment hire.
There are some major variations in BAME representation by occupational group. The highest proportion being employed in legal, content development, technical development and libraries and archives and lowest in servicing, manufacture, transport, audio/sound/music, lighting, animators and engineering and transmission.
There is considerable variation in representation across the UK. London and the East Midlands have the highest representation of BAME workers, and North East England and Wales the lowest.
Representation of women Black, Asian and Minority Ethnic Representation
Overall, the proportion of the workforce described by their employers as disabled has remained the same since 2006, at 1.0%. This is signifi cantly lower than the proportion reporting themselves as disabled in Creative Skillset’s 2010 Creative Media Workforce Survey, in which 5.6% of the workforce reported they have a disability.
Representation of disabled people
Executive Summary | 5
Current employment and freelancing
Total employment in the industries as covered in the Census, is estimated at 192,200 - an increase from 188,150 in 2009.
24% of the workforce is freelance, which is the same as 2009. Freelancing is most prevalent in those areas most closely involved in the production process.

IntroductionBackground Scope
6
This report presents the fi ndings of the eighth Creative Skillset Employment Census of the creative media industries.
Since 2000, improvements have been made in the design, distribution and methodology, with new sectors targeted, separate forms developed for some sectors to ease completion and employers able to complete the form online. As a result, 832 major employers and small companies participated in the 2012 Census.
The aim of the Census is to provide reliable estimates on the size and shape of employment in the creative media industries. By doing so, Creative Skillset can identify changes in the workforce, monitor representation of diverse groups and target investment in skills development on behalf of the industries in order to ensure their needs are met.
To achieve this, companies were asked to indicate their number of employees and freelancers in specifi c occupational groups and job roles on Wednesday 4 July 2012. For each employee and freelancer they were asked to indicate how many were women, from a Black, Asian or Minority Ethnic (BAME) background and disabled. A copy of the main Census form is appended to this report. In 2009, Creative Skillset redeveloped a full occupational map of the industries it represents, in order to accurately classify industry sectors and occupations. While some changes have been made to both the sector and occupational classifi cation systems used, there remains a high level of correspondence and similarity between previous and current systems enabling trend analysis in most cases.
The creative media industries in this report refers to fi lm, television, radio, animation, facilities, interactive media, computer games, VFX, commercials production and corporate production.
It does not include:
• Film production freelancers. While the Census covers permanent roles employed within fi lm production companies (classifi ed as fi lm production), freelance crew are covered within a separate cycle of research conducted jointly with the BFI. The snapshot methodology of recording employment on one day does not provide a reliable estimate of the total workforce involved in fi lmmaking as production levels fl uctuate over time. The Census methodology is less problematic for other fi lm sectors such as fi lm distribution and cinema exhibition which are less freelance dominated and more stable in employment terms.
• Performers, who work across most of the sectors, nearly all work on a peripatetic basis which, in common with fi lm production crews, does not lend itself to inclusion within the Census. They are therefore included within other elements of Creative Skillset’s research programme.
• Photo imaging and publishing is relatively well-served by the Offi ce for National Statistics’ Labour Force Survey. The data is reliable and accurate with the exception that some freelancers will be excluded. The extent of this exclusion has been measured within Creative Skillset’s Workforce Survey.

Method
Introduction | 7
Census forms were distributed to companies throughout the UK for completion on 4 July or shortly after. A central database of around 20,000 companies was set up using a number of available sources including trade association membership lists, screen agency records and other databases. In addition, the Census was publicised in trade journals and national press in order to reach companies outside the membership of industry organisations.
Each company was given three weeks to complete and return the questionnaire. Companies that had not responded by Friday 27 July were contacted by letter, email and/or telephone (depending on sector and availability of contact information). During the telephone follow-up stage the aim was to urge companies to complete the full form online and, for companies of up to ten people, to complete the form while on the phone. To increase response rates and account for the August holiday season the Census deadline was extended to 30 September 2012.
Response
Precise response rates are diffi cult to calculate due to the lack of reliable and up-to-date information on the number of companies in some sectors. Table 1 (see p.8) shows the number of responses per sector. The proportion of responses completed online has increased from 47% in 2009 to 57% in 2012.
The fi nal employment estimates for the industries were calculated by applying a weighting methodology based on using data on the population of employers in each sector to gross up the responses per sector. Sector parity and other parameters were taken into consideration, to allow for as reliable estimates as possible. Secondary/desk research was also conducted to triangulate and health check the validity of the weighting factors applied.2
2 Where responses were too low to support reliable estimates, the relevant sub-sectors have been removed. This included eight responses from TV community, distribution, interactive and broadcast technology; three responses from facilities outside broadcast, systems integration, processing labs and transmission and four responses from cinema exhibition that did not match the sub-sector. This gave a total of 15 deleted responses that are not shown in Table 1. No responses were received for interactive media mobile content.

8 | Introduction
Analysis and presentation of the Census results
This report has been designed to provide sector-led insights. It provides an overview of the creative media industries as a whole and then continues with information on the size and shape of each industry in turn.
Response (continued)
PAPER ONLINE TOTAL
Terrestrial 0 5 5
Cable and Satellite 4 5 9
Independent Production 51 94 145
Broadcast 11 37 48
Independent Production 8 7 15
Community/Voluntary 35 6 41
Post Production 22 25 47
Studios and Equipment Hire 24 12 36
Special Physical Effects 7 4 11
Manufacture of AV equipment 4 0 4
Other services for Film and TV 38 16 54
Production 22 35 57
Distribution 3 5 8
Cinema Exhibition 10 22 32
ANIMATION 16 15 31
VFX 2 8 10
COMMERCIALS PRODUCTION AND POP PROMOS 6 3 9
CORPORATE PRODUCTION 21 32 53
Online Content 22 43 65
Systems Design/Software 4 4 8
Social Media/Web 2.0 16 9 25
Other Interactive Media 5 4 9
Games Development 0 27 27
Games Publishing 1 3 4
Games Support 0 3 3
ARCHIVES AND LIBRARIES 3 9 12
OTHER 25 39 64
TOTAL 360 472 832
TE
LE
VIS
ION
RA
DIO
FA
CIL
ITIE
SF
ILM
INT
ER
AC
TIV
E
ME
DIA
T i lNNNN
Response per sub/sector Table 1
CO
MP
UT
ER
GA
ME
S

9
2009 2012 CHANGE %
Terrestrial Broadcast 15,750 16,650 +6%
Cable and Satellite 12,700 12,300 -3%
Independent Production 21,700 21,650 0%
Broadcast 19,900 13,500 -32%
Independent Production 1,000 600 -40%
Community/Voluntary n/a 3,100
Post Production 7,450 8,900 +19%
Studios and Equipment Hire 5,900 5,300 -10%
Outside Broadcast 600 n/a
Special Physical Effects 700 800 +14%
Manufacture of AV equipment 2,900 3,000 +3%
Processing labs 300 n/a
Other services for Film and TV 18,600 18,950 +2%
Production (excluding freelancers) 1,300 1,150 -12%
Distribution 1,200 1,200 0%
Cinema Exhibition 17,650 17,700 0%
ANIMATION 4,300 4,600 +7%
VFX 6,900 5,300 -23%
COMMERCIALS PRODUCTION AND POP PROMOS 4,100 3,800 -7%
CORPORATE PRODUCTION 3,950 4,100 +4%
Online Content 27,550 23,300 -15%
Systems Design/Software n/a 6,850
Social Media/Web 2.0 n/a 8,750
Mobile Content 800 n/a
Offl ine Media 2,750 n/a
Other Interactive Media 3,100 4,150 +33%
Games Development 5,500 3,700 -33%
Games Publishing 1,350 1,550 +14%
Games Support 150 250 +66%
ARCHIVES AND LIBRARIES 350 350 0%
OTHER n/a 750
TOTAL 188,150 192,200 +2%
UK economy (excluding Media)* 24,164,202 24,405,285 +0.99%
TE
LE
VIS
ION
RA
DIO
FA
CIL
ITIE
SF
ILM
INT
ER
AC
TIV
E M
ED
IAC
OM
PU
TE
RG
AM
ES
T i l B dNNNN
Employment in the industries – 2009-2012 Table 2
The size and shape of the creative media industries
The size of the workforceTable 2 shows overall employment by sector in 2009 and 2012, and the percentage change over the three year period. The total employment between the two surveys has increased by 2% from 188,150 to 192,200.
However, there has been considerable variation in the pattern of jobs growth and decline over the period. The sub-sectors experiencing decline include radio, VFX, online content, fi lm production and computer games development. Post production, special physical effects, games publishing and games development support have increased since 2009.
*Source: Offi ce for National Statistics’ Labour Force Survey, Oct-Dec 2009 and Oct-Dec 2012NB: Figures are rounded up or down to the nearest 50
Occupations: Employees and freelancers
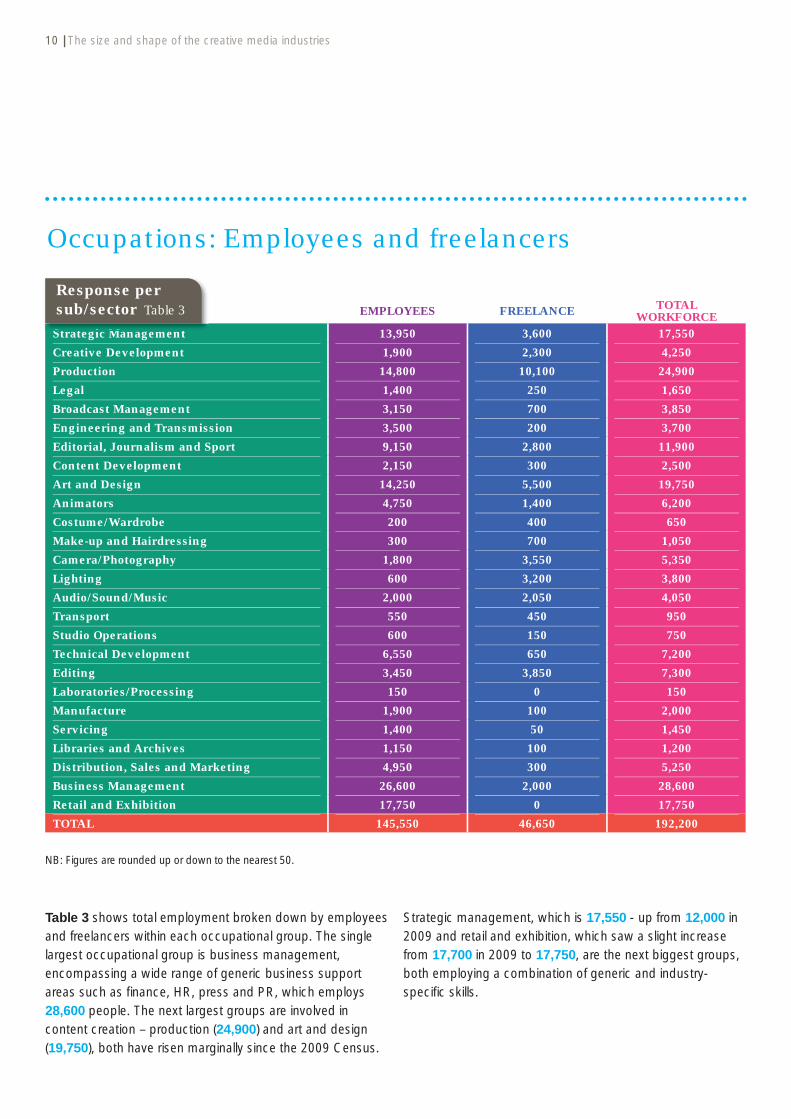
Table 3 shows total employment broken down by employees and freelancers within each occupational group. The single largest occupational group is business management, encompassing a wide range of generic business support areas such as fi nance, HR, press and PR, which employs 28,600 people. The next largest groups are involved in content creation – production (24,900) and art and design (19,750), both have risen marginally since the 2009 Census.
10 | The size and shape of the creative media industries
EMPLOYEES FREELANCE TOTAL WORKFORCE
Strategic Management 13,950 3,600 17,550
Creative Development 1,900 2,300 4,250
Production 14,800 10,100 24,900
Legal 1,400 250 1,650
Broadcast Management 3,150 700 3,850
Engineering and Transmission 3,500 200 3,700
Editorial, Journalism and Sport 9,150 2,800 11,900
Content Development 2,150 300 2,500
Art and Design 14,250 5,500 19,750
Animators 4,750 1,400 6,200
Costume/Wardrobe 200 400 650
Make-up and Hairdressing 300 700 1,050
Camera/Photography 1,800 3,550 5,350
Lighting 600 3,200 3,800
Audio/Sound/Music 2,000 2,050 4,050
Transport 550 450 950
Studio Operations 600 150 750
Technical Development 6,550 650 7,200
Editing 3,450 3,850 7,300
Laboratories/Processing 150 0 150
Manufacture 1,900 100 2,000
Servicing 1,400 50 1,450
Libraries and Archives 1,150 100 1,200
Distribution, Sales and Marketing 4,950 300 5,250
Business Management 26,600 2,000 28,600
Retail and Exhibition 17,750 0 17,750
TOTAL 145,550 46,650 192,200
St t i M t
Response per sub/sector Table 3
NB: Figures are rounded up or down to the nearest 50.
Strategic management, which is 17,550 - up from 12,000 in 2009 and retail and exhibition, which saw a slight increase from 17,700 in 2009 to 17,750, are the next biggest groups, both employing a combination of generic and industry-specifi c skills.

The size and shape of the creative media industries | 11
Lighting
Camera/Photography
Costume/Wardrobe
Creative Development
Editing
Audio/Sound/Music
Transport
Production
Art and Design
Animators
Strategic Management
Broadcast Management
Studio Operations
Content Development
Technical Development
Library and Archives
Business Management
Engineering and Transmission
Manufacture
Servicing
Laboratories/Processing
Retail and Exhibition
Distribution, Sales and Marketing
Legal
Editorial, Journalism and Sport
Make-Up and Hair Dressing
84707
666667
54545353
504444
41282
23232323
212118181818
1515131
997777
555555
331
24
10
GRAND TOTAL
Proportion of workforce who are freelance in each occupational group (%) Fig.1
The proportion of freelancers in each occupational group is reported in Figure 1. Overall, the proportion of freelancers has remained the same since 2009 at 24%. Freelancing is most prevalent in areas closely involved in the production process such as camera/photography (66%), lighting (84%), make-up and hairdressing (70%), costume/wardrobe (67%), content development (54%) and editing (53%). It is lowest in areas related to retail and exhibition, management, marketing, servicing and libraries and archives.

Terrestrial Broadcast
Cable and Satellite
Independent Production (TV)
Broadcast Radio
Post Production
Independent Production Radio
Studios & Equipment Hire
Special Physical Effects
Film Distribution
Cinema Exhibition
Animation
Commercials Production
Corporate Production
Interactive Media
Computer Games
Archives & Libraries
VFX
Manufacture of AV Equipment
Other Services for Film & TV
Community/Voluntary Radio
TOTAL
2012 2009 2006
26
17
2516
62
29
67
112
37
26
5744
57
54
1144
12
24
39
2845
377
404000042
141
10
38
3046
171
13
8
144
162
68
5441
912
0
7
32
1440
45
5353
272224
21
21
219
Overall representation of freelancers (24%)
2224
Figure 2 shows the variation in freelance usage by sector, and how this has changed since 2006. Freelancing is highest in sectors involved in production or content creation. In 2009 the number of freelancers was 45,700 compared to 46,650 in 2012. The fi gures should, however, be treated with caution as, although Census Day is chosen with care following industry consultation, it shows only the proportion of freelancers who are at work on the day. Thus, if the levels of production are relatively low, the freelancer proportion may look low, and possibly disguise the underlying situation.
12 | The size and shape of the creative media industries
NB: Film production is excluded as only employees in the sector were counted.
Proportion of the workforce who are freelance in each sector (%) Fig.2
Occupations (continued)

Work base: The location of the workforce
The size and shape of the creative media industries | 13
The geographical distribution of the workforce is illustrated in Figure 3a. London continues to be the work base for over four in ten of the workforce, followed by large concentrations of the industries in the South East, the South West and the nations. The workforce in the remaining English regions has mostly decreased since 2009. Figure 3b compares 2012 with 2009.
5 North West of England
2 East of England3 Yorkshire & the Humber
10 75
429
9South East of England
South West of England
West Midlands
East Midlands
1
4
4
North East of England
ScotlandWales
London
NorthernIreland
Work base of the
creative media industries(%)
Fig.3a
2012 2009
Sout
h E
ast
of E
ngla
nd
97 E
ast
of E
ngla
nd
24
Nor
th W
est
of E
ngla
nd
5
109
Sout
h W
est
of E
ngla
nd
57
Scot
land
4 5
Nor
ther
nIr
elan
d
4
Wes
t M
idla
nds
34
Eas
t M
idla
nds
34
Nor
th E
ast
of E
ngla
nd
1 2
York
shir
e &
the
Hum
ber
37
46Lond
on
42
Wal
es
5
10
Work base of the creative media industries (%) Fig.3b

Overall representationof women (36%)
Terrestrial Broadcast
Cable and Satellite
Independent Production (TV)
Broadcast Radio
Post Production
Independent Production Radio
Studios & Equipment Hire
Special Physical Effects
Film Production
Film Distribution
Animation
Commercials Production
Corporate Production
Interactive Media
Computer Games
Archives & Libraries
VFX
Manufacture of AV Equipment
Other Services for Film & TV
Community/Voluntary Radio
TOTAL 2012 2009 2006
50484
49
48447
30
32
48
447
21
31
47
4638
46
48
36333333
6638
12
28
28
28
2736
244
2733
47750
5141
46
46
292
2614
36
323
296
146
11
3816
34
19 28
4019
34
27
26
353
31
3815
3827
Cinema Exhibition4
4343345
The representation of women in each sub-sector and how this has changed since 2006 is shown in Figure 4. The number of women has increased from 53,750 in 2009 to 69,590 in 2012, representing 36% of the total workforce in 2012 compared to 27% in 2009. This is a return towards the 2006 level after an acute decline between 2006 and 2009 (the fi rst since the Census was fi rst introduced in 2000). This increase since 2009 occurred across most sub-sectors. The proportion of women employed is especially high in cinema exhibition, fi lm production and distribution, independent and broadcast radio production, independent TV production and terrestrial broadcasting.
14 | The size and shape of the creative media industries
Representation of women in each sector (%) Fig.4
Women in the creative media industries
Overall representation of women (36%)
Strategic Management
Creative Development
Production
Legal
Editorial, Journalism and Sport
Broadcast Management
Content Development
Art and Design
Make-Up and Hairdressing
Camera/Photography
Audio/Sound/Music
Technical Development
Editing
Laboratories/Processing
Manufacture
Servicing
Libraries and Archives
Distribution, Sales and Marketing
Business Management
Transport
Animators
Costume/Wardrobe
Engineering and Transmission
GRAND TOTAL 2012 2009
Lighting
Studio Operations
Distribution, Sales and Marketing
3322
4625
50
56
39
552
5136
39
33
2212
18114
7368
8152
1313112
510
131311
2618
92
18114
3825
30
137
4034
5545
52
3627
36
718
8
943
7777
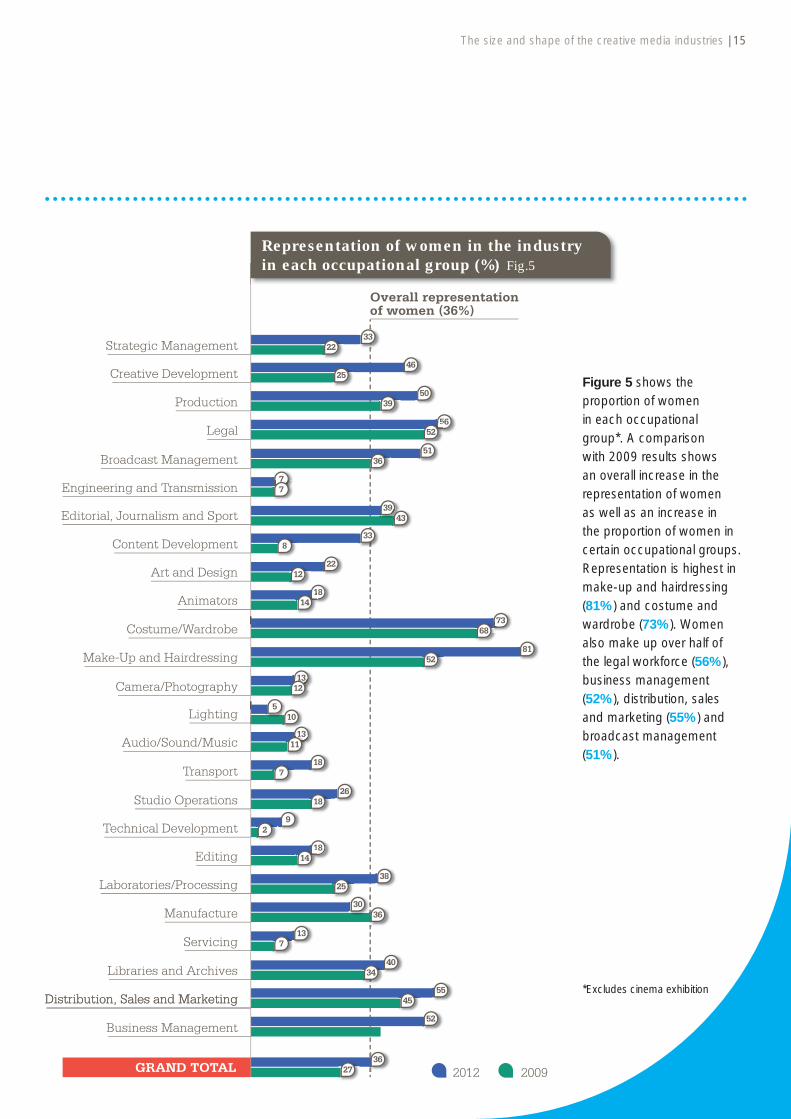
Figure 5 shows the proportion of women in each occupational group*. A comparison with 2009 results shows an overall increase in the representation of women as well as an increase in the proportion of women in certain occupational groups. Representation is highest in make-up and hairdressing (81%) and costume and wardrobe (73%). Women also make up over half of the legal workforce (56%), business management (52%), distribution, sales and marketing (55%) and broadcast management (51%).
The size and shape of the creative media industries | 15
Representation of women in the industry in each occupational group (%) Fig.5
*Excludes cinema exhibition

North West of England
East of England
Yorkshire & the Humber
North East of England
East Midlands
South West of England
South East of England
South London
North London
London Combined
West London
East London
Scotland
Wales
Central London
Northern Ireland
West Midlands
5043
3540
3521212222
24393940
1250
30414
37
34
740
The representation of women in the workforce across the nations and regions of the UK is shown in Figure 6. There is considerable variation, largely refl ecting the concentration of sectors in each area and their levels of employment of women. For example, London and the North West which accommodate substantial segments of the television and radio broadcasting sectors, contain the highest proportions of women. Representation of women is lowest in the South East and South West of England which contain high concentrations of interactive media and facilities companies as well as the West Midlands with its concentration of computer games companies.
16 | The size and shape of the creative media industries
Representation of women in the industry nationally and regionally (%) Fig.6
Women in the creative media industries (continued)
Black, Asian and Minority Ethnic groups (BAME) in the creative media industries.
The size and shape of the creative media industries | 17
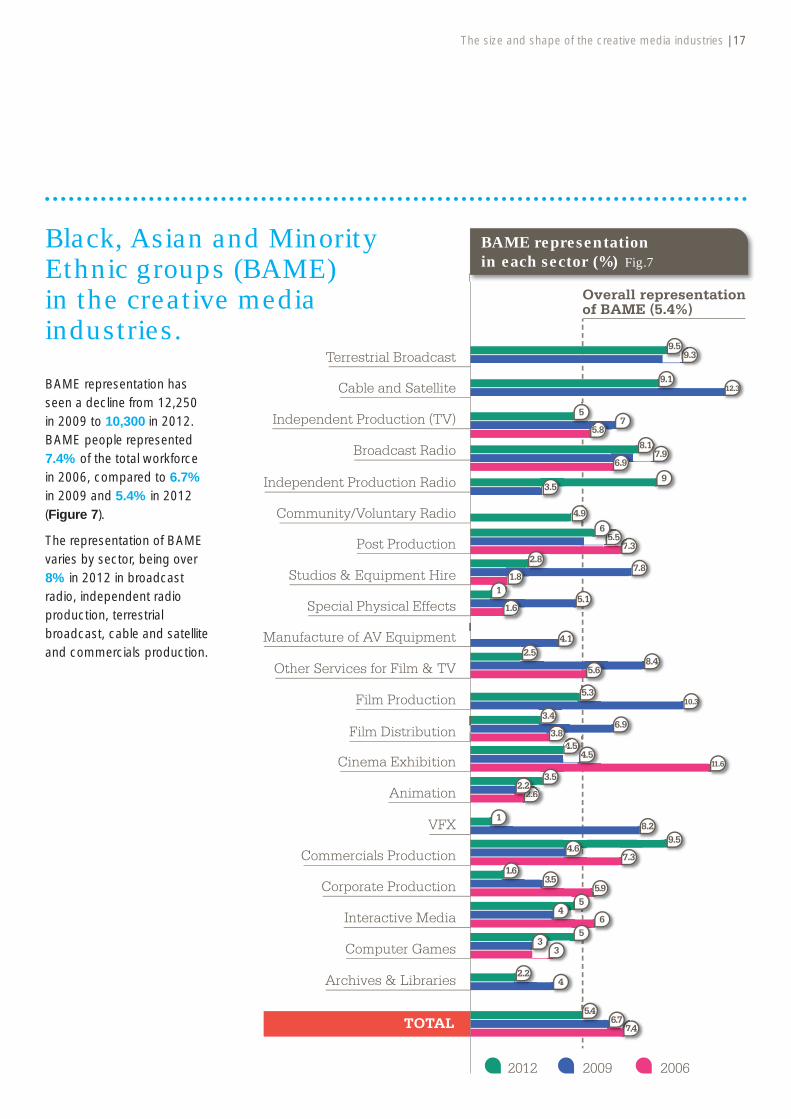
BAME representation has seen a decline from 12,250 in 2009 to 10,300 in 2012. BAME people represented 7.4% of the total workforce in 2006, compared to 6.7% in 2009 and 5.4% in 2012 (Figure 7).
The representation of BAME varies by sector, being over 8% in 2012 in broadcast radio, independent radio production, terrestrial broadcast, cable and satellite and commercials production.
Overall representation of BAME (5.4%)
Terrestrial Broadcast
Cable and Satellite
Independent Production (TV)
Broadcast Radio
Post Production
Independent Production Radio
Studios & Equipment Hire
Special Physical Effects
Film Production
Film Distribution
Animation
Commercials Production
Corporate Production
Interactive Media
Computer Games
Archives & Libraries
VFX
Manufacture of AV Equipment
Other Services for Film & TV
Community/Voluntary Radio
TOTAL
2012 2009 2006
9.3
5.3
5.68.4
2.54.1
1.6
11.8
2.87.8
7.3777775.5555555.5.55
6
4.9
3.59
6.9
8.1
5.87
999999.5
9.112.3
5
5.1
4.5443.8
3.4
10.3
6.9
5.9
1.6
5
65
3
42.2
8.2
2.622222.62.62.622.2
3.5
1
7.3
9.54.6
7.477776.7
Cinema Exhibition 11.6
5.4
3
4
3.5
4.5
17.9
BAME representation in each sector (%) Fig.7
18 | The size and shape of the creative media industries
Overall representation of BAME (5.4%)
Strategic Management
Creative Development
Production
Legal
Editorial, Journalism and Sport
Broadcast Management
Content Development
Art and Design
Make-Up and Hairdressing
Camera/Photography
Audio/Sound/Music
Technical Development
Editing
Laboratories/Processing
Manufacture
Servicing
Libraries and Archives
Distribution, Sales and Marketing
Business Management
Transport
Animators
Costume/Wardrobe
Engineering and Transmission
GRAND TOTAL 2012 2009
Lighting
Studio Operations
Distribution, Sales and Marketing
Retail and Exhibition
4.24.23.6
3.64.9
5.95.95.8
8.36.5
7.3
11
10
7.22.4
3.83.83.3
27
5.4
7.17.16.8
3.61.8
14
2
2.43.4
7
8.76.6
4.24.24.5
6.8
3.5
2.410.7
9.49.48.9
665.9
7.8
4.24.24.2
5.46.7
9.6
0
8.6
16
5.6
10.2
13.6
5.2
4
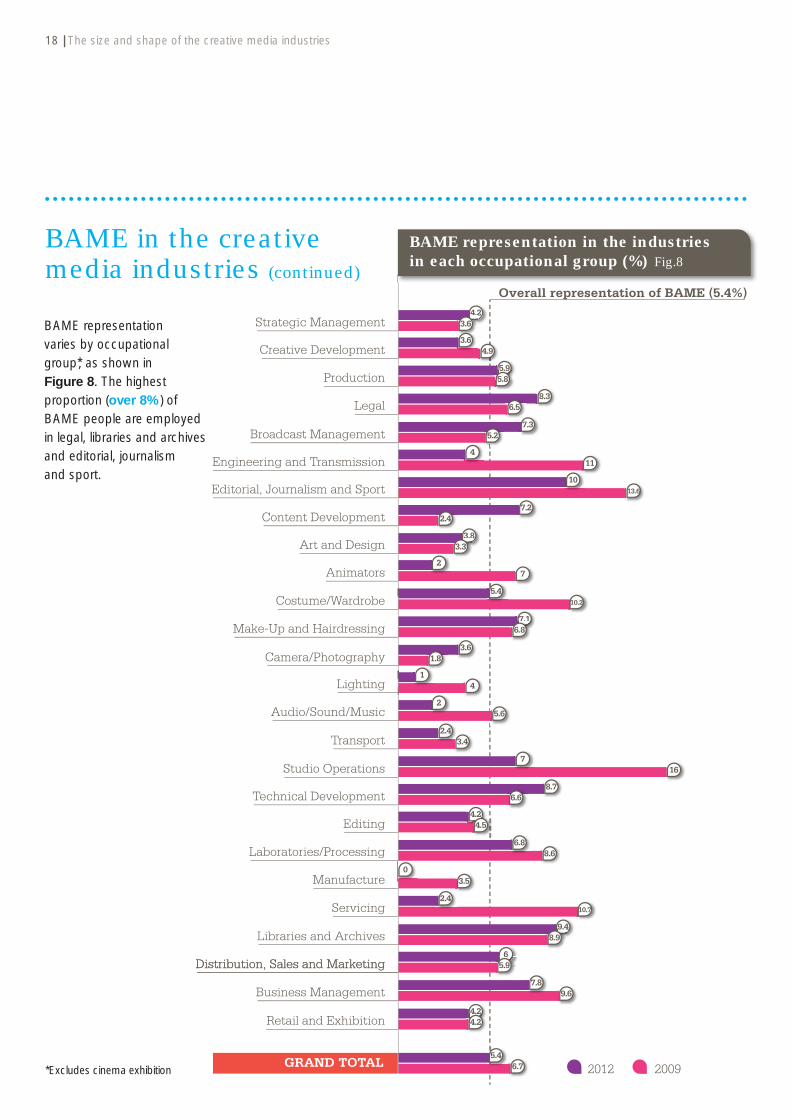
BAME representation varies by occupational group*, as shown in Figure 8. The highest proportion (over 8%) of BAME people are employed in legal, libraries and archives and editorial, journalism and sport.
BAME representation in the industries in each occupational group (%) Fig.8
BAME in the creative media industries (continued)
*Excludes cinema exhibition

The size and shape of the creative media industries | 19
North East of England
North West of England
Yorkshire & the Humber
East Midlands
West Midlands
London
South East of England
Scotland
Northern Ireland
South West of England
Wales
East of England
TOTAL
UK working population*
Creative Media Industries
5.1
5.1
1.2
3.8
8.68
8.34.2
6.1
28.8
3.5
8.9
8.13.7
3.62.1
2.10.7
2.53.3
2.91.8
9.15.4
5.51.7
Figure 9 shows the proportion of BAME people in each nation and region of the UK.* There is considerable variation, to some extent refl ecting the composition of the local labour market in each area as well as the sub-sectors and occupations represented. At 8.9%, London has the highest representation, however, given the high representation in the wider London economy (28.8%), it is in fact the least representative region. Scotland is the only nation or region in which representation of BAME people is higher in the creative media industries than the wider economy.
BAME representation by nation and region (%) Fig.9
*Source: Offi ce for National Statistics’ Labour Force Survey, Oct-Dec 2012
*Excludes cinema exhibition
Terrestrial Broadcast
Cable and Satellite
Independent Production (TV)
Broadcast Radio
Post Production
Independent Production Radio
Studios & Equipment Hire
Other Services for Film &TV
Film Production
Animation
Commercials Production
Corporate Production
Interactive Media
Computer Games
Archives & Libraries
VFX
Community/Voluntary Radio
TOTAL
2012 2009 2006
11
0.2
0.3
0.30 30 300
0.3
0.3
0.72.1
30.3
0.7
30.5
1.8
Cinema Exhibition
1
0.2
0.50000.2
0.2
550.7
0.9
1.5
1.6
1.6
5.1
1.1
0.7
0.7
3.63.9
0.6
0.9
1.9
2.43
1.7
1.72.6
3.5
0.5
0.5
0.4
1
000.1
0.6
Overall representation of disabled workforce (1%)
1.1
Disability in the creative media industries
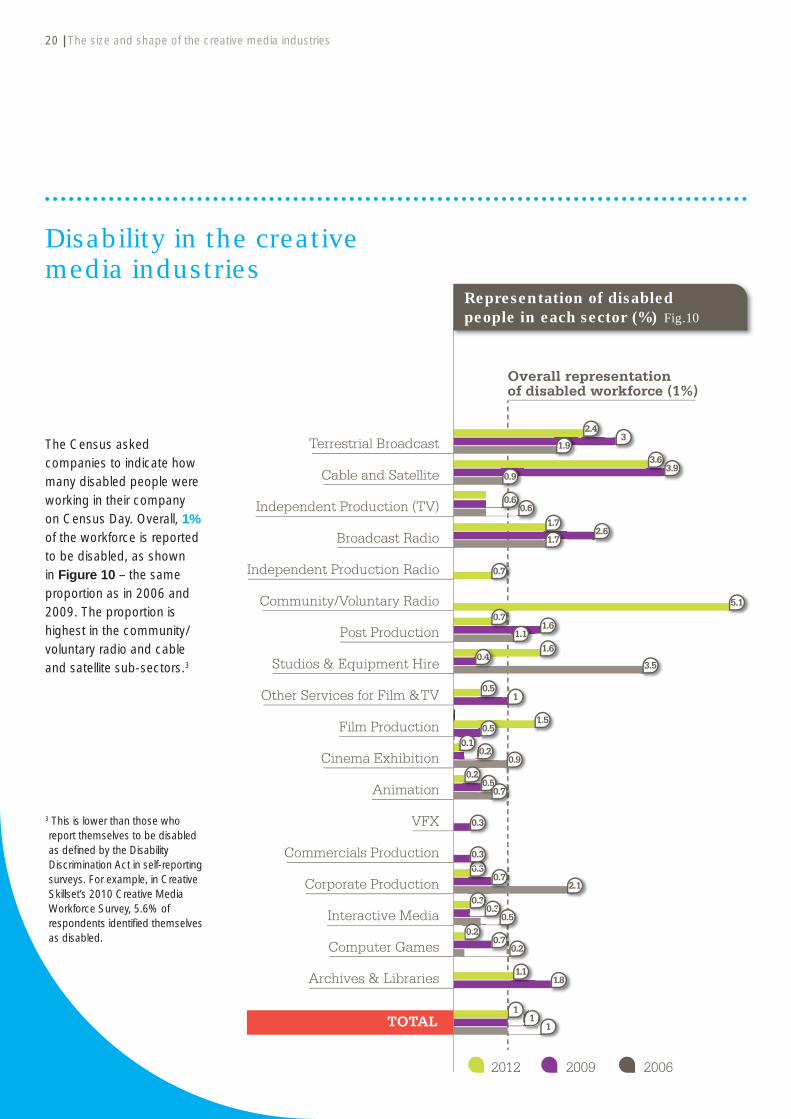
The Census asked companies to indicate how many disabled people were working in their company on Census Day. Overall, 1% of the workforce is reported to be disabled, as shown in Figure 10 – the same proportion as in 2006 and 2009. The proportion is highest in the community/voluntary radio and cable and satellite sub-sectors.3
20 | The size and shape of the creative media industries
Representation of disabled people in each sector (%) Fig.10
3 This is lower than those who report themselves to be disabled as defi ned by the Disability Discrimination Act in self-reporting surveys. For example, in Creative Skillset’s 2010 Creative Media Workforce Survey, 5.6% of respondents identifi ed themselves as disabled.

Figure 11 summarises the reported diversity of the workforce within the creative media industries since 2003.
The size and shape of the creative media industries | 21
2003 2004 2006 2009 2012
1% 1.3% 1% 1% 1%
7.4% 7% 7.4%6.7%
5.4%
38% 38% 38%
27%
36%
Women BAME Disabled
Diversity in the creative media industries Fig.11
We now turn from this overview of the workforce of the creative media industries to a more detailed account of each of the industries. In each case we cover, as far as the data will allow, the size of the workforce and recent trends in it; the extent and trends in freelancers; the location of the workforce and changes within it; the representation of women by occupation and geography; the representation of BAME groups by role and geography and similarly for people with a disability. Please note that where diversity measures and/or regions or nations are not included, it is due to no record or very low frequencies.
TelevisionWorkforce size
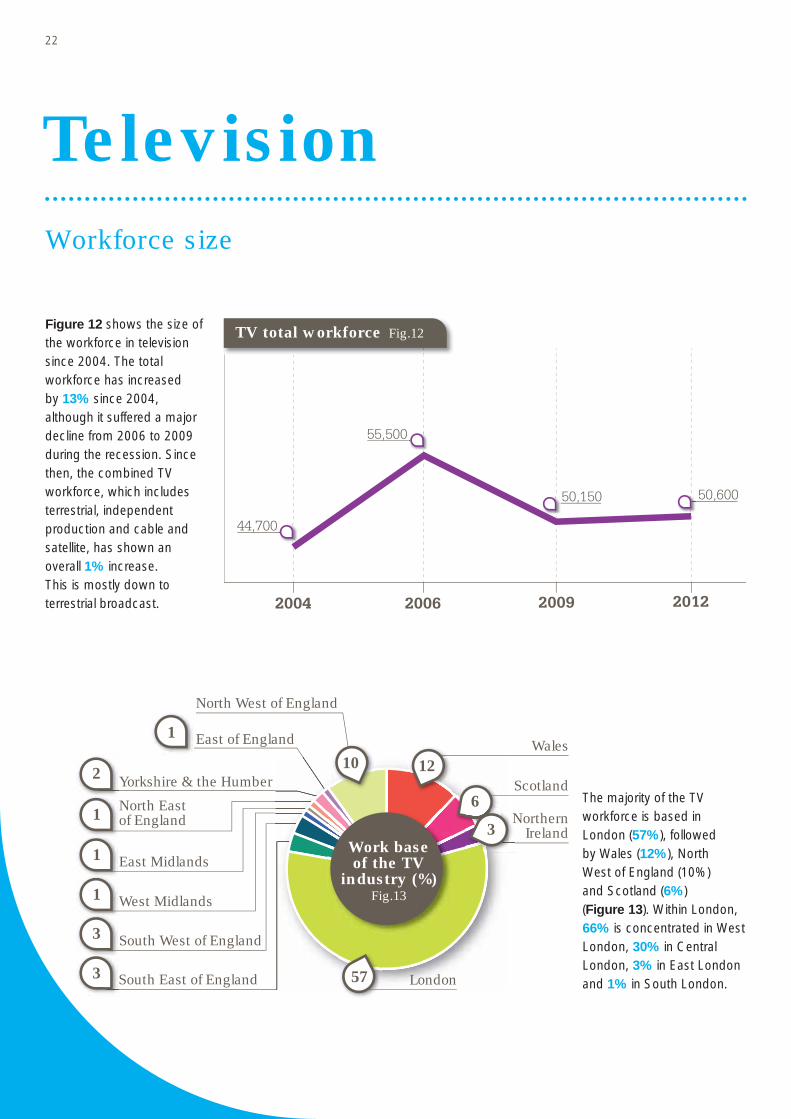
Figure 12 shows the size of the workforce in television since 2004. The total workforce has increased by 13% since 2004, although it suffered a major decline from 2006 to 2009 during the recession. Since then, the combined TV workforce, which includes terrestrial, independent production and cable and satellite, has shown an overall 1% increase. This is mostly down to terrestrial broadcast.
The majority of the TV workforce is based in London (57%), followed by Wales (12%), North West of England (10%) and Scotland (6%) (Figure 13). Within London, 66% is concentrated in West London, 30% in Central London, 3% in East London and 1% in South London.
1 East of England
3
3
South East of England
South West of England
1 West Midlands
1 East Midlands
1 North East of England
10 12
6
Wales
57
North West of England
2 Yorkshire & the Humber Scotland
London
NorthernIreland
N3
2004 2006 2009 2012
44,700
55,500
50,150 50,600
TV total workforce Fig.12
Work baseof the TV
industry (%) Fig.13
22

Freelance workforce
Occupational groups
Almost four in ten of those working in TV are freelancers, increasing from 28% in 2009. This compares to 24% in the creative media industries as a whole.
Occupational groups like legal, broadcast management, engineering and transmission, editorial journalism and sport, studio operations, technical development, libraries, distribution sales and marketing as well as business management do not rely greatly on freelancers. In contrast, costume/wardrobe (74%), lighting (73%), make-up and hairdressing (72%), camera/photography (71%), audio/sound/music (66%), creative development (66%), transport (62%), editing (56%) and production (56%) are freelance-orientated occupational groups in TV.
Figure 14 sets out the pattern of employment across the different occupational groups in television. The majority of the workforce works in production (26%), business management (12%), editorial, journalism and sport (12%), strategic management (7%), art and design (5%), editing (5%), camera/photography (5%), broadcast management (4%) and distribution sales and marketing (4%).
12 73
Strategic Management
26
25
12
Creative Development
LegalArt and Design
Lighting
Audio/ Sound/ Music
Camera/Photography
Editing
Distribution,Sales and Marketing
Business Management
Production
Broadcast Management
Engineering and Transmission
Editorial,Journalism and Sport
22222
2
5
2222223
5
4
4
2004 2006 2009 2012
TV Freelancers 14,800 19,000 13,900 20,000
% of Total Workforce 31% 34% 28% 39%
Major occupational
groups in TV(%)Fig.14
Freelance workforce Table 4
Television | 23

24 | Television
North West of England
East of England
Yorkshire & the Humber
North East of England
East Midlands
South West of England
South East of England
London
Scotland
Wales
Northern Ireland
West Midlands
333332
233
2332
41
5638
22
50
46
Proportion of TV freelancers per nation/region (%) Fig.15
Figure 15 shows that Scotland and the South East employ more freelancers than the overall average of 39% in TV. In contrast, regions like the East Midlands, the North East and West Midlands and Northern Ireland, employ fewer freelancers as part of their total workforce.
Freelance workforce (continued)
Diversity
Figure 16 shows the percentage of women, BAME and disabled workforce in television.
2004 2006 2009 2012
1.6% 1% 1.3% 2%
6.8%
9.9% 9%7.5%
45% 45% 41% 45%
Women
BAME
Disabled
Diversity in TV Fig.16
Television | 25
North West of England
East of England
Yorkshire & the Humber
North East of England
East Midlands
South West of England
South East of England
London
Scotland
Wales
Northern Ireland
West Midlands
54
41
5451
41399
43535
4824
4444444
474745
Geographical representation of women in TV (%) Fig.17
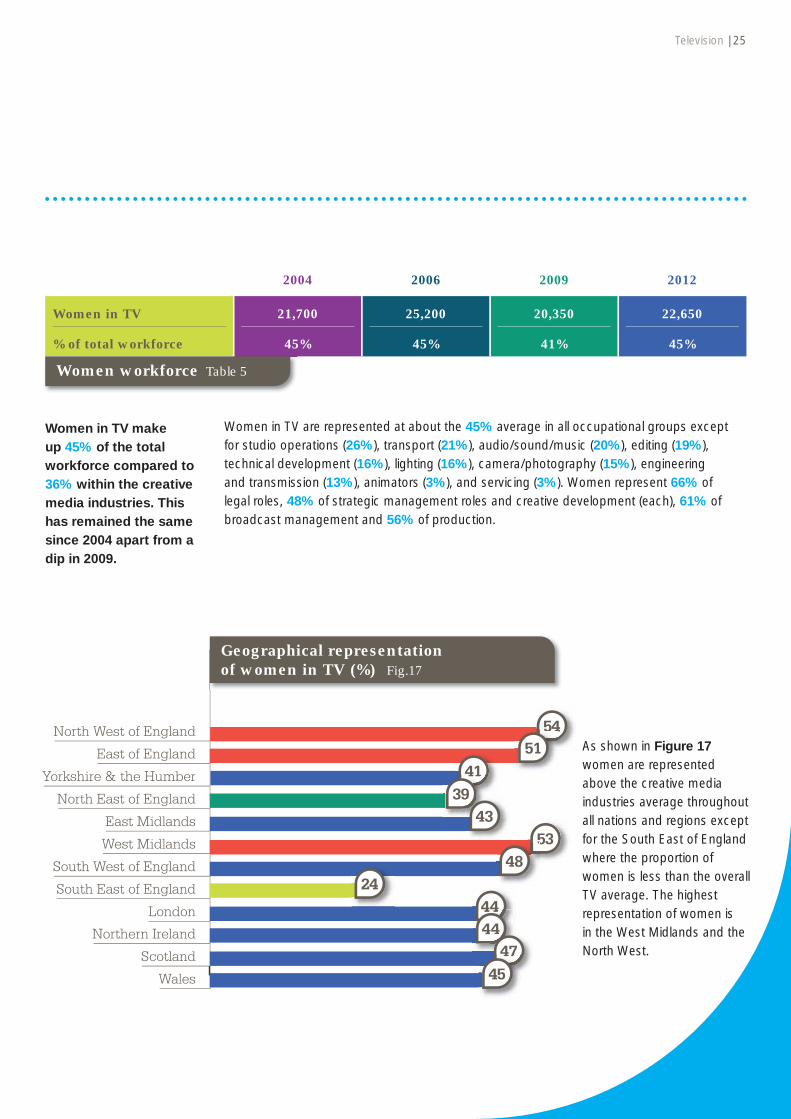
Women in TV make up 45% of the total workforce compared to 36% within the creative media industries. This has remained the same since 2004 apart from a dip in 2009.
As shown in Figure 17 women are represented above the creative media industries average throughout all nations and regions except for the South East of England where the proportion of women is less than the overall TV average. The highest representation of women is in the West Midlands and the North West.
Women in TV are represented at about the 45% average in all occupational groups except for studio operations (26%), transport (21%), audio/sound/music (20%), editing (19%), technical development (16%), lighting (16%), camera/photography (15%), engineering and transmission (13%), animators (3%), and servicing (3%). Women represent 66% of legal roles, 48% of strategic management roles and creative development (each), 61% of broadcast management and 56% of production.
2004 2006 2009 2012
Women in TV 21,700 25,200 20,350 22,650
% of total workforce 45% 45% 41% 45%
Women workforce Table 5

26 | Television
North West of England
East of England
Yorkshire & the Humber
North East of England
East Midlands
South West of England
South East of England
London
Scotland
Wales
Northern Ireland
West Midlands
4
47
42
3710
36
101122
1
BAME geographical representation in TV (%) Fig.18
Workforce from a Black, Asian or Ethnic Minority background represent 7.5% of the total workforce in television in 2012 compared to 5.4% across the creative media industries.
BAME workers are represented at a 7.5% average in all occupational groups except for strategic management (5%), make-up and hairdressing (5%), audio/sound/music (5%), editing (5%), creative development (4%), camera/photography (3%), servicing (3%), lighting (2%). BAME people represent 13% of business development, 12% of legal, 12% of libraries, 11% of distribution, sales and marketing, 10% of engineering and transmission and 10% of editorial, journalism and sport.
2004 2006 2009 2012
BAME in TV 3,300 5,500 4,500 3,800
% of total workforce 6.8% 9.9% 9% 7.5%
BAME workforce Table 6
Diversity (continued)
BAME representation is fairly evenly spread throughout all regions except for Wales, Northern Ireland and Scotland on the low end. A much higher than average representation of BAME people exists in the East Midlands and London (Figure 18).

Television | 27
Two percent of the workforce in television was identifi ed as disabled. This is the highest since 2004 and compares to 1% for the creative media industries as a whole.
Representation of the disabled workforce in TV is around the 2% average in almost all occupational groups except for make-up and hairdressing (12%), libraries and archives (6%) and engineering and transmission (4%).
Geographically, the disabled workforce ranges from 1% to 2% throughout all nations and regions.
2004 2006 2009 2012
Disability 800 600 650 1,000
% of total workforce 1.6% 1% 1.3% 2%
Disability workforce Table 7

FilmWorkforce size
The breakdown per sub-sector is shown in the table below.
1 North East of England
South East of England
1 East Midlands
13
6 69
4 Yorkshire & the Humber
2 North West of England
4 Wales
London
Scotland
Work base of fi lm
production(%)
Fig.19
28
While the Census covers permanent roles employed within fi lm production companies, freelance crew are covered within a separate cycle of research. The nature of fi lm production4 means that the snapshot methodology of recording employment on one day does not provide a truly
reliable estimate of the total workforce involved in fi lmmaking as production levels fl uctuate over time. The Census methodology is less problematic for other fi lm sectors such as fi lm distribution and cinema exhibition which are less freelance dominated and more stable in employment terms.
2004 2006 2009 2012
Film production – – 1,300 1,150
Cinema exhibition 16,500 16,600 17,700 17,700
Film distribution 500 1,300 1,200 1,200
TOTAL 17,000 17,900 20,200 20,000
Breakdown of the workforce Table 8 NB: Totals may vary due to rounding to the nearest 50.
4 Film production does not include fi lm production freelancers which accounted for 89% of employment in the sector in 2010.
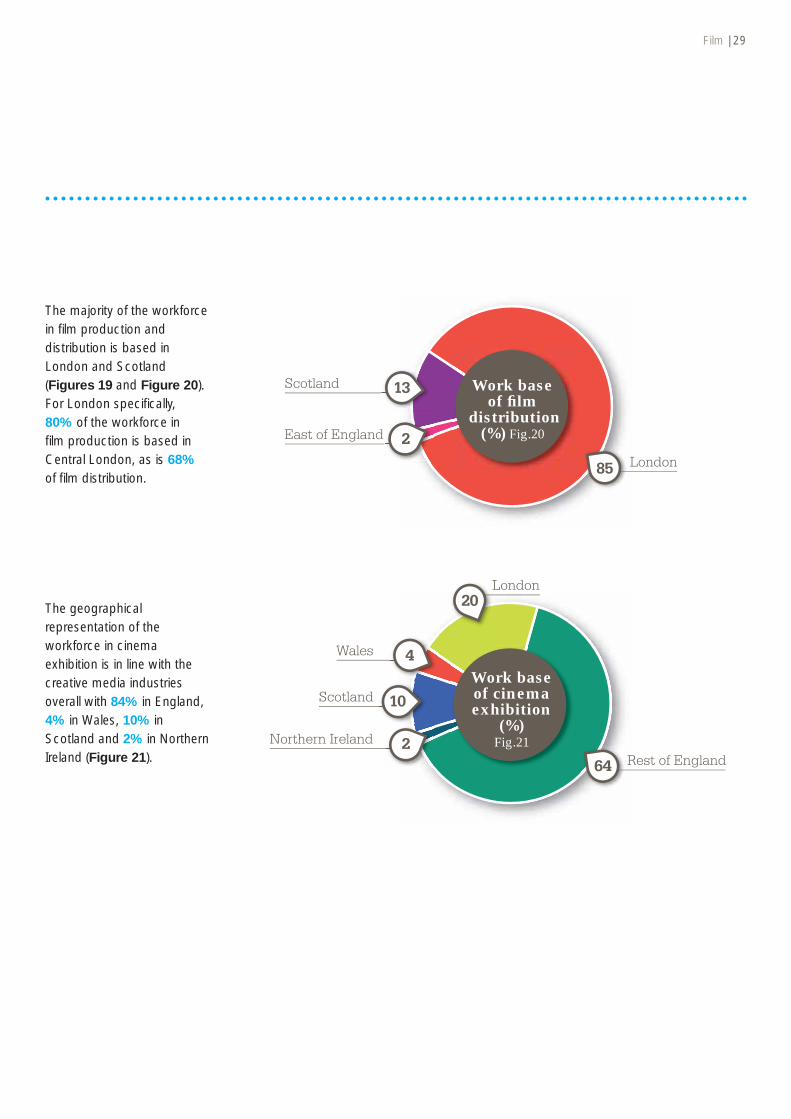
The geographical representation of the workforce in cinema exhibition is in line with the creative media industries overall with 84% in England, 4% in Wales, 10% in Scotland and 2% in Northern Ireland (Figure 21).
The majority of the workforce in fi lm production and distribution is based in London and Scotland (Figures 19 and Figure 20). For London specifi cally, 80% of the workforce in fi lm production is based in Central London, as is 68% of fi lm distribution.
East of England
Scotland 13
85 London
2
Work base of fi lm
distribution (%) Fig.20
Northern Ireland
Scotland
Wales
10
4
20
64 Rest of England
London
2
Work base of cinema exhibition
(%)Fig.21
Film | 29

Occupational groups
The major occupational roles in cinema exhibition is box offi ce (87%), head offi ce/management (8%), premises operation (2%), projection/technical (3%) (Figure 24).
Figures 22 and 23 demonstrate the different occupational groups in fi lm production and distribution. Strategic management, distribution, sales and marketing, business management, creative development and production are the major occupational roles in these sub-sectors. Please note that freelancers are not included in fi lm production.
Premises Operation
Projection/Technical
Head office/Management Pre
Proj
g
Kiosk/Box Office
28
3
87
Major occupational
groups in cinema
exhibition (%) Fig.24
Art and Design
Creative Development
Strategic Management
CCreative DCC
Legal
Business Management
Production
38
1415
4
6
23
Major occupational
groups in fi lm production
(%)Fig.22
Creative Development 2
Production 3
Technical Development 2
Servicing 2
Strategic ManagementStrategBusiness Management
Distribution, Sales and Marketing
17
47
22
Major occupational
groups in fi lm distribution
(%)Fig.23
30 | Film
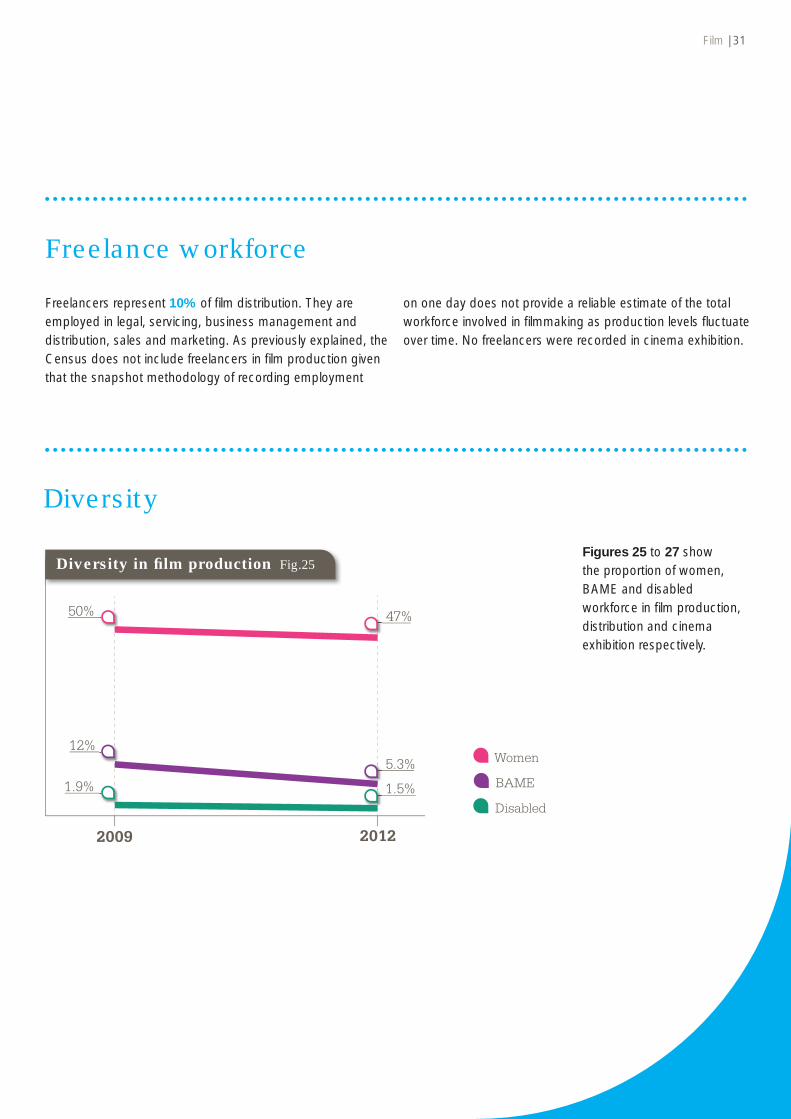
Freelancers represent 10% of fi lm distribution. They are employed in legal, servicing, business management and distribution, sales and marketing. As previously explained, the Census does not include freelancers in fi lm production given that the snapshot methodology of recording employment
Film | 31
Freelance workforce
on one day does not provide a reliable estimate of the total workforce involved in fi lmmaking as production levels fl uctuate over time. No freelancers were recorded in cinema exhibition.
Figures 25 to 27 show the proportion of women, BAME and disabled workforce in fi lm production, distribution and cinema exhibition respectively.
Diversity
2009 2012
1.9% 1.5%
12%5.3%
50% 47%
Women
BAME
Disabled
Diversity in fi lm production Fig.25

32 | Film
2004 2006 2009 2012
0.3% 0.6% 0.3% 0.1%
9%11%
4.5% 4.5%
44% 45% 42% 46%
Diversity in cinema exhibition Fig.27
2004 2006 2009 2012
5% 7.7% 8.3%
3.4%
40% 39% 42%
51%
Diversity in fi lm distribution Fig.26
Diversity (continued)
Women
BAME
Disabled
Women
BAME

Film | 33
Overall, women in fi lm make up 46% of the total workforce compared to 36% of the creative media industries.
Women in fi lm production represented 64% of business management workforce, 47% of production, 46% of creative development, 41% of strategic management and 27% of art and design. Women in distribution are represented in business management (69%), distribution sales and management (56%), legal (33%) and strategic management (20%). Women in cinema exhibition are under the industry average in projection/technical (12%), IT (17%), CEO (4%), and head offi ce/management and premises operation (35% each) roles. Their representation in box offi ce (48%), fi nance and accounts (46%), health and safety (50%) and corporate PR and marketing (53%) is around the sub-sector average of 46%. They have a higher representation in cleaning (63%), HR (73%) and administration (80%).
The nations/regions with the highest representation of women in fi lm production are London (49%) and Scotland (34%). In terms of fi lm distribution, the areas with the highest representation are London (56%) and Scotland (25%).
Employees and freelancers from a Black, Asian or Ethnic Minority background represent 4.4% of the total workforce in 2012 compared to 5.4% of the creative media industries.
BAME workers in fi lm production represent 11% of the business management workforce and 10% of the legal workforce. Strategic management, creative development and production are all 3%. BAME people in fi lm distribution represent 8% of business management and 4% of distribution, sales and marketing. In cinema exhibition
they represent 17% of IT, 7% of cleaning, 6% of fi nance and accounts, 5% of box offi ce and admin (each), 3% of premises operation, corporate PR and marketing and CEO (each) and 2% of projection/technical and head offi ce management (each).
Geographically, BAME workers in fi lm production are represented at 6% in London, while for fi lm distribution representation in London is 4%.
Less than one per cent (0.3%) of the workforce in fi lm was identifi ed as disabled, compared to 1% of the creative media industries as a whole. In fi lm production, this was higher (2%). Only 0.1% of the workforce in cinema exhibition is disabled. There were no reported disabled people in fi lm distribution.
The disabled workforce in fi lm production is within strategic management and production (3% each). For cinema exhibition, 2% work within cleaning and 1% within corporate PR and marketing.

34
Interactive mediaWorkforce size
Figure 28 shows the size of the workforce in interactive media since 2004. The total workforce has increased by 25% since 2009 although there has been a slight decrease of 2% since 2004. The increase seems to refl ect the decrease in radio and the fact that since 2009 the radio sector may be turning digital.
2004 2006 2009 2012
43,700
38,700
34,250
43,050
Interactive media total workforce Fig.28
The majority of the workforce is based in London (23%), followed by the South West (18%), South East (16%), Wales (10%) and Scotland (9%) (Figure 29). For London specifi cally, 57% is based in Central London, 21% in East London, 19% in West London and 3% in North London.
5 West Midlands
3 East Midlands
1 North East of England
5 Yorkshire & the Humber
1 East of England
3 North West of England
9
10
6
23
Wales
18
London
Scotland
South West of England
South East of England
NorthernIreland
So16
Work base of the interactive
media industry (%)
Fig.29

Interactive Media | 35
Occupational groups
Figure 30 demonstrates the different occupational groups within interactive media. Business management and art and design comprise 25% each of the workforce, followed by technical development (13%), strategic management (17%) and production (9%).
Animators
Camera/Photography
Audio/ Sound/ Music
17
2
Strategic Management
9
4
Creative Development
Content DevelopmentTechnical Development
Business Management
Production
Art and Design
13
25
252
22
1
Major occupational
roles in interactive media (%)
Fig.30
Freelance workforce
The proportion of freelancers is at its lowest since 2004. It is 13% of the total workforce compared to 24% of the creative media industries overall.
Production (3%), content development (5%), and business management (3%) are not shown to rely greatly on freelancers. In contrast, creative development (39%), animators (33%) and camera/photography (71%) are freelance-orientated occupational groups. Strategic management, art and design and technical development are around the overall sector average.
2004 2006 2009 2012
Interactive media freelancers
7,400 6,700 7,250 5,550
% of total workforce 17% 17% 21% 13%
Freelance workforce Table 9

North West of EnglandEast of England
Yorkshire & the HumberNorth East of England
East MidlandsWest Midlands
South West of EnglandSouth East of England
London CombinedWest LondonEast London
Central LondonNorthern Ireland
ScotlandWales
1633
557
1313112
2216
6
42
51
3
154
381
2004 2006 2009 2012
1.3% 1% 0.2% 0.3%
8% 6.4%
4%5.1%
31% 32% 29%
6%
Women
BAME
Disabled
Freelance workforce (continued)
Diversity
The North West and East of England employ more freelancers than the overall average of 13%. In contrast, regions like the North East and Central London employ fewer freelancers as part of the total workforce per region/nation (Figure 31).
36 | Interactive Media
Freelancer geographical distribution (%) Fig.31
Figure 32 shows the proportion of women, BAME and disabled workforce in interactive media.
Diversity in interactive media Fig.32

North West of England
East of England
Yorkshire & the Humber
North East of England
East Midlands
South West of England
South East of England
London
Scotland
Wales
Northern Ireland
West Midlands
46
3023
034
571919
1427
3929
3822
Geographical representation of women in interactive media (%) Fig.33
Women in interactive media represent 29% of the total workforce compared to 36% of the creative media industries.
Workforce from a Black, Asian or Ethnic Minority background represented 5.1% of the total workforce in 2012 compared to 5.4% of the creative media industries.
They are greatly under-represented in camera/photography (6%) and technical development (9%). For strategic management (23%), content development (33%), art and design (23%) and animators (27%) female representation is around the sector average. Women are above the sector average in the occupational groups of creative development (61%), production (46%), editorial, journalism and sport (50%) and business management (45%).
Women are represented at around the sector average across most nations and regions, except in the South West and West Midlands where the proportion of women is lower, and North West and East Midlands where it is higher (Figure 33).
2004 2006 2009 2012
Women in interactive media
13,700 12,500 1,900 12,600
% of total workforce 31% 32% 5.5% 29%
2004 2006 2009 2012
BAME in interactive media
3,500 2,500 1,400 2,200
% of total workforce 8% 6.4% 4% 5.1%
Woman workforce Table 10
BAME workforce Table 11
Interactive Media | 37

North West of England
Yorkshire & the Humber
East Midlands
South West of England
South East of England
Scotland
Wales
London
West Midlands
3.5
0.1
4.14
2.82.8
3.0
7.1
11.5
4.5
0.1
Diversity (continued)
BAME workers are represented between 4% and 9% in strategic management, production, content development and business management. BAME representation is lower than the industry average in art and design (2%) and above average in animators (10%), camera/photography (12%) and technical development (11%).
BAME representation is similar to the creative media industries’ average throughout all regions except for Yorkshire & the Humber and Wales. A higher than average representation is seen in the South East of England as well as London (Figure 34).
38 | Interactive Media
BAME representation in interactive media (%) Fig.34
Less than one per cent of the interactive media workforce was identifi ed as disabled compared to 1% of the creative media industries.
The representation of disabled workforce in interactive media is 1% each for production, content development, art and design and business management.
Of the workforce in Wales 1% identifi ed themselves as disabled, 3% in West London and 1% in the North West of England.
2004 2006 2009 2012
Disability 600 200 100 150
% of total workforce 1.3% 0.5% 0.2% 0.3%
Disabled workforce Table 12

Radio
39
Workforce size
Figure 35 shows the size of the workforce in radio since 2004. The total workforce has decreased by 23% since 2004 although most of this decrease has occurred since 2009. In 2012, there was an increased response from community/voluntary radio which had not been captured in previous years.
2004 2006 2009 2012
22,20022,400
20,900
17,150
Radio total workforce Fig.35
The majority of the workforce is based in London (45%), followed by Northern Ireland (11%), Scotland (8%) and the North West of England (7%) (Figure 36). In London, 77% is concentrated in Central London, 12% in East and 11% in West London.
North West of England
West Midlands
East Midlands
North East of England
Yorkshire & the Humber
East of England
6
11
45
Scotland
Wales
London
South West of England
South East of England
NorthernIreland
322222224
6622222
555551 7
8
Work base of the radio
industry (%)
Fig.36

40 | Radio
Freelance workforce
Occupational groups
The total number of freelancers is at its lowest since 2004 at 17% of the total workforce compared to 24% of the creative media industries.
Occupational groups like engineering and transmission, distribution sales and marketing as well as business management do not rely greatly on freelancers. In contrast, legal (37%), editing (46%), libraries and archives (37%) and creative development (30%) are freelance-orientated occupational groups in radio.
Figure 37 demonstrates the different occupational groups in radio. Most fall under editorial, journalism and sport (33%), business management (18%), production (16%) and distribution, sales and marketing (12%).
Editorial,Journalism and Sport
Distribution,Sales and Marketing
Audio/ Sound/ Music
m and Sport
25
16
Strategic Management
8
5
Creative Development
Broadcast Management
Business Management
Production
Engineering and Transmission
12
1
18
33
2004 2006 2009 2012
Radio freelancers 5,200 5,700 4,900 2,950
% of total workforce 23% 25% 23% 17%
Major occupational
groups in radio (%)
Fig.37
Freelance workforce Table 13

Radio | 41
Figure 38 shows that West and East London employ more freelancers than the overall average of 17% in radio. In contrast, regions like the North East and Central London employ fewer freelancers as part of the total workforce.
North West of England
East of England
Yorkshire & the Humber
North East of England
East Midlands
South West of England
South East of England
South London
London Combined
West London
East London
Scotland
Wales
Central London
Northern Ireland
West Midlands
715
30
17721
133161616
5614
535
25
2213
4
Proportion of radio freelancers per region/nation (%) Fig.38
2004 2006 2009 2012
1.3% 1.8% 2.9% 2.3%
7.2% 6.6% 7.2% 7.5%
49% 49% 44% 45%
BAME
Disabled
Women
Diversity
Figure 39 shows the proportion of women, BAME and disabled workforce in radio.
Diversity in radio Fig.39

Women are represented evenly throughout all nations and regions except for Northern Ireland where the proportion of women is lower than the overall radio average and Scotland where there is a higher than average representation of women (Figure 40).
North West of England
East of England
Yorkshire & the Humber
North East of England
East Midlands
South West of England
South East of England
London
Scotland
Wales
Northern Ireland
West Midlands
48443
5239
50504949
464645
3456
4342
44
Geographical representation of women in radio (%) Fig.40
Diversity (continued)
Women in radio represent 45% of the total workforce compared to 36% of the creative media industries.
People from a BAME background represented 7.5% of the total workforce in radio in 2012 compared to 5.4% of the creative media industries.
Women are represented at about the 45% average in all occupational groups except for creative development (30%), strategic management (25%), audio/music/sound (22%), engineering and transmission (12%) and art and design (3%). Women represent 82% of legal roles, 65% of business management and 61% of distribution, sales and marketing.
BAME workers are represented at the 7.5% average in all occupational groups except for distribution, sales and marketing (4%), strategic management (5%), production (5%), legal (5%) and engineering and transmission (5%). At the higher end, BAME people represent 23% of studio operations, 23% of editing and 18% of creative development.
2004 2006 2009 2012
Women in radio 10,800 10,900 9,250 7,650
% of total workforce 49% 49% 44% 45%
2004 2006 2009 2012
BAME in radio 1,600 1,500 1,500 1,300
% of total workforce 7.2% 6.6% 7.2% 7.5%
Women workforce Table 14
BAME workforce Table 15
42 | Radio
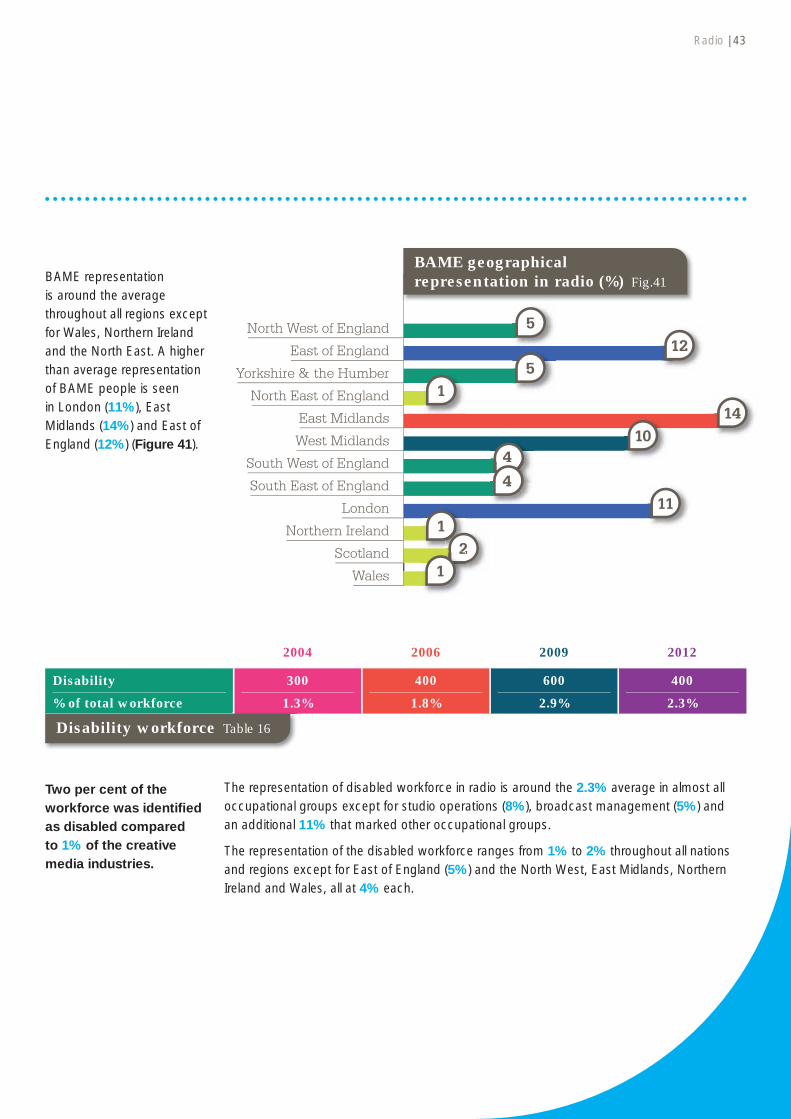
BAME representation is around the average throughout all regions except for Wales, Northern Ireland and the North East. A higher than average representation of BAME people is seen in London (11%), East Midlands (14%) and East of England (12%) (Figure 41).
North West of England
East of England
Yorkshire & the Humber
North East of England
East Midlands
South West of England
South East of England
London
Scotland
Wales
Northern Ireland
West Midlands
512
1410
44
411
12
5
21
1
BAME geographical representation in radio (%) Fig.41
Two per cent of the workforce was identifi ed as disabled compared to 1% of the creative media industries.
The representation of disabled workforce in radio is around the 2.3% average in almost all occupational groups except for studio operations (8%), broadcast management (5%) and an additional 11% that marked other occupational groups.
The representation of the disabled workforce ranges from 1% to 2% throughout all nations and regions except for East of England (5%) and the North West, East Midlands, Northern Ireland and Wales, all at 4% each.
2004 2006 2009 2012
Disability 300 400 600 400
% of total workforce 1.3% 1.8% 2.9% 2.3%
Disability workforce Table 16
Radio | 43

2004 2006 2009 2012
12,000
39,200
36,15036,950
FacilitiesWorkforce size
44
Figure 42 shows the size of the workforce in facilities since 2004. The total workforce has more than tripled since 2004 with a sudden boost in 2006. Since then, there have been fl uctuations with some sub-sectors merged or deleted and others added to more accurately represent the sector. These sub-sectors have largely remained the same since 2009. The 2% growth is due to increases in the workforce in post production and special physical effects.
Facilities total workforce Fig.42
The majority of the workforce is concentrated in London (34%), although the South East, South West and Wales accommodate another fairly large proportion of the facilities workforce (Figure 43).
For London specifi cally, 39% is based in Central London, 33% in West London, 17% in South London, 8% in East London and 3% in North London.
South East of England
West Midlands
North West of England
East Midlands
Yorkshire & the Humber
East of England
34
Scotland
Wales
London
South West of England
NorthernIreland
211
6
4
17
11
17
1 6
Work base of the facilities industry (%) Fig.43

The total number of freelancers is 30% compared to 24% of the creative media industries.
Occupational groups like strategic management, engineering and transmission, labs/processing, manufacture, servicing, libraries and archives, distribution sales and marketing and business management are mostly staffed by permanent employees. In contrast, lighting (94%), editorial, journalism and sport (82%), creative development (78%), editing (51%), production (43%) and art and design (43%) are freelance dominated groups in facilities.
2004 2006 2009 2012
Freelancers in facilities 3,000 13,900 12,500 10,950
% of total workforce 25% 35% 34% 30%
Freelance workforce Table 17
Facilities | 45
Occupational groups
Freelancers
Figure 44 shows the major occupational groups that comprise facilities. These are business management (16%), editing (11%), strategic management (9%), art and design (9%), lighting (7%) and production, audio/sound/music, manufacture and engineering and transmission all at 5% each.
95
5
9
2
Strategic Management
Production
Art and Design
Animators
Lighting
Audio/ Sound/ Music
Transport
Camera/Photography
Editing
Manufacture
Servicing
Other
Business Management
Engineeringand Transmission
2
LL
3
52115
4
16
17
7
Major occupational
groups in facilities (%) Fig.44

Diversity
46 | Facilities
North West of England
East of England
Yorkshire & the Humber
North East of England
East Midlands
South West of England
South East of England
London
Scotland
Wales
Northern Ireland
West Midlands
772
200
31366
4030
5734
214
3437
Representation of freelancers in facilities by nation/region (%) Fig.45
Figure 46 shows the proportion of women, BAME and disabled workforce in the facilities industry.
East of England and East Midlands employ the smallest proportion of freelancers of their total workforce, while at the other end of the scale, Northern Ireland tends to employ more freelancers than the sector average (Figure 45). In West London 62% are freelancers, 32% in North London, 24% in South London, 15% in East London and 7% in Central London.
2004 2006 2009 2012
22%
4.1%
1%
34%
27%
5.3% 7.3%
1.3% 0.5%
29%
3.1%
0.4%BAME
Disabled
Women
Diversity in facilities Fig.46
Freelance workforce (continued)
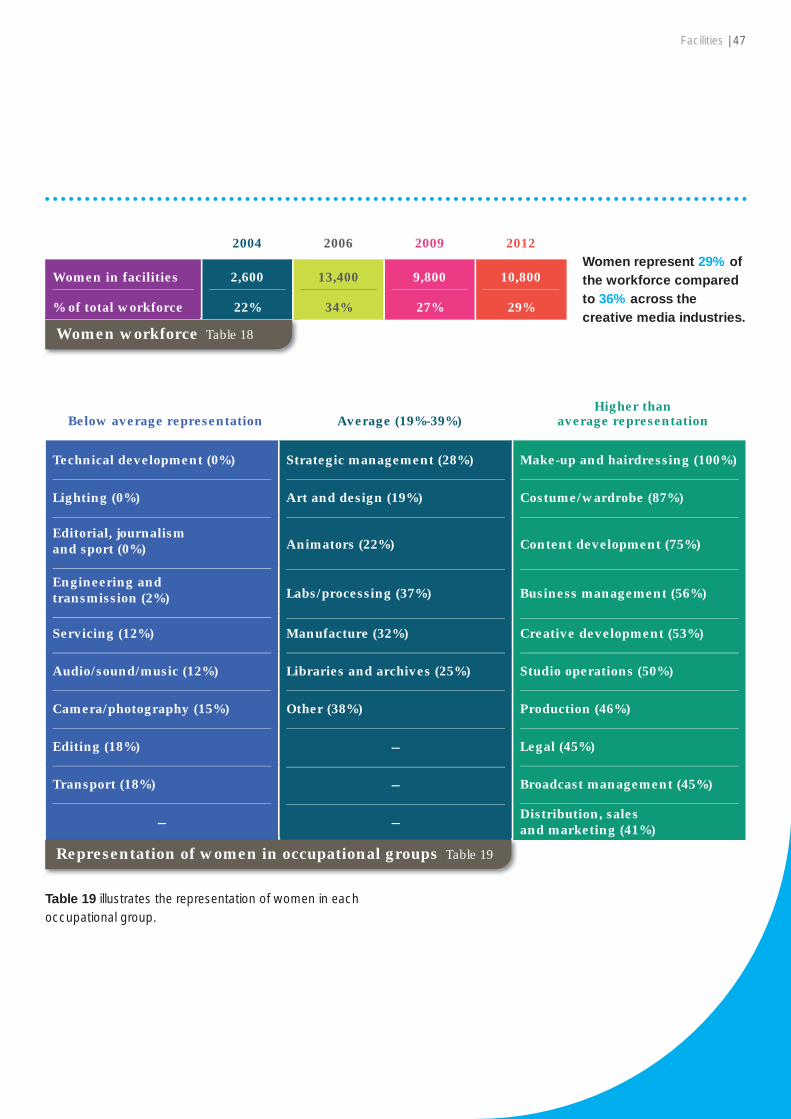
Women represent 29% of the workforce compared to 36% across the creative media industries.
Table 19 illustrates the representation of women in each occupational group.
2004 2006 2009 2012
Women in facilities 2,600 13,400 9,800 10,800
% of total workforce 22% 34% 27% 29%
Women workforce Table 18
Facilities | 47
Below average representation Average (19%-39%)Higher than
average representation
Technical development (0%) Strategic management (28%) Make-up and hairdressing (100%)
Lighting (0%) Art and design (19%) Costume/wardrobe (87%)
Editorial, journalism and sport (0%) Animators (22%) Content development (75%)
Engineering and transmission (2%) Labs/processing (37%) Business management (56%)
Servicing (12%) Manufacture (32%) Creative development (53%)
Audio/sound/music (12%) Libraries and archives (25%) Studio operations (50%)
Camera/photography (15%) Other (38%) Production (46%)
Editing (18%) – Legal (45%)
Transport (18%) – Broadcast management (45%)
– – Distribution, sales and marketing (41%)
Representation of women in occupational groups Table 19

48 | Facilities
North West of England
East of England
Yorkshire & the Humber
North East of England
East Midlands
South West of England
South East of England
London
Scotland
Wales
Northern Ireland
West Midlands
3653
40272728
212119
2852
40
19
31
Geographical representation of women in facilities (%) Fig.47
Figure 47 shows the representation of women geographically within facilities.
Diversity (continued)
Employees and freelancers from a BAME background represent 3.1% of the total workforce compared to 5.4% of the creative media industries. This is the lowest it has ever reached since 2004.
The only sub-sectors in which BAME workers are represented at 3% or more are make-up and hairdressing (19%), production (11%), business management (8%), labs/processing (7%), strategic management (3%), art and design (3%) and editing (3%).
2004 2006 2009 2012
BAME in facilities 500 2,100 2,650 1,150
% of total workforce 4.1% 5.3% 7.3% 3.1%
BAME workforce Table 20

East of England
London
Scotland
Northern Ireland
West Midlands
332
79
5
BAME geographical representation in facilities (%) Fig.48
Figure 48 illustrates the nations/regions where there are records of BAME representation. London and Northern Ireland demonstrate higher than the sector average representation.
Facilities | 49
The proportion of the workforce in facilities that was identifi ed as disabled has dropped to 0.4%. This is the lowest ever and less than the 1% average across the creative media industries.
Occupational groups that have disabled workers are animators (1%), audio/sound/music (1%), editing (1%), labs/processing (3%), and business management (1%).
The representation of the disabled workforce is 1% each in East London and the South East of England. For the majority of the remaining regions and nations the proportion matches the very low sector average.
2004 2006 2009 2012
Disability 100 500 200 150
% of total workforce 1% 1.3% 0.5% 0.4%
Disability workforce Table 21

2004 2006 2009 2012
3,000
4,700
4,3004,600
AnimationWorkforce size
50
Figure 49 shows the size of the workforce in animation since 2004. It has increased by 53% since 2004, although it suffered a 9% dip in 2009. Since then, the workforce has increased by 7%.
Total workforce in animation Fig.49
More than half of the animation workforce is based in London, and specifi cally Central London (96%). The South West of England has the second highest concentration of animation professionals, while Wales has the third (Figure 50).
South East of England
East Midlands
Yorkshire & the Humber
lands
56
ScotlandWales
London
South West of England Northern
Ireland35
1142
18
1
Work base of the animation industry (%) Fig.50

The proportion of freelancers is at its lowest since 2004. About one in three of the workforce in animation (30%) is freelance. This is higher than the 24% seen across the creative media industries.
Occupational groups like production, legal, libraries and archives, distribution sales and marketing as well as business management do not rely greatly on freelancers. In contrast, audio/sound/music (100%), costume/wardrobe (60%), camera/photography (60%), content development (50%), editing (47%) and animators (41%) are freelance-orientated occupational groups in the industry.
2004 2006 2009 2012
Freelancers in animation 1,400 1,800 2,000 1,400
% of total workforce 46% 38% 46% 30%
Freelance workforce Table 22
Animation | 51
Occupational groups
Freelance workforce
Figure 51 demonstrates the major occupational groups in animation. As shown, these are animators (18%), production (16%), business management (16%), strategic management (13%) and art and design (10%).
13
4
16
310
18
2
4
Strategic Management
Production
Art and Design
Creative Development
AnimatorsLegal
Editing
Business Management
Distribution, Sales and Marketing
16
Major occupational
groups in animation (%) Fig.51

Diversity
52 | Animation
Yorkshire & the Humber
East Midlands
South West of England
South East of England
London
Scotland
Wales
Northern Ireland
1293
1060
3176
1946
Geographical representation of freelancers in animation (%) Fig.52
Figure 53 shows the proportion of women and the BAME workforce in animation. The response rate from the industry related to disability was too low to be able to extrapolate trends and this is therefore not reported in this section.
Of the animation workforce in the South West of England and Yorkshire and the Humber 10% and 12% respectively are freelancers, only about a third of the sector average. On the other hand, 93% of the workforce in the East Midlands is freelance. Other areas that employ double or more than the sector average of freelancers are the South East, East London and Northern Ireland (Figure 52).
2004 2006 2009 2012
6.6%2.2%2.6% 3.5%
43%
34%
40%
18%
BAME
Women
Diversity in animation Fig.53
Freelance workforce (continued)

Yorkshire & the Humber
South West of England
South East of England
London
Scotland
Wales
Northern Ireland
8837
20424
2953
29
Geographical representation of women in animation (%) Fig.54
Representation of women is lower than average in the South East (20%), West London (27%), Wales and Northern Ireland (29% each). The South West and London are around the sector average, while in Scotland (53%), and Yorkshire & the Humber (88%) women have greater representation (Figure 54).
Animation | 53
Women in animation represent 40% of the total workforce compared to 36% of the creative media industries. After a substantial drop in 2009, the proportion of women in animation seems to be moving towards the 2004 levels.
Women in animation are represented in all occupational groups at a 30-50% range except for art and design (28%), editing (27%), animators (21%), camera/photography (20%) and lighting (14%). At the upper end of the scale, women represent 81% of distribution, sales and marketing, 65% of legal roles and 54% of business management.
2004 2006 2009 2012
Women in animation 1,300 1,600 800 1,850
% of total workforce 43% 34% 18% 40%
Women workforce Table 23

54 | Animation
South West of England
London
Scotland
25
9
BAME geographical representation in animation (%) Fig.55
The nations and regions reported to employ people from BAME backgrounds are shown in Figure 55.
Diversity (continued)
Employees and freelancers from a BAME background represent 3.5% of the total workforce compared to 5.4% of the creative media industries.
The occupational groups represented by BAME workers are legal (18%), strategic management (8%), editing (7%), business management (6%), production (5%) and distribution, sales and marketing (4%).
2004 2006 2009 2012
BAME in animation 200 100 100 150
% of total workforce 6.6% 2.6% 2.2% 3.5%
BAME workforce Table 24

55
Corporate production
Workforce size
The total workforce in corporate production has increased by 46% since 2004 although it suffered major cuts from 2006 to 2009 (Figure 56).
2004 2006 2009 2012
2,8000
6,400
4,1003,950
Corporate production total workforce Fig.56
A third of the workforce is based in London (33%), 20% work in the South East, 12% in Wales and 10% in Scotland (Figure 57). 2 East Midlands2
2 North East of England2
3 Yorkshire & the Humber
North West of England
West Midlands
East of England
r
10
33
20
3
8
52
12 ScotlandWales
London
South West of England South East of England
Work base of the corporate
production industry (%) Fig.57
For London specifi cally, 60% of the workforce is based in Central London, 31% in West London and 9% in East London.
Corporate production covers fi lm and video production for corporate bodies.
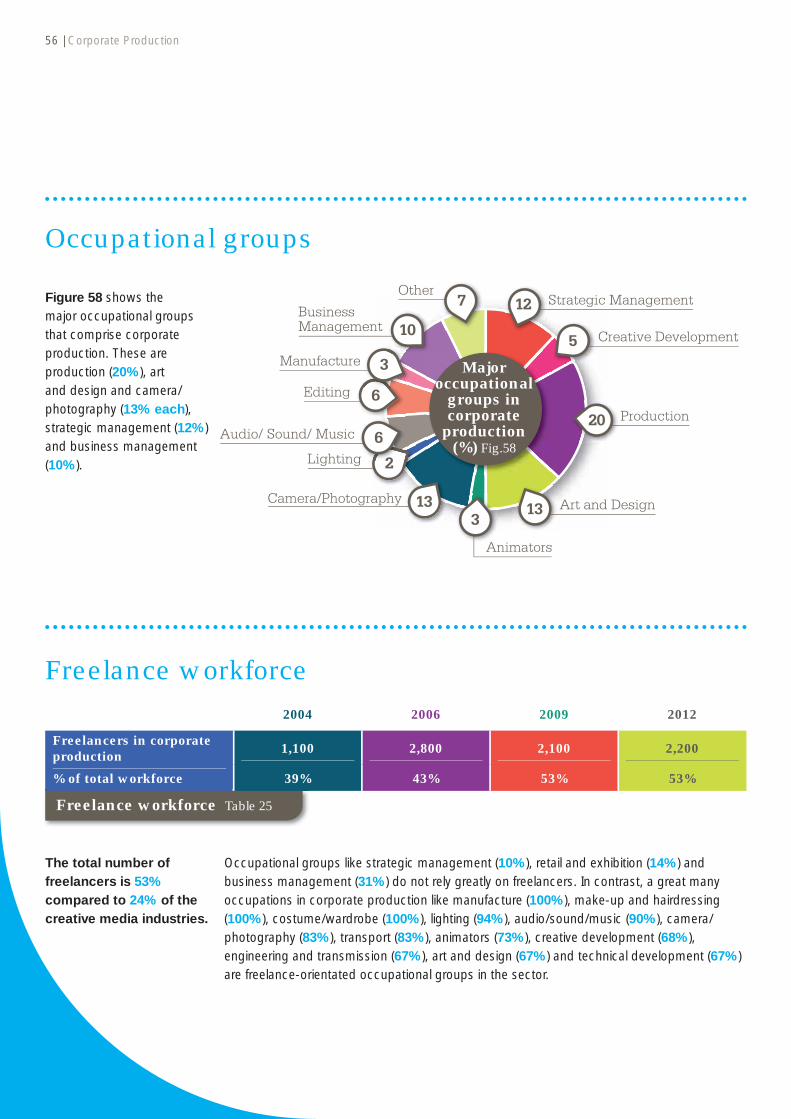
56 | Corporate Production
The total number of freelancers is 53% compared to 24% of the creative media industries.
Occupational groups like strategic management (10%), retail and exhibition (14%) and business management (31%) do not rely greatly on freelancers. In contrast, a great many occupations in corporate production like manufacture (100%), make-up and hairdressing (100%), costume/wardrobe (100%), lighting (94%), audio/sound/music (90%), camera/photography (83%), transport (83%), animators (73%), creative development (68%), engineering and transmission (67%), art and design (67%) and technical development (67%) are freelance-orientated occupational groups in the sector.
2004 2006 2009 2012
Freelancers in corporate production
1,100 2,800 2,100 2,200
% of total workforce 39% 43% 53% 53%
Freelance workforce Table 25
Occupational groups
Freelance workforce
Figure 58 shows the major occupational groups that comprise corporate production. These are production (20%), art and design and camera/photography (13% each), strategic management (12%) and business management (10%).
12
5
20
133
13
2
6
6
3
10
7 Strategic Management
Creative Development
Art and Design
Production
Animators
Lighting
Audio/ Sound/ Music
Camera/Photography
Editing
Manufacture
Other
Business Management
Major occupational
groups in corporate
production (%) Fig.58
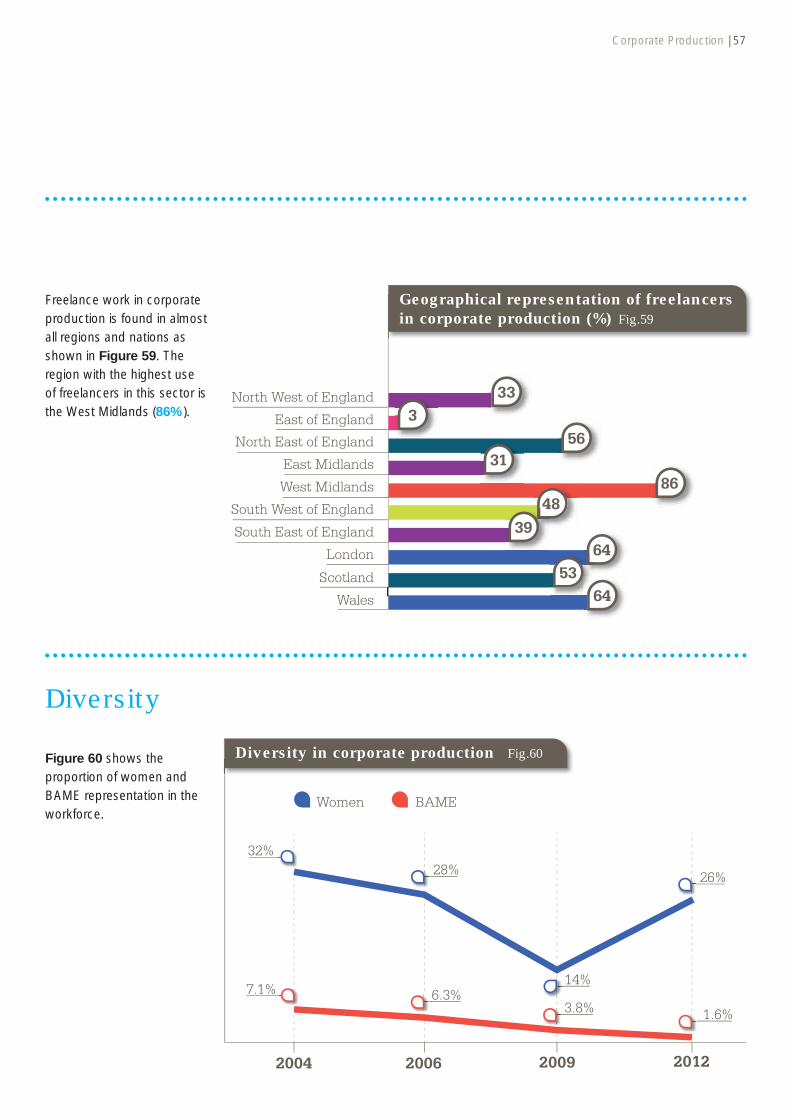
Corporate Production | 57
North West of England
East of England
North East of England
East Midlands
South West of England
South East of England
London
Scotland
Wales
West Midlands
356
3186
48439
6453
33
64
Geographical representation of freelancers in corporate production (%) Fig.59
Freelance work in corporate production is found in almost all regions and nations as shown in Figure 59. The region with the highest use of freelancers in this sector is the West Midlands (86%).
Diversity
Figure 60 shows the proportion of women and BAME representation in the workforce.
2004 2006 2009 2012
7.1%3.8% 1.6%
32%28% 26%
Women BAME
14%6.3%
Diversity in corporate production Fig.60

58 | Corporate Production
North West of England
East of England
North East of England
East Midlands
South West of England
South East of England
London
Scotland
Wales
West Midlands
2711
3823
1725
3221
17
28
Geographical representation of women in corporate production (%) Fig.61
Figure 61 shows the representation of women geographically within corporate production.
Diversity (continued)
Women in corporate production represent 26% of the total workforce compared to 36% of the creative media industries.
Women in corporate production represent: business management (53%) strategic management (38%), production (36%), editing (21%), creative development (18%), art and design (18%), animators (14%), content development (10%), manufacture (10%) and camera/photography (5%).
2004 2006 2009 2012
Women in corporate production
900 1,800 550 1,050
% of total workforce 32% 28% 14% 26%
Women workforce Table 26

Corporate Production | 59
West Midlands
London
South East Midlands
Wales
31
32
BAME geographical representation in corporate production (%) Fig.62
The nations and regions reported to employ people from BAME backgrounds are shown in Figure 62.
Workforce from a Black, Asian or Minority Ethnic background represents 1.6% of the total workforce compared to 5.4% of the creative media industries. This is the lowest since 2004.
The occupational groups represented by BAME workers are transport (17%), strategic management (7%), production (2%), art and design (1%), and business management (1%).
The proportion of disabled workforce in corporate production has dropped to 0.3% in 2012 from 0.7% in 2009. The numbers are too low to extrapolate trends or to estimate occupational and geographical representation.
2004 2006 2009 2012
BAME in corporate production
200 400 150 50
% of total workforce 7.1% 6.3% 3.8% 1.6%
BAME workforce Table 27
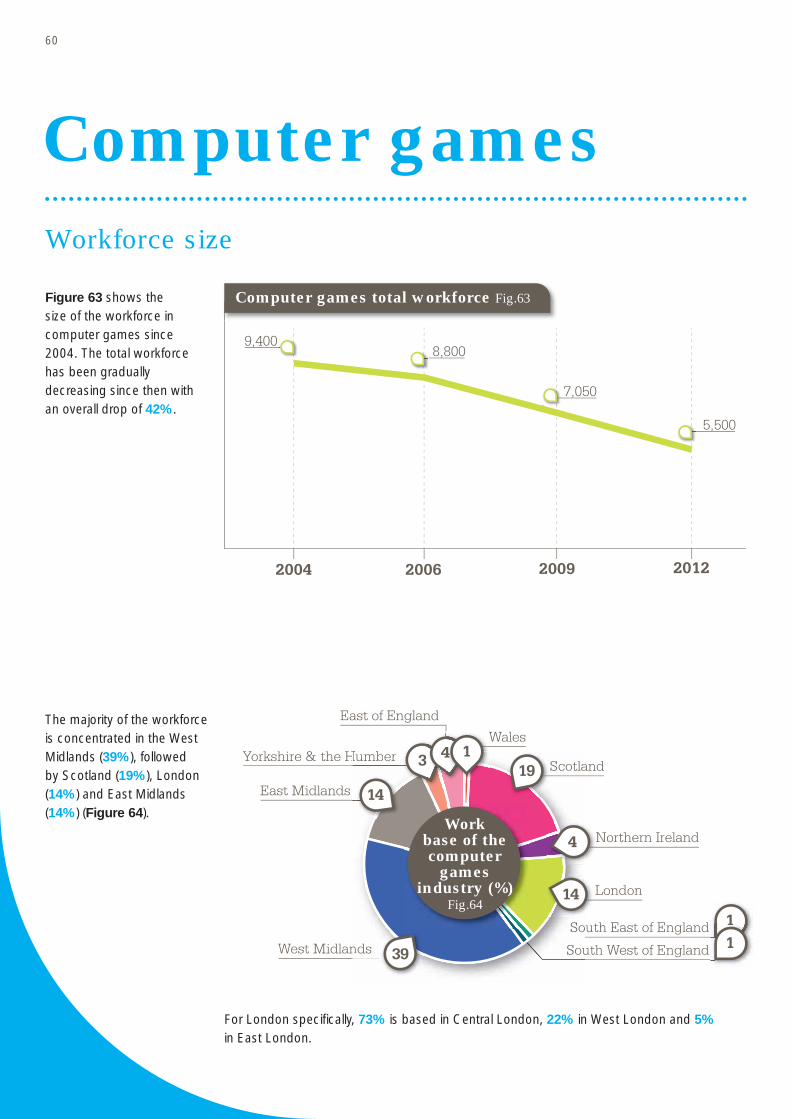
2004 2006 2009 2012
9,4008,800
5,500
7,050
Computer gamesWorkforce size
60
Figure 63 shows the size of the workforce in computer games since 2004. The total workforce has been gradually decreasing since then with an overall drop of 42%.
Computer games total workforce Fig.63
The majority of the workforce is concentrated in the West Midlands (39%), followed by Scotland (19%), London (14%) and East Midlands (14%) (Figure 64).
For London specifi cally, 73% is based in Central London, 22% in West London and 5% in East London.
East Midlands
Yorkshire & the Humber
West Midlands
East of England
Humber
nds
19143
14
39
14
4
Scotland
Wales
London
Northern Ireland
South East of England
South West of England
111
Work base of the computer
games industry (%)
Fig.64

The proportion of freelancers is 14% compared to 24% across the creative media industries. This has grown signifi cantly since 2009.
Occupational groups like strategic management (5%), technical development (5%) and business management (7%) are mostly staffed by permanent employees. In contrast, editing (100%), creative development (78%), animators (75%), camera/photography (67%), audio/sound/music (49%) and production (28%) are freelance dominated groups in computer games. Content development (15%) and art and design (9%) match the overall sector average.
2004 2006 2009 2012
Freelancers in computer games
1,000 700 250 800
% of total workforce 11% 8% 3% 14%
Freelance workforce Table 28
Computer Games | 61
Occupational groups
Freelance workforce
Figure 65 shows the major occupational groups in computer games. These are art and design (33%), technical development (26%), business management (13%), strategic management (10%) and production (10%).
Technical Development
Audio/ Sound/ Musicusic
103
10
332
3
26
13Strategic Management
Creative DevelopmentBusiness Management
Production
Art and Design
Animators
Major occupational
groups in computer games (%)
Fig.65
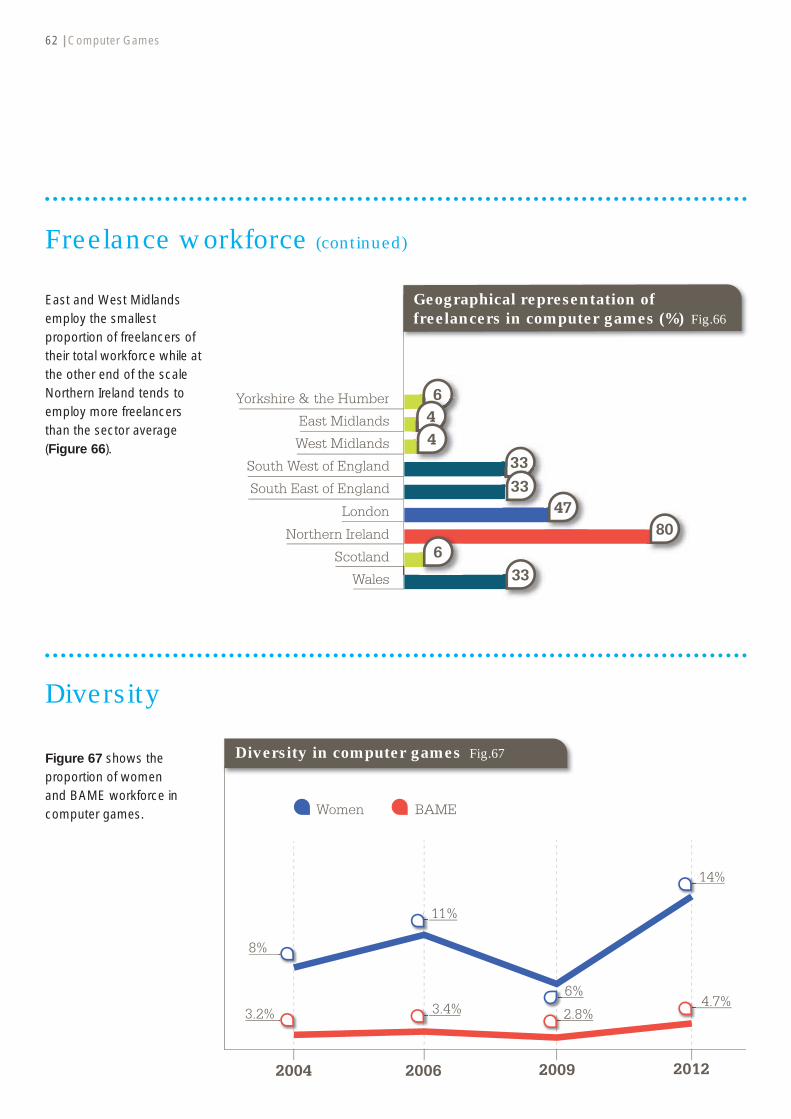
Freelance workforce (continued)
62 | Computer Games
Yorkshire & the Humber
East Midlands
South West of England
South East of England
London
Scotland
Northern Ireland
Wales
West Midlands
6
333333
4780
633
6444
Geographical representation of freelancers in computer games (%) Fig.66
East and West Midlands employ the smallest proportion of freelancers of their total workforce while at the other end of the scale Northern Ireland tends to employ more freelancers than the sector average (Figure 66).
Diversity
Figure 67 shows the proportion of women and BAME workforce in computer games.
2004 2006 2009 2012
3.2% 2.8%4.7%
8%
11%
14%
Women BAME
6%3.4%
Diversity in computer games Fig.67

Computer Games | 63
Yorkshire & the Humber
East Midlands
London
West Midlands
Scotland
1715
26
6
10
Geographical representation of women in computer games (%) Fig.68
Figure 68 shows the geographical representation of women working in computer games. London has the highest concentration followed by East Midlands.
Women make up 14% of the total workforce compared to 36% across the creative media industries. Although low, this is the highest recorded since 2004.
Table 30 illustrates the representation of women in each occupational group in computer games.
2004 2006 2009 2012
Women in computer games 800 1,000 450 750
% of total workforce 8% 11% 6% 14%
Women workforce Table 29
Below average representation
Industry average representation (14%)
Higher than average representation
Technical development (6%) Strategic management (11%) Business management (41%)
– Art and design (12%) Production (25%)
Women workforce Table 30
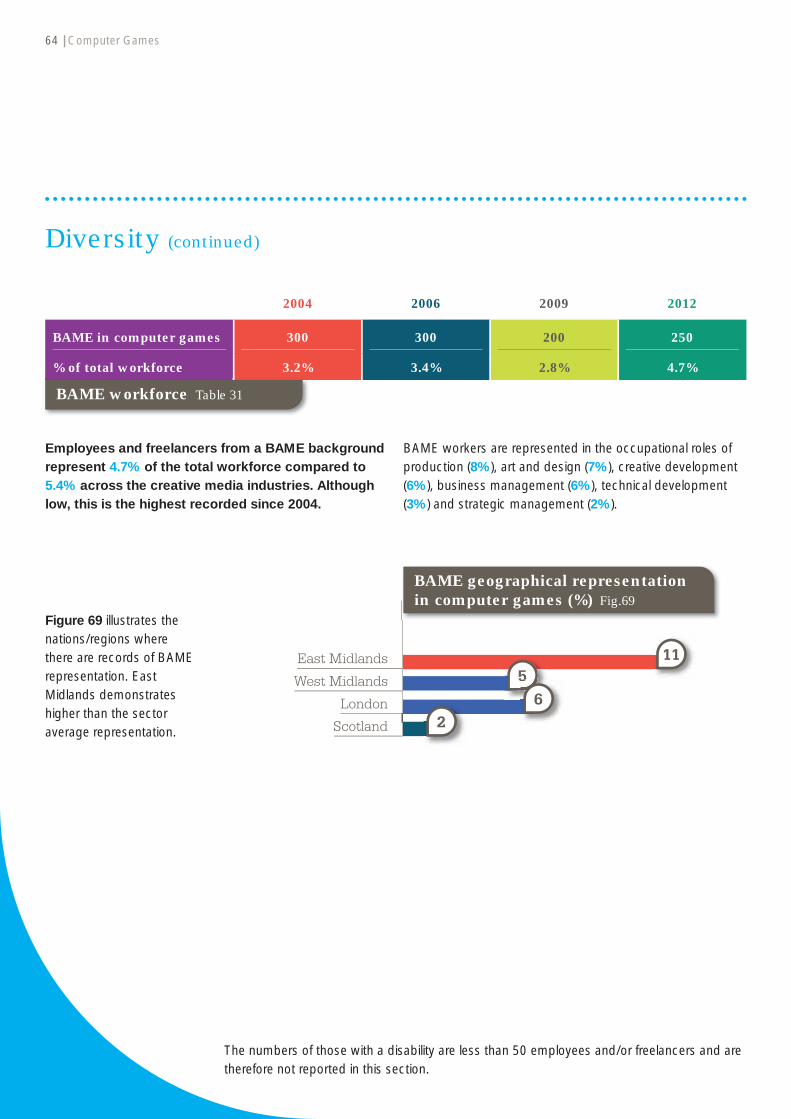
64 | Computer Games
East Midlands
London
West Midlands
Scotland
1155
62
BAME geographical representation in computer games (%) Fig.69
Figure 69 illustrates the nations/regions where there are records of BAME representation. East Midlands demonstrates higher than the sector average representation.
The numbers of those with a disability are less than 50 employees and/or freelancers and are therefore not reported in this section.
Diversity (continued)
Employees and freelancers from a BAME background represent 4.7% of the total workforce compared to 5.4% across the creative media industries. Although low, this is the highest recorded since 2004.
BAME workers are represented in the occupational roles of production (8%), art and design (7%), creative development (6%), business management (6%), technical development (3%) and strategic management (2%).
2004 2006 2009 2012
BAME in computer games 300 300 200 250
% of total workforce 3.2% 3.4% 2.8% 4.7%
BAME workforce Table 31

65
The VFX workforce is based mostly in London (98%) and more specifi cally Central London. The remaining 2% of the workforce is spread across Wales, Northern Ireland, the South East and the South West.
2009 2012
VFX 6,900 5,300
VFX workforce Table 32
VFXWorkforce size
Table 32 shows the size of the workforce in VFX since 2009 where the sector was separated from facilities. There has been a 23% decrease since then.
Occupational groups
Figure 70 shows the major occupational groups in VFX. These are animators (59%), art and design (12%), business management (9%) and production (7%).
7394
33
12
59
Production
Engineering and Transmission
Art and Design
Lighting
Animators
Editing
Strategic ManagementBusiness Management
Major occupational
groups in VFX
(%) Fig.70

Freelance workforce
66 | VFX
Diversity
Table 34 shows the proportion of women, BAME and the disabled workforce. The asterisk (*) denotes too small a number to be statistically reliable.
2009 % 2012 %
Women 1,300 19% 1,000 19%
BAME 550 7.9% 50 1%
Disability * * * *
Diversity in the workforce Table 34
The proportion of freelancers is 9% compared to 24% of the creative media industries.
Occupational groups like strategic management (2%), business management (1%) and engineering and transmission (4%) do not rely greatly on freelancers. In contrast, art and design (33%) and editing (16%) are freelance-orientated occupational groups in the sector. Other groups such as production (10%), broadcast
2009 2012
Freelancers in VFX 800 500
% of total workforce 12% 9%
Freelance workforce Table 33
management (10%), animators (6%) and lighting (5%) are closer to the sector average in the use of freelancers.
VFX work in Northern Ireland is shown to be 100% freelance. Freelancers in London are represented at the sector average of 9%. Of those in London, 98% are employed in Central London.

VFX | 67
Women in VFX represent 19% of the total workforce compared to 36% across the creative media industries. Table 35 illustrates the representation of women across occupational groups.
Of the total VFX workforce in London and specifi cally Central London, 19% are women.
The workforce from a BAME background represents 1% of the total workforce compared to 5.4% of the creative media industries.
The BAME workforce is based largely in Central London and the main occupational groups are art and design (5%), engineering and transmission (4%), business management (3%) and production (1%).
The numbers of disabled workforce in VFX are too low to calculate trends, occupational and geographical representation.
Below average representation
Industry average representation (9%-29%)
Higher than average representation
Engineering and transmission (7%) Strategic management (26%) Creative development (50%)
Art and design (7%) Lighting (14%) Production (63%)
– Technical development (11%) Broadcast management (60%)
– Editing (24%) Labs/processing (33%)
– – Business management (37%)
Women workforce Table 35

Stand up and becounted
4 July 2012 The eighth
census of the creative media
industries
IMPORTANT - PLEASE READ This is the eighth census of the creative media industries. The census, which was last carried out in 2009, has full industry support. By completing the census you will be directly infl uencing how Creative Skillset uses and levers funds to ensure we have a highly skilled, world class workforce. Please complete this census form on or as near as possible to Census Day, Wednesday 4 July 2012.
If you need any assistance, please call 020 7713 9820.
The census form is also available to complete online at creativeskillset.org/census.#creativecensus
Glossary Employees: Employees are classifi ed as those on contracts of 365 days or more.
Freelancers: Freelancers are classifi ed as those on contracts of 364 days or less, including those on Schedule D status.
BAME: Black, Asian and Minority Ethnic (BAME) includes those in Mixed, Asian or Asian British, Black or Black British,
Chinese and Other ethnic groups. Those not categorised as White British, White Irish or White Other should be
included in this category.
Disabled: As defi ned by the Disability Discrimination Act (DDA) a disabled person is someone who has a physical or mental
impairment that has a substantial and long term adverse effect on his or her ability to carry out normal day to day
activities such as visual, hearing, speech, co-ordination, mobility and many people who may not usually have
considered themselves disabled.
How to complete the census1. Please complete this form on Census Day (Wednesday 4 July 2012) or as soon as possible thereafter
and return it by Friday 3 August 2012 to the independent research organisation Qualasys Limited:
Freepost RSXX-ZJTG-STAL, Qualasys Ltd, PO Box 63539, London, N16 1BP.
You do not need to use a stamp.
2. The census is being distributed via several channels: if you receive more than one copy of the form, please ensure that
only one form is completed for each nation or region in which your organisation is active (see point 3 below).
3. If your organisation has bases in more than one nation or region please complete a separate form for each nation or region
(see overleaf). Further copies of the form may be obtained from Anna Chourdaki ([email protected]) or you can go
to www.creativeskillset.org/census and complete the form online or print hard copies and complete the form manually.
4. Any information you provide us on the census form will be treated in absolute confi dence and the information will
contribute to an overall statistical view of the industry. We are asking for your contact details only to know which sector
and region you operate in and to get in touch if there is anything we want to clarify about what you have told us.
5. Please enter the number of employees and freelancers on your payroll on Wednesday 4 July 2012 including yourself and
all those who work for you for any part of the day whatever length of time. For a defi nition of ‘employee’ and ‘freelancer’
please refer to the Glossary.
6. You may fi nd it helpful to read the whole form before ascribing individuals to occupational groups.
For examples of job titles that fall into each group please refer to the Appendix.
7. We know that the way people work nowadays is complex and that some people work across more than one occupation
and some occupations are diffi cult to defi ne. Please count once only all people working on Wednesday 4 July 2012 in
whichever category you think best describes their role.
8. Don’t forget to count yourself, especially if you are a small or one-person operation.
9. If you do not employ or use anyone in any particular category, just leave the box blank.
10. Please include only those who are based in the United Kingdom and any UK nationals who are working overseas on
Wednesday 4 July 2012.
11. We are also asking you how many people in each category are women, from a Black, Asian and Minority Ethnic (BAME)
background or are disabled. We understand that it can sometimes be diffi cult to judge and we are seeking broad
estimates based on your discretion. Please refer to the Glossary for a defi nition of ‘BAME’ and ‘disabled’.
12. If you have any queries about completing the census, please contact Anna Chourdaki at Creative Skillset
(tel: 020 7713 9820; e-mail: [email protected]), who will be pleased to assist.

Where is your organisation based in the UK? If you have offi ces based in more than one nation or region, please complete a separate copy of the form for each. Please indicate below which nation or region this form covers by marking a ✓ in the appropriate box. (Please ✓ one box only).
Wales
North and Mid Wales Anglesey, Gwynedd, Conwy, Denbighshire, Flintshire, Powys,
Wrexham
West Wales Ceredigion, Carmarthenshire,
Pembrokshire
South Wales Bridgend, Vale of Glamorgan, Cardiff, Newport, Monmouthshire, Tarfaen, Blaenau, Gwent, Caerphilly, Merthyr Tydfi l, Rhondda Cynon Taf, Swansea, Neath Port Talbot
Scotland
Glasgow, Edinburgh and Southern Scotland Edinburgh & Lothians, Greater Glasgow & Clyde Valley, Ayrshire & Arran, Dumfries & Galloway,
Scottish Borders
Central and North East Scotland Aberdeen & Grampian, Angus & Dundee, Perthshire, Argyll, the Isles, Loch Lomond, Stirling & the Trossachs
Highlands & Islands Shetland, Orkney, Outer Hebrides,
Highlands & Skye
Northern Ireland
England
Central London City of Westminster, Kensington & Chelsea, Lambeth, Wandsworth, Southwark, Camden, lslington
East London Hackney, Redbridge, Havering, Barking & Dagenham, Newham, Tower Hamlets, City of London, Bexley, Greenwich, Lewisham
North London Barnet, Enfi eld, Haringey,
Waltham Forest
South London Richmond Upon Thames, Kingston Upon Thames, Merton,
Sutton, Croydon, Bromley
West London Hillingdon, Harrow, Brent, Ealing,
Hounslow, Hammersmith, Fulham
South East of England (excluding London) Oxfordshire, Buckinghamshire, Milton Keynes, Bracknell Forest, West Berkshire, Reading, Slough, Windsor & Maidenhead, Wokingham, Surrey, Kent, Medway, East Sussex, West Sussex, Brighton & Hove, Hampshire, Isle of Wight,
Portsmouth, Southampton
South West of England Gloucestershire, Wiltshire, Swindon, Former Avon, Somerset, Bournemouth, Dorset, Poole,
Devon, Cornwall
West Midlands Shropshire, Staffordshire, The Black Country, Coventry, Warwickshire, Herefordshire, Worcestershire
East Midlands Derbyshire, Nottinghamshire, Lincolnshire, Rutland, Leicestershire, Northamptonshire
North East of England Northumberland, Tyne & Wear, County Durham, Tees Valley
Yorkshire & the Humber North Yorkshire, West Yorkshire, East Riding of Yorkshire, North Lincolnshire, North East Lincolnshire, South Yorkshire
East of England Norfolk, Cambridgeshire, Suffolk,
Bedfordshire, Hertfordshire, Essex
North West of England Cumbria, Lancashire, Greater Manchester, Merseyside, Halton, Cheshire, Warrington
About your organisationBefore completing the census, please provide the following information about your company so that we can get in
touch if we need to clarify any of the information you provide and to help us analyse it by activity and nation and region:
Company name: Contact name:
Tel no:
E-mail address: Postcode:
Had you heard of Creative Skillset before today ? ( ✓ one box only) Yes No
Please tick (✓) your organisation's MAIN area of activity and cross (✕) any OTHER areas in which you work
Television
Terrestrial (Public)
Terrestrial (Commercial)
Cable & Satellite
Independent Production
Community
Distribution
Interactive
Broadcast Technology
Radio
Broadcast (Public)
Broadcast (Commercial)
Independent Production
Community/Voluntary
Facilities
Post production
Studios & Equipment Hire
Outside Broadcast
System Integration
Special Physical Effects
Manufacture of Audio Visual Equipment
Processing Laboratories
Transmission
Other Services for Film & Television
Film
Production
Distribution - UK
Distribution - International
Animation
VFX
Commercials Production
Corporate Production
Pop Promos
Interactive Media
Online content
Mobile content
Systems design/software
Social media/Web 2.0
Other IM
Computer Games
Games Development
Games Publishing
Games Development Support (middleware, tools and technology)
Archives & Libraries
Other, please specify

Occ
upat
iona
l Gro
upO
ccup
atio
nal R
ole
Em
ploy
ees
Free
lanc
ers
Tota
l num
ber
of
empl
oyee
sN
umbe
r of
w
omen
Num
ber o
f peo
ple
from
a
BAM
E ba
ckgr
ound
†
Num
ber
of
disa
bled
peo
ple†
Tota
l num
ber
of
freel
ance
rsN
umbe
r of
w
omen
Num
ber o
f peo
ple
from
a
BAM
E ba
ckgr
ound
†
Num
ber
of
disa
bled
peo
ple†
1.S
trat
egic
Man
agem
ent
CE
O
Pro
duci
ng
2.C
reat
ive
Dev
elop
men
tS
crip
t
Sto
rybo
ard
Writ
ing
& A
utho
ring
3. P
rodu
ctio
nD
irect
ion
Cas
ting
Loca
tions
Pro
duct
ion
Pro
duct
ion
Man
agem
ent
Arc
hive
Res
earc
h
Impl
emen
tatio
n
Qua
lity
Ass
uran
ce
Pro
ject
Man
agem
ent
4. L
egal
Lega
l - C
orpo
rate
Lega
l - In
telle
ctua
l Pro
pert
y
5. B
road
cast
Man
agem
ent
Acq
uisi
tions
Aud
ienc
e R
esea
rch
Cha
nnel
/Sta
tion
Con
trol
Com
mis
sion
ing
Pre
sent
atio
n
Cab
le &
Sat
ellit
e D
istr
ibut
ion
Cab
le &
Sat
ellit
e N
etw
ork
Sch
edul
ing
Sig
ning
Sub
titlin
g
6. E
ngin
eerin
g &
Tra
nsm
issi
onE
ngin
eerin
g -
Ope
ratio
ns
Pla
nt &
Mai
nten
ance
Pro
ject
Eng
inee
ring
Tran
smis
sion
- M
anag
emen
t
Tran
smis
sion
- O
pera
tions
Cen
sus
Ple
ase
com
plet
e th
e ce
nsus
bel
ow a
nd re
turn
to th
e ad
dres
s at
the
bott
om o
f the
form
.
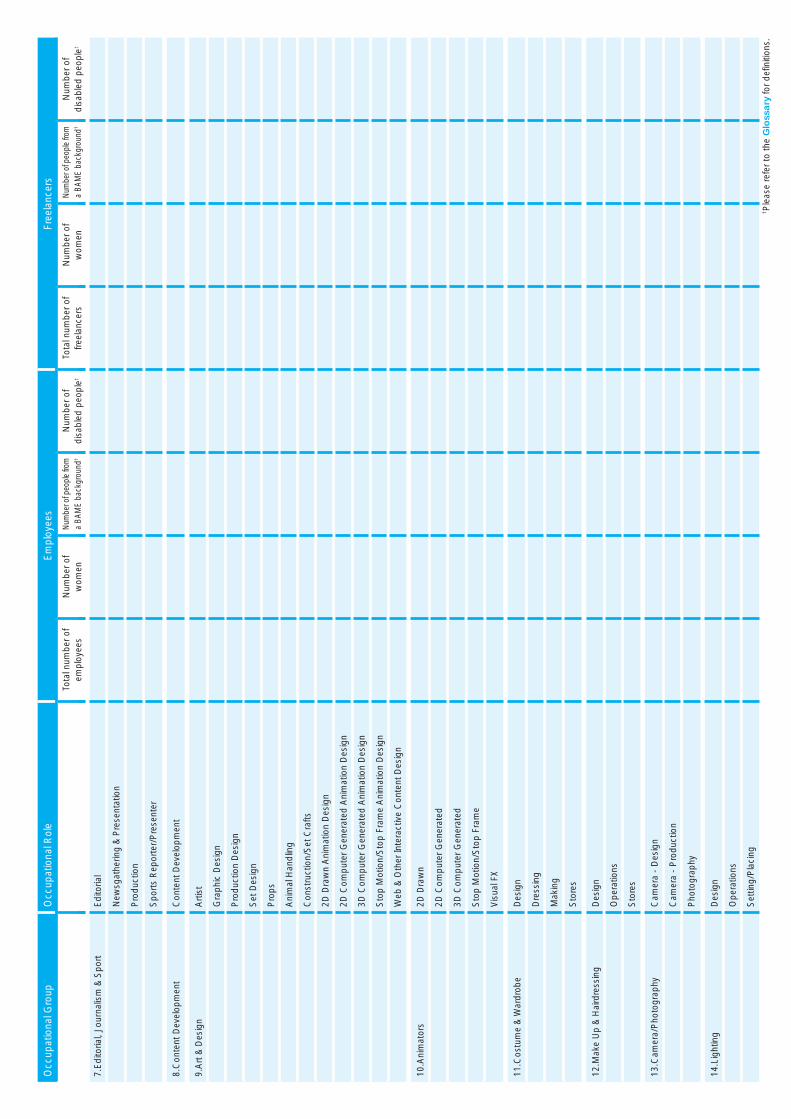
7.E
dito
rial,
Jour
nalis
m &
Spo
rtE
dito
rial
New
sgat
herin
g &
Pre
sent
atio
n
Pro
duct
ion
Spo
rts
Rep
orte
r/P
rese
nter
8.C
onte
nt D
evel
opm
ent
Con
tent
Dev
elop
men
t
9.A
rt &
Des
ign
Art
ist
Gra
phic
Des
ign
Pro
duct
ion
Des
ign
Set
Des
ign
Pro
ps
Ani
mal
Han
dlin
g
Con
stru
ctio
n/S
et C
rafts
2D D
raw
n A
nim
atio
n D
esig
n
2D C
ompu
ter
Gen
erat
ed A
nim
atio
n D
esig
n
3D C
ompu
ter
Gen
erat
ed A
nim
atio
n D
esig
n
Sto
p M
otio
n/S
top
Fram
e A
nim
atio
n D
esig
n
Web
& O
ther
Inte
ract
ive
Con
tent
Des
ign
10.A
nim
ator
s2D
Dra
wn
2D C
ompu
ter
Gen
erat
ed
3D C
ompu
ter
Gen
erat
ed
Sto
p M
otio
n/S
top
Fram
e
Vis
ual F
X
11.C
ostu
me
& W
ardr
obe
Des
ign
Dre
ssin
g
Mak
ing
Sto
res
12.M
ake
Up
& H
aird
ress
ing
Des
ign
Ope
ratio
ns
Sto
res
13.C
amer
a/P
hoto
grap
hyC
amer
a -
Des
ign
Cam
era
- P
rodu
ctio
n
Pho
togr
aphy
14.L
ight
ing
Des
ign
Ope
ratio
ns
Set
ting/
Pla
cing
Occ
upat
iona
l Gro
upO
ccup
atio
nal R
ole
Em
ploy
ees
Free
lanc
ers
Tota
l num
ber
of
empl
oyee
sN
umbe
r of
w
omen
Num
ber o
f peo
ple
from
a
BAM
E ba
ckgr
ound
†
Num
ber
of
disa
bled
peo
ple†
Tota
l num
ber
of
freel
ance
rsN
umbe
r of
w
omen
Num
ber o
f peo
ple
from
a
BAM
E ba
ckgr
ound
†
Num
ber
of
disa
bled
peo
ple†
† Ple
ase
refe
r to
the
Glo
ssar
y fo
r de
fi niti
ons.
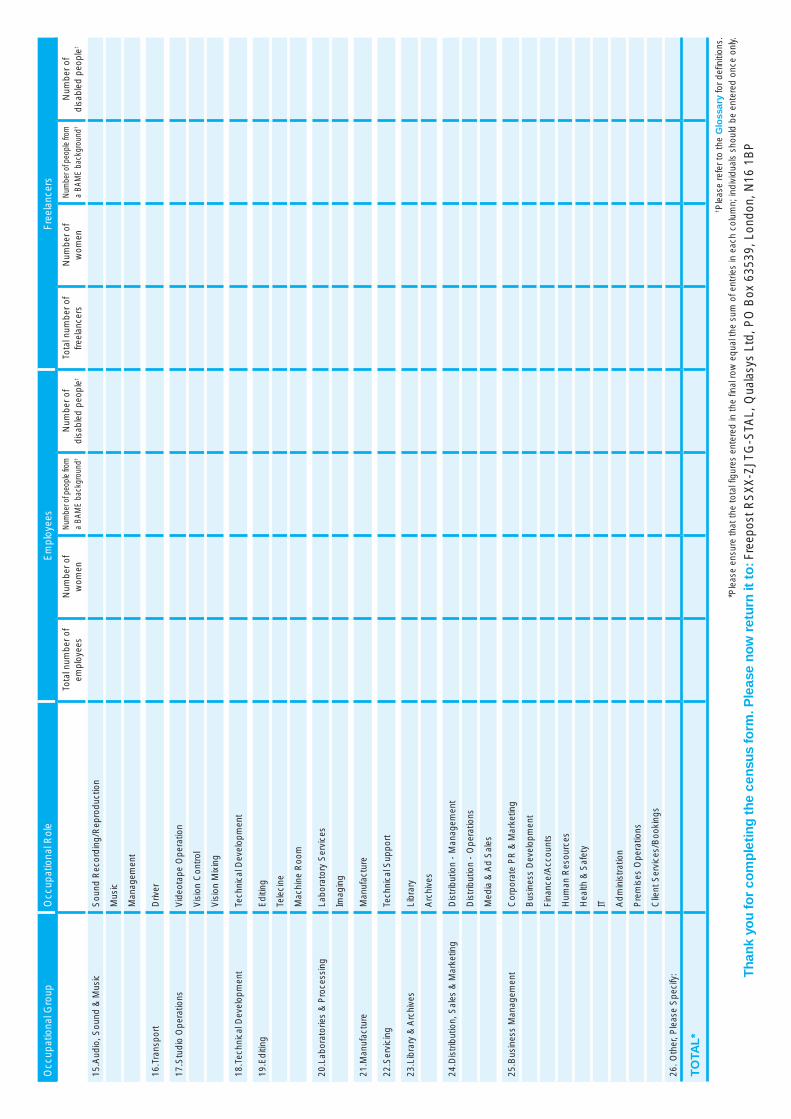
15.A
udio
, Sou
nd &
Mus
icS
ound
Rec
ordi
ng/R
epro
duct
ion
Mus
ic
Man
agem
ent
16.T
rans
port
Driv
er
17.S
tudi
o O
pera
tions
Vid
eota
pe O
pera
tion
Vis
ion
Con
trol
Vis
ion
Mix
ing
18.T
echn
ical
Dev
elop
men
tTe
chni
cal D
evel
opm
ent
19.E
ditin
gE
ditin
g
Tele
cine
Mac
hine
Roo
m
20.L
abor
ator
ies
& P
roce
ssin
gLa
bora
tory
Ser
vice
s
Imag
ing
21.M
anuf
actu
reM
anuf
actu
re
22.S
ervi
cing
Tech
nica
l Sup
port
23.L
ibra
ry &
Arc
hive
sLi
brar
y
Arc
hive
s
24.D
istr
ibut
ion,
Sal
es &
Mar
ketin
gD
istr
ibut
ion
- M
anag
emen
t
Dis
trib
utio
n -
Ope
ratio
ns
Med
ia &
Ad
Sal
es
25.B
usin
ess
Man
agem
ent
Cor
pora
te P
R &
Mar
ketin
g
Bus
ines
s D
evel
opm
ent
Fina
nce/
Acc
ount
s
Hum
an R
esou
rces
Hea
lth &
Saf
ety
IT Adm
inis
trat
ion
Pre
mis
es O
pera
tions
Clie
nt S
ervi
ces/
Boo
king
s
26. O
ther
, Ple
ase
Spe
cify
:
TO
TAL*
Occ
upat
iona
l Gro
upO
ccup
atio
nal R
ole
Em
ploy
ees
Free
lanc
ers
Tota
l num
ber
of
empl
oyee
sN
umbe
r of
w
omen
Num
ber o
f peo
ple
from
a
BAM
E ba
ckgr
ound
†
Num
ber
of
disa
bled
peo
ple†
Tota
l num
ber
of
freel
ance
rsN
umbe
r of
w
omen
Num
ber o
f peo
ple
from
a
BAM
E ba
ckgr
ound
†
Num
ber
of
disa
bled
peo
ple†
Tha
nk y
ou
for
com
ple
ting
the
cen
sus
form
. Ple
ase
now
ret
urn
it to
: Fre
epos
t RS
XX-Z
JTG
-STA
L, Q
uala
sys
Ltd,
PO
Box
635
39, L
ondo
n, N
16 1
BP
† Ple
ase
refe
r to
the
Glo
ssar
y fo
r de
fi niti
ons.
*Ple
ase
ensu
re th
at th
e to
tal fi
gur
es e
nter
ed in
the
fi nal
row
equ
al th
e su
m o
f ent
ries
in e
ach
colu
mn;
indi
vidu
als
shou
ld b
e en
tere
d on
ce o
nly.

Appendix
Occupational Groups
Occupational Roles
Examples of Job Titles
1. Strategic Management
CEO CEO, Managing Director
Producing Associate Producer, Creative Director, Development Executive, Editorial Head of Department, Executive Producer, Producer, Technical Director
2. Creative Development
Script Screenwriter, Script Editor, Script Reader, Script Writer
Storyboard Storyboard Artist, Storyboard Assistant, Storyboard Supervisor
Writing & Authoring Copy Writer, Multimedia Author, Web Writer
3. Production Direction Director, First Assistant Director, Second Assistant Director, Script Supervisor, Third Assistant Director
Casting Casting Assistant, Casting Director, Casting Manager
Locations Assistant Location Manager/Locations Assistant, Locations Manager, Unit Manager
Production Associate Producer, Continuity Co-ordinator, Head of Development, Production Co-ordinator, Production Manager, Production Runner, Programme Editor, Programming Manager, Project Manager/Producer, Researcher
Production Management
Assistant Producer, Floor Manager, Location Manager, Production Manager
Archive Research Researcher
Implementation QA Manager, Search Engine Optimisation Specialist, Site Manager
Quality Assurance Account Manager, Proofreader, QA Director, QA Tester/Technician, Usability Specialist
Project Management Producer, Production Assistant, Project Manager, Senior Producer
4. Legal Legal - Corporate Solicitor
Legal - Intellectual Property
IPR Lawyer
5. Broadcast Management
Acquisitions Acquisitions Assistant, Acquisitions Manager
Audience Research Market Researcher, BARB Analyst, Analyst, Research Manager, Strategy Manager
Channel/Station Control
Channel Editor, Channel Manager, Controller, Launch Director, Station Manager
Commissioning Commissioning Editor, Development Executive
Presentation Announcer, Continuity Co-ordinator, Editor, News Reader, Producer
Cable & Satellite Distribution
Affi liate Marketing Executive, Affi liate Sales Manager, Decoder Co-ordinator
Cable & Satellite Network
Broadcast Engineer, Network Operations Manager, Operations Assistant
Scheduling Network Assistant, Planning Assistant, Scheduler
Signing Signer
Subtitling Audio Descriptor, Head of Languaging, Stenographer, Subtitler
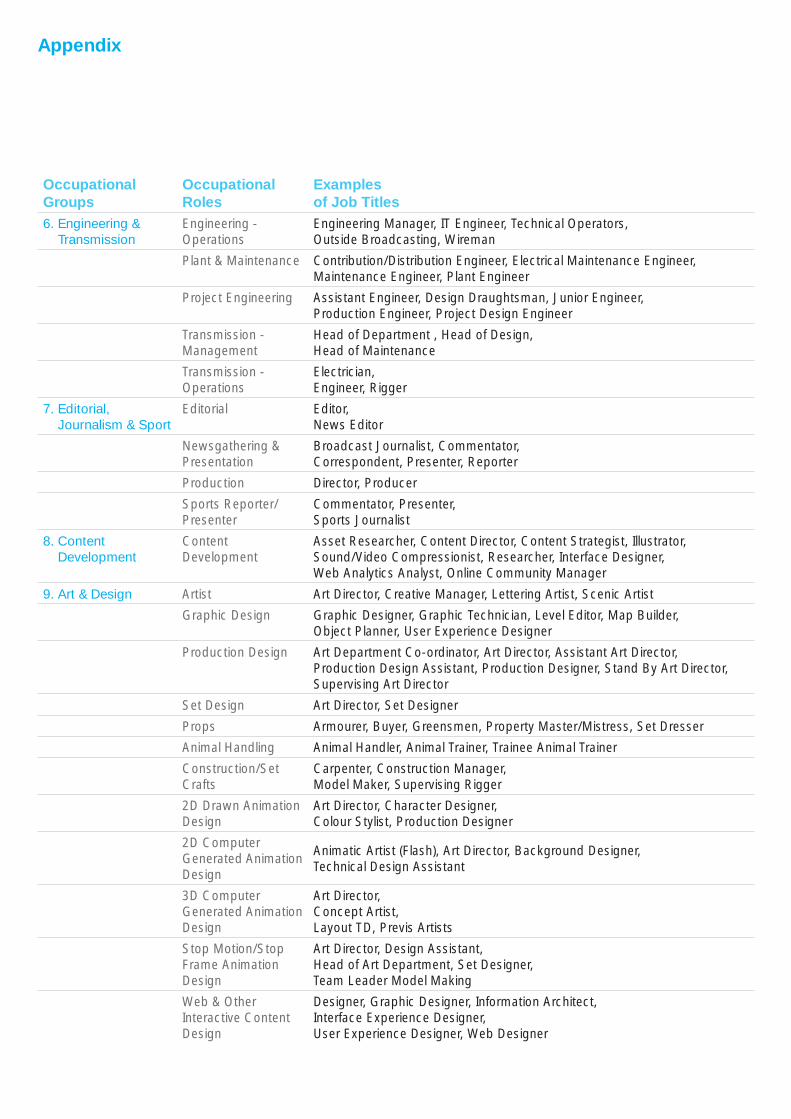
Appendix
Occupational Groups
Occupational Roles
Examples of Job Titles
6. Engineering & Transmission
Engineering - Operations
Engineering Manager, IT Engineer, Technical Operators, Outside Broadcasting, Wireman
Plant & Maintenance Contribution/Distribution Engineer, Electrical Maintenance Engineer, Maintenance Engineer, Plant Engineer
Project Engineering Assistant Engineer, Design Draughtsman, Junior Engineer, Production Engineer, Project Design Engineer
Transmission - Management
Head of Department , Head of Design, Head of Maintenance
Transmission - Operations
Electrician, Engineer, Rigger
7. Editorial, Journalism & Sport
Editorial Editor, News Editor
Newsgathering & Presentation
Broadcast Journalist, Commentator, Correspondent, Presenter, Reporter
Production Director, Producer
Sports Reporter/Presenter
Commentator, Presenter, Sports Journalist
8. Content Development
Content Development
Asset Researcher, Content Director, Content Strategist, Illustrator, Sound/Video Compressionist, Researcher, Interface Designer, Web Analytics Analyst, Online Community Manager
9. Art & Design Artist Art Director, Creative Manager, Lettering Artist, Scenic Artist
Graphic Design Graphic Designer, Graphic Technician, Level Editor, Map Builder, Object Planner, User Experience Designer
Production Design Art Department Co-ordinator, Art Director, Assistant Art Director, Production Design Assistant, Production Designer, Stand By Art Director, Supervising Art Director
Set Design Art Director, Set Designer
Props Armourer, Buyer, Greensmen, Property Master/Mistress, Set Dresser
Animal Handling Animal Handler, Animal Trainer, Trainee Animal Trainer
Construction/Set Crafts
Carpenter, Construction Manager, Model Maker, Supervising Rigger
2D Drawn Animation Design
Art Director, Character Designer, Colour Stylist, Production Designer
2D Computer Generated Animation Design
Animatic Artist (Flash), Art Director, Background Designer, Technical Design Assistant
3D Computer Generated Animation Design
Art Director, Concept Artist, Layout TD, Previs Artists
Stop Motion/Stop Frame Animation Design
Art Director, Design Assistant, Head of Art Department, Set Designer, Team Leader Model Making
Web & Other Interactive Content Design
Designer, Graphic Designer, Information Architect, Interface Experience Designer, User Experience Designer, Web Designer
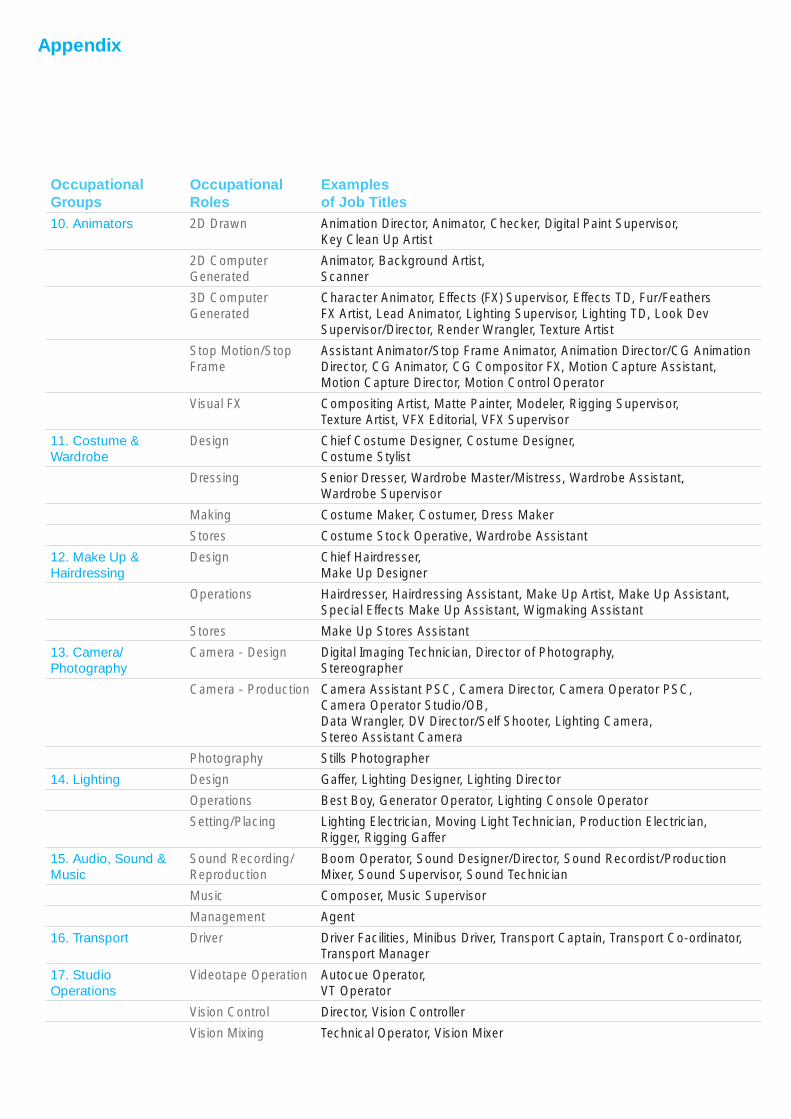
Appendix
Occupational Groups
Occupational Roles
Examples of Job Titles
10. Animators 2D Drawn Animation Director, Animator, Checker, Digital Paint Supervisor, Key Clean Up Artist
2D Computer Generated
Animator, Background Artist, Scanner
3D Computer Generated
Character Animator, Effects (FX) Supervisor, Effects TD, Fur/Feathers FX Artist, Lead Animator, Lighting Supervisor, Lighting TD, Look Dev Supervisor/Director, Render Wrangler, Texture Artist
Stop Motion/Stop Frame
Assistant Animator/Stop Frame Animator, Animation Director/CG Animation Director, CG Animator, CG Compositor FX, Motion Capture Assistant, Motion Capture Director, Motion Control Operator
Visual FX Compositing Artist, Matte Painter, Modeler, Rigging Supervisor, Texture Artist, VFX Editorial, VFX Supervisor
11. Costume & Wardrobe
Design Chief Costume Designer, Costume Designer, Costume Stylist
Dressing Senior Dresser, Wardrobe Master/Mistress, Wardrobe Assistant, Wardrobe Supervisor
Making Costume Maker, Costumer, Dress Maker
Stores Costume Stock Operative, Wardrobe Assistant
12. Make Up & Hairdressing
Design Chief Hairdresser, Make Up Designer
Operations Hairdresser, Hairdressing Assistant, Make Up Artist, Make Up Assistant, Special Effects Make Up Assistant, Wigmaking Assistant
Stores Make Up Stores Assistant
13. Camera/Photography
Camera - Design Digital Imaging Technician, Director of Photography, Stereographer
Camera - Production Camera Assistant PSC, Camera Director, Camera Operator PSC, Camera Operator Studio/OB, Data Wrangler, DV Director/Self Shooter, Lighting Camera, Stereo Assistant Camera
Photography Stills Photographer
14. Lighting Design Gaffer, Lighting Designer, Lighting Director
Operations Best Boy, Generator Operator, Lighting Console Operator
Setting/Placing Lighting Electrician, Moving Light Technician, Production Electrician, Rigger, Rigging Gaffer
15. Audio, Sound & Music
Sound Recording/Reproduction
Boom Operator, Sound Designer/Director, Sound Recordist/Production Mixer, Sound Supervisor, Sound Technician
Music Composer, Music Supervisor
Management Agent
16. Transport Driver Driver Facilities, Minibus Driver, Transport Captain, Transport Co-ordinator, Transport Manager
17. Studio Operations
Videotape Operation Autocue Operator, VT Operator
Vision Control Director, Vision Controller
Vision Mixing Technical Operator, Vision Mixer

Appendix
Occupational Groups
Occupational Roles
Examples of Job Titles
18. Technical Development
Technical Development
Database Designer, Flash Developer, Interaction Designer, Lead Programmer, Software Engineer
19. Editing Editing Editor - Offl ine, Editor - Online, Head of Editing, Operator, Runner
Telecine Assistant, Colourist, Head of Telecine, Operator, Runner
Machine Room Assistant, Head of Machine Room, Operator, Quality Control
20. Laboratories & Processing
Laboratory Services Negative Developer, Other Specialist Lab Service
Imaging Film Librarian, Head of Imaging, Negative Handler, Projectionist, Scanning and Recording Operator
21. Manufacture Manufacture Machine Operator
22. Servicing Technical Support Technician
23. Library & Archives
Library Librarian, Library Manager, Library Technician, Transmission Librarian
Archives Archives Librarian, Archivist
24. Distribution, Sales & Marketing
Distribution - Management
Director of International Relations, Head of Acquisitions, Head of Licensing, Sales Director,
Distribution - Operations
Acquisitions Assistant, Account Manager, Licensing Assistant, Programme Co-ordinator, Sales Manager
Media & Ad Sales Ad Sales Manager, Commercial Operations Assistant, Sponsorship Executive
25. Business Management
Corporate PR & Marketing
Marketing Assistant, Marketing Manager, PR Manager, Sales and Bidding Manager
Business Development
Account Manager, Business Development Manager, Licensing/IPR Manager, Product/Brand Manager, Sales Manager
Finance/Accounts Accountant, Bought/Purchase Ledger Assistant, Financial Controller, Finance Director
Human Resources HR Administrator, HR Director/Manager, Training and Development Manager
Health & Safety Health & Safety Offi cer
IT Head of IT, IT Support Executive, Programmer, Senior Systems Administrator, Technical Director
Administration Administrator, Personal Assistant, Receptionist
Premises Operations Building Manager, Caterer, Cleaner, Despatch Security, Facilities Manager, Facility Runners
Client Services/Bookings
Senior Bookings Co-ordinator, Bookings Co-ordinator

Creative SkillsetFocus Point21 Caledonian Road London N1 9GB
T: 020 7713 9800 E: [email protected] W: www.creativeskillset.org
Follow the discussion on #creativecensus on Twitter: @SkillsetSSCLike us on Facebook: facebook.com/creativeskillsetJoin us on LinkedIn: linkedin.com/company/creative-skillset
Creative Skillset is the licensed Sector Skills Council for Entertainment Media, Fashion and Textiles, Publishing and Advertising, Marketing and Communications. It is owned and invested in by employers working in social partnership with unions and aspires to have the best skills and talent in the world to drive growth of the industries and the UK economy. Creative Skillset brings all parts of the Creative Industries together to add value through collaboration on workforce development.