creating value through open data - enginyeriainformatica.cat · creating value through open data...
TRANSCRIPT

Creating Value through Open Data
DigitalAgenda for
Europe
Creating Value through Open Data: Study on the Impact of Re-use of Public Data Resources

This study has been prepared by Capgemini Consulting as part of the European Data Portal. The European Data Portal is developed by the European Commission with the support of a consortium led by Capgemini Consulting, including INTRASOFT International, Fraunhofer Fokus, con.terra, Sogeti, the Open Data Institute, Time.Lex and the University of Southampton.
For more information about this paper, please contact:
European CommissionDirectorate General for Communications Networks, Content and TechnologyUnit G.3 Value Data Chain Daniele Rizzi – Policy OfficerEmail: [email protected]
Project TeamDinand Tinholt – Vice President, EU Lead, Capgemini ConsultingExecutive lead European Data PortalEmail: [email protected]
Wendy Carrara – Director, Principal Consultant, Capgemini ConsultingProject Manager European Data PortalEmail: [email protected]
Written and reviewed by Wendy Carrara, Wae San Chan, Sander Fischer, Eva van Steenbergen (Capgemini Consulting).
Internal identificationContract number: 30-CE-0677290/00-65SMART number: 2014-1072
DISCLAIMERBy the European Commission, Directorate-General of Communications Networks, Content & Technology. The information and views set out in this publication are those of the author(s) and do not necessarily reflect the official opinion of the Commission. The Commission does not guarantee the accuracy of the data included in this study. Neither the Commission nor any person acting on the Commission’s behalf may be held responsible for the use which may be made of the information contained therein.
ISBN 978-92-79-52791-3 DOI 10.2759/328101
© European Union, 2015. All rights reserved. Certain parts are licensed under conditions to the EU. Reproduction is authorised provided the source is acknowledged.

Creating Value through Open Data
November 2015A study on the Impact of Re-use of Public Data Resources

4
The European Data PortalWithin the context of the launch of the European Data Portal, further evidence of the quantitative impact of re-use of Open Data is measured. The aim of this study is to collect, assess and aggregate economic evidence to forecast the benefits of the re-use of Open Data for the EU28+. Four key indicators are measured: direct market size, number of jobs created, cost savings, and efficiency gains. Between 2016 and 2020, the market size of Open Data is expected to increase by 36.9%, to a value of 75.7 bn EUR in 2020. The forecasted number of direct Open Data jobs in 2016 is 75,000 jobs. From 2016 to 2020, almost 25,000 extra direct Open Data jobs are cre-ated. The forecasted public sector cost savings for the EU28+ in 2020 are 1.7 bn EUR. Efficiency gains are measured in a qualitative approach. A combination of insights around efficiency gains of Open Data, and real-life examples is provided. To measure the success of Open Data policies, a series of recommendations is put forward to help governments keep track of the direct and indirect benefits of their policies. This is key in further accelerating the publishing of Open Data and encouraging its re-use.
Le Portail européen de donnéesDans le cadre du lancement du Portail européen de données, l’impact quantitatif de la réutilisation des données ouvertes a été mesuré. L’objectif de cette étude est de recueillir, analyser et agréger les preuves économiques des avantages de la réu-tilisation des données publiques au sein de l’UE28+. Quatre indicateurs clés sont mesurés: le volume du marché, le nombre d’emplois créés, les économies de coûts ainsi que les gains d’efficacité. Entre 2016 et 2020, la taille du marché des données ouvertes devrait augmenter de 36,9 %, pour atteindre une valeur de 75,7 milliards d’euros en 2020. Selon les prévisions, en 2016, le nombre d’emplois lié directement à la réutilisation des données ouvertes est de 75,000 postes. De 2016 à 2020, ce sont près de 25,000 nouveaux emplois qui seront créés dans ce secteur. D’ici à 2020, grâce à la réutilisation des données ouvertes, le secteur public serait en voie de réa-liser 1,7 milliards d’euros d’économie sur l’ensemble de l’UE des 28+. Une approche plus quantitative est suivie afin de mesurer les gains d’efficacité. Ces gains sont abor-dés sous la forme d’une étude de cas. Une série de recommandations est formulée afin d’encourager les Etats à mesurer plus en détail le succès de leurs politiques d’ouverture de données et plus particulièrement, les bénéfices directs et indirects. Ces aspects sont essentiels afin d’accélérer la publication de jeux de données sup-plémentaires et d’en encourager la réutilisation.
Abstract

5
Creating Value through Open DataAbstract Executive Summary
I https://ec.europa.eu/commission/2014-2019/ansip/announcements/speech-vice-presi-dent-ansip-bruegel-annual-meeting-productivity-innovation-and-digitalisation-which_en
“If I had to express my views about the digital future – that of Europe or indeed, of the whole world - I could do it with one word: data.”
Andrus Ansip, Vice-President Digital Single Market I


7
Executive Summary
Executive Summary Governments have a large number of basic data which can be of economic and social value to society as a whole. Along those lines, more and more European countries are developing policies to release this data as Open (Government) Data. Open Data refers to information that can be freely used, modified, and shared by anyone for any purpose. It must be available under an open licence and provided in a conveni-ent and modifiable form that is machine readable.
Within the European Union, key framework conditions for successful Open Data policy making have been set up. In doing so, the European Commission aimed at creating a “data value chain friendly” policy environ-ment. The objective is to put in place the “systemic” prerequisites for effective use and re-use of data through legal and soft law measures.
In 2003, the European Union (EU) adopted legislation to foster the re-use of Open Government Data in Member States via the Public Sector Information (PSI) Directive 2003/98/EC.II The main objective was to en-sure equal treatment of all potential re-users where the public sector body had released information for re-use. The PSI Directive was subsequently amended in 2013 by Directive 2013/37/EU.III With this amendment, the general principle was introduced that all in-formation accessible under Member State legislation is in principle re-usable. Also, ad-ministrative charges should in principle no longer exceed the marginal costs of making it available for re-use, excluding charging of the re-user for the production of the infor-mation. Re-use of information released for re-use by cultural institutions should also be subject to an obligation of equal treatment of all potential re-users while such institu-tions could continue to charge re-users in a way allowing them to recover the costs of production of the information.
SynthèseLes gouvernements disposent d’un grand nombre de données de base qui peuvent être d’une valeur économique et sociale. Dans ce sens, un nombre croissant d’États européens ont été amenés à développer des politiques visant à publier les données publiques plus systématiquement. Les don-nées ouvertes, ou Open Data en anglais, renvoient à des informations qui peuvent être librement utilisées, modifiées et parta-gées par toute personne à quelque fin que ce soit. Elles se doivent d’être disponibles sous licence ouverte, dans un format facile d’utilisation et modifiable. Enfin ces don-nées doivent être fournies sous une forme lisible par machine.
Au sein de l’Union européenne, des condi-tions-cadres essentielles à la réussite de l’élaboration de politiques de données ou-vertes ont été mises en place. Pour ce faire, la Commission européenne vise à créer un environnement favorable à l’ensemble de la chaîne de valeur des données. L’objectif est de mettre en place les conditions « sys-témiques » indispensables pour soutenir la publication et la réutilisation des données publiques. Ces instruments peuvent être autant législatifs que non contraignants.
En 2003, l’Union européenne (UE) a adopté de nouvelles dispositions législatives favo-risant la réutilisation de données publiques ouvertes dans les États membres. Il s’agit de la directive sur la réutilisation des infor-mations du secteur public 2003/98/CE.II
L’objectif principal était d’assurer l’éga-lité de traitement de tous les réutilisateurs potentiels, dans le cas où, l’organisme de service public concerné publierait des don-nées à des fins de réutilisation. La directive a été modifiée en 2013 par la directive 2013/37/UE.III Par cet amendement, le prin-cipe général mis en place est que toutes les informations accessibles, en vertu de la législation des États membres, soient en principe réutilisables. En outre, les charges
“Europe setting up a data value
chain friendly environment”
II http://eur-lex.europa.eu/LexUriServ/LexUriServ.do?uri=OJ:L:2003:345:0090:0096:en:PDFIII http://eur-lex.europa.eu/legal-content/EN/TXT/?uri=celex:32013L0037
7

8
“European countries moving
forward with Open Data at
different speeds”
The expected impact of the Open Data policies and the development of data portals is to drive economic benefits and further transparency. These benefits have been largely outlined by a number of stud-ies. However, few studies offer aggregate figures covering several different macro-economic indicators.
Within the context of the launch of the Eu-ropean Data Portal, the European Commis-sion wished to obtain further evidence of the quantitative impact of re-use of Public Data Resources. Thus, the aim of this study is to collect, assess and aggregate all eco-nomic evidence to forecast the benefits of the re-use of Open Data for all 28 Eu-ropean Member States and the European Free Trade Association (EFTA) countries (Norway, Iceland, Liechtenstein, Switzer-land), further referred to as EU 28+, for the period 2016-2020.
Several benefits of the use of Open Data are identified, and consist of direct and indirect benefits. Direct benefits are mon-etised benefits that are realised in market transactions in the form of revenues and Gross Value Added (GVA), the number of jobs involved in producing a service or product, and cost savings. Indirect eco-nomic benefits are i.e. new goods and ser-vices, time savings for users of applications using Open Data, knowledge economy growth, increased efficiency in public ser-vices and growth of related markets.
To provide an accurate estimate of the benefits of Open Data, one first needs to look at the Open Data Maturity per country and how this maturity has evolved. There are substantial differences between the EU28+ countries when measuring the pro-gress made so far in terms of Open Data. The first country to have an Open Data portal was Spain in 2009. They are also one of the frontrunners in terms of their Open Data policy. The most recent countries to have launched a portal are Croatia, the Czech Republic, Hungary, and Lithuania in 2015. To take these discrepancies into ac-
administratives devraient, en principe, ne pas dépasser les coûts marginaux de leur mise à disposition en vue de leur réutili-sation, et exclure donc, tout frais supplé-mentaire pour l’usager. La réutilisation des données publiées par les institutions cultu-relles doit également être soumise à une obligation d’égalité de traitement de tous les réutilisateurs potentiels. De telles ins-titutions pourraient continuer à percevoir des frais qui leur permettraient de couvrir les coûts de production de l’information.L’impact attendu des politiques de don-nées ouvertes et la mise en place de portails de données est bien entendu économique mais aussi d’accroître la trans-parence. Ces avantages ont été largement évoqués par un certain nombre d’études. Toutefois, peu d’études proposent des bénéfices chiffrés couvrant plusieurs indi-cateurs macroéconomiques.
Dans le cadre du lancement du Portail européen de données, l’impact quantitatif de la réutilisation des données ouvertes a été mesuré pour la période 2016-2020. L’objectif de l’étude est de recueillir, ana-lyser et agréger les preuves économiques des avantages de la réutilisation des don-nées publiques au sein de l’UE28+. L’UE28+ comprend les 28 Etats membres de L’UE et les pays de l’Association européenne de libre-échange (AELE) (Norvège, Islande, Liechtenstein, Suisse), ci-après dénommé l’UE28+.
Plusieurs avantages liés à l’utilisation des données ouvertes sont identifiés et consistent à la fois en des avantages di-rects et indirects. Les avantages directs sont traduits en valeur monétaire et com-prennent les transactions effectuées sous forme de recettes et de la valeur ajoutée brute, le nombre d’emplois nécessaires à la réalisation d’un service ou d’un produit, ainsi que les économies de coûts réalisées. Les avantages économiques indirects sont les effets induits du fait de l’utilisation de nouveaux biens et services, les gains de temps pour les usagers d’applications utili-sant les données ouvertes, la croissance de

Creating Value through Open DataStudy on the Impact of Re-use of Public Data Resources
9
count, a model was developed to classify the maturity of a country with regards to Open Data. Based on the scores on several indicators, countries were compared in terms of their maturity. This resulted in a matrix with different scores per country. A country can be classified as being either a Trend Setter, Follower, Advanced Begin-ner or Beginner.
The model showed that in 2005, 63% of the Member States could be classified as a Beginner whilst not a single country could be classified as a Trend Setter. These num-bers changed substantially over the past 10 years. In 2015, 31% of the countries can be classified as a Trend Setter where-as only 19% is still a Beginner. By 2020 all countries will have a fully operating portal. Additionally, countries will also introduce improvements to increase their Open Data Maturity. Thus by 2020, almost all EU 28+ Member States will have become Trend Setters.
Using the Open Data Maturity model of the EU28+ countries, the market size of Open Data has been calculated. A distinction can be made between the direct market size and the indirect market size. Together they form the total market size for Open Data. For 2016, the direct market size of Open Data is expected to be 55.3 bn EUR for the EU 28+. Between 2016 and 2020, the mar-ket size is expected to increase by 36.9%, to a value of 75.7 bn EUR in 2020. The total market value of Open Data is estimated between 193 bn EUR and 209 bn EUR for 2016 with an estimated projection of 265-286 bn EUR for 2020, including inflation corrections. For the period 2016-2020, the cumulative direct market size is estimated at 325 bn EUR. The cumulative total mar-ket size for Open Data is forecasted to be between 1,138 and 1,229 bn EUR.
l’économie de la connaissance, le renforce-ment de l’efficacité des services publics et la croissance des marchés connexes.Afin de fournir une estimation précise des bénéfices liés à l’ouverture des données, il convient d’abord de se pencher sur la matu-rité des politiques de « l’Open Data » en Eu-rope. Il existe des différences substantielles entre les 28+ pays de l’UE lorsqu’il s’agit de mesurer les progrès accomplis à ce jour en matière d’ouverture de données. Dès 2009, L’Espagne est le premier pays à lancer un portail de données publiques ouvertes. Les derniers pays à avoir ouvert un portail en 2015 sont la Croatie, la République Tchèque, la Hongrie et la Lituanie. Afin de tenir compte de ces différences, un modèle a été conçu pour classer les pays en fonction de leur maturité « Open Data». Les indicateurs sélectionnés ont donc permis de regrouper les pays en fonction de leur maturité : débu-tant, débutant avancé, suiveur et précurseur.
Le modèle de maturité « Open Data », a montré qu’en 2005, 63 % des États membres pouvaient être considérés comme des débutants, aucun pays ne fai-sait office de précurseur. Ces chiffres ont considérablement évolués au cours des 10 dernières années. En 2015, 31 % des pays sont maintenant dits précurseurs contre seulement 19% de débutants. D’ici à 2020, tous les pays bénéficieront d’un portail de données pleinement opérationnel. Par ail-leurs, les pays européens mettront égale-ment en place des améliorations visant à accroître leur maturité « Open Data ». Ainsi, à l’horizon 2020, la quasi-totalité des 28+ États auront atteint le stade de précurseur.
En se basant sur le modèle de maturité « Open Data », le volume du marché des don-nées ouvertes a été calculé. Il est important de différencier la taille du marché direct de celle du marché indirect. Ensemble, ils constituent la taille totale du marché. Pour l’année 2016, la taille du marché direct des données ouvertes devrait être de 55,3 mil-liards d’euros pour l’UE28+. Entre 2016 et 2020, la taille du marché direct devrait aug-menter de 36,9 %, pour atteindre une valeur
“Direct market size of Open Data is 55,3 bn EUR for 2016 and expected to grow by 36,9% by 2020 in the EU 28+”

10
Open Data cross-cuts through different sectors of the economy. So next to cal-culating the overall Open Data market size in 2020, it is interesting to know how large the influence of Open Data will be in specific market sectors. Public administra-tion is by far the sector that will gain the most from opening up data, with a value of 22 bn EUR in 2020. This confirms that the public sector is the first re-user of its own data. For agriculture, and the arts and entertainment sector, the benefits expected are smaller with 379 million EUR each. Open Data still has a lot of potential in these sectors but will take more time to reach the full potential.
The metric for the number of jobs aims at determining how many jobs will be creat-ed in the EU 28+ private sector that will be directly linked to the re-use of Open Data. This thus excludes staff working in public statistical offices and other government administrations. The forecasted total num-ber of direct Open Data jobs in 2016 has an upper bound of 75,000 jobs. By 2020, the upper bound provides a forecast of just under 100,000 direct jobs directly related to Open Data jobs. This equals a growth
Figure 1 – Total market size (high bound), split in direct and indirect size for EU28+in billions, 2016-2020Figure 1 - Marché total (fourchette haute), direct et indirect pour l’UE28+ en milliards, 2016-2020
“Between 2016 and 2020
25,000 jobs directly related to Open Data
will be created ”
€ 350
€ 300
€ 250
€ 200
€ 150
€ 100
€ 50
€ 0
2016 2017 2018 2019 2020
Bill
ions
Direct market size Indirect market size
de 75,7 milliards d’euros en 2020. La valeur totale de marché des données ouvertes, quant à elle, est estimée entre 193 mil-liards d’euros et 209 milliards d’euros pour 2016. D’ici à 2020, le marché total des don-nées ouvertes s’établirait entre 265-286 milliards d’euros, après correction de l’in-flation. Pour la période 2016-2020, le mar-ché direct cumulé des données publiques ouvertes est de 325 milliards d’euros. Pour la même période, the marché cumulé to-tal, direct et indirect, serait donc compris entre 1,138 et 1,229 milliards d’euros.
Les données ouvertes recoupent diffé-rents secteurs de l’économie. Il est donc
tout à fait pertinent de considérer la valeur des données ouvertes par secteur. L’admi-nistration publique est de loin le secteur qui profitera le plus de l’ouverture des données, avec un gain attendu de 22 mil-liards d’euros en 2020. Cela confirme que le secteur public est bien le premier ré-uti-lisateur de ses propres données. Dans les secteurs de l’agriculture, de l’industrie du spectacle et les arts, les bénéfices attendus sont moindres, avec une chiffre d’affaire de 379 millions d’euros pour chacun de ces
Total Market size Open Data EU28+

Creating Value through Open DataStudy on the Impact of Re-use of Public Data Resources
11
of 32% over a 5-year period. Per year, the increase in number of jobs is forecasted to grow at an average rate of 7.3%. Thus, in the period 2016-2020, almost 25,000 di-rect Open Data jobs are created.
Public administrations seek to further un-derstand the cost savings they can realise thanks to Open Data. Based on the fore-casted EU28+ GDP for 2020, whilst taking into account the countries’ respective gov-ernment expenditure averages, the cost savings per country can be calculated. The accumulated cost savings for the EU28+ in 2020 are forecasted to equal 1.7 bn EUR.
The metric efficiency gains has a more qualitative approach compared to the other three metrics. It offers a combina-tion of the insights around the efficiency gains of Open Data and real-life examples. Efficiency is an important factor in all ad-ministrations and companies and across all sectors. The aim of efficiency is to improve resource allocation so that waste is mini-mized and the outcome value is maxim-ised, given the same amount of resources. Three exemplar indicators are assessed in more detail: how Open Data can save lives, how it can be used to save time and how
Figure 2 – Direct market size of Open Data per market sector for EU28+ in millions, 2020Figure 2 - Volume du marché direct des données ouvertes réparties par secteur de l’économie pour l’UE28+ en millions, 2020
€ 379 € 10,045
€ 2,712 € 9,955
€ 6,738
€ 6,103 € 8,996
€ 8,289 € 22,111
€ 379
€ 0 € 5,000 € 10,000 € 15,000 € 20,000 € 25,000
AgricultureIndustry
ConstructionTrades & Transport
ICTFinance and Insurance
Real estateProfessional servicesPublic administration
Arts, entertainment, recreation
Millions
et qui sont directement liés à la réutilisa-tion des données ouvertes. Cet indicateur exclut donc les personnels travaillant dans les bureaux statistiques et autres adminis-trations publiques. Selon les prévisions, en 2016, le nombre total d’emplois directs liés à la réutilisation des données ouvertes est estimé à 75,000 emplois, en prenant la fourchette haute. D’ici à 2020, la fourchette haute offrirait une prévision d’un peu moins de 100,000 emplois, à nouveau directement liés à la réutilisation des données ouvertes. Cela équivaut à une croissance de 32 % sur une période de 5 ans. Par an, la hausse du nombre d’emplois devrait croître à un taux de 7,3 %. Ainsi, pour la période 2016-2020, près 25,000 emplois vont être créés.
En complément, Les administrations pu-bliques cherchent à mieux comprendre comment rationaliser leurs coûts grâce à l’utilisation des données ouvertes. Les économies potentielles peuvent être calculées en se basant sur le PIB de l’UE28+
secteurs. Ces secteurs étant moins matures en termes d’Open Data, l’exploitation des données ouvertes n’en est qu’à ses débuts. En ce qui concerne le nombre d’emplois créés, l’indicateur vise à mesurer les emplois nouvellement créés dans le secteur privé
Direct market size per sector

12
Open Data helps achieve environmental benefits. It is shown that Open Data has the potential of saving 1,425 lives a year (i.e. 5,5% of the European road fatalities). Furthermore, applying Open Data in traffic can save 629 million hours of unnecessary waiting time on the road in the EU. In conducting the macroeconomic analy-sis of the impact of the re-use of Open Data for Europe, several observations are
629 millionhours saved
5.5% lessroad fatalities
made. The majority of studies performed previously are ex-ante estimations. These are mostly established on the basis of sur-veys or indirect research and provide for a wide range of different calculations. No comprehensive and detailed ex-post evalu-ations of the materialised costs and bene-fits of Open Data are available.
Now that governments have defined Open Data policies, the success of these initia-tives should be measured. To do so, a se-ries of recommendations are put forward to help governments keep track of the di-rect and indirect benefits of their policies. This is key in further accelerating the pub-lishing of Open Data and encouraging its re-use.
pour 2020, tout en prenant en compte le pour-centage respectif de PIB que représentent les dé-penses publiques au niveau national. Les écono-mies, en matière de coûts, réalisées par l’UE28+ en 2020 devraient être de 1,7 milliards d’euros.Par rapport aux trois indicateurs précédents, une approche plus qualitative est suivie afin de mesu-rer les gains d’efficacité. Ces gains sont abordés sous la forme d’une étude de cas et offrent des exemples concrets d’application des données
ouvertes. L’efficacité est un facteur important pour toutes les administrations et entreprises, tous secteurs confondus. L’objectif est d’amé-liorer l’efficacité de l’attribution des ressources, de sorte que les pertes soient réduites au mini-mum et de maximiser la valeur, tout en utilisant la même quantité de ressources. Trois études de cas sont examinées plus en détail: comment les données ouvertes peuvent-elles sauver des vies, comment est-il possible d’utiliser les données ouvertes pour gagner du temps et enfin com-ment les données ouvertes contribuent au déve-loppement durable et à la préservation de l’envi-ronnement. Il est démontré que l’ouverture des données représente le potentiel de sauver 1,425 vies par an (soit 5,5 % des décès dus aux accidents de la route en Europe). En outre, l’application des données ouvertes dans le contexte de la circula-tion routière peut contribuer à faire économiser 629 millions d’heures de temps d’attente inutile sur les routes de l’UE.
En menant cette étude sur l’analyse macro-économique des effets de la réutilisation des don-

Creating Value through Open DataStudy on the Impact of Re-use of Public Data Resources
13
“Governments can accelerate their Open Data journey by measuring the success of their Open Data initiatives”
Several recommendations are made along those lines:
■ The costs and benefits of releasing data should be further detailed.
■ A marginal or free cost model for Open Data is needed.
■ Government Portals should maintain site analytics in order to obtain im-portant information on who uses the websites, which data sets are being downloaded and how many downloads take place.
■ On Open Data portals, feedback mech-anisms should be created.
■ Governments should conduct surveys into the re-use of Open Data in the private sector.
■ The work force should be empowered to make the most of Open Data.
nées ouvertes pour l’Europe, plusieurs consta-tations méritent d’être soulignées. La majorité des études réalisées précédemment offrent des estimations ex ante. Ces dernières sont pour la plupart établies sur la base d’enquêtes ou de recherche indirecte et offrent un large éventail de méthodes et calculs. Aucune éva-luation ex-post complète et détaillée des coûts et bénéfices de la publication de données ou-vertes par les administrations publiques n’a été réalisée à ce jour.
Alors que les différents gouvernements ont mis en place des politiques soutenant l’ouver-ture des données publiques, le succès de ces initiatives doit être évalué plus en détail. Pour ce faire, une série de recommandations est formulée, visant à aider les gouvernements à suivre les avantages directs et indirects de leurs politiques « Open Data ». Cette étape est essentielle pour accélérer encore la publica-tion de données ouvertes et à encourager leur réutilisation.
Plusieurs recommandations sont formulées dans ce sens:
■ Les coûts et avantages de la publication de données devraient être plus détaillés.
■ Un modèle de coût marginal ou entière-ment gratuit devrait être mis en place.
■ Les Portails de données ouvertes devraient comporter systématiquement une analyse de leur fréquentation, aussi appelée ana-lyse audience internet. Cela permettrait d’obtenir des informations importantes sur le comportement des visiteurs : quelles données sont les plus fréquemment télé-chargées, combien de téléchargement ont lieu, etc.
■ Sur les Portails de données ouvertes, les mécanismes de retour d’information doivent également être mis en place.
■ Les gouvernements devraient mener des enquêtes sur la réutilisation des données ouvertes par le secteur privé.
■ Les fonctionnaires et la main main-d’œuvre en général devraient être habilités à tirer le meilleur parti des données ouvertes.

14
€ 325 billiondirect market sizeEU28+ for 2016-2020
25,000jobs created
€ 1.7 bngovernment cost savings
Open Data jobs
2016 2020
75,000 100,000

Creating Value through Open DataStudy on the Impact of Re-use of Public Data Resources
more Open Data can help make
better decisions
Congestion
costs are1% of GDP
7,000 livessaved due toquicker response
5.5% lessroad fatalities

16
Table of contents
Abstract 4Executive Summary 7
1 Introduction 20 1.1 The European Data Portal 20 1.2 Objective of this study 21 1.3 Definitions 21 1.4 Overall structure of the study 23
2 Open Data gaining importance 24 2.1 Government regulation moving towards Open Data 24 2.2 Introduction of the European PSI Directive 24 3 Making use of Open Data 28 3.1 Data Value Chain 28 3.2 High value data domains 32 3.3 Understanding the impact of Open Data 35 3.3.1 Direct and indirect benefits 35 3.3.2 Data driven innovation 36
4 State of play of Open Data in Europe 38 4.1 EU Open Data Strategy 38 4.2 Revised PSI Directive and side initiatives 39 4.3 Current situation in the EU 28+ 42
5 ExistingstudiesoneconomicbenefitsofOpenData 48 5.1 General studies 48 5.2 Country specific studies 51 5.3 Lessons learned 54 5.3.1 Market size 55 5.3.2 Number of jobs 57 5.3.3 Cost savings 58
6 CalculatingeconomicbenefitsofOpenData 60 6.1 Definitions of metrics 60 6.2 Influence of indicators on the Open Data market 62 6.3 Calculation method 62 6.3.1 Data collection 62 6.3.2 Classification 63 6.3.3 Calculation techniques 65 6.4 Calculation of the metrics 65 6.4.1 Market size 65 6.4.2 Number of jobs created 66 6.4.3 Cost savings 67 6.4.4 Efficiency gains 68

17
7 The value created through Open Data 70 7.1 Market size 70 7.1.1 Value of market size 70 7.1.2 Market share as percentage of GDP 73 7.1.3 Open Data market size per sector 75 7.2 Number of jobs created 79 7.3 Cost Savings 84 7.4 Efficiency Gains 86 7.4.1 Life saving 89 7.4.2 Time saving 92 7.4.3 Environmental gains 95 8 Realising the value of Open Data 100 8.1 Understanding Open Data benefits 100 8.2 Moving forward with Open Data 102
Appendix I – Abbreviations Maturity graph 104Appendix II - Direct market size per EU28+ country 105List of references 106Listoffigures 110List of tables 111

18

19
1 Introduction
1 See https://ec.europa.eu/commission/2014-2019/ansip/announcements/speech-vice-president- ansip-bruegel-annual-meeting-productivity-innovation-and-digitalisation-which_en
“The digital economy revolves around data. It is the driving force behind those three main elements of productivity, innovation and digitalisation. Let’s not lose time being afraid - let’s build an open and vibrant data economy.”
Andrus Ansip, Vice-President Digital Single Market 1

20
Introduction
1
1.1 The European Data Portal Compared to other regions across the globe, the European Union (EU) Member States are generally characterized by an above-average participation of the public sector in the national economies, with com-mon estimates of the public sector’s stake in national GDPs ranging from 25% to 50% of their respective economies, depending on the country and on the metrics used.2 As a result, European administrations gener-ally invest a significant budget in the crea-tion of Public Sector Information (PSI), or Open Data. This information has a potential economic value that significantly exceeds its strict public sector utility.
The desire to realise the potential eco-nomic value of PSI is not new, neither at the national level, nor at the EU level. In the past, various Member States had already implemented legislation favouring open access / freedom of information rights, and permitted re-use of PSI to a certain extent. However, the nature and scope of these laws differed significantly: the scope of the information that could be requested varied from country to country, with different ex-emptions in each country. Some countries described re-use limitations in their national laws, whereas others did not describe any exact rules. Compensation schemes could also differ, ranging from free use to paid li-censing. Some data sets could also be made subject to competitive restrictions where data would only be made available to a lim-ited number of government partners (up to and including the granting of monopolies). The fragmented policy landscape was harm-
ful to the development of the European internal market, as aspiring re-users would need to assess on a country per country, case by case basis what information was available. Recognizing the significant eco-nomic potential that could be unlocked in the EU through a more proactive policy ap-proach, subsequent actions have gradually expanded the scope of the EU’s interven-tion, in order to create a well-functioning Open Data Economy, as a part of the EU’s general ambition of creating a Digital Single Market.
From a legal perspective, the adoption of the PSI Directive (in 2003,3 amended in 20134) has to some extent harmonized national rules on PSI reuse, thus creating a more even landscape. Thus, significant work has been done already in encouraging the development of a healthy Open Data ecosystem in the EU.5
One of the key requirements for a healthy Open Data ecosystem is still missing: the deployment of a pan-European data portal infrastructure, aggregating metadata re-cords of public data resources from all over Europe, and driving alignment with respect to data formats, metadata information, as well as the availability of metadata informa-tion in more than just the original language.
Along these lines, the European Commis-sion, in the framework of its Connecting Europe Facility (CEF) programme, launched the European Data Portal6 project in December 2014.
2 Seehttp://ec.europa.eu/enterprise/policies/innovation/files/epsis-2013_en.pdf,notablyp.11-133 http://eur-lex.europa.eu/LexUriServ/LexUriServ.do?uri=OJ:L:2003:345:0090:0096:en:PDF4 http://eur-lex.europa.eu/legal-content/EN/TXT/?uri=celex:32013L00375 See the national overviews on https://ec.europa.eu/digital-agenda/en/implementation-public-sector-information-dire
tive-member-states 6 Swww.europeandataportal.eu
“The desire to realise the
potential economic value
of PSI is not new”

Creating Value through Open DataStudy on the Impact of Re-use of Public Data Resources
21
The project consists of three parts: ■ Deploying a Pan-European Data portal;■ Fostering the uptake on the supply side
of public data resources;■ Fostering the uptake on re-use of public
data resources.
One of the objectives of the latter part of the project is to perform a macroeconomic analysis of the impact of the re-use of Open Data.
1.2 Objective of this studyMore and more countries are developing policies in the field of Open Data. The ex-pected impact of these policies, in line with broader innovation policies and strategies, is to drive monetary benefits and further transparency. These can be realised thanks to the development of innovative services and / or in realising economies of scale. Moreover, data has a marginal cost of zero, thus the re-use is likely to generate benefits.
The benefits of Open Data have been largely outlined by a number of studies. However, few studies offer aggregate figures covering several different macro-economic indicators. Within the context of the launch of the European Data Portal, the European Commission wished to ob-tain further evidence of the quantitative impact of re-use of Public Data Resources. The aim of this study is to collect, assess and aggregate all economic evidence to forecast the benefits of the re-use of Open Data for all 28 European Member States and the European Free Trade Association (EFTA) countries (Norway, Iceland, Liech-tenstein, Switzerland), further referred to as EU 28+, for the period 2016-2020. The production of macroeconomic indicators and their calculations will be further pre-sented within the report. The economic impact of Open Data will be assessed using the market size of Open
Data in euro and percentage of Gross Domestic Product (GDP), the number of jobs created through the availability of Open Data, the cost savings that can be reached in the public sector and efficiency gains for individual citizens (everyone).
1.3 DefinitionsUnderstanding the economic value of Open Data requires an initial understand-ing of the different characteristics and se-mantics. Different terms and notions are used to refer to public data resources. The most commonly used are Open Data, Pub-lic Sector Information and Open Govern-ment Data.
Open Data refers to the information that can be freely used, modified, and shared
by anyone for any purpose. It must be available under an open licence and provided in a con-
venient and modifiable form that is ma-chine readable. An open licence might say that people who use the data must credit whoever is publishing it (this is called at-tribution). It can also say that people who mix the data with other data have to re-lease the results as Open Data as well (this is called share-alike). These principles for Open Data are described in more detail in the Open Definition.7
Public Sector Information (PSI) is informa-tion collected by the public sector. The defi-
nition according to the OECD is that PSI is gener-ated, created, collected, processed, preserved, maintained, disseminat-
ed, or funded by or for the Government or public institution.8 It is also information that is dynamic and continually generated and readily usable in commercial applications. The European Directive on the re-use of
INFLUENCE
INFLUENCE
7 http://opendefinition.org/8 OECD(2006),p.8

22
PSI provides a common legal framework for a European market for government-held data (e.g. PSI).9 It is built around the key pillars of the internal market: free flow of data, transparency and fair competition.
Open Data is a sub-set of the commonly used term Big Data, which is a popular term to describe any collection of large information sets. The definition of Big Data as provided by Gartner is “Big Data is high-volume, high-velocity and high-vari-ety information assets that demand cost-effective, innovative forms of information processing for enhanced insight and deci-sion making”.10
The definitions of Open Data, Public Sec-tor Information and Big Data show a large over-lap. This overlap is also shown in Figure 3. The part where Public Sec-
tor Information is also open is commonly defined as Open Government Data.
Open Government Data is a subset of Public Sector Information as well as Open Data.11 Open Government Data can also be a subset of Big Data.
An example where PSI, Big Data and Open Data overlap, is in large public government data sets, for example weather or health data. When only Open Data and Big Data overlap, one could think of large data sets from scientific research or social media. Where Open Data does not overlap with PSI or Big Data, this usually entails business reporting or business data (e.g. customer complaints).
In the context of this study, the intention is to measure the impact of the re-use of public data resources in the public and private realm, including geospatial data. Hereafter public data resources which en-tail both Open Data and Public Sector In-formation will be referred to as Open Data (visualised as the dark orange field in Fig-ure 3). In general, the specific scope used within the EU Open Data Portal project is data published by public administrations or on their behalf. The focus is not on com-munity data.
INFLUENCE
9 http://eur-lex.europa.eu/LexUriServ/LexUriServ.do?uri=OJ:L:2003:345:0090:0096:EN:PDF 10 http://www.gartner.com/it-glossary/big-data 11 http://opendatahandbook.org/glossary/is/
Figure 3 – Boundaries of Open Data and Public Sector Information
Public Sector
Information
OpenGovernment
DataBig Data
Open Data

Creating Value through Open DataStudy on the Impact of Re-use of Public Data Resources
23
1.4 Overall structure of the studyThis study provides an assessment of the potential macroeconomic impact of the re-use of public data resources using a model-based assessment. It consists of four main parts. The first part contains a description of the global context on the emergence of Open Data (Chapter 2) and the use that is being made of Open Data (Chapter 3). This part also looks at the EU state of play with regards to Open Data
(Chapter 4). The second part of this study offers an overview of the different studies that are done so far in the field of quanti-fying the benefits of Open Data (Chapter 5). The third part sets out the approach taken (Chapter 6). Then, the results of this study are presented in the form of macro-economic calculations (Chapter 7). Finally, the last part focuses on how the benefits of Open Data can be realized (Chapter 8).
Structure of the report
Open Data gainingimportance
Calculating the economicbenefits of Open Data
The value createdtrough Open Data
Existing studies on economic benefits of Open Data
Realising the value of Open Data
Making use ofOpen Data
State of play ofOpen Data in Europe
24
Open Data gaining importance
2
2.1 Government regulation moving towards Open Data
Open Data has gained a very prominent role in today’s society. People increasingly rely – often even while they are unaware of it – on Open Data in their everyday lives. Today’s technology allows for a new way to provide basic data. Applications on smart phones for weather forecasts, navigation, restaurant finders and the like are made based on Open Data. Governments have a huge number of basic data which can be of economic and social value to society as a whole.12 Open Data bridges the gap be-tween government and citizens in terms of information. As Pollock rightly states ‘the supply of basic information ‘structure’ has become essential to the information econ-omy of the 21st century’. 13
The increase of information sharing via the internet con-tributed to a political focus on this development leading towards the introduction of
the European PSI Directive in 2003. In the second half of the last decade, civil society – relying on the Freedom of Information right – had for several years been putting pres-sure on governments to systematically make
government data available in machine-read-able formats. A machine-readable format is data (or metadata) which is in a format that can be accessed and processed by a com-puter. Freedom of Information laws allow access by the general public to certain types of data held by national governments.
Open Data can be seen as an important part in strengthening citizen right, as it will make it much easier to obtain access to the infor-mation you want when it is already available online for free. As a result of the release of more data, grassroots initiatives such as TheyWorkForYou in the UK14 – which tracks the activities and initiatives of members of UK’s Parliaments and assemblies – and the equivalent at US level GovTrackUs 15 – which tracks the bills and activities of US Congress members – emerged. These initiatives con-tributed to bringing further transparency to the democratic process.
2.2 Introduction of the European PSI
DirectiveSince 1998, the European Commission has formulated an Open Data Policy via a Green Paper on Open Data.16 Based on an assess-ment of the state of play of Open Data in the EU Member States and the situation in the United States (US), the fundamental role of Open Data was acknowledged for the proper functioning of the European in-ternal market. The initial objective set out in this Green Paper was to make informa-tion which is already available more clear and easily accessible via electronic media. This set the grounds for further debates at European level regarding Open Data.
12 Uhlir,P.(2009),p.313 Pollock,R.(2009),p.214 http://www.theyworkforyou.com/ 15 https://www.govtrack.us/16 European Commission (1998)
This chapter sets out the general context of Open Data with regards to its emergence and relevance. The emergence of Open Data will be described from a global perspective. The first part describes how Open Data came to play a growing role on the governmental agenda and the second part is focused on the creation of a European framework around Public Sector Information.
INFLUENCE

Creating Value through Open DataStudy on the Impact of Re-use of Public Data Resources
25
In 2003, the EU issued legislation to govern the publication of Open Government Data in Member States via the so-called Public Sector Information (PSI) Directive 2003/98/EC.17 The main objective was to enable better access to Open Data by:
The European PSI Directive was estab-lished on a minimum harmonisation basis allowing Member States leeway in the interpretation and implementation of the framework. The European Directive established framework18 rules regarding availability, accessibility and transparency of Open Data in Europe. In addition, it was recommended to have a standard elec-tronic licence for the re-use of Open Data and to have a tool to find the relevant data sets via a list of portal websites. As for the payment regime, the European Directive stated that it does not prevent differen-tiated charging policies.19 Recital 15 indi-cated that “...the Member States should encourage public sector bodies to make documents available at charges that do not exceed the marginal costs for repro-ducing and disseminating the documents”. Nevertheless, in the European Directive it-self, Member States are allowed to apply charging mechanisms which should not ex-ceed the production and distribution plus a reasonable return on investments. As a result, different regimes have been estab-
lished from full cost recovery, via partial cost recovery, to a marginal cost model.20
The upswing of Open Data has particularly gained momentum at the beginning of the 21st century as politicians in the US and UK, mainly, became aware of the need to improve access to basic government data. Specific initiatives followed suit, such as the UK Power of Information report 21 and the Open Government Directive from American president Obama, established on his first day in office in 2009 stating that there is a need to “create an unprecedented level of openness in Government”.22 Following this, two important milestones were launched: a data portal called data.gov was established in the US in May 2009 and its equivalent in the United Kingdom (UK), data.gov.uk, in January 2010.
These initiatives have set a process in mo-tion towards more political awareness not only among national public authorities, but also at the World Bank and the Organisa-tion for Economic Co-operation and Devel-
17 http://eur-lex.europa.eu/LexUriServ/LexUriServ.do?uri=OJ:L:2003:345:0090:0096:en:PDF 18 Art. 1 of Directive 2003/98/EC19 Recital 19 of Directive 2003/93/EC20 Vriesetal.(2011),p.2321 Mayo and Steinberg (2007)22 https://www.whitehouse.gov/open
Stimulating the further development of a European Market for Open Data based services
Enhancing the cross-border use and application of Open Data in business processes
Encouraging competition in the internal market
Addressing the differences in rules and practices between Member States

26
opment (OECD). Governments around the world are making political statements and commitments towards an open govern-ment and Open Data. In 2011, an interna-tional platform called Open Government Partnership was created to improve the quality of public services via Open Data to become more transparent, accountable and responsive to citizens.23 Ever since, one can discern an increase in the number of na-tional and sub-national Open Data portals, digital and eGovernment strategies and open government declarations around the world.
The UK and Spain set the example for many European countries towards open-ing up government data via data portals. Others followed, like Norway, France, Italy and Estonia. The approaches taken to pub-lish Open Data to citizens differ. Two main streams can be observed: firstly, the ap-proach whereby the access to and re-use of Open Data is unrestricted and on a free or marginal cost basis which is mainly used in US, Canada and Australia, the so-called open access model. The second approach allows public sector bodies to charge costs for the access and re-use of Open Data which was applied by many European coun-tries. The charging for data is still a lively topic, but this will be discussed in more de-tail in Chapter 4.2.
This chapter focused on the growing influ-ence of Open Data on a global level. The historical perspective of Open Data legisla-tion was discussed as well as the introduc-tion of the European PSI Directive. The next chapter will further focus on how Open Data can be re-used, and what impact this re-use generates.
23 http://www.opengovpartnership.org/about/mission-and-goals
“The need to improve access
to basic government
data”

Creating Value through Open DataStudy on the Impact of Re-use of Public Data Resources
27

28
The policy changes around Open Data and the fact that more data sets become avail-able created a gradual upsurge of the ap-plication and re-use of Open Data. More companies, and to a limited extent SMEs, started using Open Data as (one of their) raw materials.24 The possibilities of re-us-ing Open Data have such a potential that Big and Open Data are considered togeth-
er with ICT as this era’s ‘general purpose technologies’.25 This type of technology is an invention that forms a prerequisite for other inventions and imposes a substantial and long term impact on wealth and qual-ity of life. They have potential uses in the economy, room for cost cutting techno-logical improvement and are complemen-tary to other innovations. One of the many questions evolving around Open Data is: what kind of Open Data is available, where can it bring value and what kind of products and services can be produced?
3.1 Data Value ChainOpen Data is, in the context of this study, information that can be freely used, modi-fied, and shared by anyone for any pur-
3
Making use of Open Data
24 http://cordis.europa.eu/fp7/ict/content-knowledge/docs/open-data-re-use-incubator4-3-a.pdf 25 DemosEurope&WISE(2014),p.8.26 CapgeminiConsulting,basedon:MEPSIR(2006),p.46andhttp://ec.europa.eu/information_society/newsroom/cf/dae/
document.cfm?doc_id=3488
This chapter explores in which ways Open Data is re-used. The Data Value Chain can serve as a basis to understand different types of re-use. Data domains that are recog-nized as having the highest commercial value are equally discussed before exploring the direct and indirect benefits of Open Data. Finally Data driven innovation is discussed.
Figure 4 - Open Data Value Chain 26
Public Sector
Private Sector
Data creationData
validationData
Aggregation
Data Storage and Preservation
Public task
Added value by public content holder
and/or
Added value by re-user
(end) User
Data AnalysisData Servicesand Products
Aggregatedservices

Creating Value through Open DataStudy on the Impact of Re-use of Public Data Resources
29
pose. It must be available under an open licence and provided in a convenient and modifiable form that is machine readable. To create value from Open Data; the first step is for data to be created. The next steps, in which Open Data is processed, are described in the Open Data value chain as shown Figure 4.
Within the Data Value Chain, data needs to be validated after it is collected or created. After these first steps, the data is aggre-gated. When the data is released via a por-tal or bought by a private company, it can be analysed. Analyzing the data will make it possible to combine different informa-tion or make visualizations. This will lead to the creation of data services and products. These services can be aggregated one step further. During this entire process, data needs to be stored and preserved. This can be done by different individuals or depart-ments, but also by centralizing the data in a separate department.
Often, Open Data is thought of as unpro-cessed raw public data that is easy to trans-fer and re-use by the private sector. How-ever, this is an oversimplification according to Pénin. Open Data exists in many forms
and degrees.27 Three forms of Open Data can be distinguished and are related to the Data Value chain:
■ Raw data corresponds to quantities or other quantitative or qualitative attrib-utes derived from observation, experi-ment, measurement or computation. The data are not structured, contextu-alised nor commented.
■ Information corresponds to a set of contextualised and structured data, the producer’s intention being to make them meaningful.
■ Knowledge corresponds to cognitive appropriation of the information by an individual who organises, synthesises and/or summarises it to make it more readily understandable.
Within the Data Value Chain, several ar-chetypes are distinguished by the World Bank,28 both in the public and the private sector. Data creation is done by the Sup-pliers. The organisations that collect and aggregate the Open Data are called the Aggregators. Individuals or companies that analyse the data and create services and products can be divided into Developers and Enrichers.
27 Pénin,J.(2011),p.228 http://www.worldbank.org/content/dam/Worldbank/document/Open-Data-for-Economic-Growth.pdf
Figure 5 - Data Value Chain Archetypes
Data Information
Suppliers
Knowledge Services Added Value
Data creationData
validationData
AggregationData Analysis
Data Servicesand Products
Aggregatedservices
Aggregators Developers/Enrichers

30
themselves, they also provide cost-effec-tive and easy-to-access services for both data suppliers and data consumers.
The Data Value Chain shows the potential value that can be reached by making Open Data available for re-use. Ideally, public bodies make their Open Data available for free, so no payment is received. How-ever, both the public and / or the private sector create data services and goods, as well as aggregated services for (end) us-ers. The products and services that can be made out of Open Data are manifold. For these services and products, a payment is received. In this way, value is created by making use of Open Data. The aim of this study is to collect evidence to forecast the size of this value.
Developers are organisations and individ-ual developers who design, build and sell web or smart phone applications to deliver government Open Data to customers (nor-mally in the private sector) in attractive and informative ways, sometimes in com-petition with “official” applications.
Enrichers are organisations which use Open Data to gain new or better insights that they can deliver in services or products to their customers – often completely new services which could not exist without Open Data.
The last archetype are the Enablers, which provide platform and technologies that other businesses and individuals use. They are a vital part of the Open Data Value Chain – while being revenue generating
29 CapgeminiConsulting,basedon:MEPSIR(2006),p.46
Figure 6 – Payments within the Data Value Chain 29
Payment
Services and ProductsOpen data
Public body (end) UserPublic and/or
Private Sector

Creating Value through Open DataStudy on the Impact of Re-use of Public Data Resources
31
Open Data can be used for numerous dif-ferent purposes. The products and ser-vices can originate from the public and the private sector, as well as from the non-profit sector. Examples of public sec-tor Open Data initiatives are ‘Lexbase’, and ‘Where do I live’.
Lexbase 30 Lexbase is a web service that pro-vides public information from Swedish courts and other authori-ties. On the website judgments in criminal and civil cases concerning individuals and companies can be found. The database is updated with new judgments and decisions every day. The website is used to provide citizens with information about the criminality in different areas, e.g. their neighbourhood.
Diabetes Risk Checker 32 The Diabetes Risk Checker which is developed by UK doctors and aca-demics. It indicates a citizen’s risk of developing type-2 diabetes in the next ten years by asking a se-ries of simple questions. Being able to predict if citizens are at risk of diabetes should lead to a change in behaviour.
Res I STHLM33 Aimed at simplifying citizen’s trav-elling in Stockholm (Sweden), the application Res I STHLM was de-veloped. Available for IOS and An-droid, this application collects pub-lic transport information to provide users with planning their journey in Stockholm. The app uses timeta-bles and disturbance information from Stockholm Public Transport. By specifying from and to where you want to travel within the Stock-holm region, you get proposals for journeys including the subway, commuter trains, local trains, buses and boats among others.
Where do I live 31 Where do I live is a Lithuanian tool that provides Lithuanian citizens with information about their neigh-bourhood in terms of pollution, noise, crime levels, housing prices, schools, kindergarten, average es-tate and utility costs.
Beside the public sector initiatives, also a lot of examples of a private good or service based on Open Data exist. Two ex-amples are the ‘Diabetes Risk Checker’ and the ‘Res I STHLM’.
30 https://www.lexbase.se/ 31 www.kurgyvenu.lt32 http://diabetesriskchecker.com/33 http://sthlmtraveling.se/

32
Major Projects Authority 35 Before 2010, two thirds of the ma-jor projects in the UK ran over time and over budget. Some major pro-jects had no clear senior responsi-ble owner, unclear accountability to ministers and Parliament, and poor information on the delivery of that project. Now a project delivery function is introduced with central leadership and oversight provided by the Major Projects Authority. It is driving forward a culture of bet-ter management information with clear lines of accountability. It’s the approach that is being put to work across the government’s £488 bil-lion (€691 billion) major projects portfolio. Last year better project management saved the taxpayer £3.3 billion (€4.7 billion).
NosDéputés.fr 36 NosDéputés.fr is a site that seeks to enhance the parliamentary ac-tivities of Members of the French National Assembly. By synthesizing the various legislative and supervi-sory activities of the elected gov-ernment of the nation, the site tries to give citizens new tools to under-stand and analyze the work of their representatives.
The non-profit sector also uses Open Data to create services to, for example, better monitor political activity.34 Multiple exam-ples exist of such initiatives, like the ‘Major Projects Authority’ and ‘NosDéputés.fr’.
34 Granickas,K(2013),p.1935 https://www.gov.uk/government/speeches/future-of-public-services-reform-matthew-hancock-speech 36 http://www.nosdeputes.fr/37 https://ec.europa.eu/digital-agenda/en/news/commission-notice-guidelines-recommended-standard-licences-datasets-
and-charging-re-use 38 https://www.gov.uk/government/uploads/system/uploads/attachment_data/file/207772/Open_Data_Charter.pdf39 Lateral Economics & Omidyar Network (2014) 40 MEPSIR,2006
3.2 High value data domainsAs demonstrated briefly in the previous section, there are many possibilities for the re-use of Open Data. Nevertheless, not all data sets have been considered as having the same potential for re-use. Data sets can be categorized into different data domains, from two different perspec-tives: a government perspective or a user perspective. For example, the European Commission named five priority domains for release.37 Yet, the G8 created a char-ter including fourteen domains.38 Another study, the Lateral Economics & Omidyar Network used the G20 Agenda Items for the Brisbane meeting in 2014 to identify domains,39 whereas the MEPSIR study has defined six main domains.40 There is thus no ultimate way of classifying Open Data, as data is produced and collected through-out all functions of government.
Not every data domain has access to infor-mation of the same economic potential. The OECD (2006) report used a sliding scale to indicate the commercialisation potential for categorising Open Data, as is shown in Figure 7.
The domains on top of Figure 7 are recog-nized as having the highest commercial value. Numerous services and products based on data sets from these domains are already commercially available. On the low-er domains, Open Data is already available. However, not always commercial services and products exist for these domains.

Creating Value through Open DataStudy on the Impact of Re-use of Public Data Resources
33
41 OECD (2006)
Figure 7 – PSI and public content domains 41
Geographic information
Commerical Re-use of Open Data
High
Low
Meteorological and Environmental information
Economic and Business information
Social information
Traffic and Transport information
Tourist and Leisure information
Agricultural, Farming, Forestry and Fisheries information
Natural Resource information
Legal System information
Scientific information and Research data
Educational content
Political content
Cultural content

34
Geographic information is recognized as the domain with the highest commercial value and can be used in all the other thir-teen different data categories using maps to create visualisations. The cultural do-main is a very specific category where it is easy to understand the content. Yet, so far the cultural content seems to be the most difficult to commercialize, despite recent efforts to promote cultural aspects. It is possible to list all cultural activities in a region to bring information from multiple sources together, but it will not necessarily generate revenue.
Open Data Paris 43 In Paris, having a coffee (or ‘café’) is part of the citizens’ culture. The café culture in France goes back centuries, cafes have always been a gathering place for intellectuals to meet and debate philosophical is-sues. A dataset is created that lists all cafés in which a cup of coffee costs only €1,-.
Curtain Up! 44 Curtain up! is a Polish app for aggre-gating and filtering Warsaw cultural events? Curtain Up! Will become a democratic platform were both mainstream and alternative events could be added and easily searched through by users. The main source for data is the city of Warsaw Open Data platform. The next things coming are partnerships with cul-tural institutions, and a carefully crafted promotion plan.
It should be noted that there are no clear de-marcation lines between domains in general. Deloitte made a study of data.gov.uk on the sectors most conducive to Open Data. The sectors identified are shown in Figure 8. In this research, for instance culture, named arts has been combined with sports and recreation. Geospatial data can be used in fifteen different sectors according to the study, whereas government spending is only used in three sectors. Certain Open Data domains are thus re-used more often to generate new products and services and are likely to generate a higher impact, although all data domains are interesting for specific companies. It should be noted that there are no clear demarcation lines between domains in general. Deloitte made a study of data.gov.uk on the sectors most condu-cive to Open Data.45 The sectors identified are shown in Figure 8. In this research, for instance culture, named arts has been com-bined with sports and recreation. Geospatial data can be used in fifteen different sectors according to the study, whereas govern-ment spending is only used in three sectors. Certain Open Data domains are thus re-used more often to generate new products and services and are likely to generate a higher impact, although all data domains are inter-esting for specific companies.
42 http://blindsquare.com/ 43 http://parisdata.opendatasoft.com/page/home/ 44 https://konkurs.danepowarszawsku.pl/pl/projekt/kurtyna-w-gore 45 Deloitte (2013)
BlindSquare 42 In Finland an application was devel-oped using a data-driven approach. It is aimed at people that are blind or visually impaired. It describes the environment, announces points of interest and street intersections as you travel. All functions can be ac-cessed through an audio menu to allow navigation and it is possible to add your favourite destinations as well.

Creating Value through Open DataStudy on the Impact of Re-use of Public Data Resources
35
As already stated in the Vickery Report of 2011, individual domains are neither ex-haustive nor exclusive.47 Information on environment can also be a part of science and technology data. The focus in recent studies that looked at it from a commer-cialisation perspective has mainly been on economic value of information on geo-spatial, energy, health, transport and en-vironment. However, given the different ways of categorisation it is not always easy to assign the impact of re-use exclusively to one single domain.
3.3 Understanding the impact of Open Data
To understand the impact of Open Data, one can look at the direct and indirect benefits realised by making government data avail-able for free. Also, one can look at the inno-vation that is being triggered by Open Data.
3.3.1 DirectandindirectbenefitsThe effects of the use of Open Govern-ment Data can be translated into direct benefits and indirect benefits. This direct and indirect impact of provision and re-use of Open Data can take many forms and take place at different stages of the Open Data Value Chain: 48
■ Direct benefits are monetised benefits that are realised in market transactions in the form of revenues and Gross Value Added (GVA), number of jobs involved in producing a service or product and cost savings. These benefits are mainly realized by direct re-users, the so-called data enrichers.49
■ The indirect benefits of the generation and re-use of Open Data can be divided into economic, political and social indi-rect benefits.50 Economic indirect ben-efits can translate into new job poten-tial, new goods and services, knowledge
Figure 8 – Numbers of sectors to which the data is applicable as identified by Deloitte 46
0
2
4
6
8
10
12
14
16
Geospatia
l
Environm
ent
Econom
y
Transp
ort
Energy, r
esourc
es and util
ities
Demogra
phics
Agricultu
re
Business
Planning
Crime and ju
stice
Health ca
re and so
cial c
are
Social c
onditions
Arts, s
ports, r
ecreatio
n
Population health
Educatio
n
Housing
Labour mark
et
Sectors most applicable to Open Data
46 Deloitte (2013)47 Vickery,G.(2011),p.1048 Granickas,K(2013),p.449 See also section 3.1 - Data Value Chain50 Granickas,K(2013),p.15

36
economy growth, increased efficiency in public services and growth of related markets. At the political level, one can speak of increased transparency and ac-countability, civic participation, political awareness and access to information. From a social point of view, benefits can take the form of increased social inclu-sion and empowerment, civic participa-tion, access to information and support to personal decision-making capabilities (for example, if someone’s life is saved by using open health data).51 Indirect benefits are experienced mostly by cus-tomers / users of products and services offered by the direct users.
Open Data has and will continue to have a strong influence on the economy in many ways. However, it seems difficult to iden-tify the impact of such technological trans-formation the moment it occurs. Often it is only after several years that the real im-pact can be discerned.52 Nevertheless, cer-tain steps have already been taken to gain the potential of Open Data also at Euro-pean level.53 The next section will provide insight in the innovation that is triggered by Open Data. 3.3.2 Data driven innovationData is an asset, but the real economic value comes from the insights which are extracted from it.54 The mere availability of Open Data alone does not trigger the creation of new and innovative products and services.55 Innovation is defined by Jetzek et al. (2013) as the implementation of a new or significant improved product (good or services) or process, a new mar-keting method or a new organisational
51 Granickas,K.(2013),p.1352 DemosEurope&WISE(2014),p.953 http://www.worldbank.org/content/dam/Worldbank/document/Open-Data-for-Economic-Growth.pdf 54 DemosEurope&WISE(2014),p.5955 Worldbank (2014)56 Jetzeketal.(2013a),p.757 Janssen,K.(2012)58 Koski,H.(2011),p.659 DemosEurope&WISE(2014),p.14andp.6360 DemosEurope&WISE(2014),p.47
method in business practices’ workplace organisation or external relations. Most of the time there is a need, an idea for a product or service, and the ‘re-users’ need certain data. The data can be Open Data or other data.
Open Data needs to be available, so that in turn it can be re-used, otherwise it would be a lost opportunity. Re-users demand access to full data sets to be used for any purpose.57 Moreover, the availability of Open Data for free – or at a marginal cost price at most – is further likely to foster in-novation among the re-users and facilitate the use for developing new products and services.58
Thus, it could be argued that public author-ities need to make as much data sets avail-able in case the private sector would like to use certain data. This is also in line with the so-called negative data freedom paradigm that determines what data should by de-fault be published and it is only necessary to determine what data shall not be pub-licly open and which ways of using should be prohibited.59 The ability to create in-novative products and services cannot be maximized if certain data is unavailable. It should also be noted that Open Data is often used in combination with other data sets (Big Data, private data, etc., for exam-ple in (financial) risk modelling tools) which leads to an increase in value of each data source.60 In addition, ideas to innovate products and services can lead to more competition and trigger further innova-tion and use of Open Data.61
“Open Data has and will continue to
have a strong influence on
the economy in many ways.”

Creating Value through Open DataStudy on the Impact of Re-use of Public Data Resources
37
61 Koski,H.(2011),p.662 Jetzeketal.(2013a),p.863 Jetzek et al. (2014)64 United Nations (2014
In the end, data driven innovation posi-tively affects value and can have economy-wide effects through the generation of new knowledge, new processes, services, products and businesses. Innovation brings about the use of new combinations of re-sources, which in this case is focused on technological connectivity and Open Data, new methods, new products and services which lead to the transformation of mar-kets and industries and increase value.62
Next to making data sets available, it is also necessary to ensure that people have the motivation and ability to make use of Open Data, in turn leading to the design of new products and services.63 The right governance mechanisms need to be in place, as well as the correct insight in the user’s perspective.64 Therefore, interaction via feedback mechanisms, and other inter-action with users, is important. The data portals of Spain and the UK have already implemented such mechanisms.
The policy changes around Open Data and the fact that more data sets become avail-able, opened opportunities to make use of Open Data. More companies have started using Open Data by entering the Data Val-ue Chain. The possibilities of re-using Open Data have commercial potential. This chap-ter discussed the ways of how to make use of Open Data. The next chapter will fur-ther focus on the current state of play in Europe regarding Open Data.

38
re-use’. Shortly after, in December 2011, this was made more specific in the form of a three pack “Open Data Strategy”68 69 70 which consisted of:
4
State of play of Open Data in Europe
This chapter will give an overview of the Open Data policy and initiatives in the current 28 European Member States and the EFTA countries Norway, Iceland, Liechtenstein and Switzerland, the EU28+.
4.1 EU Open Data StrategyIn the years after the introduction of the European PSI Directive in 2003, Open Data stayed on the political agenda of the EU. In 200965 and 2011,66 reviews took place of the implementation and application of the PSI Directive at Member States’ level. On both occasions, the general conclusion was that some progress has been made. However, difference in Member States’ ac-tions and initiatives caused fragmentation, regulatory uncertainty and created distor-tive competition in the internal market.
In 2010, the European Commission issued the Digital Agenda for Europe.67 One of the action points on the Digital Agenda is to ‘Open up public data resources for
New European Commission rules on re-use of Commission documents
A proposal for a revision of theEuropean PSI Directive
A European Commission Communication on PSI
65 European Commission (2009)66 Homer(2013),p.2167 European Commission (2010)68 European Commission (2011a)69 European Commission (2011b)70 European Commission (2011c)
Creating Value through Open DataStudy on the Impact of Re-use of Public Data Resources
39
The European Commission’s Communica-tion on PSI reviews existing initiatives in the area of Open Data, identifies barriers and proposes concrete steps to unlock the potential of Europe’s public sector resources, including both legislative and non-legislative instruments. In addition, non legislative actions were taken in the light of the Open Data Strategy. These in-cluded various projects, for example, pub-licdata.eu,71 HOMER,72 Open Data Support,73 and LAPSI.74
The proposal for a revision of the Euro-pean PSI Directive mainly aimed at further opening up the market for services based on Open Data, by including new bodies in the scope of application of the European PSI Directive such as libraries, museums and archives; capping the fees that can be charged by public authorities at the mar-ginal costs of reproduction and dissemina-tion by default; creating a right of re-use; introducing independent oversight over re-use rules in the Member States; making machine-readable formats for information held by public authorities the norm.75
4.2 Revised PSI Directive and side initiatives
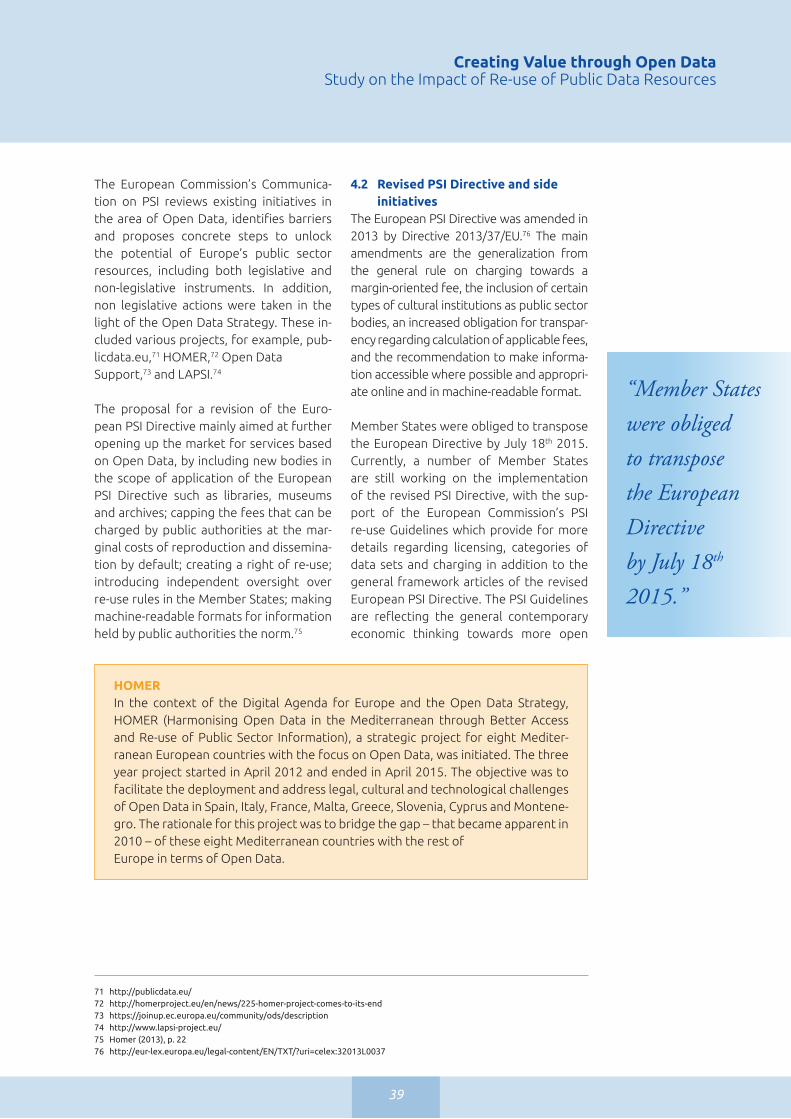
The European PSI Directive was amended in 2013 by Directive 2013/37/EU.76 The main amendments are the generalization from the general rule on charging towards a margin-oriented fee, the inclusion of certain types of cultural institutions as public sector bodies, an increased obligation for transpar-ency regarding calculation of applicable fees, and the recommendation to make informa-tion accessible where possible and appropri-ate online and in machine-readable format.
Member States were obliged to transpose the European Directive by July 18th 2015. Currently, a number of Member States are still working on the implementation of the revised PSI Directive, with the sup-port of the European Commission’s PSI re-use Guidelines which provide for more details regarding licensing, categories of data sets and charging in addition to the general framework articles of the revised European PSI Directive. The PSI Guidelines are reflecting the general contemporary economic thinking towards more open
71 http://publicdata.eu/72 http://homerproject.eu/en/news/225-homer-project-comes-to-its-end 73 https://joinup.ec.europa.eu/community/ods/description74 http://www.lapsi-project.eu/75 Homer(2013),p.2276 http://eur-lex.europa.eu/legal-content/EN/TXT/?uri=celex:32013L0037
HOMER In the context of the Digital Agenda for Europe and the Open Data Strategy, HOMER (Harmonising Open Data in the Mediterranean through Better Access and Re-use of Public Sector Information), a strategic project for eight Mediter-ranean European countries with the focus on Open Data, was initiated. The three year project started in April 2012 and ended in April 2015. The objective was to facilitate the deployment and address legal, cultural and technological challenges of Open Data in Spain, Italy, France, Malta, Greece, Slovenia, Cyprus and Montene-gro. The rationale for this project was to bridge the gap – that became apparent in 2010 – of these eight Mediterranean countries with the rest of Europe in terms of Open Data.
“Member States were obliged to transpose the European Directive by July 18th 2015.”

40
benefit gain for governments to provide data at a marginal cost. This results in a tendency towards the marginal cost model in more countries.
Some researchers even go so far and indi-cate that ‘cheap data yields higher (eco-nomic) growth’ which applies specifically to a Finnish Study done by Koski.81 She con-cluded in her study that business growth is 15% higher in countries where public sec-tor geographic data is freely available or sold at a considerably reduced price. The study argues that there is a link between the pricing of geospatial Open Data and small to medium sized firms’ sales growth. The estimations show that positive growth impact materializes already one year af-ter switching to the marginal cost pricing scheme, but a stronger boost to the firm growth takes place with a two year lag. Interestingly, marginal cost pricing has
and interoperable licensing systems, the priority data sets for release and the low-ering of charges in the direction of a mar-ginal cost model.77 The priority data set categories that are identified for release are Geospatial data, Earth observation and environment, Transport data, Statistics and Companies data. The idea for public sector bodies of EU Member States is to charge no more that the marginal cost of reproducing, providing and dissemination of data sets.
Some EU Member States are still scepti-cal about providing data at marginal or no costs. The price elasticity of demand for Open Data is high: public sector agen-cies in various countries have witnessed a strong growth in demand for information they provide after switching from cost-based pricing of Open Data to free or max-imum marginal cost priced information.78 Several studies and case examples have shown that cost-based pricing models do not bring cost savings to public authorities in the long run while free or marginal cost models are more beneficial.
It should be noted that in most cases the cost-recovery model creates barriers to the access and the re-use of Open Data.79 Especially economically less viable people (e.g. citizens, students, researchers with limited budget, start-ups etc) will not make use of Open Government Data if a fee is requested to obtain the data. When public authorities decide to move towards a free or marginal cost model, more downloads can be discerned and other benefits such as an increase of the numbers of start-ups and greater return on investments can ac-crue. Governments would then witness in-direct benefits out of downloads, such as an increase in tax revenues on sold prod-ucts and services. As such there is an actual
Pettifer 80 In 2011, Pettifer argues that the fundamental reason for the market size difference between the US and European meteorological markets are the different Open Data pricing schemes adopted in the US and in Europe. He states that freely availa-ble data in the US resulted in a $1.4 billion (EUR 1.28 billion) market in 2006 in value-added meteorologi-cal products of all types in the US, while the corresponding market size in Europe with costly Open Data was $372 million (EUR 339 million). The annual growth of me-teorological markets in the US and Europe were respectively 17 and 1.2 percent measured since 2000.
77 http://eur-lex.europa.eu/legal-content/EN/TXT/?uri=uriserv:OJ.C_.2014.240.01.0001.01.ENG 78 Koski,H.(2011),p.679 Trojette (2013)80 Pettifer,R.(2011)81 Koski,H.(2011)

Creating Value through Open DataStudy on the Impact of Re-use of Public Data Resources
41
not generated notable growth among the large firms; it has been SMEs benefiting most from cheaper geographical informa-tion. It seems credible that switching to marginal cost pricing of Open Data sub-stantially lowers SMEs’ barriers to enter new market areas.
Governments receive in-come from commercial licensing fees, but at the same time lose taxation and employment ben-
efits from the potential higher volumes of commercial activities that could be gener-ated if they abandoned upfront charges for obtaining Open Data in the first place. PIRA82 found that with a conservative pro-jection of a doubling of market size result-ing from eliminating licensing fees would produce additional taxation revenues to more than offset the lost income from Open Data charges. Interestingly, in art. 4.1.2 of the European Commission PSI Re-use Guidelines it is stated that ‘charg-ing [of the fees] as such for making Open Data available comes at a cost as well: in-voice management, monitoring and polic-ing payments, administration of licensing regimes etc’. This means that meeting the request and asking for a fee is not only an administrative burden for the re-user, but also very costly in terms of time and staff for the data supplier.
As discussed, in a free or marginal cost model, the number of requests for Open Data information will increase accord-ing to the price elasticity of demand: the higher the access price to Open Data, the lower the demand. Under the cost recov-ery model costs are generated to meet this demand. If demand increases, the cost increases. However, if the data is available for free or at marginal costs, any extra de-
mand will not lead to higher costs, since these costs are already covered. This will become evident over a certain period of time, taking into account that increased re-use will generate new products and ser-vices and better return via taxes to govern-ment budget.
The ePSI scoreboard83 shows for the state of play regarding pricing models that eighteen Member States have a cost recovery model and nine Member States have a marginal cost model. It should be noted that the Ger-man national legislation for the implemen-tation of the new European PSI Directive has no provision about costs. So despite the revised European PSI Directive, still two thirds of the EU Member States take a cost recovery approach for the time being.
Next to policy and legislative actions, the Commission also launched several initiatives to raise awareness for Open Data and stimu-late the creation of networks.84 For example, the following initiatives were set up:
■ The PSI (Expert) Group85 is a Mem-ber States’ expert group for the ex-change of good practices and ini-tiatives supporting Open Data re-use which was established already in 2002.
■ The European Public Sector Informa-tion Platform (ePSI) 86 is a web portal that provides news on European devel-opments, good practices, examples of new products and services, and legal cases concerning Open Data re-use.
■ The LAPSI Network 87 analysed legal issues related to Open Data, fos-tered debate among researchers and stakeholders and produced a set of guidelines for access and re-use policies and practices.
82 PIRA International (2000)83 http://www.epsiplatform.eu/content/european-psi-scoreboard84 Homer(2013),p.2385 http://ec.europa.eu/digital-agenda/en/news/public-sector-information-group-main-page 86 http://www.epsiplatform.eu/ 87 http://www.lapsi-project.eu/
INFLUENCE
“The higher the access price to Open Data, the lower the demand.”

42
■ The Share PSI 2.0 Network,88 a sec-ond thematic network working on the exchange of experience and ideas around implementing Open Data poli-cies in the public sector, consisting of a community of government depart-ments, standards bodies, academic in-stitutions, commercial organisations, trade associations and interest groups. Knowledge is principally shared during workshops on the basis of real use cas-es, in order to ensure that ideas have been tried and tested in practice.
■ The Open Data Support project89 has been created to support possible suppli-ers of Open Data in publishing datasets. Support activities comprise preparation with a view to sharing metadata, train-ing as a capacity building exercise for public administrations in the EU in the supply and use of Open Data. Finally technical advisory and consulting servic-es are made available to address a wide range of questions related to the provi-sion and use of Open Data.
■ The Innovation Action “European Open Data integration and re-use incubator for SMEs,90 is an integral part of Hori-zon 2020, which addresses the topic of Big data and Open Data Innovation and take-up. The objective is to support Eu-ropean companies and SMEs in particu-lar, in developing innovative products via so-called European data integration and re-use incubator. The purpose of the incubator is to encourage and sup-port the growth of Open Data supply chains and assist new users.91 Under the same objective ICT-15-2014, a second activity consists in developing projects in the field of multilingual data harvest-ing and analytics.
■ Interestingly enough, there is a very thin border between Open Data, in-novation and digital entrepreneurship. The Startup Manifesto92 extensively refers to the “opening up government data.” Several other initiatives launched by DG CONNECT and DG GROW with re-gard to digital entrepreneurship can be useful in connecting to e.g. DG GROW activities in the field of developing a Body of Knowledge for ICT profes-sionalism, or other eSkills projects and communities are of direct relevance for the promotion and take up of the Open Data Portal Infra structure.
At European Level, Open Data is an impor-tant topic. There is a decisive movement from Member States towards more open access models. Nevertheless, certain Member States are still reluctant and re-quest to have evidence of the real impact of such change of approach.
4.3 Current situation in the EU 28+As indicated by the DemosEurope & WISE study, the EU28 can be roughly divided into three regions looking at Open Data policies, portals, initiatives, actions etc:93
■ North (UK, Ireland, Netherlands, Belgium, France, Austria, Germany, Finland, Sweden, Denmark, Luxembourg)
■ South (Portugal, Spain, Italy, Greece, Slovenia, Malta and Cyprus)
■ East or New Member States (Poland, Czech Republic, Slovakia, Bulgaria, Hungary, Croatia, Estonia, Latvia, Lithuania, Romania)
88 http://www.w3.org/2013/share-psi/ 89 https://joinup.ec.europa.eu/community/ods/description 90 http://ec.europa.eu/research/participants/portal/desktop/en/opportunities/h2020/topics/87-ict-15-2014.html 91 https://opendataincubator.eu/ 92 http://startupmanifesto.eu/files/manifesto.pdf93 DemosEurope&WISE(2014),p.84

Creating Value through Open DataStudy on the Impact of Re-use of Public Data Resources
43
There is a big difference between those countries looking at the progress they made so far with launching an Open Data portal. The first country to have an Open Data portal was Spain in 2009. They are also one of the frontrunners in terms of their Open Data policy. In Table 1 an overview is given of the year in which the countries launched a national Open Data portal. The most recent countries to have launched a portal are Croatia, the Czech Republic, Hungary, and Lithuania in 2015. Latvia is now in the planning phase of their national portal and Luxembourg aims to launch its portal in the beginning of 2016. The plans for opening a national portal in Malta, Liechtenstein, and Iceland are unknown for the moment.
Despite the development of national por-tals, not all countries have a national Open Data policy yet, as is shown in Figure 9. It is expected that the focus on Open Data in the upcoming years will accelerate this.
This insight comes from the landscaping performed by the European Data Portal project.94 The focus of the landscaping is to understand the level of Open Data Ma-turity from the perspective of the public sector representatives. Open Data Maturity is measured based on two key indicators: Open Data Readiness and Portal Maturity.
Open Data Readiness looks at the pres-ence of Open Data policies, the use made of the Open Data available, and at the political, social and economic impact of Open Data. Portal Maturity measures the usability of a portal with regard to the availability of functionalities, the overall re-usability of data, as well as the spread of data.
2009 2010 2011 2012 2013 2014 2015 ≥2016
Spain Slovenia Belgium Austria Bulgaria Croatia Iceland
UK Estonia Denmark Cyprus Czech Republic Latvia
France Germany Finland Hungary Liechtenstein
Italy Greece Ireland Lithuania Luxembourg
Netherlands Romania Poland Malta
Norway Slovakia
Portugal Sweden
Switzerland
Open Data Policy
29%
71%
Yes
No
Open Data Policy
29%
71%
Yes
No
Figure 9 – Presence of an Open Data Policy
94 www.europeandataportal.eu
Table 1 – Overview introduction national Open Data portal
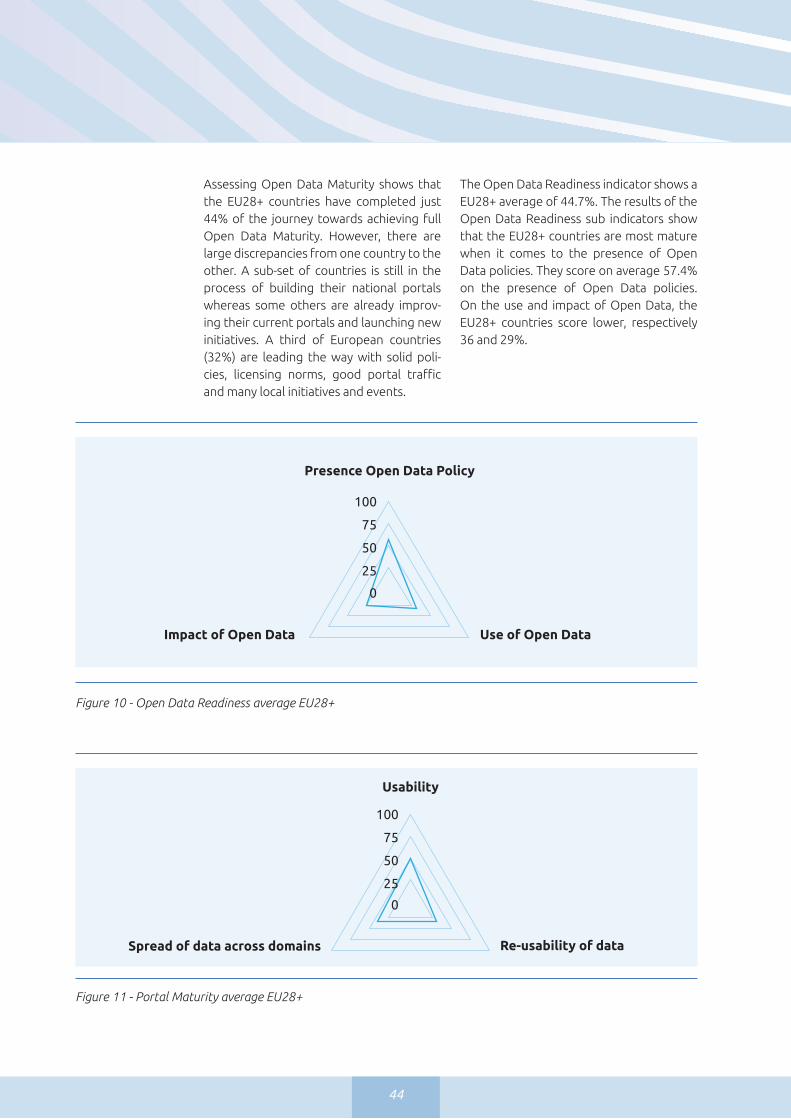
44
Assessing Open Data Maturity shows that the EU28+ countries have completed just 44% of the journey towards achieving full Open Data Maturity. However, there are large discrepancies from one country to the other. A sub-set of countries is still in the process of building their national portals whereas some others are already improv-ing their current portals and launching new initiatives. A third of European countries (32%) are leading the way with solid poli-cies, licensing norms, good portal traffic and many local initiatives and events.
The Open Data Readiness indicator shows a EU28+ average of 44.7%. The results of the Open Data Readiness sub indicators show that the EU28+ countries are most mature when it comes to the presence of Open Data policies. They score on average 57.4% on the presence of Open Data policies. On the use and impact of Open Data, the EU28+ countries score lower, respectively 36 and 29%.
Figure 10 - Open Data Readiness average EU28+
Figure 11 - Portal Maturity average EU28+
Presence Open Data Policy
Use of Open DataImpact of Open Data
100
75
50
25
0
Usability
Re-usability of dataSpread of data across domains
100
75
50
25
0

Creating Value through Open DataStudy on the Impact of Re-use of Public Data Resources
45
Almost two-thirds (59%) of the EU28+ countries have developed and imple-mented a dedicated Open Data policy. With regard to licensing norms, the coun-tries are quite developed, as the EU28+ score 72.9%. However, national coordina-tion in the field of providing guidance to local or domain specific areas is lagging behind with an average of 43.8%.
On the use of Open Data, the EU28+ countries score low, with an average of 36%. The difference within the EU28+ is large. Several EU28+ countries already receive more than 10,000 visitors per month on their national portal. However many countries have no insight into the use of their data.
Thanks to the landscaping exercise, the overall political, social and economic im-pact of Open Data in the EU28+ can be measured. On all three factors, not even
half of the impact is perceived as having been reached. The economy is the most impacted area, scoring an average of 38.3%, the politi-cal impact achieved is 30.8% and finally the perceived social impact remains very low, at 8.3%.
The maturity of the Open Data portals is the second key indicator of the Open Data Maturity Assessment. Portal maturity looks at the usability of the portal and the re-usability of the data, as well as the spread of data across domains. Overall, the EU28+ countries score 50% on usability, 33% on re-usability and 42% on the spread of data across domains.
Based on these results, the EU28+ countries are clustered into three different levels of Open Data Maturity, as can be seen in Fig-ure 12 and is explained in more detail on the next page.
Figure 12 - EU28+Open Data Maturity Clusters
Portal Maturity
Op
en D
ata
Rea
din
ess
Beginners
Followers
Trend Setters
FR
FI
EL
BG
DE
DK
NL
IT
PL
HR
IE
SE
CH
SK
NO
ROPTCY
BE
HU
SIEE
CZ
LT
LU
LV
LI
MT
ES
ATUK

46
Beginners: the initial steps have been made but countries still struggle with basics around availability and accessibility. Portal functionalities remain limited and there is a limited coverage in terms of data sets.
Followers: the basics are set, including a clear vision and there are advanced features on the portal, however the approach to the release of data is very much in silo and remains limited.
Leaders: Trend Setters: these are the most advanced and have solid Open Data portals with elaborate functionalities and coordination mechanisms across domains.
Plotting the scores of the countries into the maturity graph (Figure 12), shows that seven of the EU28+ countries are consid-ered as Beginners. Most of the countries are considered to be Followers. Fourteen countries are classified as Followers. Only ten countries are considered as Trend Set-ters. Europe benefits from a high level of Open Data Maturity with a large majority of countries where the basics have been set and portals launched. In addition, many of the Beginner countries are in the pro-cess of launching further structured initia-tives around Open Data. For an overview of the abbreviations, see Appendix I.
Nonetheless, many European countries are Followers, pointing to the fact that they have moved forward with their political agendas and portals. What is critical now is to move further forward and accelerate the publication of data sets as well as pro-viding more guidance to the sub-national level. This is key in ensuring interoperabil-ity as well as easing the harvesting of local portals to increase the discoverability of data. Key is also ensuring that data sets are up to date and harvested on a frequent ba-sis. The research conducted shows there is a lot of progress to be achieved in this field in achieving more frequent harvesting of governmental sources.
This chapter discussed the state of play of Open Data in Europe, from 2003 un-til now. Several European Directives and policies have been discussed, as well as the current situation in the EU 28+. This infor-mation will help in performing the macro-economic analysis. Before this analysis is performed, the so far published studies around the impact of Open Data are dis-cussed to find out which lessons can be learned of the previous efforts to quantify the market size of Open Data.

Creating Value through Open DataStudy on the Impact of Re-use of Public Data Resources
47
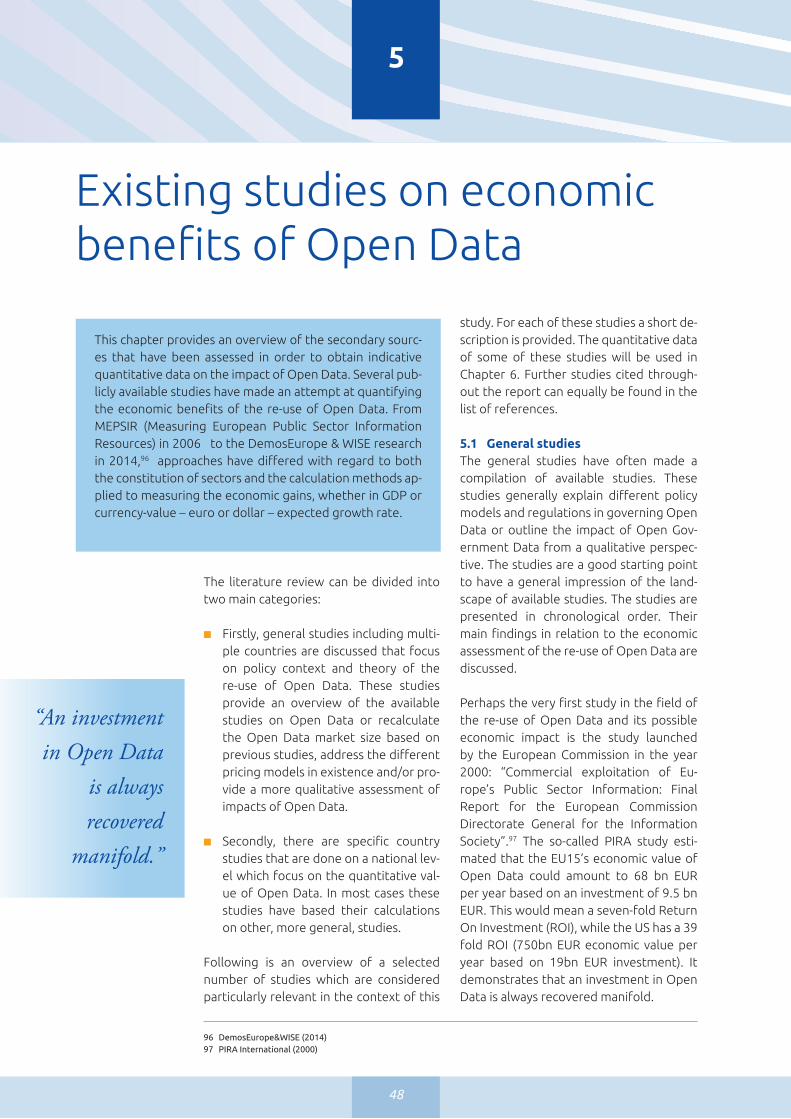
48
Existing studies on economicbenefits of Open Data
5
study. For each of these studies a short de-scription is provided. The quantitative data of some of these studies will be used in Chapter 6. Further studies cited through-out the report can equally be found in the list of references.
5.1 General studiesThe general studies have often made a compilation of available studies. These studies generally explain different policy models and regulations in governing Open Data or outline the impact of Open Gov-ernment Data from a qualitative perspec-tive. The studies are a good starting point to have a general impression of the land-scape of available studies. The studies are presented in chronological order. Their main findings in relation to the economic assessment of the re-use of Open Data are discussed.
Perhaps the very first study in the field of the re-use of Open Data and its possible economic impact is the study launched by the European Commission in the year 2000: “Commercial exploitation of Eu-rope’s Public Sector Information: Final Report for the European Commission Directorate General for the Information Society”.97 The so-called PIRA study esti-mated that the EU15’s economic value of Open Data could amount to 68 bn EUR per year based on an investment of 9.5 bn EUR. This would mean a seven-fold Return On Investment (ROI), while the US has a 39 fold ROI (750bn EUR economic value per year based on 19bn EUR investment). It demonstrates that an investment in Open Data is always recovered manifold.
This chapter provides an overview of the secondary sourc-es that have been assessed in order to obtain indicative quantitative data on the impact of Open Data. Several pub-licly available studies have made an attempt at quantifying the economic benefits of the re-use of Open Data. From MEPSIR (Measuring European Public Sector Information Resources) in 2006 to the DemosEurope & WISE research in 2014,96 approaches have differed with regard to both the constitution of sectors and the calculation methods ap-plied to measuring the economic gains, whether in GDP or currency-value – euro or dollar – expected growth rate.
The literature review can be divided into two main categories:
■ Firstly, general studies including multi-ple countries are discussed that focus on policy context and theory of the re-use of Open Data. These studies provide an overview of the available studies on Open Data or recalculate the Open Data market size based on previous studies, address the different pricing models in existence and/or pro-vide a more qualitative assessment of impacts of Open Data.
■ Secondly, there are specific country studies that are done on a national lev-el which focus on the quantitative val-ue of Open Data. In most cases these studies have based their calculations on other, more general, studies.
Following is an overview of a selected number of studies which are considered particularly relevant in the context of this
96 DemosEurope&WISE (2014)97 PIRA International (2000)
“An investment in Open Data
is always recovered
manifold.”

Creating Value through Open DataStudy on the Impact of Re-use of Public Data Resources
49
Another study that looks at this difference between Europe and the US was ‘Borders in Cyberspace: conflicting Public Sector Information Policies and their Economic Impacts’, published in 2002.98 This article explained the difference by the fact the US had an open access model, whereas the EU had a cost recovery model. It provides a thorough general insight in the two main charging models for Open Data. It should be considered as one of the first general introductions apprehending the economic benefits of Open Data.
The OECD, Digital Broadband Content: Public Sector Information and Content Study of 2006 addresses the challenges and related policy issues with respect to both Open Data and public sector con-tent.99 It states that “knowledge is a source of competitive advantage in the informa-tion economy, for this reason it is economi-cally important that there is wide diffusion of public information.” The study further provides an overview of Open Data pro-jects that have been implemented in OECD countries and the challenges encountered. It illustrates the economic importance and variety of Open Data and its main commer-cial applications. It developed a taxonomy, analyses particular domains of Open Data, discusses the benefits of Open Data and identifies main policy issues.
The MESPIR study was actually one of the first in assessing six domains (business, geographical, legal, meteorological, trans-port information and finally social data) in determining the potential value of Open Data for the economy. The study pro-ceeded with an aggregation of informa-tion available at sub domain level, based on estimates provided by data providers and users. On the other hand, calculations were made by determining a proxy bring-
ing together different economic figures such as turnover, staff etc. Whether based on estimates or proxies, both calculations provided very similar results estimating the overall market size of Open Data in the EU25 and Norway in 2005, at €27 billion, roughly 0.25% of the EU25+ GDP (€10,730 billion).100
Graham Vickery published a study in 2011 summarising the findings of other studies assessing the re-use of Open Data.101 The study includes the main developments since 2006 and the baseline established in the MESPIR Report. Vickery confirmed the Open Data re-use market to be of an estimated value of €28 billion in 2008, in-line with the €27 billion estimated within MESPIR. In addition, an aggregate for both direct (enrichers and re-users of open public data) and indirect (users of services provided by data enrichers) economic im-pacts from Open Data applications was calculated. For the whole economy, it was estimated around €140 billion per annum. Finally, a high estimate based on improved framework conditions for the year 2008101 could have been up to €200 billion, thus representing 1,7% of the EU GDP.
Peter Uhlir’s the Socioeconomic Effects of Public Sector Information on Digital Net-works – Towards a Better Understanding of Different Access and Re-use Policies, is a summary of a workshop organised by US National Committee for CODATA and OECD which was held on 4-5 February 2008.102 The objective of the workshop was to review the state of the art in as-sessment methods and improve the un-derstanding what is known and needs to be known about the effects of Open Data activities. This summary provides informa-tion from different organisations and indi-viduals. The study conducts an assessment
“Knowledge is a source of competitive advantage in the information economy.”
98 Weiss,P.(2002)99 OECD (2006)100 MEPSIR (2006)101 Vickery,G.(2011)102 Uhlir,P.(2009)

50
different models of supply and charging for Open Data and their effects on the downstream market, Open Data re-users, end-users and the Public Sector Body it-self. The case studies show a clear trend towards lowering charges and/or facilitat-ing re-use. In the cases where public sector bodies moved to marginal and zero cost charging or cost-recovery that is limited to re-use facilitation costs only, the number of re-users increased by between 1,000% and 10,000%. The study indicates that the potential benefits of lowered charges for re-use of Open Data are high.
Capgemini published a study in 2013 called ‘Unlocking Economic Value by Opening Government and Public Data’.105 This pa-per analyses trends in Open Government Data interventions among different coun-tries with the aim to identify best practices for stimulating economic impact and cre-ating economic value. The study is best known for the benchmarking of a number of selected countries based on the pace of adoption of Open Data Initiatives and the classification into three categories: Be-ginners, Followers and Trend Setters. The study found that countries with strong political support achieve higher maturity and better results in their Open Data ini-tiatives. The study also shows that another important factor in determining the suc-cess of Open Data programmes is the par-ticipation from the user community.
The most recent and most poignant numbers published around the value of Open Data are those in the study ‘Open Data: Unlocking innovation and perfor-mance with liquid information’ published by McKinsey in 2013.106 The authors rec-ognize that many Open Data initiatives have been motivated by societal goals such as improving the transparency and accountability of institutions, and much
of economic models, methods and applica-tions before identifying best practices and practical activities to be conducted to en-hance the understanding of economic and non economic benefits.
Rufus Pollock assesses who should best fi-nance Open Data re-use and analyses the regulatory structure needed to stimulate Open Data re-use.103 The conclusion was that funding could come from the public authorities’ ‘updaters’ those who update or register the data or re-users who want to make use of the data. One of the recur-ring questions is whether and how re-users should pay for the data following a cost re-covery or free or marginal cost model. Pol-lock indicates that Open Data should be offered at ’efficient’ prices and if possible at marginal costs as the benefits outweigh the costs incurred. Moreover, he states that charges should also be implemented for updates above marginal costs. In addi-tion, a good regulatory structure and gov-ernance structure to manage Open Data funding is also important. In the longer term governments will provide basic Open Data free of charge. The marginal costs of providing online access to data are close to zero, but the initial fixed costs may be substantial. However, the initial costs of collecting data were already covered to obtain the data for the primary purpose. Or, alternatively, there were no costs as data was a by-product of some other activ-ity. Costs of preparing data for publication are decreased by the fact that ‘raw’ data is often acceptable to users who are ready to refine it to meet their needs.
The so-called POPSIS study – ‘Pricing of Public Sector Information Study‘ – con-ducted in 2011 by Deloitte, analyses 21 case studies.104 The cases cover a wide range of public sector bodies and differ-ent Open Data sectors. The study assesses
103 Pollock,R.(2009)104 Vries,M.deetal(2011)105 Capgemini (2013)106 McKinsey(2013)
“The added value of Open
Data runs through all
streams of the economy.”

Creating Value through Open DataStudy on the Impact of Re-use of Public Data Resources
51
has been written about the importance of these efforts. However, the research fo-cuses on economic value that can be cre-ated by Open Data. Globally, across seven sectors (education, transport, consumer products, electricity, oil and gas, consumer finance), Open Data could globally gener-ate $3 trillion per annum and up to $5 tril-lion a year on the high end of the estimate (2.7 to 4.6 trillion EUR). This added value runs through all streams of the economy from entrepreneurship as well as market segmentation, energy efficiency, etc.
In 2014, the DemosEurope & Warsaw Insti-tute for Economic Studies (WISE)107 issued a study that focuses on the economic po-tential of Big & Open Data. It is a quanti-tative analysis of the EU28 into 21 sectors using a bottom-up macroeconomic model. The quantitative data is focusing on what the additional value is of Big and Open Data. The EU28 is split up in three zones: North, South and East. It is argued that the EU has three main challenges: in recogniz-ing that there are differences across Mem-ber States in terms of initial readiness, that there is a need to determine policy choices tailored to local specificities and that Open Data and Big Data are part of broader EU reform agenda. It is considered that data affects the economy in three ways: data to information where data is mined for valu-able information, data to product/process when insights from data analysis are used to improve products and processes, data to management which brings data-based information into companies’ decision-mak-ing processes.
Also in 2014, the World Bank study108 was published, focusing on how to use Open Data to drive economic growth and busi-ness innovation. It examines the evidence for economic potential of Open Data.According to the study, a summary of na-
tional studies is presented. Although the estimates differ, the potential of Open Data is very large. To illustrate this point, four companies are discussed which did not exist ten years ago, which are driven by Open Data, and which are each now valued at around $1 billion or more. Furthermore, the study discusses five archetypical types of businesses using Open Data, and dis-cusses the types of data which are proving most likely to lead to widespread business adoption and innovation.
Another study that was published in 2014 is from Lateral Economics and the Omid-yar Network that issued a study with the objective of quantifying the potential value of Open Data in G20 and Australia in particular.109 It reflects on top-down eco-nomic calculations of the impact of Open Data. Their calculations show how Open Data can promote the themes of the G20 agenda – trade, finance, fiscal and mon-etary policy, anti-corruption, employment, energy, and infrastructure – and in so do-ing achieve more than half of the G20’s 2% growth target. Applying their methods to the McKinsey study, they estimate that the implementation of Open Data policies would lead to 13 trillion USD (11.7 trillion EUR) in five years for the G20. For the Aus-tralian Open Data market the Open Data worth is estimated at 64 bn AUD (44 bn EUR). 5.2 CountryspecificstudiesAt national level, some public authorities have issued or commissioned studies to focus inter alia on the national Open Data strategy or assess the value of Open Data markets from national level perspective. Also, some countries have launched large studies to better understand the econom-ic impact and verify the numbers put for-ward. This section describes these studies, in chronological order. Studies that look at
107 DemosEurope & WISE (2014)108 World Bank (2014)109 LateralEconomics & Omidyar Network (2014)
“The possibilities to re-use Open Data are increasing.”

52
Otherwise, choosing a positive pricing model, preferably fine-tuned to the user’s willingness to pay, is the optimal solution.
In 2013, a study was issued that took stock of the status of Open Data in eight Medi-terranean European countries.113 These countries were involved in the HOMER project: Harmonising Open Data in the Mediterranean through Better Access and Re-use of Public Sector Information. HOMER was a three year strategic project with the focus on Open Data that started in April 2012 and ended in April 2015.114 The objective was to facilitate the deploy-ment and address legal, cultural and tech-nological challenges of Open Data. The rationale for this project was to bridge the gap – that became apparent in 2010 – of these Mediterranean countries with the rest of Europe. The study examined the status of Open Data policies in the eight HOMER countries and estimated the socio-economic impact of the HOMER project.115 In the eight countries the Open Data mar-ket is valued at 3.3 billion EUR in 2013. The forecast was that it will increase with 3.6 billion EUR in 2014, which constitutes 9% of the total Open Data Market in the EU (which is considered to be around 42 bil-lion EUR in 2014).
In 2012, the Danish Government, the local governments in Denmark and the Danish regions116 drafted a common digitalisation strategy for the public sector. The objec-tive of the strategy was to ease everyday life for individuals and businesses in Den-mark. Five processes were identified to reach this objective. In order to ensure the re-use of data and to prevent double reg-istration and shadow registers, data will be financed by the government and released to the public and the private sectors. To
a specific selection of countries are also included.
SerdaLAB is a French research company focusing on market research and digital information management. On a yearly ba-sis, SerdaLAB assesses the value of sales in the digital information market in France. Twelve different segments of digital in-formation are analysed, for example eco-nomic, financial, legal and marketing infor-mation. In 2008, the market value of digital information in France is estimated to be at EUR 1.57 bn in 2008 compared to 1.54 bil-lion EUR in 2007.110 The researchers also observe a trend with regards to Open Data. The possibilities to re-use Open Data are increasing. However, they do focus more on data from Social Media than on Open Government Data.
‘Models of Public Sector Information Provi-sion via Trading Funds’ relies on economic models of Newberry, Bentley and Pol-lock.111 The study provides estimates for the costs and benefits of marginal cost pricing in relation to bulk, Digital Open Data from big UK public data holders, while relying on prior experiences of agen-cies adopting marginal cost pricing.
In 2011, the Bureau of Theoretical and Ap-plied Economics, the Strasbourg Univer-sity, and the CNRS released a study called ‘the re-use of Public Sector Information: an economic optimal pricing model’.112 The report looks at valuation models for the re-use of PSI or Open Data in France. They conclude that Open Data policies can have two aims: (a) disseminate raw data that are difficult to understand and use or (b) make it easier to re-use data by accompanying it with added value. If the first aim is chosen, data should be provided free of charge.
110 SerdaLAB (2010)111 Newberry et al. (2008)112 Pénin,2011113 Spain,Italy,France,Malta,Greece,Slovenia,CyprusandMontenegro114 http://homerproject.eu/en/news/225-homer-project-comes-to-its-end 115 HOMER(2013)116 The Danish Government (2012)
“Free access to good basic data for everyone is good business; for the public
sector and for society in
general.”

Creating Value through Open DataStudy on the Impact of Re-use of Public Data Resources
53
enhance the quality of data, data regis-ters will be expended into a basic register. Also, all data will be linked and a common infrastructure will be established. To coor-dinate this process, a data committee will be established. The Danish Government states that “free access to good basic data for everyone is good business; for the pub-lic sector and for society in general.” The net benefits (2020) of this strategy are estimated as €35 million per year for the public sector and €65 million per year for the private sector.
The Shakespeare Review, published in 2013, calls for a National Data Strategy for economic growth in the UK.117 It states a more di-
rected, more predictable engineering of us-able government data is needed to deliver the full benefits of Open Data. In his review, Shakespeare also offers an estimate for the UK, ranging from £6.2bn to £7.2bn (8.8-10.2 bn EUR) per annum. That figure com-prises not just direct economic benefits but also the wider social value of Open Data. The direct benefits include the consumer surplus for direct use and consumption of Open Data related products, the revenue from the sales of data and supply chain ef-fects from increased jobs. The wider social value includes for example the specific fo-cus on aspects such as “the time saved as a result of access to real time travel data from Transport for London”, which is valued at £15-58m” per annum (21.2-82.1 m EUR). In 2013, a French report on Open Data was submitted by Judge Mohammed Tro-jette to the French Prime Minister.118 The French Prime Minister has repeatedly stated that data produced by public bod-ies should be made freely available, as long as they are not privacy or national security sensitive. Mr. Trojette performed an as-sessment of the economic models used
for existing Open Data portals. He found 27 portals that do not provide Open Data freely. The report also goes into details re-garding the legal frameworks of the differ-ent pricing models encountered. Further-more, the reasons to convert these pricing models into a free model are discussed. Mr. Trojette noted that there has been an overall decrease in revenue generated by public bodies from the re-use of PSI (35 m EUR in 2012, a 33% reduction compared to 2010), and that 90% of all the income came from just ten data sets, which puts into questions the viability of pricing regimes across all French administration.
The Swiss Government performed a study in 2013 to assess the economic impact of Open Government Data (OGD) in Switzer-land.119 They have also investigated the im-pact of OGD on the Swiss federal budget. The researchers state that estimating the economic impact of OGD in Switzerland is new territory. No comprehensive as-sessment has been done before. Also, no ready-to-use methodology is available. Therefore the authors look at the results of several other studies to estimate the Swiss OGD value. The different estimates range from 1.2 billion CHF to 6.5 billion CHF (EUR 1.1 bn – 6 bn). The report concludes that Switzerland would benefit from open-ing up government data. However, the re-port states that this is a political decision that needs to be taken.
A French report on rebuilding the right to public information in the digital age by Bouchoux was published in 2014.120 In 1978, French parliament recognized citizen’s right to obtain government doc-umentation. In the digital age, this right has taken a new dimension. The ability to re-use government data opens perspec-tives still largely untapped, for example improved efficiency and quality, or the
INFLUENCE
117 Shakespeare,S.(2013)118 Trojette (2013) 119 Bürgi-Schmelz,A.(2013120 Bouchoux (2014)

54
5.3 Lessons learned The general and country specific stud-ies that have been conducted in previous years, apply different methodologies and approaches to conduct their research. Reading these studies, one can learn sever-al lessons that must be taken into account when performing the macroeconomic analysis. This chapter summarizes those lessons learned, based on the objectives of this study.
Building on the growing appetite to under-stand “The Size of the Potential Prize”,124 to quote the latest World Bank Report on Open data for economic growth, the latter report has the benefit of listing the com-monalities across the different studies, as can be seen on the next page.125
A final key commonality lies in the fact that most, if not all studies, adopt differ-ent definitions of Open Data and the sec-tors being assessed. The scope of what is measured may therefore differ as well, ranging from benefits for data companies, the public sector, or the economy in gen-eral. In addition, differences in geographic scope as well as sources used to elaborate GDP forecasts vary. For these reasons not all studies are comparable.
Besides the lessons learned from the com-monalities across the different studies, specific lessons can be learned around the objectives of this study: the market size of Open Data, the number of jobs created by Open Data and the cost savings obtained.
development of new services. To increase administrative transparency in the digital age, France must improve the effective-ness of the right to access public admin-istration, increase the completeness of data and support the development of new services.
In a recurring format, the Spanish govern-ment issued studies within the Aporta Pro-ject Framework and Plan Avanza 2 to trans-pose the revised European PSI Directive in Spain. The first study analysed Spain’s Re-use of Open Data.121 In the follow-up study of 2012 the analysis is continued based on a questionnaire sent out to 269 companies that have been identified as potential re-users.122 In 2014, the study was conducted again and published in March 2015 with up-date information about the so-called infomediary sector in Spain.123 The esti-mated business volume of the Spanish infomediary sector is considered to be worth of 330-550 million/per year in 2012. The average number of people employed in the Spanish Open Data sector is 3,600 – 4,400 employees.
121 Datos.gob.es (2011)122 Datos.gob.es (2012)123 Datos.gob.es (2014) 124 http://www.worldbank.org/content/dam/Worldbank/document/Open-Data-for-Economic-Growth.pdf 125 Worldbank (2014)

Creating Value through Open DataStudy on the Impact of Re-use of Public Data Resources
55
5.3.1 Market sizeIn different studies, several attempts have been undertaken to calculate the market size of Open Data. Two main trends can be observed: studies that aim to quantify the direct market size of Open Data and those that focus on both direct and indirect mar-ket size: the total market size of Open Data. Two different approaches are used to calculate either direct or total market size: top-down or bottom-up.
First, the difference between the top-down approach and the bottom-up ap-proach is discussed. The top-down ap-
proach is assessing the value of Open Data from an aggregate level, mostly expressed in GDP. In the case of this study, this would mean from a EU28+ level. The bottom-up approach focuses on value of Open Data from country level. It can be the case that only data is available from one EU Mem-ber State. This means calculating the data from individual Member States in order to have a more detailed impression of the value of Open Data for all Member States. It also makes it possible to discern differ-ences between Member States. The two approaches are summarized in Figure 13.
The “indirect” benefits for the users seem to substantially outweigh the “direct” economic benefits witnessed by the providers of data rich services.”
Open Data attracts new types of re-users in particular SMEs and contributes to the development of new business models such as advertiser-pays instead of user pays.
The value lies in the combination of the data with innovative ideas, inadequacy of existing services, etc. not in the data itself.
It is increasingly difficult to attribute the total benefits to the individual factors, as the lines between Open Data and Big Data are blurring.
An additional difficulty lies in the attempt to separate the value of the data from the value of innovation itself.
The difficulty to measure the benefits of Open Data for the public sector. It is both a provider and a consumer of data rich services and often enough buys back its own data after being enriched by data providers.

56
There are advantages and disadvantages to both approaches. On the one hand, the top-down approach risks overestimation as the focus is mainly on Open Data with-out taking into account other data (e.g. private data, etc.). On the other hand, the bottom-up approach risks underestima-tion as it fails often to take account of the wider impacts. As observed in the litera-ture review, the general approach taken to quantify the economic benefits is a com-bined top-down and bottom-up.
Second, one could look at the size of spe-cific domains or sectors to estimate the size of direct or total market size for Open Data. The McKinsey study126 looks at seven sectors: education, transport, consumer products, electricity, oil and gas, and con-sumer finance. However, in the Demo-sEurope & WISE study,127 eleven domains
are mentioned. Furthermore, the Euro-pean Commission and Eurostat have also classified data categories, respectively the DCAT-AP128 and GDP sectors.129 The basic use case of the DCAT-AP is to enable aggregation of and search for datasets across data portals in Europe, thus mak-ing it easier to find public sector datasets across borders and sectors. Eurostat dis-tinguishes several sectors in their GDP cal-culations. The size of the sectors is shown as a percentage of a country’s GDP. These different methods show quite some over-lap, as can be seen in Figure 14. Of the 40 domains distinguished, 33 can be divided into eight groups. Only seven of the 40 do-mains do not have a clear overlap with any of the other domains. Finally as regards to the calculation of GDP forecasts, different methods can be applied as several different sources of-
126 McKinsey(2013)127 DemosEurope & WISE (2014)128 https://joinup.ec.europa.eu/asset/dcat_application_profile/asset_release/dcat-application-profile-data-portals-
europe-200 129 http://ec.europa.eu/eurostat/statistics-explained/images/6/6b/Gross_value_added_at_basic_prices%2C_2003_
and_2013_%28%25_share_of_total_gross_value_added%29_YB15.png
Figure 13 - Different calculation methods observed during literature review
Bo
tto
m-u
p
Top
do
wn
EU 28+ Aggregate
CountryCountryCountryCountryCountry
Domain Domain Domain Domain
Domain Domain Domain Domain
Domain

Creating Value through Open DataStudy on the Impact of Re-use of Public Data Resources
57
fer GDP forecasts. Some studies use the forecasts from the European Central Bank and the European Commission; others look at other international sources such as the Economist Intelligence Unit Global Forecasting Service (EIU). This can result in slightly different numbers thus limiting the comparability of the figures when con-sidering the market value.
Two trends are observed to calculate the market size of Open Data: calculate direct market size or calculate total market size. Our study will calculate both, as from the direct market size the total market size will be derived. To calculate either of these market sizes, the two different approaches observed will be applied. A mix of both the
bottom-up and the top down approach is used in this research.
5.3.2 Number of jobsThe number of studies available that measure the number of jobs created in the field of Open Data is very limited. Nevertheless, enough evidence exists to support a causal relationship between the release of Open Data and an increase in the number of jobs. Small and medium sized enterprises (SMEs) play an important role in creating more jobs.130 Different fac-tors can be distinguished that contribute to the creation of more jobs. Data-driven innovation is one example and includes any innovation that is, to a large degree, based on utilizing data to generate val-
130 http://europa.eu/rapid/press-release_MEMO-12-11_en.htm?locale=en
Figure 14 –Overlap of domains summarized
Health
Public Administration
Health and Social Work
GovernmentPublic Sector Public
Administration
Justice, legal system, public
safety
Public Administration
Transport
Transport
Trade
Transport
Trades and Transport
Trade and Transport
Consumer Finance
Economy and Finance
Financial & Infrastructure
Real EstateFinance and Insurance
Real Estate
Financial
ICT
ICT
ICT
EducationEducation
Education, culture and sport
EducationProfessional
Services
Professional Services
Professional Services
Industry
Electricity
Oil and Gas
Manu-facturing
Construction
Energy
Construction
Industry, Energy and Construction
Agriculture
Agriculture, fisheries,
forestry, food
Agriculture
DCAT-AP DemosEurope& WISE
McKinsey Eurostat
“All firms can use data to enhance their products and services.”

58
ue.131 In general, all firms can use data to enhance their products and services, but SMEs would use data to produce innova-tive products and services more often. A series of Spanish studies among all firms re-using Open Data has estimated the average number of people employed in the Spanish Open Data sector is 3,600 – 4,400 employees.
5.3.3 Cost savingsSeveral studies and case examples have shown that cost-based pricing models do not bring cost savings to public authori-ties in the long run. Free or marginal cost models are more beneficial. However, the only study discussed before that looked into the actual cost savings was the study from Denmark. The costs that could be saved per year for the public sector were estimated to be €35 million and for the pri-vate sector even €65 million.132
Many studies into the value of Open Data have been undertaken. Interestingly enough, these numbers have launched
many discussions within the Open Data commu-nity. Typically, discussions covered the method un-dertaken, the reliability of the data and more importantly how far the figures were intrinsically linked to the re-use of public Open Data. Different ap-proaches, material and geographic scope have limited the comparability of the fig-ures published. Yet, all numbers provide evidence that there is a substantial gain at hand and this gain is evidently very large. This thinking has found its way into the minds of many policy makers, believing they have found the goose that would lay the golden egg. However, few studies of-fer aggregate figures covering several dif-ferent macro-economic indicators. Within the context of the launch of the European Data Portal, the European Commission wished to obtain further evidence of the quantitative impact of re-use of Public Data Resources. The next chapter will of-fer insight into the calculation methods developed for that purpose.
131 Jetzek et al. (2013b)132 TheDanishGovernment(2012),Jetzeketal.(2013a)
INFLUENCE

Creating Value through Open DataStudy on the Impact of Re-use of Public Data Resources
59

60
6
Calculating economic benefitsof Open Data
3. Cost Savings for the public sectorFor cost savings, the aim is to look at the cost savings for the public
authorities when providing Open Data. These savings include time saved for public administrators by using Open Data which are thus redundant expenditures. Moreo-ver, the savings can also be identified via transaction costs for providing data or by realizing more transparency.
4. Efficiency Gains or productivity gainsThere are many societal gains from Open Data. Under the heading of efficiency gains,
the purpose is to assess the different indi-rect benefits citizens can have from Open Data. This can be in terms of time saved or lives saved as well as productivity gains. Given that these savings and/or gains are often difficult to quantify, this will be ex-pressed quantitatively if possible as well as qualitatively.
Several economic indicators are used as factors, composites or variables to meas-ure the metrics defined above. It is a chal-lenge to identify economic indicators that are both stable over time and easy to measure when assessing the economic impact arising from the re-use of Open Data. By using only reputable data sources as Eurostat, the European Central Bank, and OECD, it was possible to identify such indicators.
This part describes the methodological approach used to conduct the macroeconomic impact analysis on the re-use of Open Data. The chapter details the methods applied for the calculation of the different metrics.
6.1 DefinitionsofmetricsBefore deciding on the approach to fol-low, key metrics have been defined to quantify the impact of the re-use of Open Data. These metrics are the following:
1. Market Size and value added as percentage of GDP
The market size is defined through the market volume
and the market potential. The market volume exhibits the totality of the real-ized sales volume of a specific market; the value added. The volume is therefore dependent on the quantity of consum-ers and their ordinary demand.133 For the Open Data Market Size turnover and value added related to Open Data is presented. The currency used is euro.
2. Number of Jobs Created The objective is to calculate the number of additional jobs created directly related to Open Data for the private
sector. It is necessary to look at how many people are active in this field. The numbers will be provided in persons as it is not al-ways evident whether the jobs are in Full Time Equivalents (FTE’s).
133 https://en.wikipedia.org/wiki/Market_analysis
INFLUENCE
INFLUENCE
INFLUENCE
INFLUENCE

Creating Value through Open DataStudy on the Impact of Re-use of Public Data Resources
61
Figu
re 1
5 –
Ben
efits
Log
ic fo
r O
pen
Dat
a
Op
en
Dat
aav
aila
bili
ty
Solu
tio
nV
alue
Dri
vers
Go
al
Dat
a-d
rive
nd
ecis
ion
mak
ing
Op
en D
ata
goo
ds
& s
ervi
ces
Mar
ket
size
(G
DP
)
Req
uire
d s
kills
Bet
ter
pai
d jo
bs
Num
ber
of
job
s
Pro
duc
t im
pro
vem
ent
Insi
ght
inm
arke
t
Eco
nom
icac
tivi
ty
Frau
d d
etec
tio
n
Tim
e se
arch
ing
for
info
rmat
ion
Hum
an r
eque
sts
for
info
rmat
ion
Att
ract
iven
ess
pro
duc
ts
Pur
chas
ing
p
ow
er
Pro
ces
op
tim
izat
ion
Tax
Inco
me
stat
e p
rop
erty
/sha
res
Efficien
cyC
ost
s
Rev
enue
Go
vern
men
t su
rplu
s
Co
mp
anie
s’
profit
Ind
ivid
ual
spen
din
g
Co
sts
Rev
enue
Num
ber
of
pro
duc
ts b
oug
ht
Num
ber
of
FTE

62
6.2 InfluenceofindicatorsontheOpen Data market
In order to have a better overview of causal links, the four defined metrics are plotted in a so-called Benefits Logic to indicate which economic indicators influence a certain metric. The Benefits Logic is a method de-signed by Capgemini to work towards ben-eficial solutions by starting with the desired result in mind.
The Benefit Logic helps to stay focused on the factors that lead to the required result. The result will be a solution in which value is increased for the organisation or, in the case of Open Data, society. It does not nec-essarily have to generate value in terms of money. Improving services to customers/citizens could be a desired outcome as well. The Benefits Logic gives an overview of the areas where value can be created. It is used as a first step towards a Business Case that further explores the potential value of a specific solution.
In Figure 15 the Benefits Logic for Open Data is shown. The desired outcome is economic growth in terms of GDP. By look-ing from the right to the left, different benefit opportunities are presented. For instance, an increase in GDP is reached by an increase government surplus. The gov-ernment surplus can stimulate the growth of market size and will increase when the government expenditure declines. This could be the result of lower transactional costs. Citizens are not requesting informa-tion any longer face-to-face, by telephone or via post which is costly, instead they find everything they need online on the nation-al Open Data portal which is less costly and results in savings.
After completing the Benefits Logic mod-el, it is possible to read from left to right what the benefits of more availability of Open Data are and how they will create economic growth.
6.3 Calculation methodThe majority of studies performed previ-ously are ex-ante estimations. These are mostly established on the basis of sur-veys or indirect research and provide for a wide range of different calculations. Ko-ski therefore rightly states that there are no comprehensive and detailed ex-post evaluations of the materialised costs and benefits of Open Data.134 It is necessary to conduct research ex-post. However, the necessary data to do so is at the moment hardly available. Given these restraints this study will provide ex-ante estimations with the objective to give realistic figures of the direct and total impact of Open Data by 2020.
Different techniques were used to elicit quantifiable results. First of all, data was collected and analyzed. Fol-lowing the data analysis,
calculation formulas were established and initial estimations, proxies and ratios were determined. These formed the basis for further calculation either from an ag-gregate or individual country level point of view. The aggregate calculations were set off against the individual country cal-culation findings and vice versa. This al-lowed for cross-verification and avoided extremes. 6.3.1 Data collectionThe collection of data was based on two approaches. First of all, a thorough desk research took place of available studies and existing literature. The aim was to un-derstand the policy context, obtain use ful quantitative data for the EU28+ and com-pare findings. Regarding the economic impact studies, the available studies focus on large geographical areas such as the US, Australia or the EU. There are a limited num-ber of quantitative impact studies available for individual countries. In addition, the studies available are mainly from Anglo-
134 Koski,H.(2015),p.3
INFLUENCE

Creating Value through Open DataStudy on the Impact of Re-use of Public Data Resources
63
Saxon sources. How-ever, several country specific studies were identified and used in this study. An analysis
of the available studies is provided in the previous chapter (Chapter 5).
Secondly, so-called primary quantitative data was obtained from Eurostat, OECD, European Central Bank and other repu-table sources in order to ensure that the basic facts were stable and established numbers. Thereafter, an analysis of the data from secondary sources took place. The gaps were identified for which no numbers were available. These gaps were ‘filled’ with data from other sources amongst which primary sources for the EU28+ as a whole or for each individual EU28+ country.
6.3.2ClassificationTo be able to provide an accurate estimate of the total Open Data market size in 2020, one needs to look at the Open Data Matu-rity per country and how this maturity has
evolved. In order to do so, an Open Data Maturity model (ODM model) was devel-oped by Capgemini Consulting. This model classifies the maturity of a country with re-gards to Open Data based on four catego-ries using eleven different indicators. The model is largely based on a combination of the research conducted by Capgemini in 2013135 and the research by Demos-Europe & WISE (2014). The results from the landscaping questionnaire addressed to the EU28+ PSI representatives are also taken into account. 136
As can be seen in Table 2, there are four main categories which are taken into ac-count to determine the maturity of a EU28+ Member State: status of Open Data, ICT Sector, enterprises and individuals. For each of these categories, indicators usable for quantifications can be sought, mainly with the Eurostat Database. Three indica-tors are related to the status of Open Data within a country. Two indicators look at the importance of the ICT-sector per country.
INFLUENCE
135 The Open Data Economy Unlocking Economic Value by Opening Government and Public Data136 Open Data Maturity in Europe 2015: Insights into the current European state of play137 http://barometer.opendataresearch.org/report/analysis/rankings.html 138 https://docs.google.com/spreadsheets/d/1P3jXcDgFQml4e8MKdvcq9Gzii-BmKf5fo0XCpr4Wmf8/edit#gid=0139 Capgemini Research (2015)140 Eurostat Database
Category Indicators
Status of Open Data
Open Data Barometer137
ePSI Scoreboard138
Existence of an Open Data Portal
ICT-sector Percentage of GDP attributable to the ICT-sector
R&D expenditure of businesses in the ICT sector as percentage of total R&D expenditure140
Enterprises Percentage of enterprises using internet for interaction with public authorities140
Percentage of enterprises who electronically share information on sales for any internal function140
Percentage of enterprises' turnover from e-commerce in total turnover140
Individuals Percentage of individuals using internet for interaction with public authorities140
Percentage of individuals using internet within the last 12 months140
Percentage of individuals who have ever used the Internet140
Table 2 - Factors of the Open Data Maturity Model139
INFLUENCE

64
The other indicators look at the online maturity for Enterprises within a country (three indicators) and the online maturity of Individuals within a country (three indicators). Based on a percentile division of the scores for the indicators, countries can be compared in terms of their maturity. This will result in a matrix with different scores per country. Previous research by Capgemini141 indicated three maturity levels. However, to better predict the growth in Open Data, an extra maturity level is distinguished. A country can be classified as being either a Trend Setter, Follower, Advanced Beginner or Beginner:
Trend Setters: these are the most advanced and have solid Portals with elaborate functionalities and coordination mechanisms across domains.
Followers: the basics are set, including a clear vision and there are advanced features on the portal. However, the approach to the release of data is very much in silo and remains limited.
Advanced Beginners: the initial steps have been made but they are still struggling with basics around availability, accessibility, portal functionalities remain limited and there is a limited coverage in terms of data sets.
Beginners: no portal exists yet. Furthermore, a clear strategy around Open Data is missing. Policies still need to be drafted to support the growing political interest around Open Data.
141 Capgemini (2013)142 Vickery,G.(2011)
The rate by which the value of Open Data increases differs per maturity level. Vickery makes the assumption that the value of Open Data increases by 7% per annum.142 However, this estimate does not take into account the differences in Open Data Ma-turity between countries. It is assumed that the growth rate of 7% can only be ap-plied to the Trend Setters. Based on this upper bound, the growth percentage for
the other three maturity levels needs to be estimated. The upper bound of 7% is cal-culated backwards using a ratio of 2. This ratio is used to determine the difference in percentage points between the different maturity levels. As can be seen in Table 3, this leads to a growth percentage of 1% of the value of Open Data for Beginners, and 3% for the Advanced Beginners. For the Followers, the growth percentage is 5%.
Level Percentage growth
Trend Setter 7%
Follower 5%
Advanced Beginner 3%
Beginner 1%
Table 3 - Growth percentage per maturity level

Creating Value through Open DataStudy on the Impact of Re-use of Public Data Resources
65
6.3.3 Calculation techniquesDifferent calculation techniques were identified to elicit quantifiable results. In-formation was extrapolated to cover areas (countries or domains) for which too little information is available.
A means of calculating the value of Open Data in one country is to use data which is available from another country, and mul-tiply the Open Data value by the ratio of GDP per country or some similar meas-ure.143 However, it should be kept in mind that provision of data sets per government varies and the commercial use of Open Data is concentrated in a small number of domains which may also differ per country.
6.4 Calculation of the metricsThis section provides more details around the calculation of the different metrics. The focus will be on the metric for mar-ket size, number of jobs created, and cost savings. The metric efficiency gains has a more qualitative approach.
6.4.1 Market sizeIn calculating the market size for Open Data from 2016 to 2020, a distinction can be made between the direct market size and the indirect market size. Together they form the total market size for Open Data. Direct benefits are monetised ben-efits that are realised in market trans-actions in the form of revenues and Gross Value Added (GVA). Indirect economic ben-efits are i.e. new job potential, new goods and services, time savings for users of ap-plications using Open Data, knowledge economy growth, increased efficiency in public services and growth of related markets.
Level Percentage growth
Trend Setter 7%
Follower 5%
Advanced Beginner 3%
Beginner 1%
Table 3 - Growth percentage per maturity level
The direct market size for Open Data in 2020 can be cal-culated by extrapolating the 2005 Open Data market size for the EU25, used in the stud-
ies of MEPSIR144 and Vickery.145 The first step is to extrapolate the 2005 market size value for the EU25 to a value for the EU28+, based on GDP 2005 figures from Eurostat.146 Then, the 2005 values should be extrapolat-ed, first to their 2015 value and then to their 2020 value. To do so, the Open Data growth rate is taken into account, derived from the Open Data Maturity classification. Also, the values are increased with the (expected) inflation in the period of 2005-2020, based on Eurostat figures147 and forecasts of the European Central Bank.148 To calculate the percentage of the Open Data market size in GDP, the GDP of 2020 has to be forecasted. The forecast of the International Monetary Fund as presented in the World Economic Outlook Database can be used for this calculation.149
To calculate the indirect market size for Open Data, ratios can be applied that look at the difference between the direct and the total (direct and indirect) market size. Several of these ratios are mentioned in previous research (see Chapter 5). Re-search by Vickery150 and Shakespeare151 mention two almost similar ratios. Vickery found a ratio of 3,5, while Shakespeare found a ratio of 3,78. These ratios are used to estimate a range for the total market size for the EU 28+.
Next to calculating the overall Open Data market size in 2020, it is interesting to know how large the influence of Open Data will be in specific domains. In Section
143 PIRA(2000),p.27144 MEPSIR (2006)145 Vickery,G.(2011)146 http://ec.europa.eu/eurostat/tgm/refreshTableAction.do?tab=table&plugin=1&pcode=tec00001&language=en 147 http://ec.europa.eu/eurostat/web/products-datasets/-/tec00118 148 http://www.ecb.europa.eu/stats/prices/indic/forecast/shared/files/reports/spfreport2015_Q2.en.pdf?da2241ab892f1c
16774da6b7cbaee1e3 149 http://www.imf.org/external/pubs/ft/weo/2015/01/weodata/index.aspx 150 Vickery,G.(2011)151 Shakespeare,S.(2013)
INFLUENCE

66
0, the overlap of sectors was already dis-cussed. In this study, a combination of the sectors of Eurostat152 and DemosEurope & WISE153 will be used. The GDP per sector, as distinguished by Eurostat, is combined with the DemosEurope & WISE research into the potential gain of Open Data per sector. Weight factors can be assigned to these gains to determine the percentage per sector of the Open Data market size on country level. The country figures were used to calculate the aggregated EU28+ weighted percentages per sector.
6.4.2 Number of jobs createdNot all factors can be measured directly. Proxies were used when data for direct indicators was not available or feasible to collect at regular intervals. Proxies were developed contributing to the creation of composite indicators. Proxies were con-structed from statistical data available.
Estimation techniques were used to develop a better understanding of the possible range of costs and effort associated with use of Open Data. Estima-
tion is used when it is impossible to deter-mine exact numbers. Estimation cannot and does not eliminate uncertainty; rath-er, the purpose of estimation is to obtain a reasonable assessment of likely costs or effort required. Estimating techniques forecast the cost and effort involved in pursuing a course of action.
Different estimations for the number of jobs created attributable to Big Data are available. However, the number of studies available that measure the number of jobs created in the field of Open Data is very limited. Nevertheless, enough evidence exists to support a causal relationship be-tween the release of Open Data and an in-crease in the number of jobs in the private
sector. There is a difference between the direct and indirect number of jobs created as a result of Open Data release. Start-ups that are using Open Data for their busi-ness are directly creating Open Data jobs, like Open Data analysts or product mar-keters. If these businesses that make use of Open Data also need a sales manager for their company as it gets bigger, this would be an indirect job that is created.
In order to calculate the increase in Open Data jobs in the private sector until 2020, two steps are essential. The first is to de-termine the number of Open Data jobs in any given year. Secondly, one has to know which indicators can be used to determine the growth in Open Data jobs until 2020.
A start can be made by looking at the to-tal European population. However, not all EU citizens are considered part of the working population. The working popula-tion consists of all citizens in the age of 15 to 64 years old.154 Not everyone that is part of the working population is defined as being employed. The EU Labour Force Survey155 defines persons in employment as those aged 15 and over, who, during the reference week, performed some work, even for just one hour per week, for pay, profit or family gain. The labour force also includes people who were not at work, but had a job or business from which they were temporarily absent, for example, because of illness, holidays, in-dustrial disputes, education or training.
Employment can be measured in terms of the number of persons or jobs, in full-time equivalents or in hours worked.156 For this metric, employment is measured as the number of persons employed. The difference in full-time or part-time jobs is not taken into account, as employment is measured in persons.For the jobs metric total employment with-
INFLUENCE
152 http://ec.europa.eu/eurostat/statistics-explained/images/6/6b/Gross_value_added_at_basic_prices%2C_2003_and_2013_%28%25_share_of_total_gross_value_added%29_YB15.png
153 DemosEurope & WISE (2014)

Creating Value through Open DataStudy on the Impact of Re-use of Public Data Resources
67
154 http://ec.europa.eu/Eurostat/statistics-explained/index.php/File:Population_age_structure_by_major_age_ groups,_2002_and_2012_%28%25_of_the_total_population%29_YB14.png
155 http://ec.europa.eu/eurostat/web/microdata/european-union-labour-force-survey156 http://ec.europa.eu/Eurostat/statistics-explained/index.php/Employment_statistics 157 AccordingtoISCED97,levels5+6.Formoredetailseehttp://ec.europa.eu/Eurostat/cache/metadata/Annexes/htec_
esms_an8.pdf 158 Datos.gob.es(2011),Datos.gob.es(2012),Datos.gob.es(2014)159 http://europa.eu/rapid/press-release_IP-14-1362_en.htm 160 http://www.cedefop.europa.eu/files/3052_en.pdf161 Houghton,J.(2011),p.7
in the EU needs to be further qualified. It is often assumed that the jobs created by the re-use of Open Data will mainly be created within the IT sector. However, Open Data might be re-used/collected, aggregated and edited in the first place by IT people, but the further re-use of the data within the Open Data value chain (repackaging, distributing it) might be done by people outside of the IT sector (e.g. marketing and promotion, customer service). Thus, the scope of job creations is sought also be-yond the IT sector.
A more comprehensive approach would be to look at employment within knowledge intensive activities. An activity is classified as knowledge intensive if employed ter-tiary educated persons represent more than 33% of the total employment in that given activity. Activities within the IT sec-tor are part of these knowledge intensive activities. 157
The number of persons employed in knowledge intensive activities is used in as-sessing the number of persons employed in Open Data. An estimate should be made which percentage of knowledge intensive jobs is related to Open Data. To do so, a se-
ries of Spanish studies looking into the re-use of Open Data in the private sector can be used as basis. These studies (conducted in 2011, 2012, 2014) have looked at the number of people directly employed in the Spanish private Open Data sector.
Next to being able to calculate the number of direct Open Data jobs in the private sec-tor, a forecast of the number of Open Data jobs until 2020 is necessary. To do so, both the forecasted overall growth in employ-ment and the forecasted growth of Open Data need to be taken into account. This is done by looking at Eurostat159 and Cede-fop figures.160
6.4.3 Cost savingsThe potential costs saved thanks to the re-use of Open Data will be assessed for pub-lic administration at national level. There is a need to focus on public sec-tor solely in order to make more accurate as-sumptions. Other studies often indicate an overall cost saving for society. The objective is to look only specifically at the cost savings part of the Houghton equation for public authorities or so-called agencies,161 as can be seen in Figure 16.
Figure 16 - Houghton, formula for estimating cost-benefits
Benefit =Cost savings + Increased Returns
Costs
INFLUENCE
68
Providing Open Government Data for re-use can bring substantial cost savings. In order to assess what these cost savings are and where they mostly apply, the cost sav-ings calculation of the Danish Basic Data Program can be used. The Danish Govern-ment set out a public sector-digitisation strategy to provide basic data from all layers of government (ministries, munici-palities and regions). Between 2012 and 2020, certain categories of basic data like geographic, business register extractions, cadastral maps, real property data, and address data were gradually made freely available to all public authorities, private business and individuals.162 The foreseen government savings are considered to be around 35 million EUR per annum, starting from 2020.163
The expected cost savings for the Danish government in 2020 can be expressed as a percentage of the total public sector expenditure of Denmark. This expendi-ture can be calculated by looking at the 2020 GDP of Denmark and the govern-ment expenditure as percentage of GDP in Denmark. The 2020 GDP of Denmark will be calculated as part of the market size calculation. The government expenditure percentage can be calculated by looking at the average government expenditure per-centage for the period 2010-2014. Then, the size of the cost savings in Denmark can be expressed as a percentage of the Dan-ish government expenditure.
Once the percentage of cost savings in government expenditure is known, the cost savings for the other EU28+ countries can be calculated. This calculation will be based on the World Economic Outlook164 forecast of 2020 GDP and the average government expenditure percentage as reported by Eurostat for the period 2010-2014.165
6.4.4EfficiencygainsThe metric efficiency gains has a more qualitative approach compared to the oth-er three metrics. It offers a combination of the insights gained around the efficiency gains of Open Data and real-life exam-ples. Both are identified via desk research. Three exemplar indicators are assessed in
more detail: how Open Data can save lives, how it saves time and how Open Data helps achieve environmental benefits.
This study will provide ex-ante estimations to give realistic figures of the direct and total impact of Open Data by 2020 with regards to the market size, number of jobs created, cost savings and efficiency gains. Several calculations techniques are ap-plied. The aggregate calculations are set off against the individual country calcula-tion findings and vice versa. The achieved results are discussed in the next chapter.
INFLUENCE
162 The Danish Government (2012) 163 Jetzek (2013a)164 InternationalMonetaryFund,http://www.imf.org/external/pubs/ft/weo/2015/01/weodata/index.aspx165 http://ec.europa.eu/eurostat/tgm/table.do?tab=table&init=1&plugin=1&language=en&pcode=tec00023

Creating Value through Open DataStudy on the Impact of Re-use of Public Data Resources
69

70
166 MEPSIR (2006)167 Vickery,G.(2011)
The value created throughOpen Data
7
In this chapter, the results of the macroeconomic analysis are presented. Based on the methodology described in the previous chapter, the value created through Open Data is as-sessed. The direct and total benefits of the re-use of Open Data for the EU28+ for the period of 2016-2020 have been forecasted.
An important first step consists in classi-fying all EU28+ Member States using the Open Data Maturity (ODM) model. The ODM model shows that in 2005, 63% of the Member States could be classified as a Beginner whilst not a single country could be classified as a Trend Setter. These num-bers changed substantially over the past 10 years. In 2015, 31% of the countries can be classified as a Trend Setter whereas only 19% is still a Beginner, as shown in Table 4. For 2020 it is forecasted that 88% of the countries will have become Trend Setters.
For the years 2015 to 2020, the percent-age of Trend Setters is forecasted to in-crease from 31% in 2015 to 88% in 2020. Indeed in 2015, not all countries have yet opened an Open Data portal, some do, however these still require improvements to reach the levels of the best performing countries. One can forecast that by 2020,
Year Beginner Advanced Beginner
Follower Trend Setter
2005 63% 9% 28% 0%
2010 44% 16% 37% 3%
2015 19% 6% 44% 31%
2020 0% 0% 12% 88%
Table 4 - Overview number of countries per ODM classification (in %), 2005, 2010, 2015, 2020
all countries will have a fully operating por-tal. Additionally, countries will also intro-duce improvements to increase their Open Data Maturity. In 2020, almost all EU 28+ Member States will have become Trend Setters as can be seen in Figure 17.
7.1 Market sizeThe first metric quantifies the potential size of the current and future Open Data market in the EU 28+. The results will be presented as an aggregated euro value as well as a percentage of the overall EU GDP. This section also outlines the additional growth that Open Data will generate in the period 2016-2020.
7.1.1 Value of market sizeIn determining the direct overall EU Open Data market size, the value of the Open Data market size for each EU28+ country is calculated and aggregated. As a basis, the research done by MEPSIR166 and Vickery167 is used. MEPSIR stated that the direct Open Data market size of the EU25 was 27 bn EUR in 2005. After extrapolating this number to the EU28+ Member States, the direct size of the Open Data market for the EU28+ is estimated at 28 bn EUR in 2005, which would represent 0.23% of the total EU28+ GDP at that time.

Creating Value through Open DataStudy on the Impact of Re-use of Public Data Resources
71
Based on the percentages per maturity level and the country scores from the Open Data Maturity model, a per annum growth rate can be determined per EU 28+ country. Using these numbers, an EU28+ average was
calculated. Figure 18 shows that as countries become more mature, the average growth rate for the EU28+ increases.
Figure 17 - Evolution of Open Data Maturity of EU28+ countries, 2005-2020
Figure 18 - Average growth of direct market size in EU28+, 2014-2020
Figure 19 - Average growth of direct market size in EU 28+ corrected for inflation, 2014-2020
0%10%20%30%40%50%60%70%80%90%
100%
2005 2006 2007 2008 2009 2010 2011 2012 2013 2014 2015 2016 2017 2018 2019 2020
Evolution of Open Data Maturity of EU 28+ countries, 2005-2020
Trendsetters Followers Advanced Beginners Beginners
4,0%4,5%5,0%5,5%6,0%6,5%7,0%
2014 2015 2016 2017 2018 2019 2020
Average growth figure EU28+ market size - not corrected for inflation
6,5%
7,0%
7,5%
8,0%
8,5%
2014 2015 2016 2017 2018 2019 2020
Average growth figure EU28+ market size - corrected for inflation

72
Furthermore, the research by Vickery does not take into account inflation over the years. By combining the results from the maturity model with the (forecasted) infla-tion figures, the growth figures per annum effectively do change (Figure 19). The av-erage growth equals 6.8%.
When the growth figures are applied to the 2005 market size, the current direct market size can then be calculated. For 2015, the direct market size of Open Data is expected to be 51 bn EUR for the EU 28+. This is an 82% increase compared to 2005. The direct market size for the pe-riod of 2016-2020 can also be calculated. Between 2016 and 2020, the market size is expected to increase by another 36.9%, from 55.3 bn EUR in 2016 to 75.7 bn EUR in 2020, as can be seen in Table 5 and Fig-ure 20. The direct market size in 2020 per EU28+ country can be found in Appendix II - Direct market size per EU28+ country.The indirect market size can be estimated
using a ratio for the difference between direct and total market size (direct and in-direct effect). Vickery found a ratio of 3,5 whilst Shakespeare found a ratio of 3.78. These ratios are used to estimate a range for the total market size for the EU 28+ which can be found in Table 6. The total market value of Open Data, combining the direct and indirect market size, is estimat-ed between 193 bn EUR and 209 bn EUR for 2016 with an estimated projection of 265-286 bn EUR for 2020, including infla-tion corrections. By subtracting the direct market size from the total market size, the indirect market size is calculated as can be seen in Table 7. The estimates for the high bound of the total an indirect market size are plotted in Figure 21.
For the period 2016-2020, the cumulative direct market size is estimated at 325 bn EUR. The cumulative total market size for Open Data is forecasted to be between 1,138 and 1,229 bn EUR.
2016 2017 2018 2019 2020
€ 55.3 € 59.7 € 64.6 € 69.9 € 75.7
Table 5 - Direct market size of Open Data in billions, 2016-2020
Figure 20 - Direct market size of Open Data, 2015-2020
0 10 20 30 40 50 60 70 80
2015 2016 2017 2018 2019 2020
Bill
ions
Direct market size of Open Data EU 28+

Creating Value through Open DataStudy on the Impact of Re-use of Public Data Resources
73
2017 2018 2019 2019 2020
Lower bound € 193 € 209 € 226 € 245 € 265
Higher bound € 209 € 226 € 244 € 264 € 286
2017 2018 2019 2019 2020
Lower bound € 138 € 149 € 161 € 175 € 189
Higher bound € 154 € 166 € 180 € 194 € 210
Table 6 - Estimated total market size of Open Data for EU28+ in billions, 2016-2020
Table 7 - Estimated indirect market size of Open Data for EU28+ in billions, 2016-2020
7.1.2 Market share as percentage of GDP
In 2005, the direct market size of Open Data was equal to 0.23% of the total EU28+ GDP of 12,095 bn EUR. In the years 2006 to 2015, the direct market size of Open Data has grown more rapidly than the combined GDP of the EU28+, due to the high Open Data Maturity of the EU 28+ countries. For 2015, the combined GDP is forecasted to reach 14,847 bn EUR. This is an increase of 22.8% compared to 2005. However, the direct market size for Open Data in 2015 is estimated at 51.3 bn EUR, equal to 0.35% of the EU 28+ GDP. This is an increase of 49%.
For the period 2016-2020, the GDP is esti-mated to grow with the forecasted infla-tion figures only. This will lead to a GDP of 15,998 bn EUR in 2020, an increase of 7.7% compared to 2015. In this period, the direct market size of Open Data will have increased from to 51.3 bn EUR in 2015 to 75.7 bn EUR in 2020. The market share of Open Data as a percentage of GDP will have increased to 0.47%. This is a 36.9% increase in market share compared to 2015. Table 8 provides an overview of the expected share of Open Data per annum for the entire period. Figure 22 shows the forecasted increase in the share of GDP.
Figure 21 – Total market size (high bound), split in direct and indirect size for EU28+in billions, 2016-2020
Direct market size of Open Data EU 28+
€ 350
€ 300
€ 250
€ 200
€ 150
€ 100
€ 50
€ 0
2016 2017 2018 2019 2020
Bill
ions
Direct market size Indirect market size
€ 350
€ 300
€ 250
€ 200
€ 150
€ 100
€ 50
€ 0
2016 2017 2018 2019 2020
Bill
ions
Direct market size Indirect market size
Total Market size Open Data EU28+

74
2016 2017 2018 2019 2020
Share of GDP 0.37% 0.39% 0.42% 0.44% 0.47%
Table 8 - Forecasted share of direct Open Data in EU 28+ GDP, 2016-2020
168Professionalservicesincludescientific,technical,administrativeandsupportservices169Publicadministrationincludesdefence,education,healthandsocialworkactivities
7.1.3 Open Data market size per sector
Open Data per definition cross-cuts through different sectors of the econo-my. This had already been identified and quantified by DemosEurope & WISE by assigning different weight factors to the sectors. Furthermore, the McKinsey study illustrated potential growth. The sectors identified overlap largely with the sectors defined by Eurostat, as was illustrated in Section 5.3.1.
The weight factors derived from the Dem-osEurope & WISE research were combined with the sector size figures of Eurostat, measured in percentage of GDP. The GDP figures per country were used to calculate the aggregated EU28+ weighted percent-
ages per sector. Public administration is by far the sector that will gain the most from opening up data, as can be seen in Table 9, confirming that the public sector is the first re-user of its own data. For ag-riculture, and the arts and entertainment sector, the benefits expected are smaller. Open Data still has a lot of potential in these sectors but will take more time to reach the full potential.
Using the weighted factor of Open Data value, the direct and total market size of Open Data for the EU 28+ can be divided over the sectors. The results for 2020 can be found in Figure 23 and Figure 24. For the total market size per sector, the higher bound ratio from Shakespeare is used.
Figure 22 - Forecasted increase in share of direct Open Data in EU 28+ GDP, 2016-2020
6,0%
6,1%
6,2%
6,3%
6,4%
6,5%
6,6%
6,7%
6,8%
6,9%
7,0%
2016 2017 2018 2019 2020
Increase in share of GDP

Creating Value through Open DataStudy on the Impact of Re-use of Public Data Resources
75
Sector Weighted factor
Agriculture 0.50
Industry 13.27
Construction 3.58
Trades & Transport 13.15
ICT 8.90
Finance and Insurance 8.06
Real estate 11.88
Professional services 168 10.95
Public administration 169 29.21
Arts, entertainment, recreation 0.50
Table 9 - Weighted factor of Open Data value per Eurostat sector
Figure 23 - Direct market size of Open Data per market sector for EU28+ in millions, 2020
Figure 24 - Total market size of Open Data per market sector for EU28+ in millions, 2020
379
10,045
2,712
9,955
6,738
6,103
8,996
8,289
22,111
379
0 5,000 10,000 15,000 20,000 25,000
Agriculture
Industry
Construction
Trades & Transport
ICT
Finance and Insurance
Real estate
Professional services
Public administration
Arts, entertainment, recreation
Millions
Direct market size per sector
Agriculture
Industry
Construction
Trades & Transport
ICT
Finance and Insurance
Real estate
Professional services
Public administration
Arts, entertainment, recreation
Total market size per sector
1,431
37,971
10,251
37,629
25,468
23,068
34,005
31,332
83,578
1,431
0 10,000 20,000 30,000 40,000 50,000 60,000 70,000 80,000 90,000
Millions

76
€ 325 billiondirect market sizefor period 2016-2020
36.9% increasemarket size 2016-2020
Direct market size
Total market size
Direct
Indirect
2016
€55.3 bn
€75.7 bn
2020

Creating Value through Open DataStudy on the Impact of Re-use of Public Data Resources
77
Open Dataper countrydirect market size in 2020per EU 28+ country
Agricultu
re
Classification
> € 5 bn
€ 0,5 - 5 bn
< € 0,5 bn
€ 379
Indust
ry
€ 10,045
Constru
ctio
n
€ 2,712
Trades &
Transp
ort
€ 9,955
ICT
€ 6,738
Finance
& In
sura
nce
€ 6,103
Real est
ate
€ 8,996
Profe
ssio
nal serv
ices
€ 8,289
Public adm
inist
ratio
n
€ 22,111
Arts,
entert
ainm
ent, re
creatio
n
€ 379millions

78
Figure 25 - Total number of direct Open Data jobs per country, 2020
0 2 4 6 8 10 12 14 16 18 20
United Kingdom
Switzerland
Sweden
Spain
Slovenia
Slovakia
Romania
Portugal
Poland
Norway
Netherlands
Malta
Luxembourg
Lithuania
Latvia
Italy
Ireland
Iceland
Hungary
Greece
Germany
France
Finland
Estonia
Denmark
Czech Republic
Cyprus
Croatia
Bulgaria
Belgium
Austria
Thousands
Total number of direct Open Data jobs

Creating Value through Open DataStudy on the Impact of Re-use of Public Data Resources
79
7.2 Number of jobs createdThe metric for the number of jobs aims at determining how many jobs directly relat-ed to Open Data will be created in the EU 28+ by 2020. In total, the EU28+ employed 219,936,400 people in 2014.170 Within the EU28, 212,866,400 persons of the work-ing population were employed. Thus Swit-zerland, Norway and Iceland together employed 7,070,000 persons in 2014. Ce-defop’s medium term forecasts indicate that the job market in the EU is expected to grow on average with 0.55% per annum up to 2020,171 increasing employment to a total of 226 million persons in 2020 for the EU28. This growth is lower than the expect-ed growth in GDP since employment recov-ery from the financial crisis is expected to be more modest and lagged.172
In 2014, 79.6 million persons were em-ployed in knowledge intensive jobs within the EU28+.173 Compared to the overall num-ber of persons employed within Europe, 36.1% of the employed persons were em-ployed within jobs consisting of knowledge intensive activities. Based on the data from the Spanish studies,174 a range of Open
Data jobs as a percentage of knowledge in-tensive jobs can be determined. As a lower bound, it can be assumed that the number of jobs directly related to Open Data was 0.074% of the knowledge intensive em-ployment. For the upper bound, it can be assumed that the number of jobs is equal to 0.082% of knowledge intense employment. For the middle bound, the percentage is set at 0.078%.
Based on the expected development of the employment of persons in knowledge in-tensive activities and the expected growth in Open Data Maturity, the number of jobs per annum for the period 2016-2020 can be calculated, as can be seen in Figure 26. The upper, middle and lower bound of Open Data jobs are taken into account in the fore-casts as well, providing a range for the fore-casted number of direct jobs per annum in the EU28+ for the period 2016-2020. Besides the total number of jobs directly re-lated to Open Data in the EU 28+, the num-ber of jobs per country is calculated. Figure 25 shows the total number of direct jobs in 2020 per EU 28+ country.
170 http://ec.europa.eu/Eurostat/web/lfs/data/database?p_p_id=NavTreeportletprod_WAR_NavTreeportletprod_INSTAN-CE_IFjhoVbmPFHt&p_p_lifecycle=0&p_p_state=normal&p_p_mode=view&p_p_col_id=column-2&p_p_col_count=1
171 Cedefop (2010) 172 Cedefop (2010) 173 http://ec.europa.eu/Eurostat/web/products-data sets/-/htec_kia_emp2174 Datos.gob.es(2011),Datos.gob.es(2012),Datos.gob.es(2014)
Figure 26 - Forecasted total number of direct Open Data jobs (in persons) per annum, 2016-2020
65,000
70,000
75,000
80,000
85,000
90,000
95,000
100,000
Total number of direct Open Data jobs in EU28+
High Middle Low
2016 2017 2018 2019 2020

80
Figure 27 - Percentage growth of total number of direct Open Data jobs, 2016-2020
Figure 28 - Number of created direct Open Data jobs, 2016-2020
Figure 29 - Number of created direct Open Data jobs, 2016-2020
5,0%
5,5%
6,0%
6,5%
7,0%
7,5%
8,0%
2016 2017 2018 2019 2020
Growth in direct Open Data jobs
0
1,000
2,000
3,000
4,000
5,000
6,000
7,000
8,000
Direct Open Data jobs created
2016 2017 2018 2019 2020
0
5,000
10,000
15,000
20,000
25,000
30,000
2016 2017 2018 2019 2020
Total number of Open Data jobs created
Shakespeare Vickery

Creating Value through Open DataStudy on the Impact of Re-use of Public Data Resources
81
The forecasted total number of direct Open Data jobs in 2016 has an upper bound of 75,400 jobs. By 2020, the upper bound pro-vides a forecast of just under 100,000 jobs for the total number of direct Open Data jobs. This equals a growth of 32% over a 5-year period. Per year, the increase in num-ber of jobs is forecasted to grow on average with 7.3% as can be seen in Figure 27. The growth is highest in 2016 due to the high expected growth in employment in the EU28+. For the period 2017-2020, the fore-casted growth in employment per annum is equal. Therefore, the difference in growth is caused by the difference in the Open Data growth rate. This rate is lower in 2017 than in following years. Because the expected Open Data growth and forecasted employ-ment growth only differ slightly for 2019 and 2020, the growth percentage stabilises just under 7.4% in these years.
In the period of 2016-2020, the total num-ber of Open Data jobs increases with almost 25,000 direct Open Data jobs. Every year new Open Data jobs are created. As can be seen in Figure 28, in the period 2016-2020 more than 5,000 Open Data jobs are cre-ated within the EU 28+ per year.
Besides knowing the number of jobs cre-ated directly in the field of Open Data, it is very interesting to know the total number of Open Data jobs created, including direct and indirect jobs. However, no ratios exist to calculate the number of total jobs when the number of direct jobs is known. As an estimate, the market size ratios by Vickery and Shakespeare can be used to calculate the number of total Open Data jobs. Vickery calculated a ratio of 3.5 whilst Shakespeare came to a ratio of 3.78. If these ratios are used, the number of total Open Data jobs in 2020 is estimated at 312,600 to 377,000 in total. The number of total jobs created in the period 2016 and 2020 is estimated at 92,500 up to 112,000 for the EU28+. Figure 29 shows the number of total Open Data jobs created per year for the period 2016-2020.

82
2016 2020
100,000
75,000
Open Data jobsin the EU28+
25,000jobs created
7.3%average increaseOpen Data jobs
2016 2017 2018 2019 2020
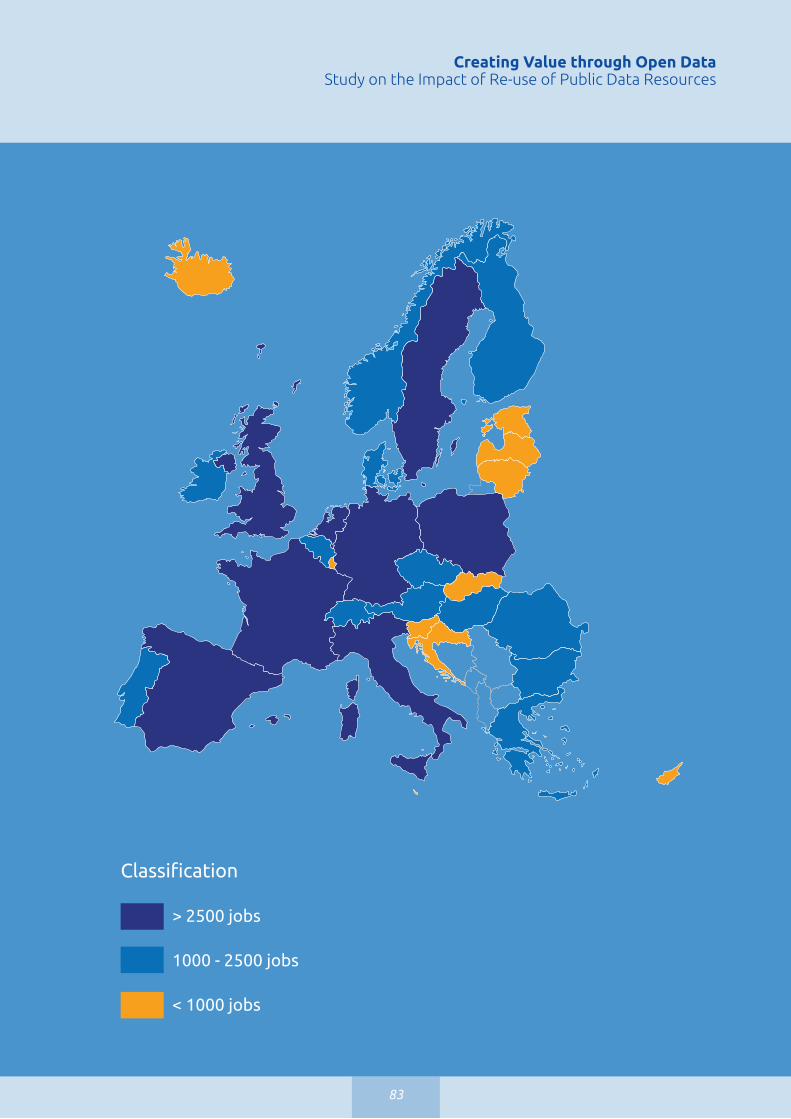
Creating Value through Open DataStudy on the Impact of Re-use of Public Data Resources
83
Classification
> 2500 jobs
1000 - 2500 jobs
< 1000 jobs
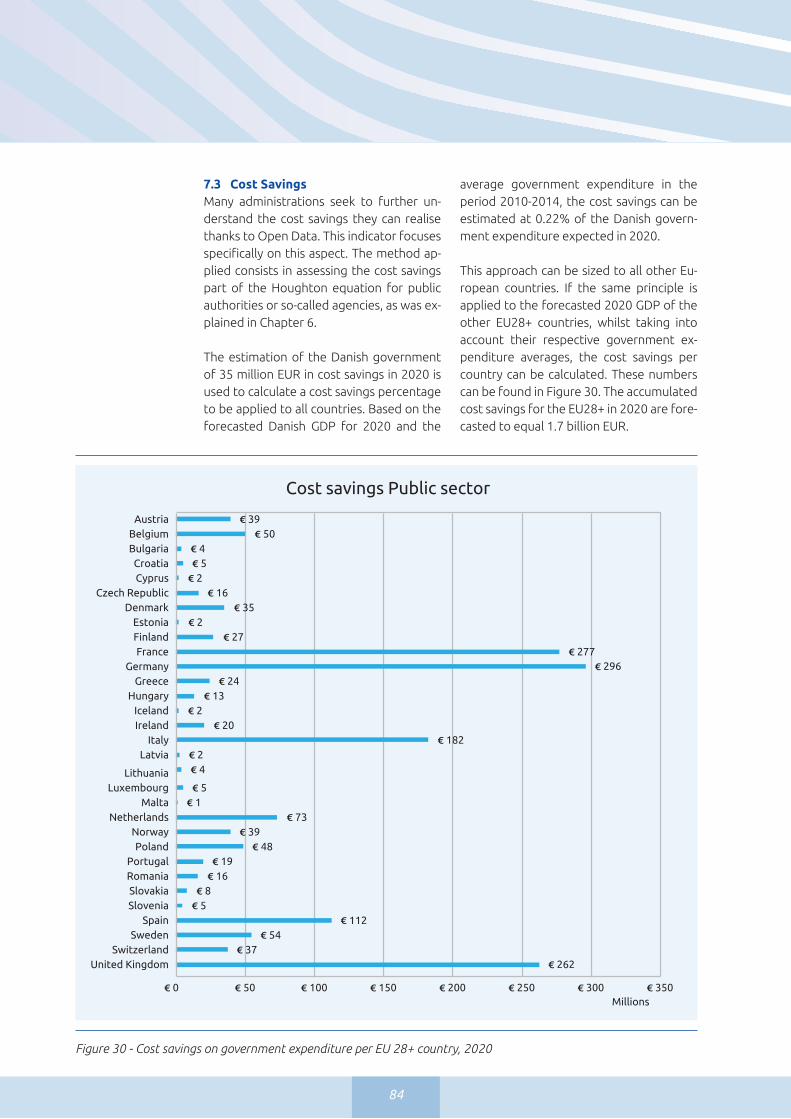
84
7.3 Cost SavingsMany administrations seek to further un-derstand the cost savings they can realise thanks to Open Data. This indicator focuses specifically on this aspect. The method ap-plied consists in assessing the cost savings part of the Houghton equation for public authorities or so-called agencies, as was ex-plained in Chapter 6.
The estimation of the Danish government of 35 million EUR in cost savings in 2020 is used to calculate a cost savings percentage to be applied to all countries. Based on the forecasted Danish GDP for 2020 and the
average government expenditure in the period 2010-2014, the cost savings can be estimated at 0.22% of the Danish govern-ment expenditure expected in 2020.
This approach can be sized to all other Eu-ropean countries. If the same principle is applied to the forecasted 2020 GDP of the other EU28+ countries, whilst taking into account their respective government ex-penditure averages, the cost savings per country can be calculated. These numbers can be found in Figure 30. The accumulated cost savings for the EU28+ in 2020 are fore-casted to equal 1.7 billion EUR.
Figure 30 - Cost savings on government expenditure per EU 28+ country, 2020
262 37
54 112
5 8
16 19
48 39
73 1
5
4 2
182 20
2 13
24 296
277 27
2 35
16 2 5 4
50 39
0 50 100 150 200 250 300 350
United KingdomSwitzerland
SwedenSpain
SloveniaSlovakia
RomaniaPortugal
PolandNorway
NetherlandsMalta
LuxembourgLithuania
LatviaItaly
IrelandIceland
HungaryGreece
GermanyFrance
FinlandEstonia
DenmarkCzech Republic
CyprusCroatia
BulgariaBelgium
Austria
Millions
Cost savings Public sector

Creating Value through Open DataStudy on the Impact of Re-use of Public Data Resources
85
€ 1.7 billion savedin costs EU28+ for PublicAdministrations in 2020
Classification
> € 30 mln
€ 5 - 30 mln
< € 5 mln

86
7.4EfficiencyGainsThe aim of efficiency is to improve resource allocation so that waste is minimized and the outcome value is
maximised, given the same amount of re-sources.175 To be able to make use of data, it is important that it is available under an open licence to be able to use it freely. Furthermore, if the discoverability of the Open Data is high, more people are able to find it and profit from the advantages that the use of Open Data enables. Openly sharing data can reduce search costs and make monitoring easier. It enables faster and easier access to information, better resource allocation, increased automation, standardisation and interoperability.
Better decision making is one of the main benefits of Open Data sharing, also known as “data-driven decision making”. This ex-pression is often associated with the use of Big Data, which is defined as “high-volume, high-velocity and high-variety information assets that demand cost-effective, innova-
tive forms of information processing for enhanced insight and decision making”. Better decision making is one of the main benefits of Open Data sharing, also known as “data-driven decision making”. This ex-pression is often associated with the use of Big Data, which is defined as “high-volume, high-velocity and high-variety information assets that demand cost-effective, innova-tive forms of information processing for enhanced insight and decision making”.178
OpenCoesione176
The OpenCoesione website focuses on projects that are financed by Italian the department of Cohe-sion Policies (Dipartimento per le Politiche di Coesione). It shows how (much) money is spent on different subjects in different regions, with visualizations. The data are published for the public to assess whether the projects that are financed meet their needs and if resources are used ef-fectively. By doing so, citizens are able to understand how this specific department within the government is spending their money and thereby transparency is increased.
RomaScuola177
In Italy a tool was developed to com-pare schools depending on such facets as frequency of teacher absence, inter-net connectivity, use of IT equipment for teaching, frequency of students’ transfer to other schools and quality of education in accordance with the percentage of issued diplomas. The information provided is updated peri-odically based on data from Ministry of Education and RomaCapitale.
175 Jetzek et al. (2013a)176 http://www.opencoesione.gov.it/ 177 http://blogs.worldbank.org/ic4d/open-government-data-helping-parents-find-best-school-their-kids178 http://www.gartner.com/it-glossary/big-data 179 https://www.gov.uk/what-works-network
INFLUENCE
What Works Network 179
In the UK, the “What Works Network” initiative was introduced and is based on the principle that decision-making should be informed by the best available evidence on both what works and what does not work. It aims to improve the way government and other organizations create, share and use high quality evidence for decision-making. It also collects evidence on the effective implementation of current policy programmes and practices. The initiative should encourage practitioners, commissioners and policy-makers to use these findings to inform their decisions.
“Better decision making is one
of the main benefits of Open Data sharing.”

Creating Value through Open DataStudy on the Impact of Re-use of Public Data Resources
87
Open Data is a subset of Big Data. Deci-sions are based on available information gathered from many different sources. For example, data is used by individuals to de-cide which car to buy, holiday to book or education to choose. In general, more data provides more potentially useful insights. Therefore, more Open Data can help in-dividuals, businesses and the government to make better decisions based on more information available.
The fact that new data is available that was not accessible before stimulates creative minds to look into new business oppor-tunities. Most of the examples available regarding the use of Open Data in busi-nesses come from start-ups. Germany and the UK have the highest number of start-ups in Europe. Especially in London the start-up economy is growing rapidly and is responsible for about 27% of all new Lon-don jobs.181 However, larger companies are able to use Open Data to gather important information more easily. For example, airlines will use Open Data on passenger traffic, place of residence, nationality etc. as a means to inform their decision about opening new routes.
MapReplace180 A Google Chrome Extension from Norway that will replace Google Maps with other mapping services on any web site. MapReplace replaces Goog-le Maps with maps from the Norwe-gian Mapping Authority, Finn.no (Nor-way) or Open Street Map. The benefit of replacing Google Maps with other map providers is that they provide better maps for certain areas. For ex-ample, the maps from the Norwegian Mapping Authority provide maps of superior accuracy for Norway.
180 https://github.com/follesoe/MapReplace 181 http://www.theguardian.com/media-network/2014/nov/13/uk-germany-europe-tech-digital-startups 182 www.uc.se183 http://www.citysdk.eu/about-the-project/
Open Data is not used only by the private sector, but by the public sector as well. Municipalities are linking different pro-jects such as the creation of smart cities. A smart city uses digital technologies to enhance quality and performance of urban services, to reduce costs and resource con-sumption, and to engage more effectively and actively with its citizens.
UC 182
UC is a Swedish company active in the Finance and Insurance sector. The company creates analyses to make decisions for banks and compa-nies easier. They provide companies, banks and individuals with credit re-ports, based on Open Data from vari-ous sources. This includes Open Data obtained via (amongst others) the tax authority, land surveys, District Court, companies, and registration offices. Also income data, marital status, and property information reports are used.
CitySDK project 183
As a project funded by the European Commission, the CitySDK project is helping cities to open their data and giving developers the tools they need on how to deliver services in urban environments. Applications for mo-bile devices can be more easily devel-oped including location and opening hours of tourist attractions, historical background information for specific buildings or transportation schedules. Combining information from all local sources enables better decision mak-ing for citizens on where to go to and how to get there.
“Open Data is not only used by the private sector, but by the public sector as well.”

88
Kannattaako kauppa 184
A Finnish website is providing a ser-vice which is forecasting the price of a square meter in a house or apart-ment. Based on Open Data from Sta-tistics Finland, they modelled Finnish apartment prices and their trends on zip-code level, in the years 2005–2014. Then, price trends have been predicted for the year 2016 using ad-vanced statistical modelling. The es-timates from the model are available as an interactive visualization.
184 http://kannattaakokauppa.fi/185 Capgemini Research (2015)186 Capgemini (2013)187 https://www.ackee.cz/blog/ackee-pragehacks-idea-stestickunaproti/
As shown in the examples, efficiency is an important factor in all companies of all sec-tors. To provide an illustration of the po-tential gains, three exemplar indicators are assessed and detailed. The first one is how Open Data can save lives through efficiency gains. The second one is time saving in the transportation sector. This sector is more mature in terms of sharing and using Open Data throughout Europe and will give a good indication of the potential benefits of Open Data for other sectors. The last one is focused on environmentalbenefits, as this is a subject of growing importance and will cross-cut through most if not all sectors of the economy.
7.4.1 Life savingThe number of healthcare providers that recognize the value of Open Data is grow-ing. All European countries have a separate health section on their national Open Data portals and indicate that the healthcare data sets are among the most downloaded data sets.185 The advantage of providing open healthcare data is to get better insight in the quality of healthcare. It does not only help patients to choose a healthcare provider based on treatment outcomes, but stimu-lates healthcare providers to share best practices as well.
The NHS shared MRSA bacteria infection rates per hospital in the UK.186 By making these data available, it was possible for hospitals with high infection rates to con-tact the hospitals that were performing better and learn from their approach. Tak-ing measurements to increase efficiency can save lives. Not only in the healthcare sector directly, but also other fields where life threatening situations occur. To obtain an estimate of the lives that can be saved
by using Open Data, it is nec-essary to look at some health statistics first.
Besides, within the health care sector, there are sev-
eral other ways in which Open Data can be used to save lives. By arriving earlier at the scene, fire brigades can make a larger difference. If information is available in
LuckyMe187 A Czech application called “LuckyMe” for iPhone and Apple Watch lowers the risk of users of getting mugged or assaulted. Unlike crime maps it reports the situation in an actual lo-cation at an actual time. A quick look at a watch or a phone shows the ac-tual risk rate on a grade from 1 to 5 - one can for example check the risk rate before entering a dark street. Single incidents can be reported as well by users, either a prefilled op-tion (robbery, intoxicated person, fight, assault, vandalism) or just as a subjective feeling from a given loca-tion on a grade 1 to 5. The risk rate is calculated from three data sources: data from ambulance, data from mu-nicipal police and data reported by users. Public datasets accordingly are filtered; we take only a selected type of incidents.
INFLUENCE
“The number of healthcare
providers that recognise
the value of Open Data is
growing.”

Creating Value through Open DataStudy on the Impact of Re-use of Public Data Resources
89
real-time, fire-fighters can arrive are at the scene of the fire sooner, increasing the chance of survival for people trapped in a fire. Another major cause of death which can potentially be reduced by using Open Data is related to road fatalities. Also, opening up crime figures has the potential to save lives.
Cardiac arrestCardiovascular diseases, cancer and chronic obstructive pulmonary disease are the most common causes of death and account for 80% of the deaths in Eu-rope.188 Amongst these, disease of the cir-culatory system, i.e. heart disease, is the most important cause of death before the age of 65. It accounts for nearly 50% of the deaths for that age group. Cancer is the second leading cause (20%), while injuries and poisoning are responsible for 9% of deaths. In 2013, 350.000 European citizens were having a cardiac arrest out-side the hospital environment.189 It is im-portant to be at the emergency location in time, because the outcome of a cardiac arrest is depending on the timing of the help received. If effective cardiopulmo-nary resuscitation (CPR) is administered within three to five minutes, it can double or triple a victim’s chance of survival.190 Every minute without CPR and defibril-
Traffordcouncil192 An officers group in Trafford was asked to find out where to put new Automated External Defibrillator (AEDs). To be able to do that, they mapped ambulance re-quest data against openly available demographic and health indicators (e.g. physi-cal activity, demographic details, obesity levels, mortality rates, and cardiovascular disease). To figure out the best places to put defibrillators, a crowd map with the locations of existing units was made to identify the gaps. After the identification of the locations that required a defibrillator, companies within a 500 meter radius were asked to contribute. The current map includes 72 defibrillators.
lation reduces the chance of survival by 10%.191 Therefore, every minute counts. Open Data can help achieve this by ana-lyzing where to place equipment and sta-tion personnel.
It is not only helpful in determining where to put the defibrillators, but Open Data can also be used to guide trained person-nel to the emergency location. When the response time is decreased, the survival rate is increased.
PulsePoint 193 In multiple countries, an application for mobile devices based on Open Data is introduced that decreases response time in case of a medical emergency and increases survival rates. Applications with the highest potential of saving lives are focused on preventing death by cardiac ar-rest. In the US the most popular ap-plication is called PulsePoint and com-bines 911 calls with location data. It is thereby not only able to point people that are trained to provide CPR in the right direction of the victim, but also to the nearest publicly accessible defibrillator.
188 http://www.euro.who.int/__data/assets/pdf_file/0004/185215/Leading-causes-of-death-in-Europe-Fact-Sheet.pdf189 http://www.gezondheid.be/index.cfm?fuseaction=art&art_id=14986190 http://gcn.com/Articles/2015/04/14/Rescue-apps.aspx191 https://londonsairambulance.co.uk/our-service/news/2014/08/goodsam192 https://traffordinnovationlab.wordpress.com/category/digital-social-innovation/open-data-digital-social-innovation/193 http://www.pulsepoint.org/

90
Open Data could be helpful to increase real-time access to necessary information and thereby enables a faster response when someone is in need of medical as-sistance. In the US, it was estimated that opening up private healthcare databases could have saved 90,000 people from get-ting unnecessary heart attacks and could have prevented 25,000 deaths in the US alone.194 This emphasizes the importance of opening up not only government data, but private data sets as well.
DiabetesOne of the most common diseases nowa-days is diabetes. There are about 60 mil-lion people with diabetes in Europe.196 This is equal to 10.3% of men aged 25 and over and 9.6% of women. Open Data can contribute to better decision making by the individual patient. Meal planning is an important part of daily life for someone with diabetes, because a good schedule helps patients to prevent blood sugar lev-els from extreme highs and lows. Informa-tion regarding the amount of fat, carbohy-drates and proteins should be available for
all types of food to put together a healthy meal. Sanofi, a multinational pharmaceuti-cal company, is committed to improving global diabetes management. Since 2011 they organize the Data Design Diabetes Innovation Challenge which aims at com-bating diabetes by integrating Open Data with human-centred design.197 Every year a winner is chosen that is rewarded with $100,000 (EUR 91,089) for their innovative concept to be further developed.
The Euro Diabetes Index 2014 also indi-cates that prevention is an area for im-provement. European data on obesity show that in a number of European coun-tries more than 25% of the adult popula-tion is considered to be obese (BMI >30). It is important to share data regarding diabetes prevention to learn from best practices. Sweden is considered the coun-try with the best diabetes care.199 As it was the only country that could provide data regarding all 28 indicators (subcategories Prevention, Case finding/Screening, Range and reach of services, Access to treat-ment/care, Procedures, Outcomes) that were taken into account, Sweden’s best
GoodSAM 195 In London (UK) a similar application was introduced. GoodSAM is an app that uses GPRS technology to alert trained first responders that are close to the emergency location. People who downloaded the applica-tion are able to press a button to call for help while their location is being identified. There are 5,000 medical emergencies in London each day, but also thousands of individuals that are able to provide medical assistance while waiting for an ambulance to arrive.
Ginger.io 198 The first winner of the Data Design Di-abetes Innovation Challenge in 2011 was ginger.io. Sensor data collected through your smart phone combined with self-reported information is used to identify people who may need help. Healthcare providers receive a warning when there are changes in behaviour so they are able to deliver support to the patients at the mo-ment they need it. Hence, healthcare providers are able to provide treat-ment and support more efficiently.
194 http://techcrunch.com/2013/01/18/we-must-choose-privacy-or-medical-breakthroughs/ 195 https://londonsairambulance.co.uk/our-service/news/2014/08/goodsam 196 http://www.euro.who.int/en/health-topics/noncommunicable-diseases/diabetes/data-and-statistics 197 http://www.datadesigndiabetes.com/ 198 https://ginger.io/ 199 http://www.healthpowerhouse.com/files/EDI-2014/EDI-2014-report.pdf
“Open Data could be useful
to increase real-time access to information.”

Creating Value through Open DataStudy on the Impact of Re-use of Public Data Resources
91
performance could be explained by the fact that they know what they are doing. This emphasizes the importance of gather-ing data regarding diabetes diagnosis and treatments to learn from. Data on quality indicators is also being collected in Swe-den and guarantees continuous quality as-sessment of diabetes care. Providing those data to all diabetes care providers makes comparison possible and thereby stimu-lates quality improvement.
Connect & Coach 200 The first winner of the Data Design Di-abetes Innovation Challenge in 2011 was ginger.io. Sensor data collected through your smart phone combined with self-reported information is used to identify people who may need help. Healthcare providers receive a warning when there are changes in behaviour so they are able to deliver support to the patients at the mo-ment they need it. Hence, healthcare providers are able to provide treat-ment and support more efficiently.
Fire DepartmentNext to using Open Data for medical emer-gencies, it is also possible for the fire de-partment to save lives. It is estimated that in 2004 over 8.000 people died in fires in the 27 countries of the EU.201 More recent fig-ures are only available for 21 EU countries in 2010 (excluding France and Belgium) with 3.235 deaths.202 For fire-fighters, data is im-portant to improve decision making. Data regarding works and other activities on the road, the presence of hazardous materials in buildings and water depths including ob-stacles below surface are very important for fire-fighters. The risks will be lower when
this information is available in real-time and the chance of survival for people trapped in a fire will be higher, as the fire-fighters are at the scene of the fire sooner. They are able to make better judgments about the risks and equipment needed by using Open Data regarding the building they are on their way to.
London Fire Brigade The fire brigade of London has devel-oped a tool using public data allow-ing it to view emergency response times and fire incidents per ward. This means that they are better placed to know where to focus resources.204 They also use software that lets the fire brigade use a technique known as modelling regression to target places that register as at high risk for fire. In those areas they will carry out home safety checks, advise people on fire safety and fit smoke alarms.205
Road fatalitiesAnother major cause of death which can potentially be reduced is related to road fatalities. In 2011, more than 30,000 peo-ple died on the roads of the EU.206 The Eu-ropean Commission has adopted the Road Safety Programme which aims to reduce the traffic-related death rate in Europe between 2011 and 2020. The most re-cent numbers of 2013 estimate the total number of road fatalities to be 25,900.207 Data for 2014 is not available yet, but it was predicted that the number of fatali-ties decreased with 1% compared to 2013. The highest number of road fatalities per inhabitants was in Romania, followed by Latvia and Lithuania, while the lowest road fatality rates were reported for Sweden
200 http://phrql.com/connect-coach/ 201 Nibra (2009)202 https://www.genevaassociation.org/media/874729/ga2014-wfs29.pdf 203 https://www.w3.org/2013/share-psi/wiki/images/8/86/Share-psi-2_0-samos-workshop-bartvanleeuwen.pdf 204 http://diginomica.com/2015/07/15/cabinet-office-says-open-data-government-needs-to-go-viral-but-is-whitehall-ready/#.VazvYvntlBd205 http://www.bbc.com/news/business-21902070 206 http://ec.europa.eu/transport/road_safety/specialist/statistics/index_en.htm 207 http://ec.europa.eu/transport/road_safety/pdf/observatory/trends_figures.pdf

92
and the UK being the second safest. This is due to the fact that West-European coun-tries are more focused on reducing the number of accidents. Planning has played the biggest part in reducing accidents in Sweden.208 Roads are built with safety pri-oritised over speed or convenience. Open Data can also help prevent those casual-ties. Software that can predict where and when an accident will occur already exists.
Potential lives savedBased on the number of citizens having a cardiac arrest outside the hospital and the percentage that received CPR from by-standers, 7,000 lives a year can be saved only by introducing applications that make it possible for bystanders to be at the emergency location one minute earlier. This does not even take into account the possibility that a higher percentage of the survivors will be resuscitated by bystand-ers instead of medical professionals. As it is possible for everyone to access the exact location of an emergency in real-time, the time to get to the location for the ambu-lances will be reduced as well.
It is difficult to give an estimation of the effectiveness of the CRASH program. However, traffic fatalities have dropped by 5.5% in the US. So in theory, when this program would be further developed and rolled out in Europe, it would have a poten-tial of saving 1,425 lives a year (i.e. 5,5% of the European road fatalities).
7.4.2 Time savingAnother interesting way of look-ing at efficiency gains is through time savings due to better avail-ability of information regarding
CRASH program 209 In London (UK) a similar application was introduced. GoodSAM is an app that uses GPRS technology to alert trained first responders that are close to the emergency location. People who downloaded the applica-tion are able to press a button to call for help while their location is being identified. There are 5,000 medical emergencies in London each day, but also thousands of individuals that are able to provide medical assistance while waiting for an ambulance to arrive.
Accident statistics and data analysis are needed to identify trends and to assess the effectiveness of strategies and meas-ures to reduce death and injury. Texting and driving is a major cause of road acci-dents. It is 23 times more likely to cause an accident while using your phone while driving.210 The prevalence of talking on a cell phone while driving at least once in the past 30 days among drivers aged 18–64 years ranged from 21% in the UK to 69% in the US in 2011.211 The prevalence of drivers who had read or sent text or e-mail mes-sages while driving at least once in the past 30 days ranged from 15% in Spain to 31% in Portugal and the US.
LifeSaver 212 This application automatically locks your phone when it detects that you are driving. It also includes a map with an overview of the location of people that were caught texting while driving to stimulate driving safely. If you are unlocking your phone while driving, a text message notification is send to your contact. The LifeSaver app ena-bles monitoring your loved ones.
INFLUENCE
208 http://www.economist.com/blogs/economist-explains/2014/02/economist-explains-16209 http://www.govtech.com/computing/GT-Software-Predicts-When-Where-Accidents-Occur-on-Tennessee-Highways.html210 http://lifesaver-app.com/ 211 http://www.cdc.gov/mmwr/pdf/wk/mm6210.pdf 212 http://lifesaver-app.com/

Creating Value through Open DataStudy on the Impact of Re-use of Public Data Resources
93
public transportation schedules and traffic jams. Many cities and public transport or-ganizations provided API’s to be used for application development. It is important to focus on reducing travel time, as individuals tend to commute over longer distances.
Congestion costs in Europe are about 1% of GDP every year.214 The average commuting time in 2005 in Western Europe was 38 min-utes.215 The commuting time of people us-ing public transport was on average 30-40% longer compared to people travelling by car. Therefore, the average commuting time was higher for countries with a higher percent-age of commutes using public transport.
Warszawski Ninja 213 Warsaw Ninja, in Poland, is an app for public transport users to share information about problems and de-lays en route. In every big city with a complicated public transport grid citizens experience problems when trains or trams get stuck on the way or if construction works cause delays. Warsaw Ninja allows users to share all transport-related problems in real time allowing them to make informed commute decisions.
Never Run 216 NeverRun is a Czech application for everybody who commutes daily in Prague, showing the public transport in the town. The app shows the position of all transport vehicles around the user. The user then knows if he or she should rush to catch a metro train or relax instead. The app uses data supplied by Magistrát hl. m. Prahy, providing position data of all means of transport.
The European average for motorists stood at 5.74 seconds of delay for every kilo-metre in 2012.217 In Malta the average is much higher with commutes spending an extra hour of unnecessary travelling. The most congested country in 2014 was Belgium with an average of 50 hours wasted in congestion per person in one year time.218 Milan was the most congested city with 61.2 hours wasted. Those Europe-an nations struggling with high unemploy-ment and low or negative growth in 2013 typically recorded lower traffic congestion than in 2012. Understanding how Open Data can be used to reduce travelling time can be a valuable commodity. Furthermore, a shorter travel time results in lower fuel use and reduced CO2 emission. Paris is fac-ing a smog problem due to the amount of traffic in the city and increasing pollution levels. The amount of PM10 particles, which can cause severe health problems and in-crease cancer formation, per cubic metre in Paris reached 180 micrograms, more than twice the safe limit of 80 micrograms.219
One way of reducing travel time is through a better distribution of all cars that are on the road at the same time. Providing peo-ple with an alternative route will increase the distribution on different roads and re-duce the length of traffic jams. The most
213 https://konkurs.danepowarszawsku.pl/pl/projekt/warszawskininja 214 http://ec.europa.eu/transport/themes/strategies/doc/2011_white_paper/white_paper_2011_ia_full_en.pdf 215 http://economix.blogs.nytimes.com/2011/10/14/world-of-commuters/ 216 http://neverrun.github.io/217 http://www.independent.com.mt/articles/2015-01-30/local-news/Study-shows-that-delays-on-Malta-s-roads-are-almost-
triple-the-European-average-6736129728 218 http://inrix.com/scorecard/key-findings-us/219 http://www.economist.com/blogs/charlemagne/2014/03/car-ban-french-capital
“Understanding how Open Data can be used to reduce travelling time can be a valuable commodity.”

94
popular kind of applications for mobile devices based on Open Data is probably those regarding transportation. There are many different applications available, so the examples selected all focus on another aspect of transportation.
A more effective way of dis-tributing cars is not only by providing different routes at the same time, but by dis-tributing traffic over time.
The chance of traffic jams is much lower if the total number of cars on the road is lower. Commuters all travel during rush hours, because they have to be at work around the same time. Specific regulations are needed to make it possible to work whenever and wherever you want. A trend towards working more from home is emerging in Europe. In the UK, home workers represented up 13.9% of the total workforce employed during the first quar-ter of 2014.221
Another important factor that is causing delays for motorists is looking for a parking space. The total number of parking spaces in the 28 EU countries is estimated to be 440 million, approximately two spaces for every passenger car.223 Each car travels for an average of one hour per day. Every day 20 minutes are lost looking for a parking spot.224 The average motorist wastes a total of 2,549 hours of their life driving through the streets before finding a space to park.225 In addition to providing information about parking spaces available, more recent appli-cations have explored how to estimate how long a given car will stay parked. This will in turn provide an estimate of how much time the parking space should be made available by. Also, a lot of applications focus on public transport. As an individual you are bound to the time schedule that exists, but it is possible to reduce waiting time when real-time information is available.
Potential time savedThe expression “time is money” highlights that time is valuable, because you can use that time to earn money and thereby in-crease your economic activity. Opportunity costs are the costs that occur, because
TravelSmarter 220 An interesting application that was launched as part of the OUTSMART European project is called Trav-elSmarter. It provides transport al-ternatives for the routes that are entered, based on real-time informa-tion on the status of the transport system. User’s preferences regard-ing the preferred kind of route – the fastest, the shortest, the cheapest, the most environmentally-friendly or the healthiest route – are taken into account. A pilot was done in the city of Birmingham. This application is fo-cusing on different travel options at the moment that you want to leave.
Wild! van de Spits 222 A Dutch example of using Open Data to reduce travel time is through dis-tributing the number of cars over time. “Wild! van de Spits” uses num-ber plates registration of traffic cam-era’s to select people driving during rush hours and invite them to partici-pate in their project to decrease traf-fic jams. By rewarding people for trav-elling outside rush hours, it is possible to reduce individual travel times.
INFLUENCE
220 http://www.ferrovial.com/en/press-room/news/travelsmarter-initiative-reduce-traffic-congestion/221 http://www.theguardian.com/news/datablog/2014/jun/04/proportion-of-employed-working-from-home-reaches-record-
high 222 https://www.wildvandespits.nl/Openbaar/Home.aspx223 http://annualreport2013.q-park.com/strategy/car-parking-market 224 https://www.mobypark.nl/

Creating Value through Open DataStudy on the Impact of Re-use of Public Data Resources
95
you did not do something else that would generate value with your time.228 In this case, while you are stuck in a traffic jam you could have gone shopping and spent a certain amount of money. The money not spent in this period of time is the op-portunity cost. It is important for economic growth to minimize the waste of time.
The examples show possibilities to de-crease time wasted in traffic jams or wait-ing on delayed public transport. Instead
of spending time waiting, it can better be used working or spending money through shopping, or simply taking a rest, a walk and avoiding health complications. These examples contribute to the economy in different ways, i.e. more time spent to pro-duce money-making products and services as well as buying products that increase the number of sales for a company and thereby their revenue. The amount of time wasted could be reduced through the use of Open Data based applications.
Based on the total passenger kilometres for 23 European countries in 2012, a reduc-tion of 10% waiting time will save 629 mil-lion hours of unnecessary waiting time on the road in those 23 European countries. In 2014, average hourly labour costs were esti-mated at 24.6 EUR in the EU28.229 The value of commuting time (VOCT) is estimated as the trade-off between wage and commut-ing time, based on the effects wage and commuting time have on the probability of changing jobs. The estimated VOCT is found to be relatively large, in fact about 1.8 times the net wage rate.230 The average value of commuting time would be 44.28 EUR per hour on average in Europe. Those 629 mil-lion hours are worth 27.9 bn EUR per year.
7.4.3 Environmental gainsA topic of growing concern is the green-house effect and the overall impact of cli-mate change. Governments are searching for new ways of reducing the toxic effects of, for example, CO2 emission and improve-ment of waste management. Open Data can be useful to reduce those adverse ef-fects as well, by providing more insight
into the specific areas where those problems cause the most health risks and act on them.
225 http://www.telegraph.co.uk/motoring/news/10082461/Motorists-spend-106-days-looking-for-parking-spots.html 226 https://carambla.com/227 http://tranquilien.com/ 228 http://dictionary.cambridge.org/dictionary/business-english/opportunity-cost 229 http://ec.europa.eu/Eurostat/statistics-explained/index.php/Hourly_labour_costs230 Swärdh,J.(2009)
Carambla – Park Smartly 226 This Belgian application offers a smart alternative for parking. An “eBay for city parking” where owners list their parking spaces on Carambla. Owners can earn a financial return on excess capacity and benefit from increased security by embracing smart city mobility. Car owners easily find, book and pay for parking after reserving on the website, or directly claiming the spot through the Car-ambla smart phone app
Tranquilien 227 In France an application is launched that is not only providing informa-tion about the time a train leaves, but it is using predictive modelling to indicate which trains have the most seats available. The predictions are based on multiple data sources, like population density, attractive loca-tions, day of the week, time of the day, weather etc. Travellers are able to provide information during their travelling as well.
INFLUENCE
“The amount of time wasted could be reduced by using Open Data-based applications.”

96
Air pollutionAir quality is an important subject where Open Data can have a major impact. Espe-cially in France, air quality is gaining more attention. The air pollution annual cost is estimated at 101.3 billion EUR according to a report titled “Air pollution, the cost of inaction” from the French Senate pub-lished in the summer of 2015.232 The study equally takes into account the health dam-age from pollution, but also its impact on building refurbishing, ecosystems and agri-culture. Fine particles and ozone are caus-ing 42,000 to 45,000 premature deaths in France per year.
Energy savingIndividual households can equally benefit from Open Data, by assessing their energy consumption. Awareness is raised when the energy consumption of all households is shown and comparisons can be made be-tween equal households in terms of family members and their specific energy consump-tion. People that use more energy than the average comparable household are stimu-lated to decrease their energy consumption and thereby also save money on their bills. This applies not only to individuals, but also to organizations and the public sector.
RE:CYCLE 231 In Bulgaria, a website is created to list recycling sites. The project was prompted by distrust of citizens if their garbage was actually recycled. The website displays recycling sites on a map. These sites can then be fur-ther filtered by selecting the type of site (point depot, sales network, ...) or the type of material (paper, non-ferrous metals, batteries , stalko, ...).
Plume Labs 233 An application focused on air quality is called Plume Labs. It tracks the hourly pollution levels in sixty cities in the world, including ten cities in France, four cities in Belgium and four cities in the UK. The air quality is shown us-ing an index number, whereby above 150 is considered “critical”, while any-thing above 100 is considered “harm-ful”. The start-up uses the data made public by different agencies engaged in a policy of Open Data, for example Airparif in Paris.
Päästöt.fi234 A Finnish website shows industrial emissions in all EU countries and in Ice-land, Norway, Serbia and Switzerland. The website shows the emissions level on a map, based on the European Pol-lutant Release and Transfer Register (E-PRTR) data base. The service helps to relate the orders of magnitude of emissions. It also provides citizens with the possibility to compare regions when making the decision to work or live in a region.
231 http://www.obshtestvo.bg/project/recycle.html 232 http://www.industrie-techno.com/cout-de-la-pollution-la-start-up-plume-labs-veut-democratiser-le-quantified-
environment.39198 233 https://www.plumelabs.com/ 234 http://paastot.fi/

Creating Value through Open DataStudy on the Impact of Re-use of Public Data Resources
97
Husets Web 235 In Denmark, Husets Web provides intelligent and dynamic calculations of energy saving measures that can help indi-vidual homeowner save energy and money. The calculator uses information about Danish building architecture, 200 years of building statistics, and information about heating systems. This information is combined with data on the specific property which is drawn from public databases. In addition, the homeowner can add his own data about the property and about actual energy consumption. The calcula-tor produces an individual Energy Report which provides an overview of energy improvements, like the report an energy consultant would make.
Windsor and Maidenhead council 236 Since 2009-2010 the council used 16% less gas, electricity, oil and transport fuel in its buildings and vehicles - including a 7% reduction between 2011-2012 and 2012-2013 worth £126,000 (€178,400) after starting to publish real-time data on energy use. They installed automated meter readers to monitor the usage of gas and electricity. Better meters will be acquired to further reduce the energy consumption.
235 http://www.rbwm.gov.uk/web/news_10913_energy_reduction_sustainability_strategy.htm 236 http://www.rbwm.gov.uk/web/news_10913_energy_reduction_sustainability_strategy.htm237 http://www.opower.com/company
Opower 237 A relatively new energy tech company, founded in 2007, is Opower. It helped people around the world save 5 billion kilowatt hours of energy and $575 million (EUR 524 mil-lion) in utility bill savings. They achieved this result not only by providing people with information on their own energy consumption, but compared to other similar households to create individual customer profiles. The company had grown with about 400 employees operating in three continents in 2013. There were almost 100 available positions posted on their webpage at the end of 2013. At the moment, Opower has 560 employees and is still growing. A good example to illustrate that a new company can really create a lot of jobs.

98
more Open Data can help make
better decisions
Congestion
costs are1% of GDP
7,000 livessaved due toquicker response
5.5% lessroad fatalities

Creating Value through Open DataStudy on the Impact of Re-use of Public Data Resources
99
2,549 hours
wastedfinding parking
629 millionhours saved isequivalent to
€ 27.9 bn
16% lessless energy used

100
8.1 UnderstandingOpenDatabenefitsThe majority of the studies performed pre-viously are ex-ante estimations of the ben-efits of Open Data. No comprehensive and detailed ex-post evaluations have been un-dertaken so far. It is necessary to conduct research ex-post into the benefits of Open Data. However, the necessary data to do so is at the moment hardly available. Govern-ments should be encouraged to keep close track of figures related to the costs and benefits of their own provision and re-use of Open Data and of society as a whole. Sev-eral recommendations can be made along those lines.
Thecostsandbenefitsofreleasingdatashould be further detailed. Governments receive numerous requests for informa-tion from citizens, the private sector but also via internal requests from one admin-istration to another. Handling all of these requests cost time and money. If this infor-mation was to be published as Open Data via a marginal cost model, the Request for Information Costs could be substan-tially reduced. To measure this reduction, it is recommended to release information about Request for Information Costs. The effect of releasing Open Data on govern-
ments should also be measured. Several effects could be achieved by making Gov-ernment Data more easily available, e.g. on Open Data portals. The size of these effects should be measured:■ Cost savings achieved by Open Data;■ Increased transparency by Open Data;
Furthermore, a marginal or free cost model for Open Data is needed. This is already recommended by previous studies but nonetheless very important in increas-ing the use of Open Data. The availability of Open Data at maximum marginal cost price (and preferably free of costs) is likely to promote innovation and the development of new products and services around Open Data. The price elasticity of demand for Open Data is high: public sector agencies in various countries have witnessed a strong growth in demand for information they provide after switching from cost-based pricing of Open Data to free or maximum marginal cost priced information.
Government Portals should maintain site analytics in order to obtain important information on who uses the websites, which data sets are being downloaded and how many downloads take place. An exam-ple of a national portal for which site analyt-ics is available is the portal of data.gov.uk. This kind of information is useful in order to calculate for instance cost savings.
On Open Data portals, feedback mecha-nisms should be created. The research of Open Data should be a multi-stakehold-er effort and various actors and sectors should be involved in the process.238 Feed-back mechanisms enable the interaction
Realising the value ofOpen Data
8
238 Granickas(2013),p.27
In conducting the macroeconomic analysis of the impact of the re-use of Open Data for Europe, several observations are made. The objective is therefore to offer governments with a series of recommendations on how to measure the success of their Open Data initiatives and accelerate on their Open Data journey. Certain recommendations could be made in order to enhance the quality of calculations, but also to make better use of Open Data.

Creating Value through Open DataStudy on the Impact of Re-use of Public Data Resources
101
between the supply and demand side of Open Data.
Missing data sets can be requested. Also, bugs or improvements can be reported. An opportunity to deliver feedback can also promote engagement between a portal and its users. In fine, such crowd sourcing activities will increase the quality of public data.
Also, governments should conduct sur-veys into the re-use of Open Data in the private sector. Actual estimates are needed to determine: ■ Number of companies involved in
Open Data;■ Size of companies involved in Open
Data;■ Employment in the Open Data market;■ The influence of Open Data per Euro-
stat recognized sectors should be measured.239
Furthermore, the private sector may wish to contribute in identifying future pub-lic data sets that should be released and could contribute more directly to current and future business needs.
Finally, the work force should be empow-ered to make the most of Open Data. Big and Open Data are still a new field of busi-ness, both growing rapidly. The number of people employed in these sectors is also growing. According to former EU’s digital agenda commissioner Neelie Kroes, the number of “digital jobs” in the EU is grow-ing by about 100 000 every year. Yet differ-ent studies forecast that the number of job vacancies will exceed the number of peo-ple able to fill those positions. This is due to a skills gap: the number of graduates with the required information communica-tions technology (ICT) skills is not keeping pace with the demand. Especially the low
numbers of students choosing technical studies creates a problem on the supply side for those Big Data jobs. More students should be encouraged to choose courses in technical and scientific subjects and math-ematics throughout all levels of education, beginning at the earliest possible age.240 As Figure 31 shows, the most important hard skills are subject matter expertise, data & technical skills, and math & statistics knowl-edge. Governments can play a key role in make these subjects more attractive to younger generations.
However, e-skills also require a lot of soft skills, like collaboration, problem solving and communication. These soft skills are needed for several reasons. Creativity and curiosity are needed to assess the pos-sibilities of a data set. Obviously, some-one working with data needs to have the technical capabilities to process the data. But to start processing the data, one has to have an idea what to do with the data. Which possibilities does the data set offer? Which insights can possible be created? This requires soft skills.
Still, the solution does not lie solely with the government. Businesses need to consider a short, medium and long term strategy to prevent falling behind and to stay competitive. A short-term way of us-ing data is to run professionally organ-ised hackathons where others prototype products or services with data provided by companies. A mid-term possibility is to invest in training for the staff in data sci-ence, management and engineering (but to recruit as well). A long-term strategy would be to build strong partnerships with communities who are working with young programmers to build a solid pipeline of technical talent.241
239 http://ec.europa.eu/eurostat/product?code=nama_nace10_c&language=en&mode=view240 https://bertmaes.wordpress.com/report-skills-shortage/ 241 http://www.yourreadybusiness.co.uk/open-data-bridging-the-digital-skills-gap/
“The solution does not lie solely with the government, businesses also need to take action.”

102
Figure 31 - Skills required to work with Big Data
8.2 Moving forward with Open DataThe potential value of Open Data for the EU28+ has been identified for the period 2016 – 2020. The total market size for Open Data is estimated at 325 bn EUR. In the same period, nearly 30,000 Open Data jobs can be created. Furthermore, poten-tially 1,705 million euro of costs savings can be reached in 2020 by the national governments of the EU28+. Also, several cost savings for society exist. Examples of lives and time saved as well as environmen-tal gains were discussed.
The potential of Open Data is tremendous. However, to realize this potential, the EU28+ countries have to move forward with Open Data. In 2015, it was established that 31% of the EU28+ countries were Trend Setters with regard to Open Data. Yet, still 25% are (Advanced) Beginners. Some countries do not even have a nation-al Open Data portal. To reach the potential of 325 bn EUR by 2020, the percentage of Trend Setters has to increase to 88%. Al-though all countries either implemented or are in the process of implementing the
revised PSI Directive, other accelerations are needed as well: increased portal us-ability, machine readable data, increase in the release of public data, etc. In the pre-vious section, several recommendations were already mentioned. Also, training and support should be offered within the EU28+ countries to accompany civil serv-ants in making the most out of Open Data. Furthermore, best practices between the countries need to be shared. That way, the full potential of Open Data can be reached.

Creating Value through Open DataStudy on the Impact of Re-use of Public Data Resources
103

104
Appendix I - AbbreviationsMaturity graph
Country Abbreviations (in alphabetical order)
AT Austria
BE Belgium
BG Bulgaria
CH Switzerland
CY Cyprus
CZ Czech Republic
DE Germany
DK Denmark
EE Estonia
EL Greece
ES Spain
FI Finland
FR France
HR Croatia
HU Hungary
IE Ireland
IT Italy
LI Liechtenstein
LT Lithuania
LU Luxembourg
LV Latvia
MT Malta
NL Netherlands
NO Norway
PL Poland
PT Portugal
RO Romania
SE Sweden
SI Slovenia
SK Slovakia
UK UnitedKingdom
I

105
Appendix II - Direct market sizeper EU28+ country
II
11,543
2,475
1,713
5,134
167
256
398
1,221
1,119
1,822
3,605
20
121
89
14
70
8,145
966
101
603
1,077
15,809
11,614
1,199
74
1,488
566
71
186
154
2,109
1,777
0 5,000 10,000 15,000 20,000
United Kingdom
Switzerland
Sweden
Spain
Slovenia
Slovakia
Romania
Portugal
Poland
Norway
Netherlands
Malta
Luxembourg
Lithuania
Liechtenstein
Latvia
Italy
Ireland
Iceland
Hungary
Greece
Germany
France
Finland
Estonia
Denmark
Czech Republic
Cyprus
Croatia
Bulgaria
Belgium
Austria
Millions
Direct market size per EU28+ country, 2020

106
■ Bouchoux (2014), ‘Refonder le droit à l’information publique à l’heure du numérique : un enjeu citoyen, une opportunité stratégique (Rapport)’. Online available at: http://www.senat.fr/notice-rapport/2013/r13-589-1-notice.html
■ Bürgi-Schmelz, A. (2013), ‘Wirtschaftliche Auswirkungen von Open Government Data’. Online available at: http://www.egovernment.ch/umsetzung/00881/00883/01114/index.html?lang=de&download=NHzLpZeg-7t,lnp6I0NTU042l2Z6ln1acy4Zn4Z2qZpnO2Yuq2Z6gpJCDdYF2fmym162epYbg2c_JjKbNoKSn6A--
■ Capgemini (2013), ‘The Open Data Economy. Unlocking Economic Value by Opening Government and Public Data’. Online available at: https://www.capgemini-consulting.com/resource-file-access/resource/pdf/open-data_pov_6feb.pdf
■ Capgemini Research (2015), Information that was obtained by doing own analysis.
■ Cedefop (2010), ’ Skills supply and demand in Europe - Medium-term for cast up to 2020’ Luxembourg: Publications Office of the European Union, 2010. Online available at: http://www.cedefop.europa.eu/files/3052_en.pdf
■ Datos.gob.es (2011), ‘Characterization Study of the Infomediary Sector’ Online available at: http://datos.gob.es/sites/default/files/files/aporta_infomediary%20sector_2011.pdf
■ Datos.gob.es (2012), ‘Characterization Study of the Infomediary Sector – 2012 Edition’ Online available at: http://datos.gob.es/sites/default/files/121001%20RED%20007%20Final%20Report_2012%20Edition_%20vF_en.pdf
■ Datos.gob.es (2014), ‘Characterization Study of the Infomediary Sector 2014’ Online available at: http://www.ontsi.red.es/ontsi/sites/default/files/executive_summary_public_infomediary_sector_2014.pdf
■ Dekkers, M. et al (MEPSIR) (2006), MEPSIR, Measuring European Public Sector Information Resources. Final Repport of the Study in the Exploitation of Public Sector Information- Benchmarking of EU Framework conditions. Online available at: http://ec.europa.eu/information_society/newsroom/cf/document.cfm?doc_id=1198
■ Deloitte (2013), Open Growth. Stimulating demand for open data in the UK, briefing note. Deloitte analytics. Online available at: https://www2.deloitte.com/content/dam/Deloitte/uk/Documents/deloitte-analytics/open-growth.pdf
■ DemosEurope & Warsaw Institute for Economic Studies (DemosEurope & WISE) (2014), ‘Big & Open Data in Europe. A Growth Engine or a missed opportunity’. Warsaw: DemosEurope. Online available at: http://www.wise-institute.org.pl/common/files_download.php?fid=4
■ European Commission (1998). ‘Public Sector Information: A Key Resource for Europe. Green Paper on Public Sector Information in the Information Society. COM(1998)585. Online available at: ftp://ftp.cordis.europa.eu/pub/econtent/docs/gp_en.pdf
List of references

Creating Value through Open DataStudy on the Impact of Re-use of Public Data Resources
107
■ European Commission (2009): ‘Re-use of Public Sector Information – Review of Directive 2003/98/EC’, (Com-munication from the Commission to the European Parliament, the Council, the European Economic and So-cial Committee and the Committee of the Regions), COM(2009) 212 final. Online available at: http://eur-lex.europa.eu/legal-content/EN/TXT/PDF/?uri=CELEX:52009DC0212&from=EN
■ European Commission (2010). Communication from the Commission to the European Parliament, the Council, the European Economic and Social Committee and the Committee of the Regions A Digital Agenda for Europe. COM/2010/0245 final. Online available at: http://eur-lex.europa.eu/legal-content/EN/TXT/PDF/?uri=CELEX:52010DC0245&from=EN
■ European Commission (2011a). ‘Communication to the European Parliament, the Council, the European Eco-nomic and Social Committee and the Committee of the Regions. Open Data: An engine for innovation, growth and transparent governance’. Online available: http://ec.europa.eu/information_society/policy/psi/docs/pdfs/opendata2012/open_data_communication/en.pdf
■ European Commission (2011b). Proposal for a Directive of the European Aprliament and of the Council Amnd-ing Directive 2003/98/EC on the re-use of public sector information. COM/2011/0877 final – 2011/0430/COD). Online available at: http://eur-lex.europa.eu/legal-content/EN/TXT/PDF/?uri=CELEX:52011PC0877&from=EN
■ European Commission (2011c): Commission Decision of 12 December 2011 on the re-use of Commission docu-ments, (Official Journal of the European Union), 2011/833/EU. Online available at: http://eur-lex.europa.eu/legal-content/EN/TXT/PDF/?uri=CELEX:32011D0833&from=EN
■ Genova, F., Hanahoe, H.,Laaksonen, L., Morais-Pires, C.,Wittenberg, P., Woods, J. (Genova, F. et al) (2014), ‘The Data Harvest. How sharing research data can yield knowledge, jobs and growth. A special Report by RDA Europe’. European Union: RDA Europe. Online available at: http://europe.rd-alliance.org/sites/default/files/report/TheDataHarvestReport_%20Final.pdf
■ Granickas, K.(2013), ‘Understanding the Impact of Releasing and re-Using Open Government Data’. ePSI Platform Topic Report No. 2013/08, August 2013. Online available at: http://www.epsiplatform.eu/sites/ default/files/2013-08-Open_Data_Impact.pdf
■ HOMER (2013), ‘Harmonising Open Data in the Mediterranean through better access and Re-use of Public Sector Information. Socio-Economic Impact Study’. Final Report March 2013. Online available at: http://homerproject.eu/docs/Homer_Socioeconomic_Study_FV3.pdf
■ Houghton, J. (2011), ‘Costs and Benefits of Data Provision. Report to the Australian National Data Service’. Centre for Strategic Economic Studies, Victoria University: September 2011. Online available at: http://ands.org.au/resource/houghton-cost-benefit-study.pdf
■ Janssen, K. (2012), ‘Open Government Data and the Right to Information: Opportunities and Obstacles’, in: CI, The Journal of Community Informatics, Vol. 8, No. 2 (2012). Online available at: http://ci-journal.net/index.php/ciej/article/view/952/954
■ Jetzek, T., Avital, M., Bjørn-Andersen, N.(Jetzek et al.) (2013a), ‘Generating Value from Open Government Data’. Completed Research Paper for Thirty First International Conference on Information Systems, Milan 2013. Online available at: http://www.researchgate.net/profile/Thorhildur_Jetzek/publication/259501249_Generating_Value_from_Open_Government_Data/links/0046352c535fb81d99000000.pdf

108
■ Jetzek, T., Avital, M., Bjørn-Andersen, N.(Jetzek et al.) (2013b) ‘Data-Driven Innovation through Open Government Data’ Online available at: http://www.scielo.cl/pdf/jtaer/v9n2/art08.pdf
■ Jetzek, T., Avital, M., Bjørn-Andersen, N. (Jetzek et al.) (2014) ‘Generating Sustainable Value from Open Data in a Sharing Society’ International Federation for Information Processing 2014. Online available at: http://www.researchgate.net/profile/Thorhildur_Jetzek/publication/260930555_Generating_Sustainable_Value_from_Open_Data_in_a_Sharing_Society/links/0deec539983ac5a598000000.pdf
■ Koski, H. (2011), ‘Does Marginal Cost Pricing of Public Sector Information Spur Firm Growth?’. Helsinki: Etla, the Research Institute of the FinnishEconomy. Online available at: https://www.etla.fi/wp-content/up-loads/2012/09/dp1260.pdf
■ Koski, H. (2015), ‘The impact of Open Data – a preliminary study’. Helsinki: Ministry of Finance publications 15b/2015. Online available at: http://vm.fi/documents/10623/1107406/The+Impact+of+Open+Data/1c432b3a-a5e8-41ea-a5ea-135280a69ea3?version=1.0
■ Lateral Economics & Omidyar Network (2014), ‘Open for Business. How Open Data can Help Achieve the G20 Growth Target’, June 2014. Available online: http://www.omidyar.com/sites/default/files/file_archive/insights/ON%20Report_061114_FNL.pdf
■ Mayo, M., Steinberg, T. (2007) ‘The Power of Information: An independent review’. Online available at: http://webarchive.nationalarchives.gov.uk/20100413152047/http://www.cabinetoffice.gov.uk/media/cabinetof-fice/strategy/assets/power_information.pdf
■ McKinsey (2013), ‘Open Data: unlocking innovation and performance with liquid information’. MIG. Online avail-able at: http://www.mckinsey.com/~/media/McKinsey/dotcom/Insights/Business%20Technology/Open%20data%20Unlocking%20innovation%20and%20performance%20with%20liquid%20information/MGI_Open-Data_Full_report_Oct2013.ashx
■ Newbery, D., L. Bently & R. Pollock (Newberry et al.)(2008). ‘Models of Public Sector Information Provision via Trading Funds’ February 26, 2008. Online available at: http://ec.europa.eu/newsroom/dae/docu-ment.cfm?doc_id=9383
■ Netherlands Institute for Safety (Nibra) (2009), ‘Consumer fire safety: European statistics and potential fire safety measures’ Online available at: http://www.verbraucherrat.at/content/01-news/05-archiv-2009-2010/01-studie-brandschutz/firesafetyconsumer.pdf
■ OECD (2006), Digital broadband content: Public Sector Information and Content. Paris: Directorate for Science, Technology and Industry. Online available at: http://www.oecd.org/sti/36481524.pdf
■ Pénin, J. et al. (2011). ‘The re-use of public sector information: an optimal pricing model’, Executive Summary. Paris:BETA. Online available at: http://www.economie.gouv.fr/files/files/directions_services/apie/ onglet-donnees-et-images/textes-et-temoignages/Executive_Summary_rapport_BETA_EN.pdf
■ Pettifer, R. (2011). PSI in European Meteorology – an Unfulfilled Potential’ Online available at: http:// www.primet.org/documents-mainmenu-29/424-psi-in-european-meteorology-an-unfulfilled-potential
■ PIRA International (2000). ‘Commercial exploitation of Europe’s Public Sector Informatin’. Surrey: eContent Spice. Online available at: http://ec.europa.eu/information_society/newsroom/cf/document.cfm?doc_id=1196

Creating Value through Open DataStudy on the Impact of Re-use of Public Data Resources
109
■ Pollock, R. (2009), ‘The Economics of Public Sector Information’. University of Cambridge, Cambridge: December 2, 2008. Online available at: http://www.econ.cam.ac.uk/research/repec/cam/pdf/cwpe0920.pdf
■ SerdaLAB (2010) ‘L’information électronique professionnelle en France : Le marché et les tendances en 2009-2010’ Paris: 2010. Online available at: http://www.serdalab.com/Medias/Communiqu%C3%A9s%20de%20presse/CP_IEP2010.pdf
■ Shakespeare, S. (2013) ‘An Independent Review of Public Sector Information’ Londen: May, 2013. Online available at: https://www.gov.uk/government/uploads/system/uploads/attachment_data/file/198752/13-744-shakespeare-review-of-public-sector-information.pdf
■ Swärdh, J. (2009) ‘Commuting Time Choice and the Value of Travel Time’ Örebro University. Online available at: http://www.diva-portal.org/smash/get/diva2:278104/FULLTEXT02.pdf
■ The Danish Government (2012),’Good and basic data for everyone- A Driver for growth and efficiency. The eGovernment Strategy 2011-2015’. Kopenhagen: The Danish Government/Local Government Denmark, October 2012. Online available at: http://www.fm.dk/publications/2012/good-basic-data-for-everyone/~/ media/Publikationer/Imported/2012/Gode%20grunddata%20til%20alle/BasicData_UK_web_2012.10.08.ashx
■ Trojette, M.A. (2013), ‘Rapport au Premier Ministre. Ouverture des données publiques. Les Exceptions au princi-pe de gratuité sont-elles toutes légitimes?’ Online available at: http://www.enssib.fr/bibliotheque-numerique/documents/62205-ouverture-des-donnees-publiques-les-exceptions-au-principe-de-gratuite-sont-elles-toutes-legitimes.pdf
■ Uhlir, P.F. (2009), The Socioeconomic Effects of Public Sector Information on Digital Networks: Towards a Better Understanding of Different Access and Re-use Policies. Workshop Summary. Online available at: http://www.nap.edu/download.php?record_id=12687
■ United Nations (2014), E-Government Survey 2014. Available online at: http://unpan3.un.org/egovkb/ Portals/egovkb/Documents/un/2014-Survey/E-Gov_Complete_Survey-2014.pdf
■ Vickery, G. (2011), ‘Review of recent Studies on PSI re-Use and related market developments’. Paris: Information Economics. Online available at: http://ec.europa.eu/information_society/newsroom/cf/document.cfm?doc_id=1093
■ Vries, M. de et al. (2011), ‘POPSIS, Pricing of Public Sector Information Study. Models of Supply and Charging for Public Sector Information (ABC)’. Luxembourg: European Commission DG INFSO. Online available at: http://ec.europa.eu/information_society/newsroom/cf/dae/document.cfm?doc_id=1158
■ Weiss, P. (2002). ‘Borders in Cyberspace: Conflicting Public Sector Information Policies and their Economic Impacts’. Online available at: http://www.nws.noaa.gov/sp/Borders_report.pdf
■ Worldbank (2014). ‘Worldbank: Open Data for Economic Growth’. Transport and ICT Global Practice. Online available at: http://www.worldbank.org/content/dam/Worldbank/document/Open-Data- for-Economic-Growth.pdf

110
Figure 1 Total market size (high bound), split in direct and indirect size for EU28+in billions, 2016-2020 10Figure 2 Direct market size of Open Data per market sector for EU28+ in millions, 2020 11Figure 3 Boundaries of Open Data and Public Sector Information 22Figure 4 Open Data Value Chain 28Figure 5 Data Value Chain Archetypes 29Figure 6 Payments within the Data Value Chain 30Figure 7 PSI and public content domains 33Figure 8 Numbers of sectors to which the data is applicable as identified by Deloitte 35Figure 9 Presence of an Open Data Policy 43Figure 10 Open Data Readiness average EU28+ 44Figure 11 Portal Maturity average EU28+ 44Figure 12 EU28+Open Data Maturity Clusters 45Figure 13 Different calculation methods observed during literature review 56Figure 14 Overlap of domains summarized 57Figure 15 Benefits Logic for Open Data 61Figure 16 Houghton, formula for estimating cost-benefits 67Figure 17 Evolution of Open Data Maturity of EU28+ countries, 2005-2020 71Figure 18 Average growth of direct market size in EU28+, 2014-2020 71Figure 19 Average growth of direct market size in EU 28+ corrected for inflation, 2014-2020 71Figure 20 Direct market size of Open Data, 2015-2020 72Figure 21 Total market size (high bound), split in direct and indirect size for EU28+in billions, 2016-2020 73Figure 22 Forecasted increase in share of direct Open Data in EU 28+ GDP, 2016-2020 74Figure 23 Direct market size of Open Data per market sector for EU28+ in millions, 2020 75Figure 24 Total market size of Open Data per market sector for EU28+ in millions, 2020 75Figure 25 Forecasted total number of direct Open Data jobs (in persons) per annum, 2016-2020 78Figure 26 Total number of direct Open Data jobs per country, 2020 79Figure 27 Percentage growth of total number of direct Open Data jobs, 2016-2020 80Figure 28 Number of created direct Open Data jobs, 2016-2020 80Figure 29 Total number of created Open Data jobs, direct and indirect, 2016-2020 80Figure 30 Cost savings on government expenditure per EU 28+ country, 2020 84Figure 31 Skills required to work with Big Data 102
List of figures

Creating Value through Open DataStudy on the Impact of Re-use of Public Data Resources
111
Table 1 Overview introduction national Open Data portal 43Table 2 Factors of the Open Data Maturity Model 63Table 3 Growth percentage per maturity level 64Table 4 Overview number of countries per ODM classification (in %), 2005, 2010, 2015, 2020 70Table 5 Direct market size of Open Data in billions, 2016-2020 72Table 6 Estimated total market size of Open Data for EU28+ in billions, 2016-2020 73Table 7 Estimated indirect market size of Open Data for EU28+ in billions, 2016-2020 73Table 8 Forecasted share of direct Open Data in EU 28+ GDP, 2016-2020 74Table 9 Weighted factor of Open Data value per Eurostat sector 75
List of tables

European Commission
Creating Value through Open Data Study on the Impact of Re-use of Public Data Resources
2015 - 112 pages.Luxembourg, Publications Office of the European Union
ISBN 978-92-79-52791-3 DOI 10.2759/328101
© European Union, 2015. All rights reserved. Certain parts are licensed under conditions to the EU. Reproduction is authorised provided the source is acknowledged.